Submitted:
21 November 2024
Posted:
22 November 2024
You are already at the latest version
Abstract
Carbon brush/collector ring of hydro generator set will have phenomena such as firing and ablation during operation, which is due to the existence of various abnormal contact modes of the brush/ring during operation, thus changing the carbon brush/collector ring interface state. In order to analyze the effects of different contact modes on the performance of the brush/ring. In this paper, we construct the contact modes of air gap (loss of contact leads to the existence of a small gap between the two surfaces), direct contact (contact with abrasive particulate media), and surface porosity contact (contact when there is a large pit on the surface of the collector ring due to manufacturing quality defects and abnormal abrasion), and we analyze the effects of the various states on the core parameters such as current conduction, ring surface damage, and carbon brush abrasion, which provide a basis for the active suppression of the damage.
Keywords:
Operational contact state
; Current-carrying friction
; Arc
; temperature
1. Introduction
Carbon brush/collector ring systems are widely used in the excitation systems of large generators, such as hydroelectric generators, wind turbines, and electric vehicles, in which the two conduct current by means of sliding contact [1,2,3,4,5].
At present, China's in-service large and medium-sized hydro generators mostly adopt the rotating magnetic pole type structure to realize the excitation current delivery through the brushes (all using carbon brushes (carbon brushes)) and the collector ring contact surfaces sliding against each other, the system consists of carbon brushes, collector ring, fixing bracket and insulating parts, etc., and the carbon brushes are fixed to the brush holder through the spring clip of the brush grip to remain in contact with the surface of the collector ring under the action of the spring force and constitute the current-carrying friction system [6,7]. The brush/ring friction pair, as a typical sliding friction pair under high current and low contact pressure working conditions, faces a complex working environment [8].
The damage of the current-carrying friction interface is a kind of mechanical friction, electrical contact, and its concomitant (such as arc spark) coupling effect of damage, manifested as the coexistence of a variety of damage mechanisms [9,10,11]. Xu et al. [12] found that there is a large number of carbon powder buildup in the collector ring chamber of the rotary slurry hydro generator and the phenomenon of serious wear of carbon brushes in the routine maintenance, and through the on-site investigation and comprehensive analysis, we believe that the carbon brush abnormal abrasion is caused by the following factors It is believed that the abnormal wear of carbon brushes is caused by the arcing spark under high current, excessive spring force, wear of collector ring material and contact surface, poor concentricity of collector ring, and solidification of carbon powder on the friction surface under the environment of oil mist, etc. At the same time, due to the influence of machining precision and the installation process, the collector ring may be subjected to the phenomenon of eccentric pendulum vibration in the process of operation [13]. When the eccentric vibration of the collector ring occurs, a transient gap will be formed between the interface of the carbon brushes and the collector ring contact, which will lead to gap discharge, and then generate the arc phenomenon, resulting in ablation, leading to an increase in the temperature of the carbon brushes/collector ring system, and in severe cases, it may even lead to a collector ring fire, which in turn affects the safe operation of the unit [14,15,16].
The deep-rooted factor in the interaction and influence between the above typical failure phenomena is the strong performance coupling and damage coupling of the carbon brush/collector ring current-carrying friction system, and there is a close relationship with the friction interface characteristics under the combined effect of mechanical friction and electrical contact [17], and the damage at the carbon brush/collector ring interface is a symptom of this core problem. Friction and wear, thermal effects, and arcing phenomena in this system have a significant impact on its performance and lifetime [18,19,20].
To deeply understand this phenomenon, this paper carries out a detailed discussion of the three abnormal operational contact states as shown in Figure 1, including air contact, abraded carbon powder contact, and the contact behavior when there is a pore on the surface of the collector ring. Firstly, the temperature change and arc characteristics of the contact area in the case of air-gap contact are analyzed, and the study focuses on the changing state of the ring surface after ablation; secondly, the current-carrying friction characteristics of the collector ring in the presence of pores on the surface after air-gap ablation are experimentally investigated, and how factors such as the roughness of the ablated surface affect the current-carrying performance of the brush/ring system are explored. Finally, the current-carrying friction wear experiments were conducted for the case of carbon powder adhering to the surface of the collector ring, and the effects of different carbon powder coverage on the current-carrying friction performance were analyzed; these studies are aimed at providing a theoretical basis for the optimization of the design and operation of the collector ring, and to enhance the stability and reliability of the carbon brush/collector ring system under the complex working environment.
2. Materials and Methodology
2.1. Experimental Materials
In this article, the collector ring of the hydro generator set was selected as the research object, 45 steel was used as the material of the current-carrying parts, and D172 was selected as the current-carrying countermovement vice for the carbon brushes, and the chemical composition of 45 steel is shown in Table 1. The material was sandpapered to smooth the surface, and then immersed in deionized water for ultrasonic cleaning. The surface roughness was controlled to be 0.3μm, as shown in Figure 2.
2.1.1. Simulation of Toner Impurity Contact State
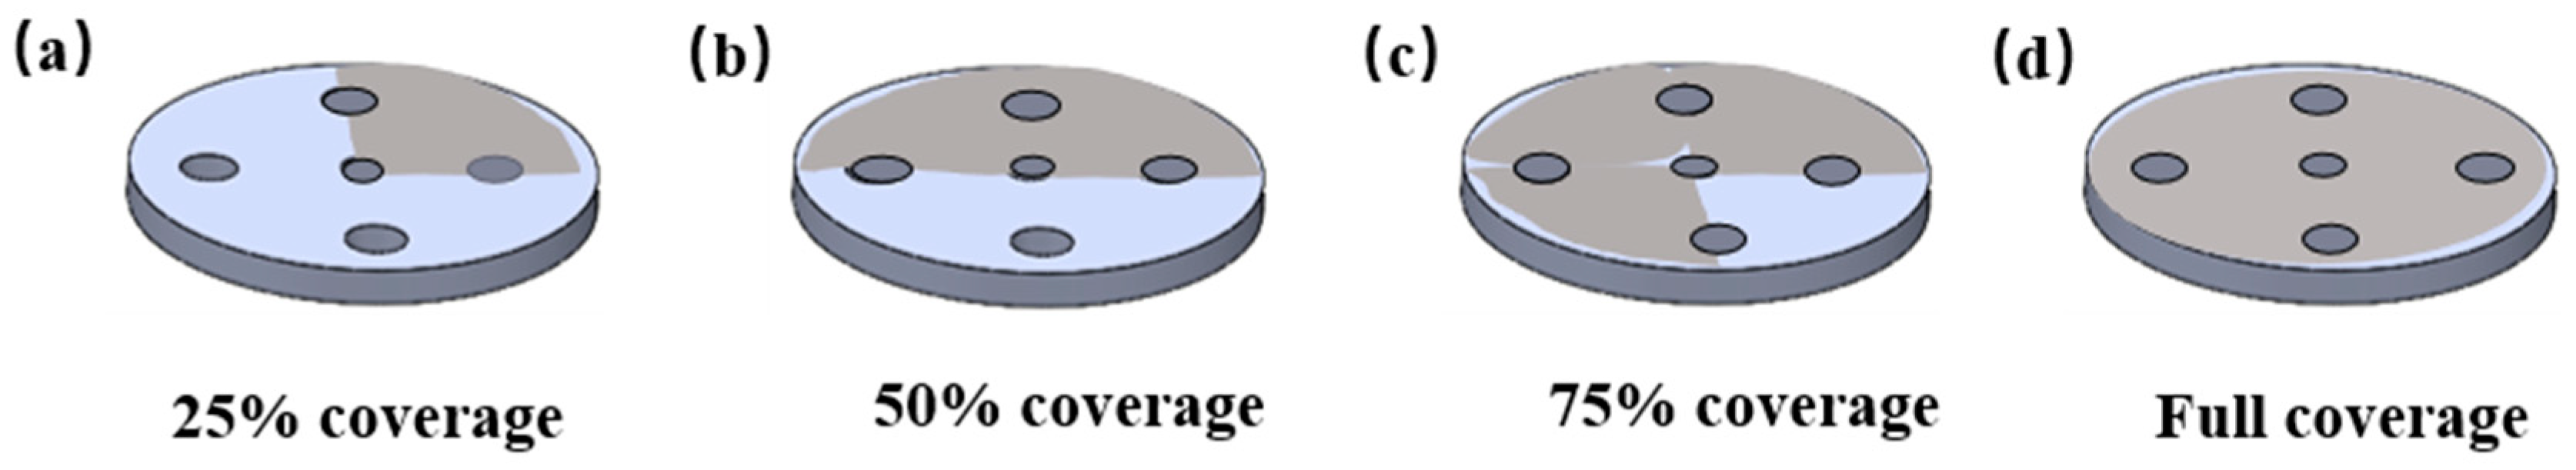
To simulate the contact of toner impurities, worn toner particles were mixed with alcohol. Using the equipment shown in Figure 2, the toner was sprayed onto the surface of the collector ring. The surface was then heated to rapidly evaporate the alcohol, ensuring that the evaporation process did not affect the performance of the collector ring itself. The adhesion strength of the coating was weak, but it effectively adhered to the collector ring surface, simulating the actual condition of toner adhesion during wear. The friction characteristics of the brush/ring under current-carrying action were analyzed for different coverage rates. Figure 4 shows the coverage area of the toner on the surface of the collector ring, including full coverage, 25% coverage, 50% coverage, and 75% coverage.
Figure 3.
Carbon powder coating production process.
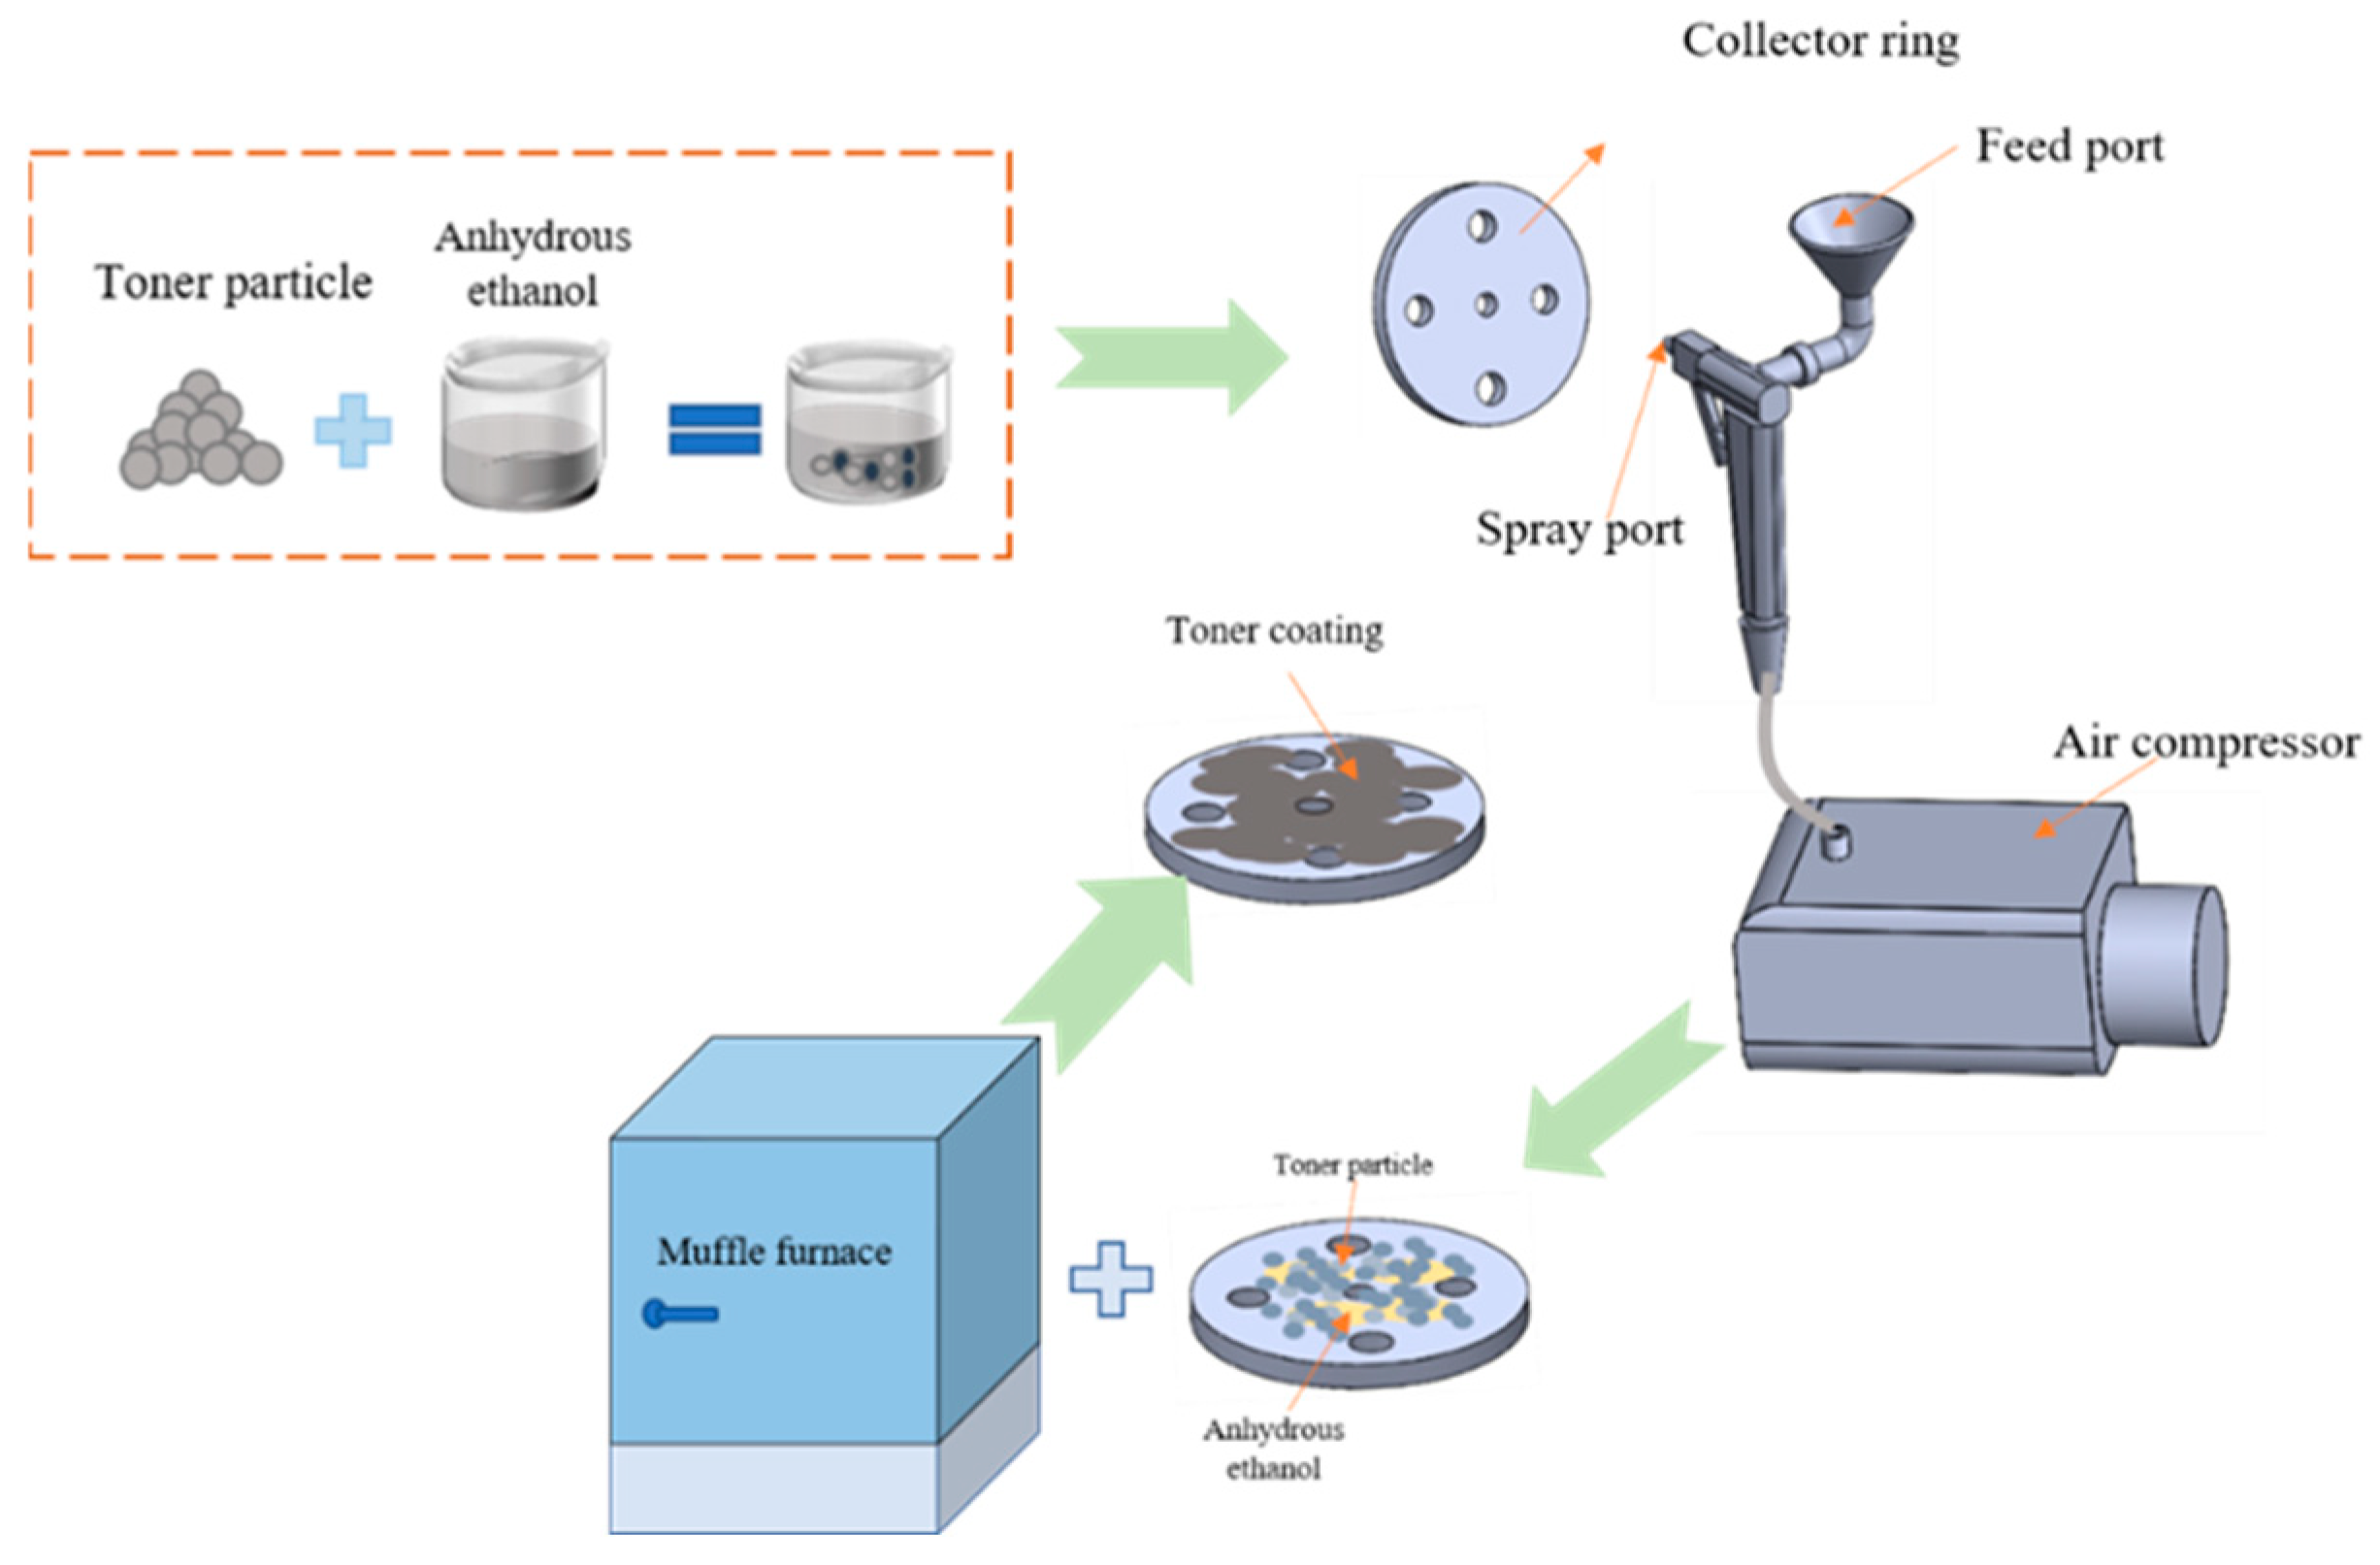
Figure 4.
Toner coverage area.
2.1.2. Simulating the Porous Contact State on the Ring Surface
In order to simulate the surface defects of the collector ring, the pores were fabricated on the surface of the collector ring by machining method, as shown in Figure 5. The pores were arranged at angles of 36°, 45°, 60° and 90° to investigate the effects of different pore arrangements on the temperature change and current-carrying friction properties in the contact region.
2.2. Current-Carrying Tribological Tests
The loaded friction characteristics were measured using a homemade pin disk loaded wear tester as shown in Figure 6. It is selected according to the actual operating occasions of the hydro generator. Real-time torque and pressure, current and voltage were measured during the test to calculate the friction coefficient and contact resistance. This experiment is carried out in an environment where the temperature and relative humidity variations are small enough not to have any significant effect on the results, and the current-carrying parameters are shown in Table 2.
2.3. Air Contact Experimental Platform
As shown in Figure 7 is the air gap test bench, using high-precision lifting platform to control the distance between the brush/ring, using voltage, ammeter to detect the real-time current and voltage during ignition, to calculate the arc power, and using the temperature test instrument to monitor the real-time temperature of the friction surface.
3. Results and Discussion
3.1. Air Gap Contact
In the actual operation process, due to the vibration of the hydro generator will occur the phenomenon of loss of contact, that is, the air gap contact state described in the article, this state of the current will break through the air and thus the phenomenon of arcing [21]. in order to explore the effect of arcing on the collector ring, control the brush/ring gap is unchanged, and analysed as shown in Table 3 for different current-carrying parameters and current-carrying polarity (referring to the carbon brushes connected to the positive and negative poles) under the temperature, arcing power on the surface of the collector ring are specifically investigated.
3.1.1. Change of Positive Electrode Temperature and Arc Power
Figure 8 shows the arc power and temperature change curve under different positive voltages and rotational speeds. Figure 8a shows the temperature change curve of different speeds at 10v, and the temperature is the highest at 200r/min. According to the arc power curve corresponding to 10v in Figure 8d, it is found that the maximum arc power is the same at different speeds, However, the corresponding discharge frequency is different under different speeds, and the temperature changes accordingly. The discharge frequency is the highest and the temperature is the highest at 200r/min. When the speed reaches 300r/min, the temperature in the air area is the lowest, because the discharge frequency is the least and the corresponding temperature is the lowest, and when the speed rises to 400r/min, the discharge frequency will rise, and the temperature will gradually rise. This means that as the frequency of arcing increases, so does the temperature.
Next, the changes in temperature and arc power under high-voltage conditions are analyzed to determine whether they exhibit patterns similar to those observed at low voltage. Figure 8b,e depict the temperature variation and arc power curves, respectively, at different rotational speeds under 20 V. The results show that the maximum temperature and arc power values at 20 V are significantly higher than those at low voltage, indicating the amplifying effect of high voltage on the discharge process. While the temperature variation follows a trend similar to that at low voltage, the temperature again reaches its minimum at a rotational speed of 300 r/min. This further highlights the moderating effect of rotational speed on temperature during spark discharge. However, the characteristics of arc generation frequency differ at higher rotational speeds. Specifically, the frequency of arc occurrences decreases significantly under high rotational speed conditions, but the duration of each arc discharge is prolonged. This suggests that at higher rotational speeds, although the arc discharge frequency is reduced, it does not diminish the resulting temperature changes. This phenomenon is likely attributed to the stability of the arc and the heat accumulation effect. The extended intervals between arc discharges at higher speeds may allow for more efficient heat buildup, contributing to the observed temperature rise. In summary, under high-voltage conditions, temperature and arc power not only increase in absolute magnitude but also display both similarities and differences in their dynamic behavior compared to the low-voltage case.
Figure 8c,f see that the maximum values of arc power and temperature increase further when the voltage is increased to 30v, which means that the energy density and temperature of the spark discharge are significantly enhanced at this voltage. When analyzing the temperature variation, the arc occurrence time and frequency will be reduced at high speeds, so the lowest point of temperature will occur at 300 r/min and 400 r/min speeds, but the absolute value will be higher than the case at low voltage and 20V, but due to the increase in energy input, each arc discharge will result in a higher instantaneous temperature.
Based on the above, it was found that the temperature at 300 r/min was the lowest value at 10V and 20V voltage when the carbon brushes were connected to the positive terminal. This phenomenon indicates that at low voltages, the rotational speed has a significant effect on the temperature characteristics of the discharge process. The effect of rotational speed on the frequency of arc discharge is still significant as the voltage increases, and the frequency of arc discharge decreases gradually at high rotational speeds so that the temperatures at 300 r/min and 400 r/min will be close to each other at 30V voltage. Figure 8g demonstrates the variation curve of the average temperature and Figure 8h presents the variation curve of the average arc power. From these two figures, it can be seen that the overall trend of arc power and temperature shows a gradual increase as the voltage increases. This indicates that the discharge process under high voltage conditions has a higher temperature and energy density. At a rotational speed of 300 r/min, both the arc discharge frequency and temperature reach the lowest point.
Figure 9 shows the temperature change of carbon brushes under different voltages, Figure 9 (a) shows the temperature change of carbon brushes under 10v voltage, the highest temperature of carbon brushes under 300r/min is lower, meanwhile, the voltage is gradually increased to 20v, 30v, it can be seen from Figure 9 b,c that the temperature becomes higher but with the same law, both of them have the lowest temperature under the rotational speed of 300r/min, which is opposite to the result of Fig. 8. . It is concluded that when the carbon brushes are connected to the positive pole, the temperature will be the highest at low voltage and low rotational speed, and the temperature decreases when the rotational speed reaches 300r/min, and the arc power frequency decreases. At high voltage and large rotational speed, the frequency of arc generation is close, the size is close and the maximum value of temperature is close.
3.1.2. Negative Temperature and Arc Power Variation
Figure 10 demonstrates the variation curves of arc power versus temperature for the negative electrode under different voltage and rotational speed conditions. Figure 10a shows the variation of temperature at different rotational speeds for a voltage of 10V. The results show that the maximum temperature is similar to that of the positive electrode condition, while the lowest temperature is found at 300 r/min rotational speed. 300 r/min rotational speed corresponds to the lowest frequency of arc discharge (Figure 10d). As the voltage increases, Figure 10b,c show that the maximum value of the temperature increases, but the effect of the rotational speed on the temperature is more limited and the overall temperature change remains insignificant. At the same time, the maximum temperature that can be achieved when the negative terminal is connected is significantly lower than that of the positive terminal condition. Further analyzing Figure 10e,f, it can be found that with the increase of voltage, the arc power shows an overall increasing trend, and the corresponding arc discharge frequency also increases gradually.
Figure 10g illustrates the average temperature variation curves under different voltage and rotational speed conditions, while Figure 10h shows the corresponding average arc power variation curves. The results indicate that at low voltages, the trends of temperature and arc power are similar to those observed under the positive electrode condition, At a rotational speed of 300 r/min, both the average temperature and arc power reach their minimum values. As the voltage increases, the influence of rotational speed on temperature becomes negligible, and temperature changes are no longer significant. This may be due to the lower frequency of arc discharges at this rotational speed, which reduces energy input and minimizes heat generation.
However, as the voltage increases, the trends in temperature and arc power change. While rotational speed remains a variable, its effect on temperature becomes nearly negligible at higher voltages, indicating that temperature is no longer significantly influenced by rotational speed. This suggests that at higher voltages, arc power, and heat generation are primarily determined by the voltage, while the influence of rotational speed weakens. This may be because higher voltages can substantially increase arc power and temperature, whereas variations in rotational speed have a lesser impact on these parameters.
Figure 11 shows the temperature changes of carbon brushes under different voltages. Figure 11a illustrates the temperature variation at 10 V, where the maximum temperature at 300 r/min is only 49.77°C, the lowest observed value. As the voltage gradually increases to 20 V and 30 V, Figure 11b,c show that the overall temperature is not significantly affected by the higher rotational speeds.
In general, at higher voltages, the temperature when the negative terminal is connected is always lower than when the positive terminal is connected. When the carbon brushes are connected to the positive terminal, the temperature is highest at low speeds and decreases significantly as the speed increases to 300 r/min, accompanied by a decrease in arc discharge frequency. However, when the speed is further increased to 400 r/min, the discharge frequency rises, and the temperature increases slightly. In contrast, when the carbon brushes are connected to the negative terminal, the firing frequency increases significantly with increasing voltage, but the effect of rotational speed on the firing frequency becomes smaller as the voltage increases. The influence of rotational speed on temperature change is also more limited under these conditions.
3.1.3. Ablation Surface and Mechanism Analysis
Figure 12 demonstrates the morphology of the brush/ring ablation surface when the carbon brush is connected to the positive electrode at different voltages and rotational speeds. At 10 V, there are almost no ablation marks on the ring surface, as shown in Figure 12a, and only a few ablation spots appear at 200r/min rotational speed. Further observing Figure 12b,c, when the rotational speed is increased, the ablation marks are almost invisible. As the voltage increases to 20 V, obvious flaky ablation marks appear on the ring surface, and Figure 12d–f demonstrate this change. However, it can be seen from the figures that the rotational speed has less effect on the ablation marks and the degree of ablation is mainly affected by the voltage. At 30 V, as shown in Figure 12g–i, a large area of ablation appears on the ring surface, indicating that higher voltages significantly exacerbate the ablation phenomenon. Nonetheless, at 300 r/min rotational speed, the ablation traces are instead lighter, which is consistent with the above trend of temperature and frequency of arc occurrence, indicating that lower rotational speed helps to reduce the degree of ablation.
Figure 13 demonstrates the ablation morphology of the corresponding ring surface of the negative electrode under different operating parameters. Unlike the flaky ablation traces produced by the positive electrode, the surface of the negative electrode ring mostly shows pitting ablation pits. At 10V, only a small number of ablation pits appeared on the ring surface, as shown in Figure 13a. Further observation of Figure 13b,c shows that the ablation traces almost disappeared when the rotational speed increased. As the voltage increases to 20V, obvious pitting ablation marks appear on the ring surface, and Figure 13d–f demonstrate this change. However, it can be seen from the figure that the rotational speed has less effect on the ablation marks and the degree of ablation is mainly affected by the voltage. At a voltage of 30V, Figure 13g–i shows a large number of pitting ablation traces on the ring surface.
To further explore the effects of polarity and voltage on ablation, the ablation morphology of the carbon brush surface was analyzed under different operating conditions. A rotational speed of 200 r/min was selected to study the ablation areas under various polarities and voltages (Figure 14). Figure 14a shows that when the carbon brush is connected to the positive terminal, the main area of ablation is concentrated in the center, while the edges show relatively light ablation. In contrast, when the carbon brush is connected to the negative terminal, the center appears relatively smooth, but significant ablation occurs at the edges. As the voltage increases, Figure 14b shows that at 20 V, large ablation areas appear on the carbon brush, with the most severe ablation occurring at the center. This suggests that the concentration of current at the positive terminal leads to a higher energy density in the center region, causing more severe ablation. When the carbon brush is connected to the negative electrode, as shown in Figure 14e, the ablation is more severe than at 10 V, indicating that the discharge effect of the negative electrode becomes more significant at higher voltages. Figure 14c shows the ablation of the positive carbon brush at 30 V. With further voltage increase, the depth and area of the ablation pits enlarge significantly, even leading to the phenomenon of the carbon brush being shattered by electric sparks, with almost no intact surface remaining. When the carbon brush is connected to the negative terminal, the entire carbon brush experiences severe ablation, as shown in Figure 14f. This contrasts with the concentrated discharge pattern at the positive terminal, while the discharge at the negative terminal exhibits a more scattered characteristic. Overall, voltage and polarity have a significant impact on the ablation pattern of the carbon brushes, with more centralized ablation at the positive connection and more extensive marginal ablation at the negative connection.
In exploring the causes of the temperature variations and ablation conditions at the positive and negative electrodes in the brush/ring system, an operating parameter of 200 r/min and 30 V was chosen to observe its effect on arc characteristics and temperature distribution. Under this operating condition, Figure 15a shows the sparking condition of the positive electrode in the air gap operating mode. It is observed that the positive electrode spark is concentrated and blue, indicating a high operating temperature, likely due to the intensity and energy concentration of the spark. Blue sparks are typically associated with high temperatures, suggesting that the positive electrode reaches a higher temperature. In contrast, Figure 15b shows the operation of the negative electrode. Despite the larger size of the negative electrode sparks, their dispersion is significant, indicating a broader distribution of spark energy. This dispersion suggests that the surface temperature of the negative electrode is lower, allowing for more effective heat dissipation.
By comparing the spark characteristics of the positive and negative electrodes, the temperature change mechanism of the two can be analyzed, which is corresponding to the above conclusion. The positive electrode, due to its concentrated spark and higher current density, leads to an increase in temperature, so the ablation is mainly concentrated in the middle part, showing flake ablation; while the negative electrode, due to the dispersal of spark and relatively low current density, maintains a lower temperature, the carbon brushes are ablated at the edge position, and the ring surface is pitted with pitting ablation craters.
Figure 16 illustrates the cause of the phenomenon described above. When the carbon brush is connected to the negative terminal, the carbon brush emits electrons to the positive ring specimen. The gas particles formed in the high-temperature environment are drawn toward the ring under the arc force. The high-speed rotation of the ring imparts tangential velocity to the gas particles, and the centrifugal force causes them to be ejected. The trajectory of this ejection forms the observed streamlines. At the same time, the high-temperature gas particles rapidly cool upon contact with the surrounding air, causing them to burst and generate a spark. This results in spark discharge along the tangential direction of rotation, while the ablation location on the ring surface appears black, indicating the attachment of carbon powder, as shown in Figure 16a.When the carbon brushes are connected to the positive terminal, the ring surface emits electrons to the carbon brushes, causing the breakdown of the gap gas and the formation of a current. Since the area of the ring specimen that emits electrons is much larger than the area of the carbon brush specimen that receives electrons, and the carbon brush remains relatively stationary, the arc force pushes the discharge particles toward the ring specimen continuously. These particles accumulate at the contact point's gap, generating a strong high-temperature arc discharge, as shown in Figure 16b.
3.2. Toner Impurity Exposure
Literature [22] pointed out that after a comprehensive inspection of units with high carbon brush temperatures and firing defects, it was found that these issues were primarily caused by factors such as significant carbon powder accumulation on the slip ring surface, and defects on the collector ring surface. Therefore, further investigation is needed to explore the impact of carbon powder adhesion coverage on the interface temperature and current-carrying performance of carbon brushes and collector rings.
3.2.1. Variation of Temperature and Contact Resistance at Different Coverage Areas
The trend of temperature versus current-carrying performance for different toner coverage levels is shown in Figure 17. Figure 17a presents the dynamic temperature variation curve. Overall, the interface temperature is significantly higher than that of the original sample once carbon powder adheres to the surface of the collector ring. The temperature variation for the pristine sample shows a stable upward trend; however, with carbon powder attachment, the temperature fluctuations are more pronounced. These fluctuations, seen in different coverage rates, are primarily due to changes in contact resistance and local current density (Figure 17c). When the toner coverage is 25%, the toner forms a discontinuous distribution at the contact interface, which increases the current density in localized areas. This results in localized overheating as current passes through, causing significant temperature fluctuations. As the coverage increases, the toner gradually covers more of the contact surface, the interface resistance becomes more uniform, and the current path distribution becomes more even, thereby reducing temperature fluctuations. When the carbon powder coverage reaches 100%, the contact surface impedance stabilizes, temperature fluctuations are significantly reduced, and the temperature variation pattern approaches that of the original sample. Figure 17b further illustrates that with increasing toner coverage, the interface temperature gradually decreases. When the toner coverage reaches 100%, the temperature is nearly identical to that of the original sample.
Figure 17c shows the contact resistance change When carbon powder adheres to the surface of the collector ring, it forms an additional contact layer between the carbon brush and the collector ring. Since the conductivity of the carbon powder is lower than that of the metal collector ring, the presence of the carbon powder increases the contact resistance between the brush/ring, resulting in a greater conversion of electrical energy into thermal energy, which increases the temperature, corresponding to the above temperature variation rule. Figure 17d shows that as the amount of attached carbon powder increases from 25% to 100%, the contact resistance still rises, which is because the carbon powder on the contact surface forms a non-uniform conductive channel, which generates a larger current density in the local area, causing a higher local heating effect. Specifically, a reduction in the amount of attached toner not only does not completely reduce the heat but instead, as the distribution of toner becomes uneven, the electrical contact impedance increases in some localized areas, resulting in enhanced localized heating. Such localized areas of high temperature may be more significant and instead lead to a further increase in overall temperature.
When the toner completely covers the contact surface, the contact resistance stabilizes, and the heat is evenly distributed across the interface. However, when the toner coverage is reduced (e.g., to 25%), the contact interface becomes uneven, and the current density in localized areas increases significantly. In these "hot spots," the current encounters higher resistance, and the heat generated becomes more concentrated, causing the temperature to rise. The uneven distribution of toner leads to non-uniform contact resistance, causing the current to concentrate in fewer conductive channels. This results in a more pronounced localized heating effect. As a result, even with reduced toner coverage, the temperature increases more than it would with complete coverage.
3.2.2. Variation of Friction Coefficients at Different Coverage Areas
Figure 18a,b show that the overall trend of the brush/ring friction coefficients under different coverage is not obvious, but they are all lower than the original samples. This may be because the attachment of carbon powder forms a lubricating layer on the interface, which reduces the direct contact area between the carbon brushes and the collector ring, thus reducing the friction.
3.3. Collector Ring Surface Pore Contact
Defects on the surface of the collector ring can lead to issues such as overheating, increased contact resistance, and abnormal wear of the carbon brushes. In this study, collector ring samples with different pore arrangements were simulated through mechanical processing. The pore angles were set at 36°, 45°, 60°, and 90° to investigate the effects of these different pore arrangements on the temperature changes and current-carrying friction performance of the collector ring.
3.3.1. Variation of Pore Temperature and Contact Resistance with Different Arrangements
Figure 19 illustrates the variations in overall temperature and contact resistance of the brush/ring interface for different pore arrangements. As shown in Figure 19a,b, the temperature values of samples with pores consistently remained above or below the temperature range of the original samples. However, the stability of temperature fluctuations was significantly influenced by pore density. Higher pore densities resulted in larger temperature fluctuations, indicating greater instability.In particular, the 36° pore arrangement exhibited the most pronounced thermal effects during the friction process, as evidenced by the significant temperature fluctuations. This localized overheating not only accelerates wear but also increases the risk of material degradation and failure. Conversely, the 90° pore arrangement effectively mitigated overheating issues due to a more uniform friction distribution and slower temperature rise, resulting in improved thermal stability.
The presence of pores significantly increases the contact resistance between the brush and the ring, as shown in Figure 19d. The reduced actual contact area due to the pores leads to an increase in local current density, thereby elevating the contact resistance. Over time, as friction wear progresses, the pores become filled with carbon powder, resulting in a stabilization of the contact resistance.Samples with lower pore densities fill with carbon powder more quickly, allowing them to achieve stable operating conditions faster. Consequently, the contact resistance in these samples stabilizes more readily, as illustrated in Figure 19c.
The overall variation in brush/ring friction coefficients for different pore arrangements is shown in Figure 20. As depicted in Figure 20a, the friction coefficients for all pore configurations are higher than those of the original samples. Although the variations in friction coefficients across different pore arrangements are relatively small, the presence of pores significantly increases the wear rate. Notably, the 36° pore arrangement exhibits a markedly higher wear rate compared to other configurations. This is attributed to the higher pore density, which causes uneven distribution of contact pressure and increased friction at localized contact points, thereby intensifying localized wear. Conversely, the 90° pore arrangement results in the lowest wear rate, as shown in Figure 20b. The presence of pore regions reduces the effective contact area, causing the previously uniform contact force to become concentrated in localized regions. These pore areas experience intensified frictional wear during the contact process. However, as the carbon powder gradually fills the pores, the wear rate stabilizes. In the 90° arrangement, the pores fill more quickly, reducing subsequent wear on the carbon brushes. Consequently, this arrangement results in a lower overall wear rate compared to the original samples.
4. Conclusions
In hydroelectric generators, the performance and lifespan of the collector ring system are heavily influenced by the contact conditions between the brushes and rings. Various abnormal contact modes can result in damage such as burning, corrosion, and accelerated wear. This study investigates the effects of different contact modes on the performance of the brush/ring system, with a focus on air gap contact, carbon powder impurity contact, and surface pore contact conditions. The findings are summarized as follows:
(1) Air Gap Contact Condition: When the carbon brush is connected to the positive electrode, sparks are concentrated, leading to a significant temperature rise and more severe ablation of the carbon brush. The temperature is observed to be lowest at intermediate rotational speeds. In contrast, when the carbon brush is connected to the negative electrode, sparks are more dispersed, resulting in a lower overall temperature compared to the positive electrode. Additionally, the rotational speed has minimal impact on the temperature in the negative electrode configuration.
(2)The addition of carbon powder effectively reduces the friction coefficient and wear rate; however, it also increases the contact resistance, resulting in a significant rise in temperature. This effect is particularly pronounced when the carbon powder covers only a small area, leading to more pronounced fluctuations in contact resistance and temperature. Under such conditions, it becomes challenging for the brush/ring system to achieve a stable operating state.
(3) The arrangement of pores significantly influences the wear, contact resistance, and temperature of the collector ring. Higher pore densities result in increased wear rates, greater contact resistance, and more pronounced temperature fluctuations, ultimately reducing system stability. A 90° pore arrangement is more favorable as it helps reduce the wear rate and allows the temperature and contact resistance to stabilize more quickly.
References
- Farfan-Cabrera, Leonardo Israel. "Tribology of electric vehicles: A review of critical components, current state and future improvement trends." Tribology International 138 (2019): 473-486. [CrossRef]
- Kaneko, Satoru, et al. "Lubrication characteristics of electric sliding contacts consisting of rotating circular grooved disk and stationary rider with spherical surface under lubricated condition." Journal of Tribology 138.1 (2016): 011705. [CrossRef]
- Poljanec, Dejan, Mitjan Kalin, and Ludvik Kumar. "Influence of contact parameters on the tribological behaviour of various graphite/graphite sliding electrical contacts." Wear 406 (2018): 75-83. [CrossRef]
- Zhou N, Zhi X, Zhang J, et al. Research Progress on friction and wear performance of pantograph catenary system in electrified railway[J]. J. Southwest Jiaotong Univ, 2022: 1-17.
- Hui, Y., et al. "Current carrying friction and wear research status and prospects." Mater. Guide 33 (2019): 2272-2280.
- Ueno, Takahiro, et al. "Relationship between Contact Voltage Drop and Frictional Coefficient under High-current Sliding Contact." IEEJ transactions on electrical and electronic engineering 5.4 (2010): 486-492. [CrossRef]
- Wei, P.; Wang, X.; Jing, G.; Li, F.; Bai, P.; Tian, Y. Research Progress on Current-Carrying Friction with High Stability and Excellent Tribological Behavior. Lubricants 2024, 12, 349. [Google Scholar] [CrossRef]
- Hui Yang, LIU Guimin, Yan Tao, et al. Current status and Prospect of current-carrying friction and wear [J]. Materials Review,2019,33(13):2272-2280.
- Chen G X, Yang H J, Zhang W H, et al. Experimental study on arc ablation occurring in a contact strip rubbing against a contact wire with electrical current[J]. Tribology International, 2013, 61(3): 88-94. [CrossRef]
- Hessler V P. Electrical brush wear[J]. Electrical Engineering, 1935(10): 1050-1054. [CrossRef]
- Zhao Weicheng. Research on wear mechanism and loss Reduction Strategy of generator motor brush [D]. Dalian: Dalian University of Technology, 2016.
- Xu Qingbiao, XIONG Rong, Liu Rui et al. Wear analysis and treatment of carbon brush and slip ring of Hydrogenerator [J]. Hydropower and New energy, 2017 (8) : 63-65.
- Zhao, nze, et al. "Analysis of contact characteristics of carbon brush/slip ring under eccentric oscillation of hydrogenerator rotor." Shock and Vibration 2021.1 (2021): 2689960. [CrossRef]
- Zhu Wenwu, Yang Tao. Discussion on the Causes of Unipolar damage of collector ring [J]. Electrical Switches,2018,56(02):1-2+8.
- Zhao Xinze, Chen Ming, Nie Yunfeng, et al. Experimental study on interfacial gap discharge of carbon brush/collector ring in hydrogenerator [J]. Journal of Hydroelectric Energy,2022,40(12):169-172.
- Ding Tao, Chen Guangxiong, Bu Jun, et al. Research on Mechanism of Different Discharge Phenomena in Current-Carrying Friction and Wear [J]. China Railway Science,2009,30(05):83-87.
- Zhang Yongzhen, Yang Zhenghai, Shangguanbao. Research status and challenges of current-carrying friction [J]. Journal of Nature, 2014,36 (4): 256-262.
- He, Feng, Guoxin **e, and Jianbin Luo. "Electrical bearing failures in electric vehicles." Friction 8 (2020): 4-28. [CrossRef]
- Li, Shuaibing, et al. "Progress on current-carry friction and wear: an overview from measurements to mechanism." Coatings 12.9 (2022): 1345. [CrossRef]
- Wei, Peng, et al. "Research Progress on Current-Carrying Friction with High Stability and Excellent Tribological Behavior." Lubricants 12.10 (2024): 349. [CrossRef]
- Zhao Yanxia, LIU Jingchao, SUN Lemin, et al. Research status and trend of arc erosion in current-carrying friction and wear [J]. Lubrication & Seals, 2010, 35(08):111-113.
- Shan Wenjian. Analysis and treatment of High carbon brush temperature and ignition of large hydro-generator [J]. Hydropower and New Energy, 2021, 35(03): 47-49.
Figure 1.
Brush/ring contact state during actual operation: (a) Normal operation of collector ring; (b) Air gap contact state; (c) Carbon powder impurity contact state; (d) Collector ring surface pore contact.
Figure 1.
Brush/ring contact state during actual operation: (a) Normal operation of collector ring; (b) Air gap contact state; (c) Carbon powder impurity contact state; (d) Collector ring surface pore contact.
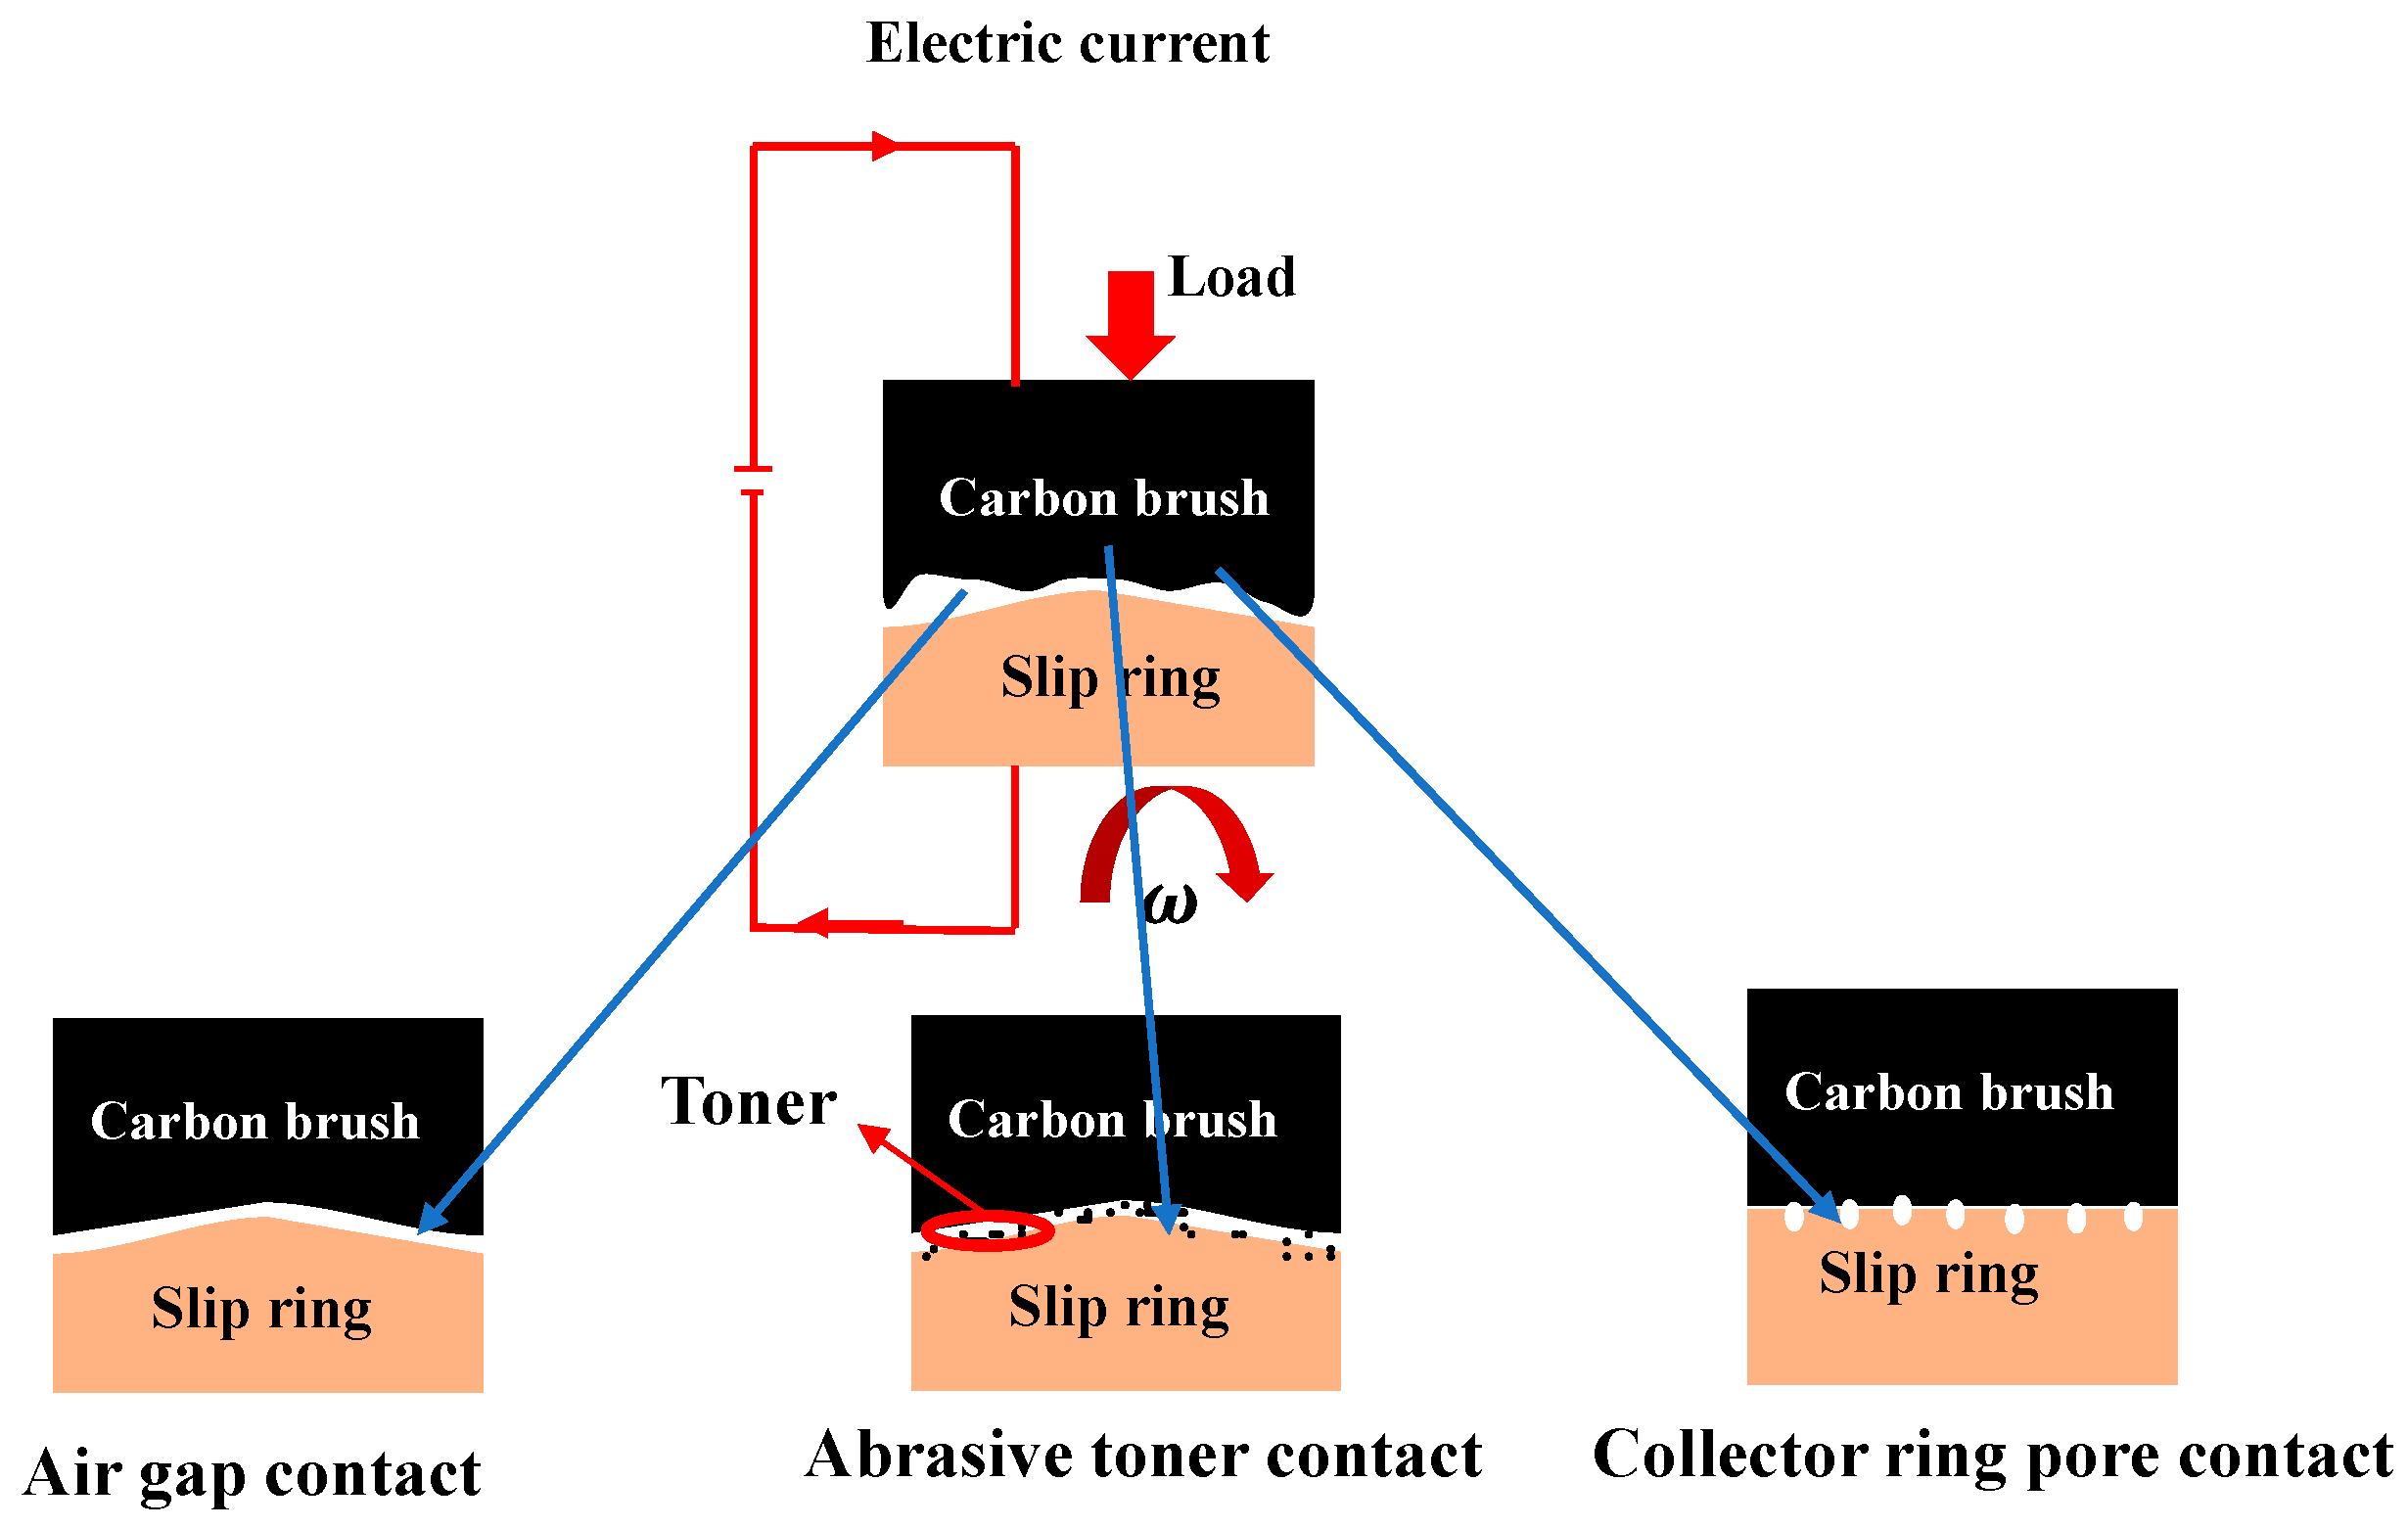
Figure 2.
Surface roughness of collector ring.
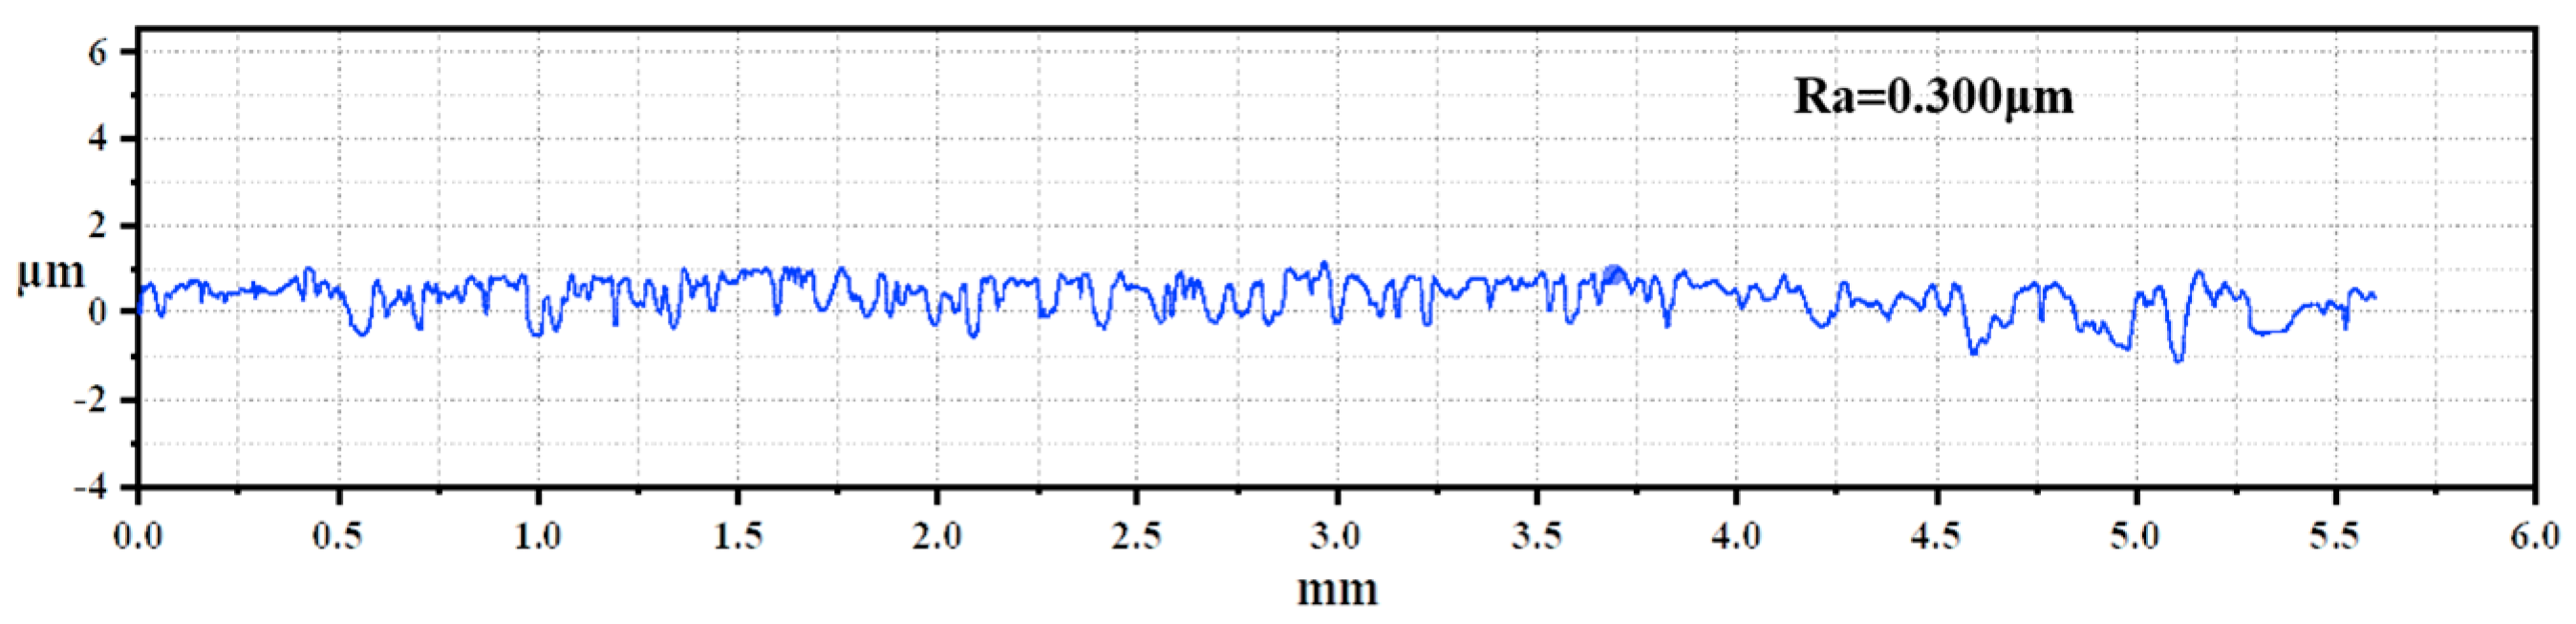
Figure 5.
Pore arrangement.
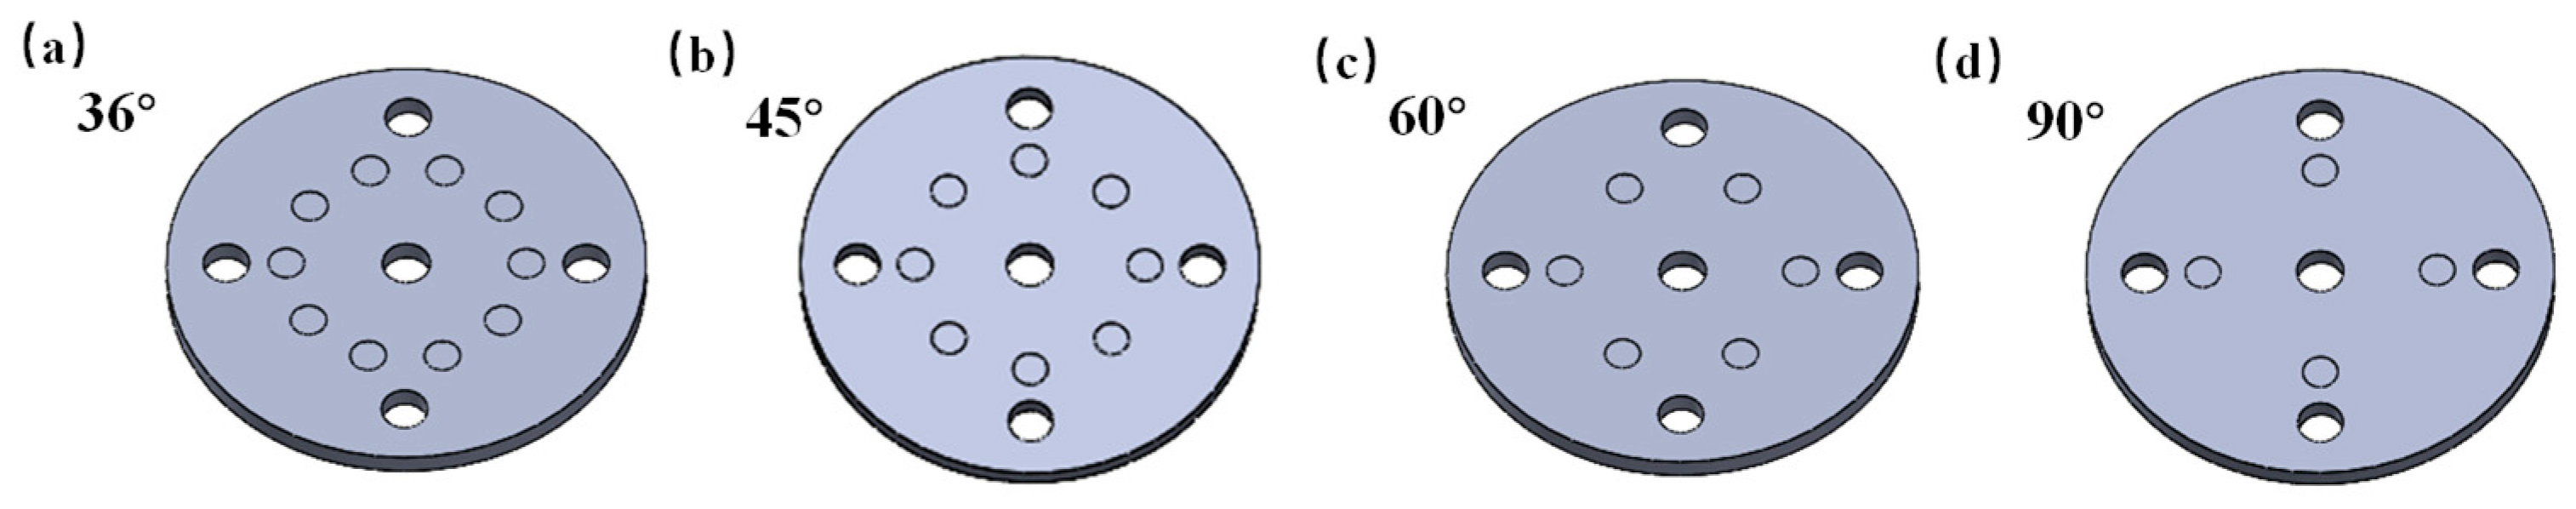
Figure 6.
Experimental setup: (a) Current-carrying friction and wear tester; (b) Test method of pin-disk contact; (c) Physical drawing of the current-carrying friction and wear tester; (d) Schematic diagram of the test setup.
Figure 6.
Experimental setup: (a) Current-carrying friction and wear tester; (b) Test method of pin-disk contact; (c) Physical drawing of the current-carrying friction and wear tester; (d) Schematic diagram of the test setup.
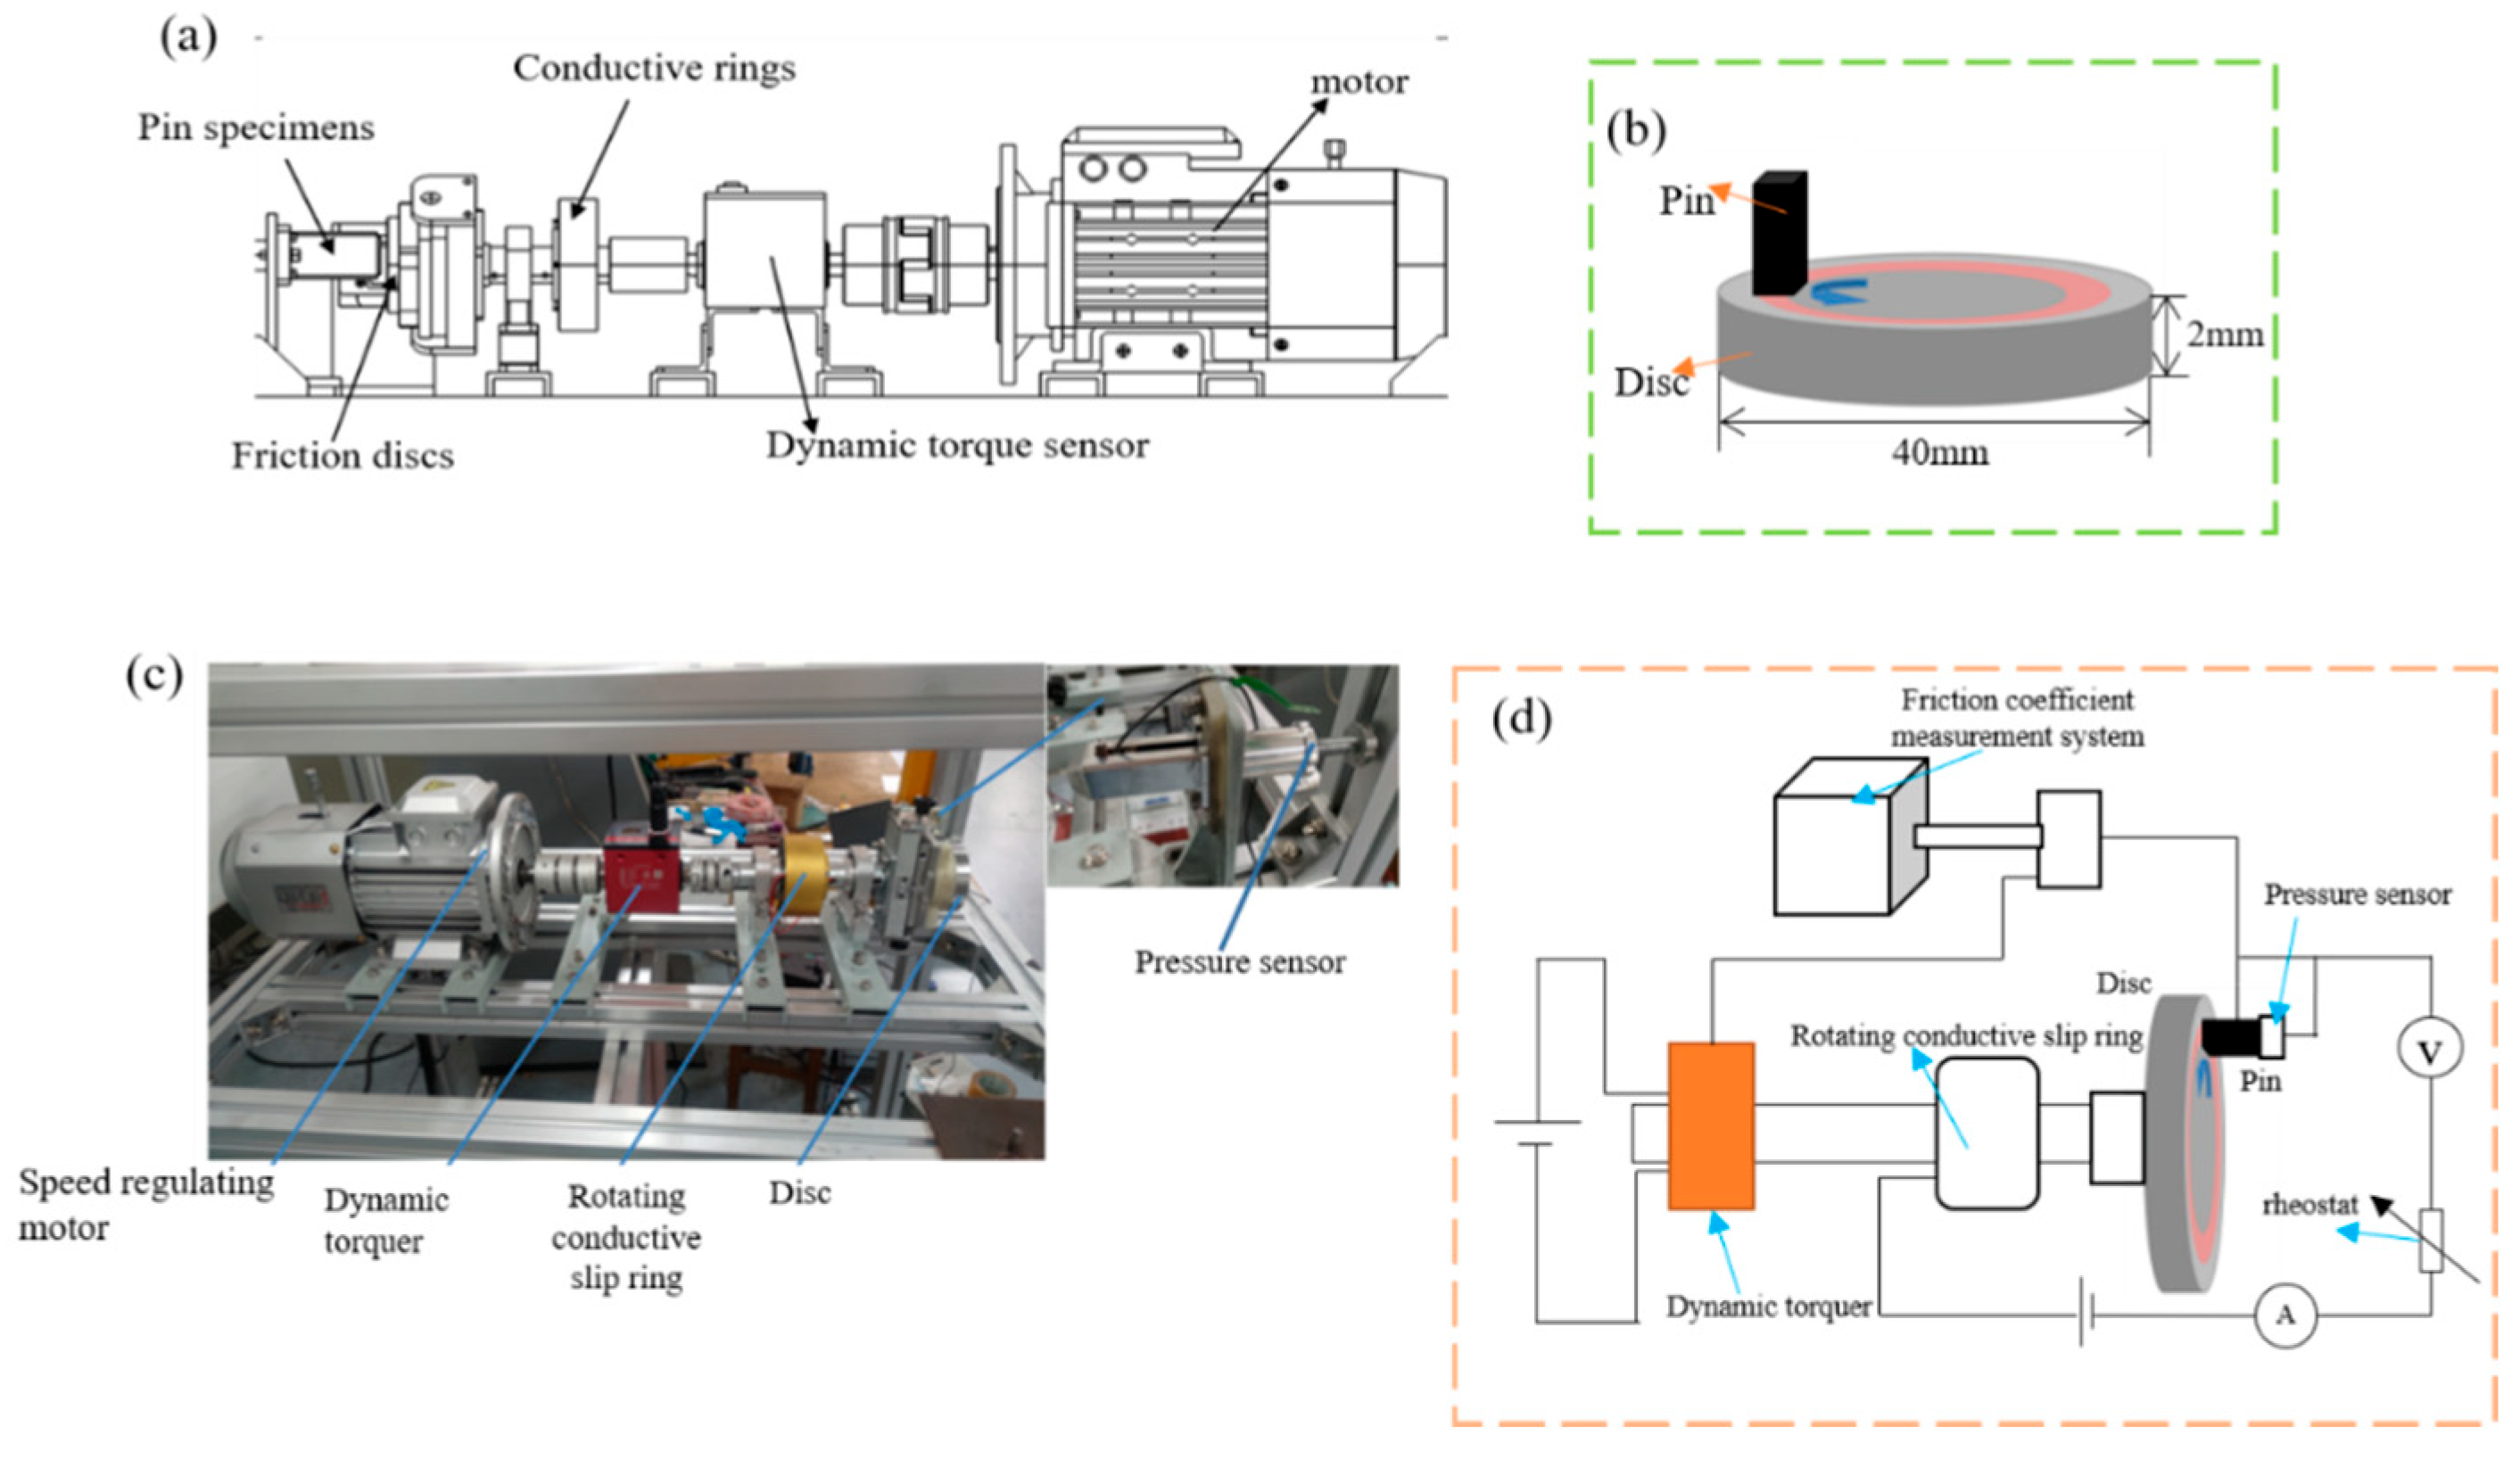
Figure 7.
Air gap test stand.
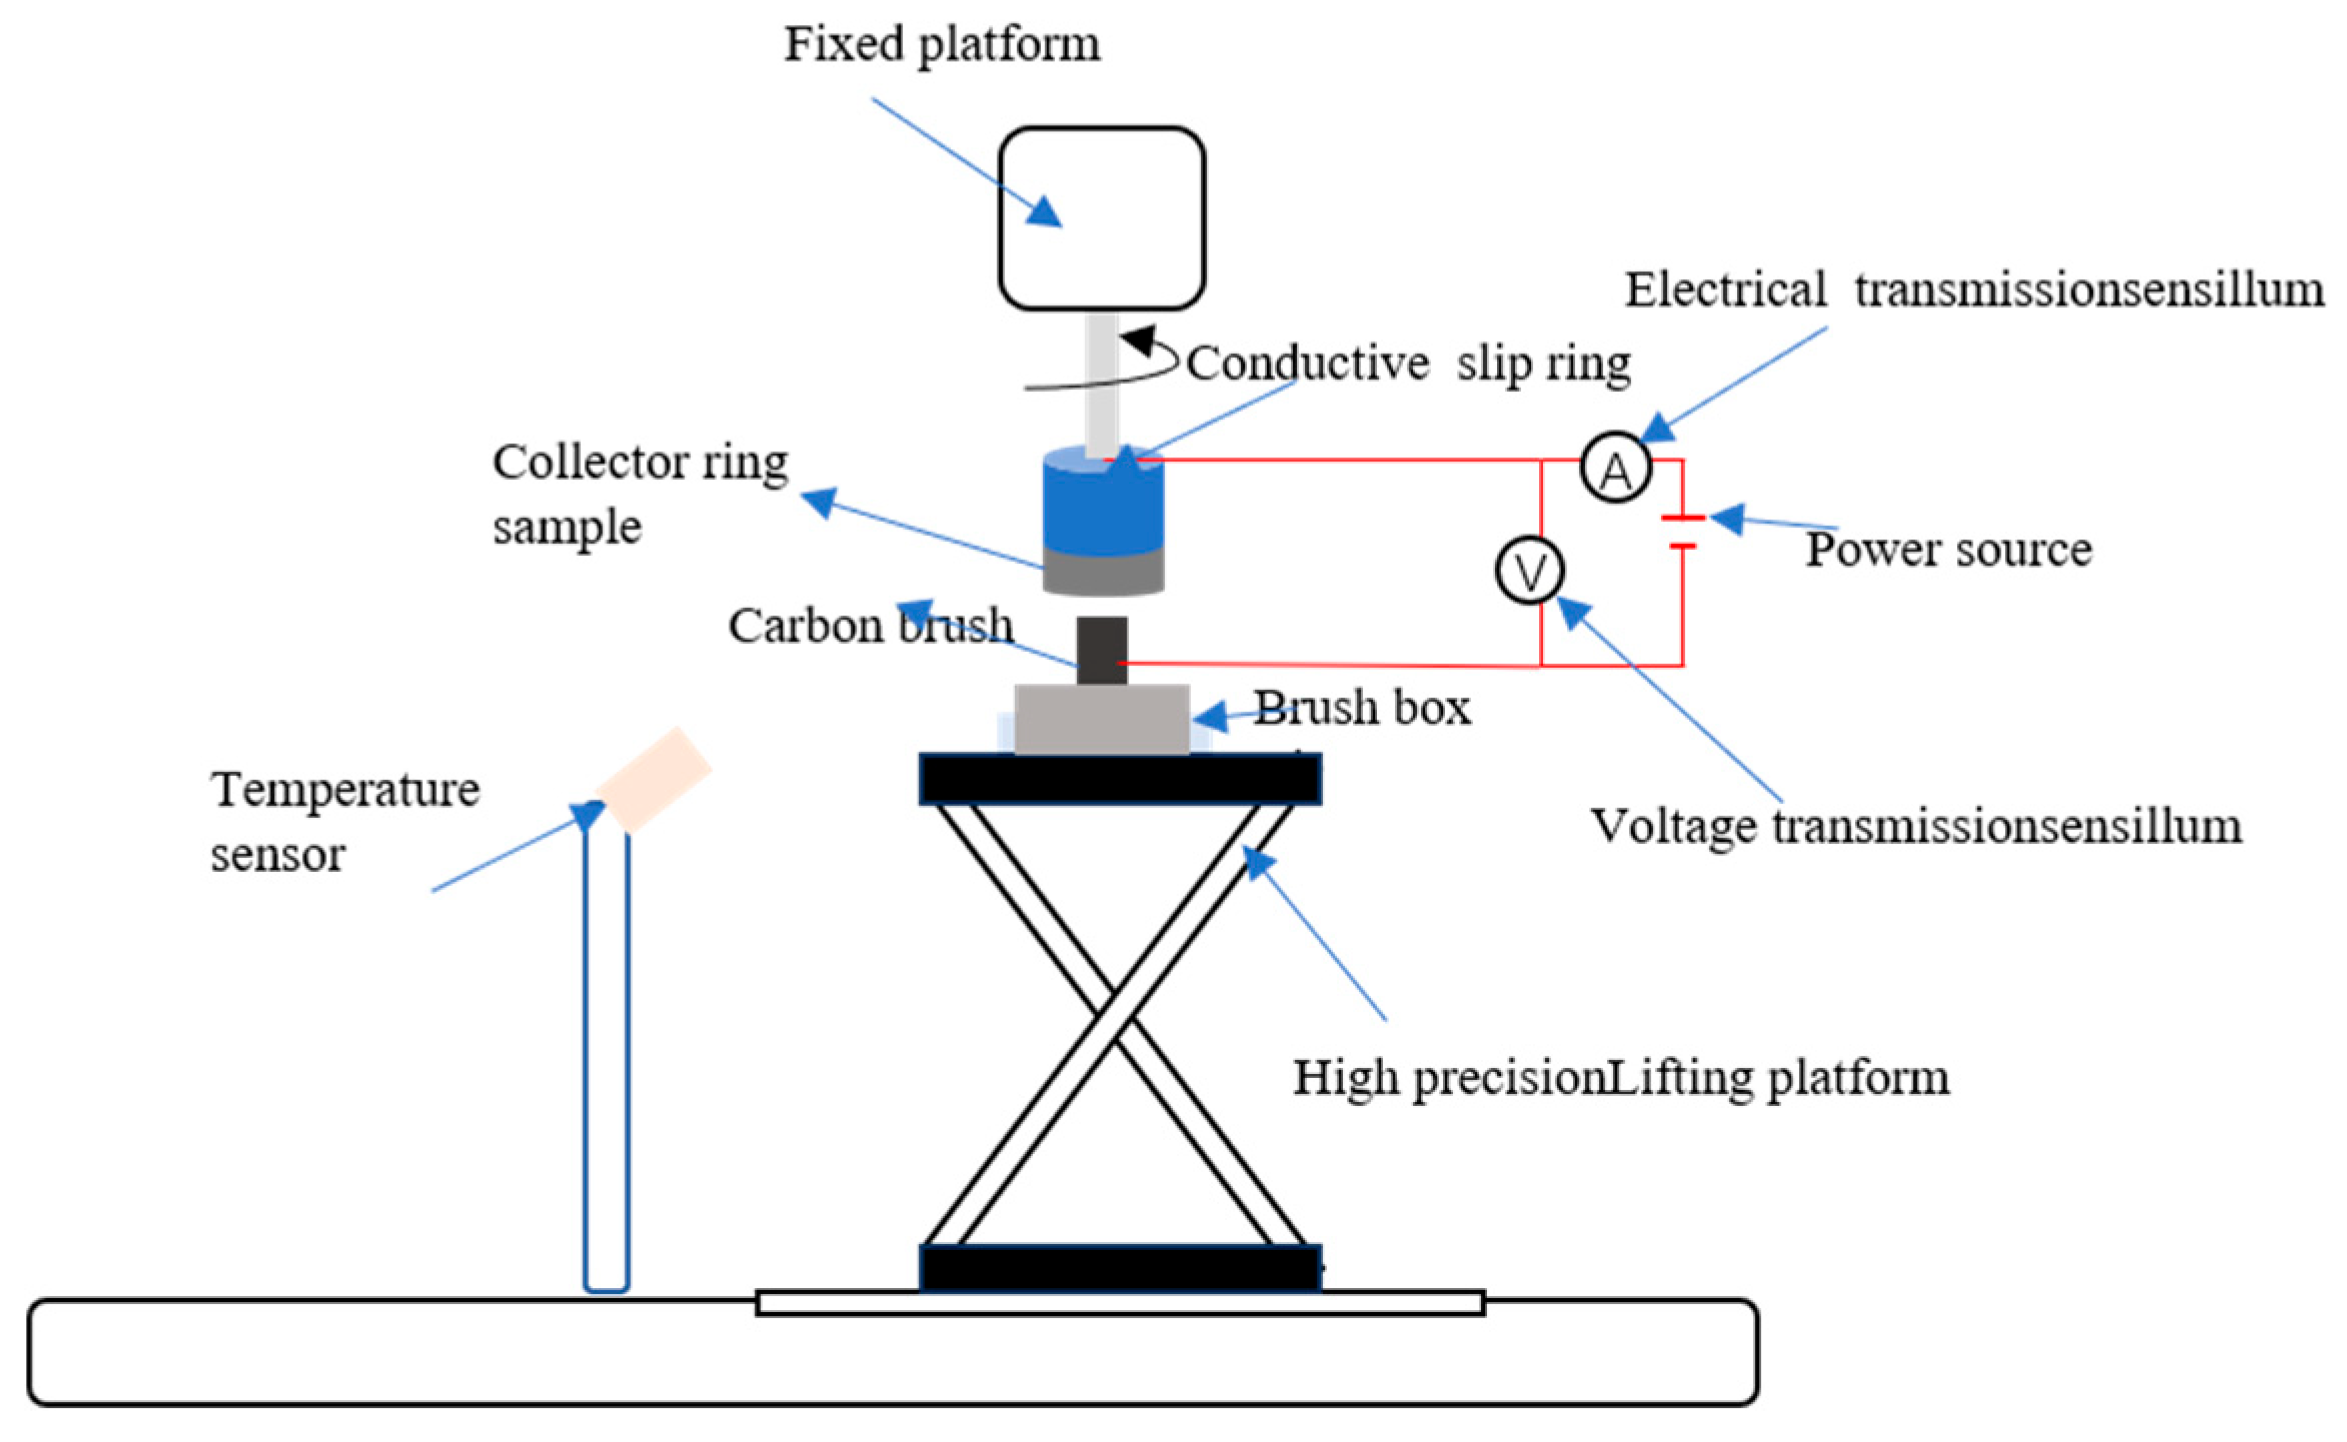
Figure 8.
Variation of spark power and temperature at different voltages and rotational speeds of positive pole: (a)-(c) Temperature variation curves at 10-30v; (d)-(f) Arc power variation curves at 10-30v; (g) Average temperature variation curves; (h) Average arc power variation curves.
Figure 8.
Variation of spark power and temperature at different voltages and rotational speeds of positive pole: (a)-(c) Temperature variation curves at 10-30v; (d)-(f) Arc power variation curves at 10-30v; (g) Average temperature variation curves; (h) Average arc power variation curves.
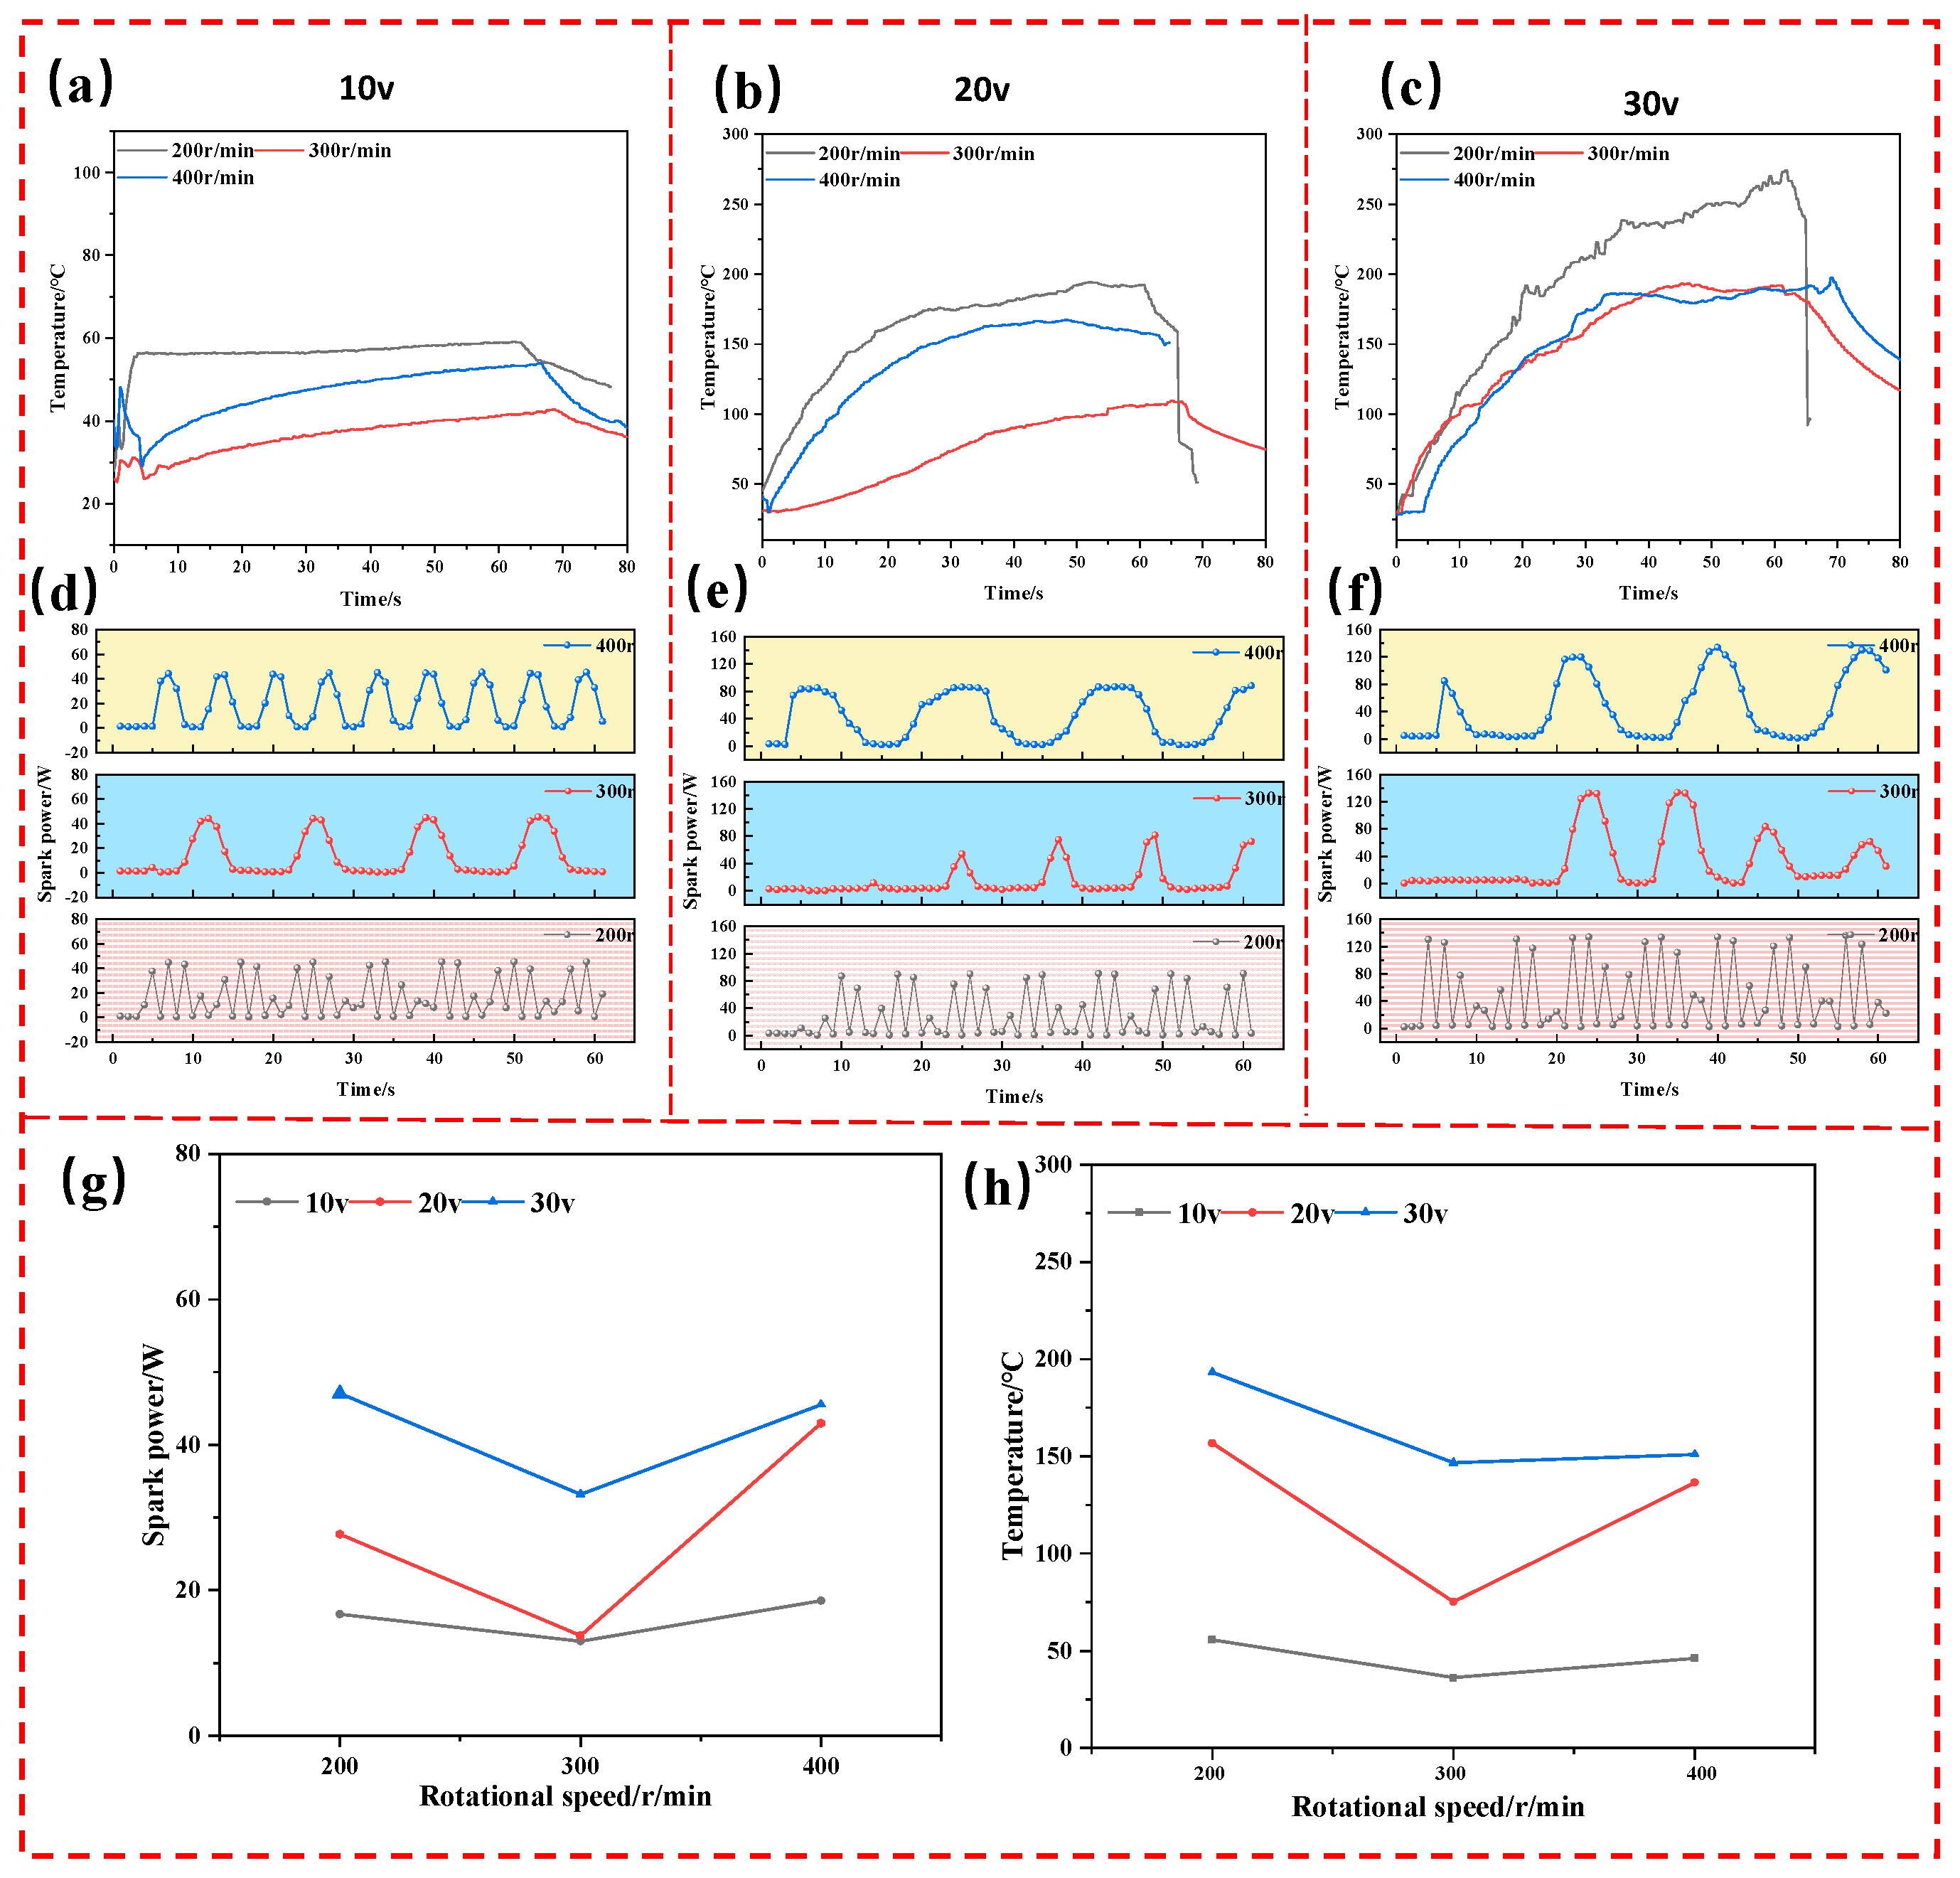
Figure 9.
Temperature changes of the contact surface under different voltages of the positive electrode of the carbon brush: (a)10v; (b) 20v; (c) 30v; (I) 200r/min; (II) 300r/min; (III) 400r/min.
Figure 9.
Temperature changes of the contact surface under different voltages of the positive electrode of the carbon brush: (a)10v; (b) 20v; (c) 30v; (I) 200r/min; (II) 300r/min; (III) 400r/min.
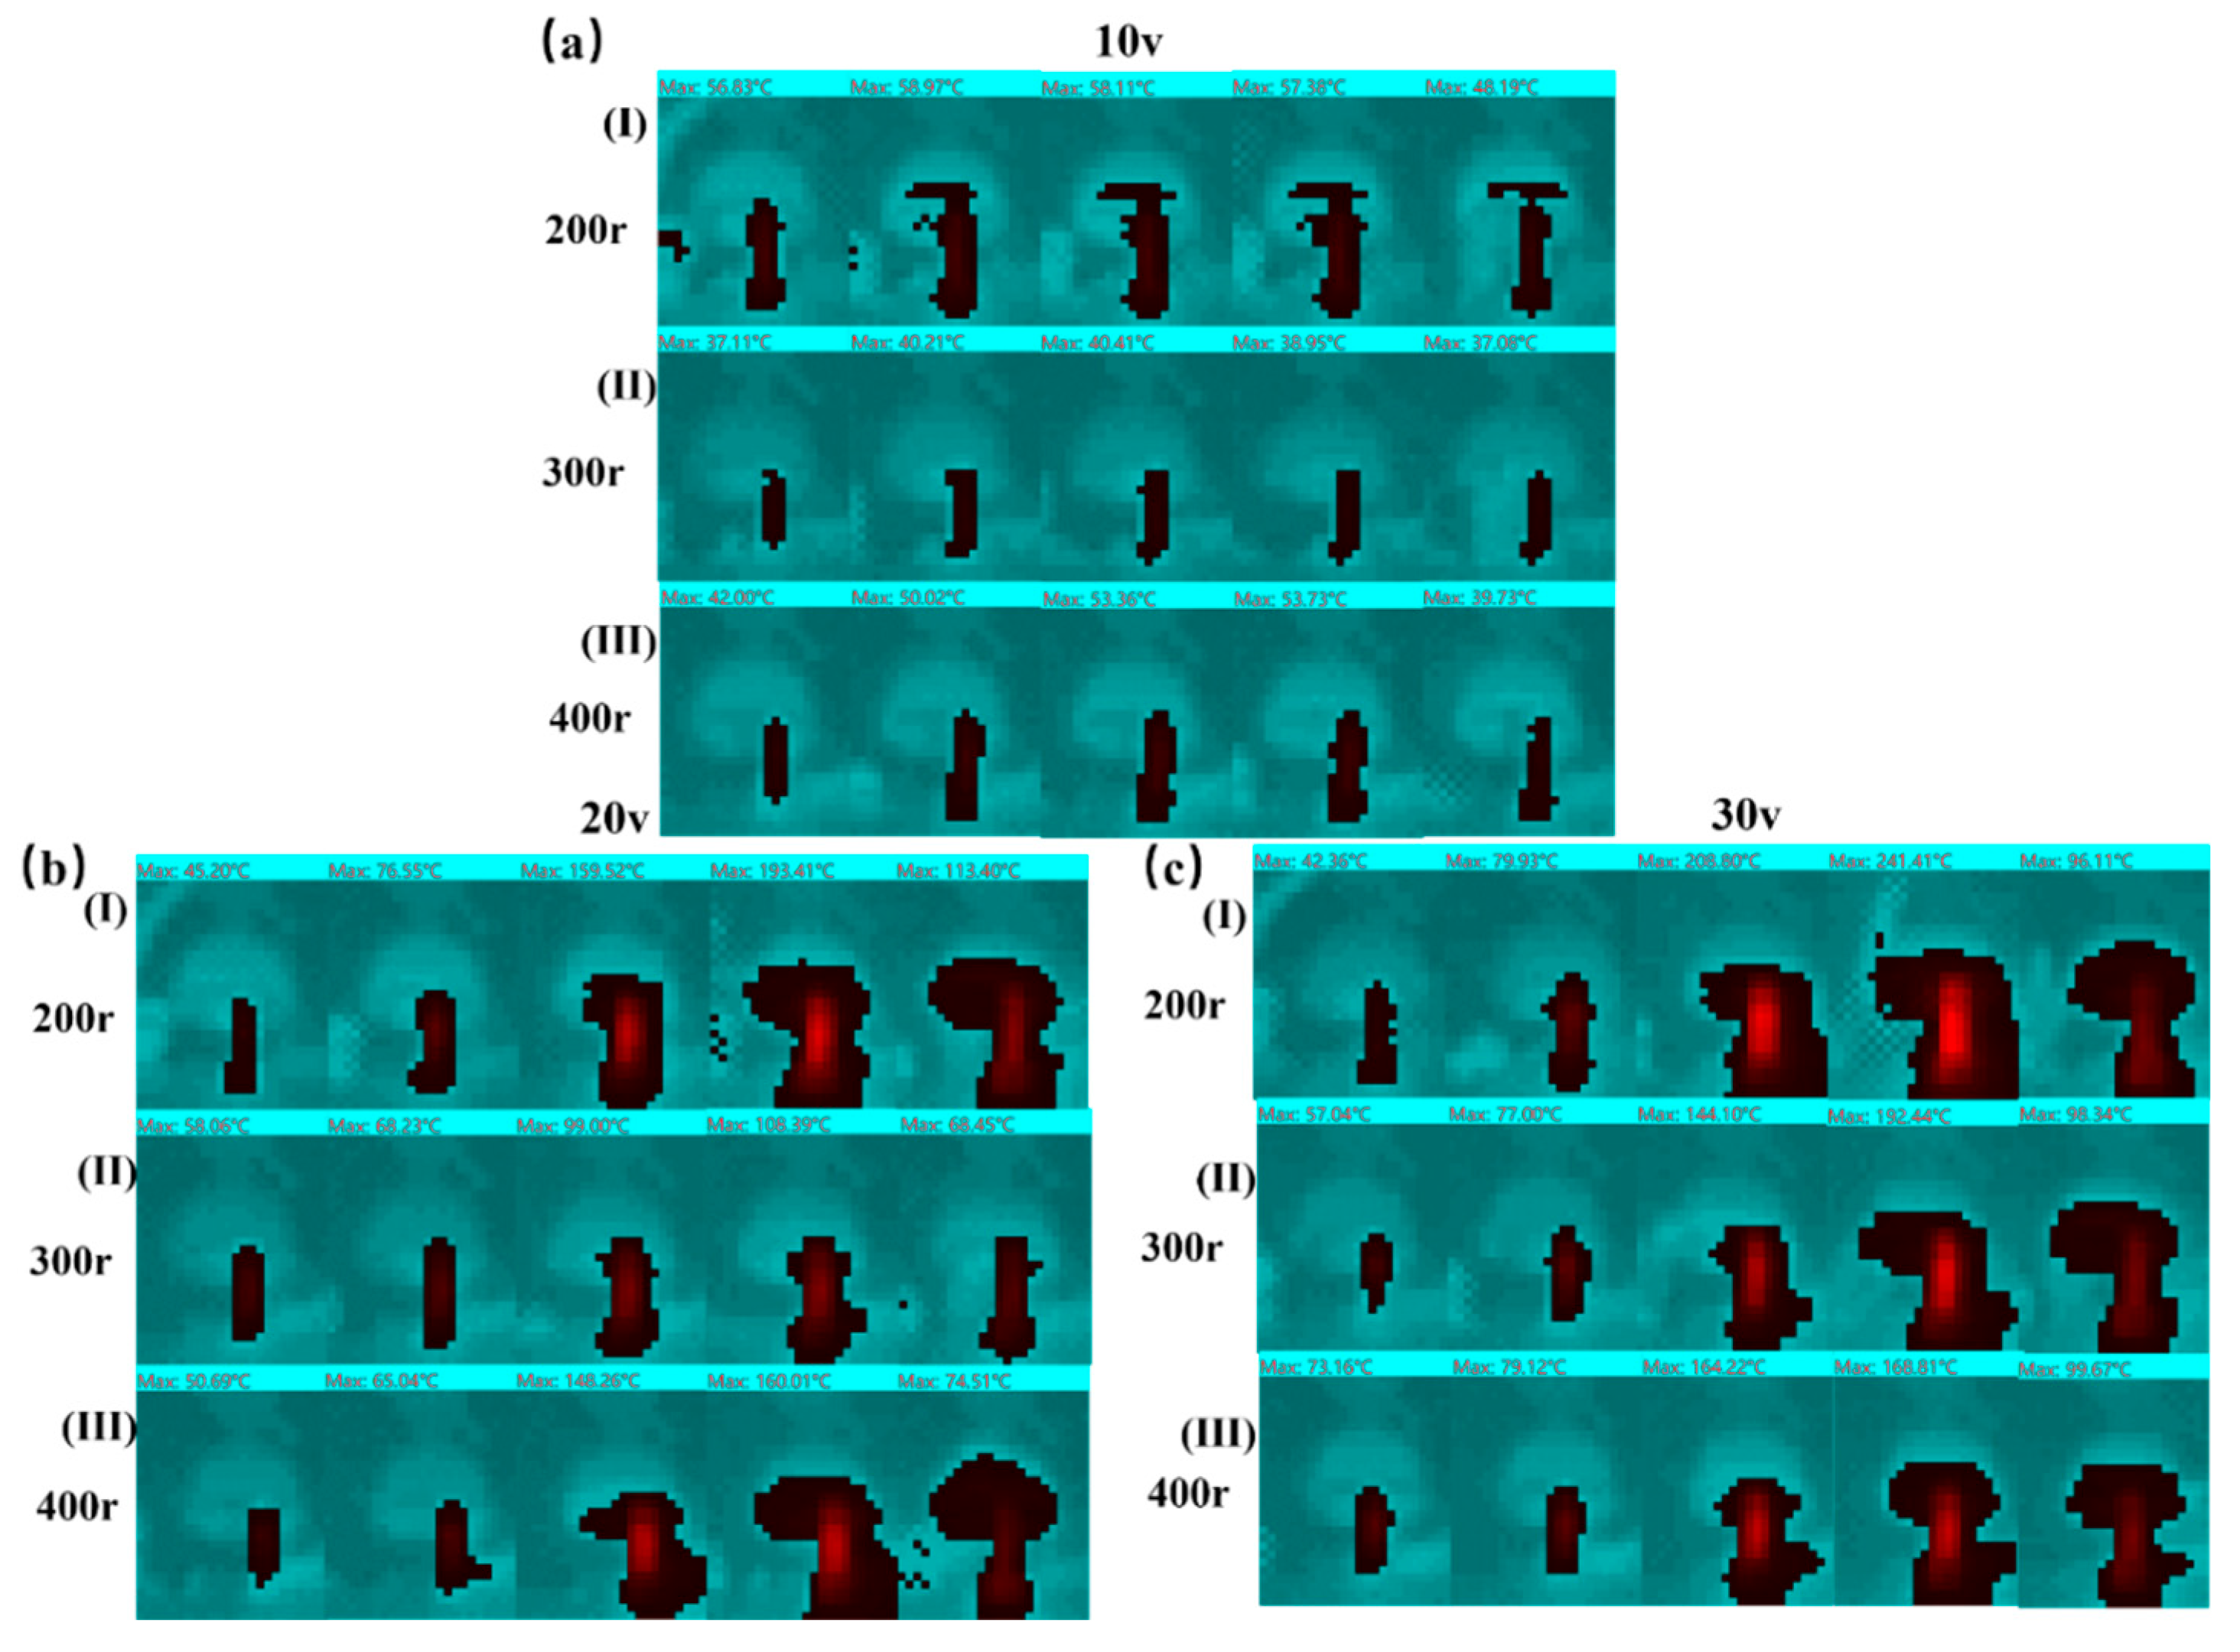
Figure 10.
Variation of spark power and temperature at different rotational speeds of carbon brush negative electrode: (a)-(c) Temperature variation curves at 10-30v; (d)-(f) Arc power variation curves at 10-30v; (g) Mean temperature variation curves; (h) Mean arc power variation curves.
Figure 10.
Variation of spark power and temperature at different rotational speeds of carbon brush negative electrode: (a)-(c) Temperature variation curves at 10-30v; (d)-(f) Arc power variation curves at 10-30v; (g) Mean temperature variation curves; (h) Mean arc power variation curves.
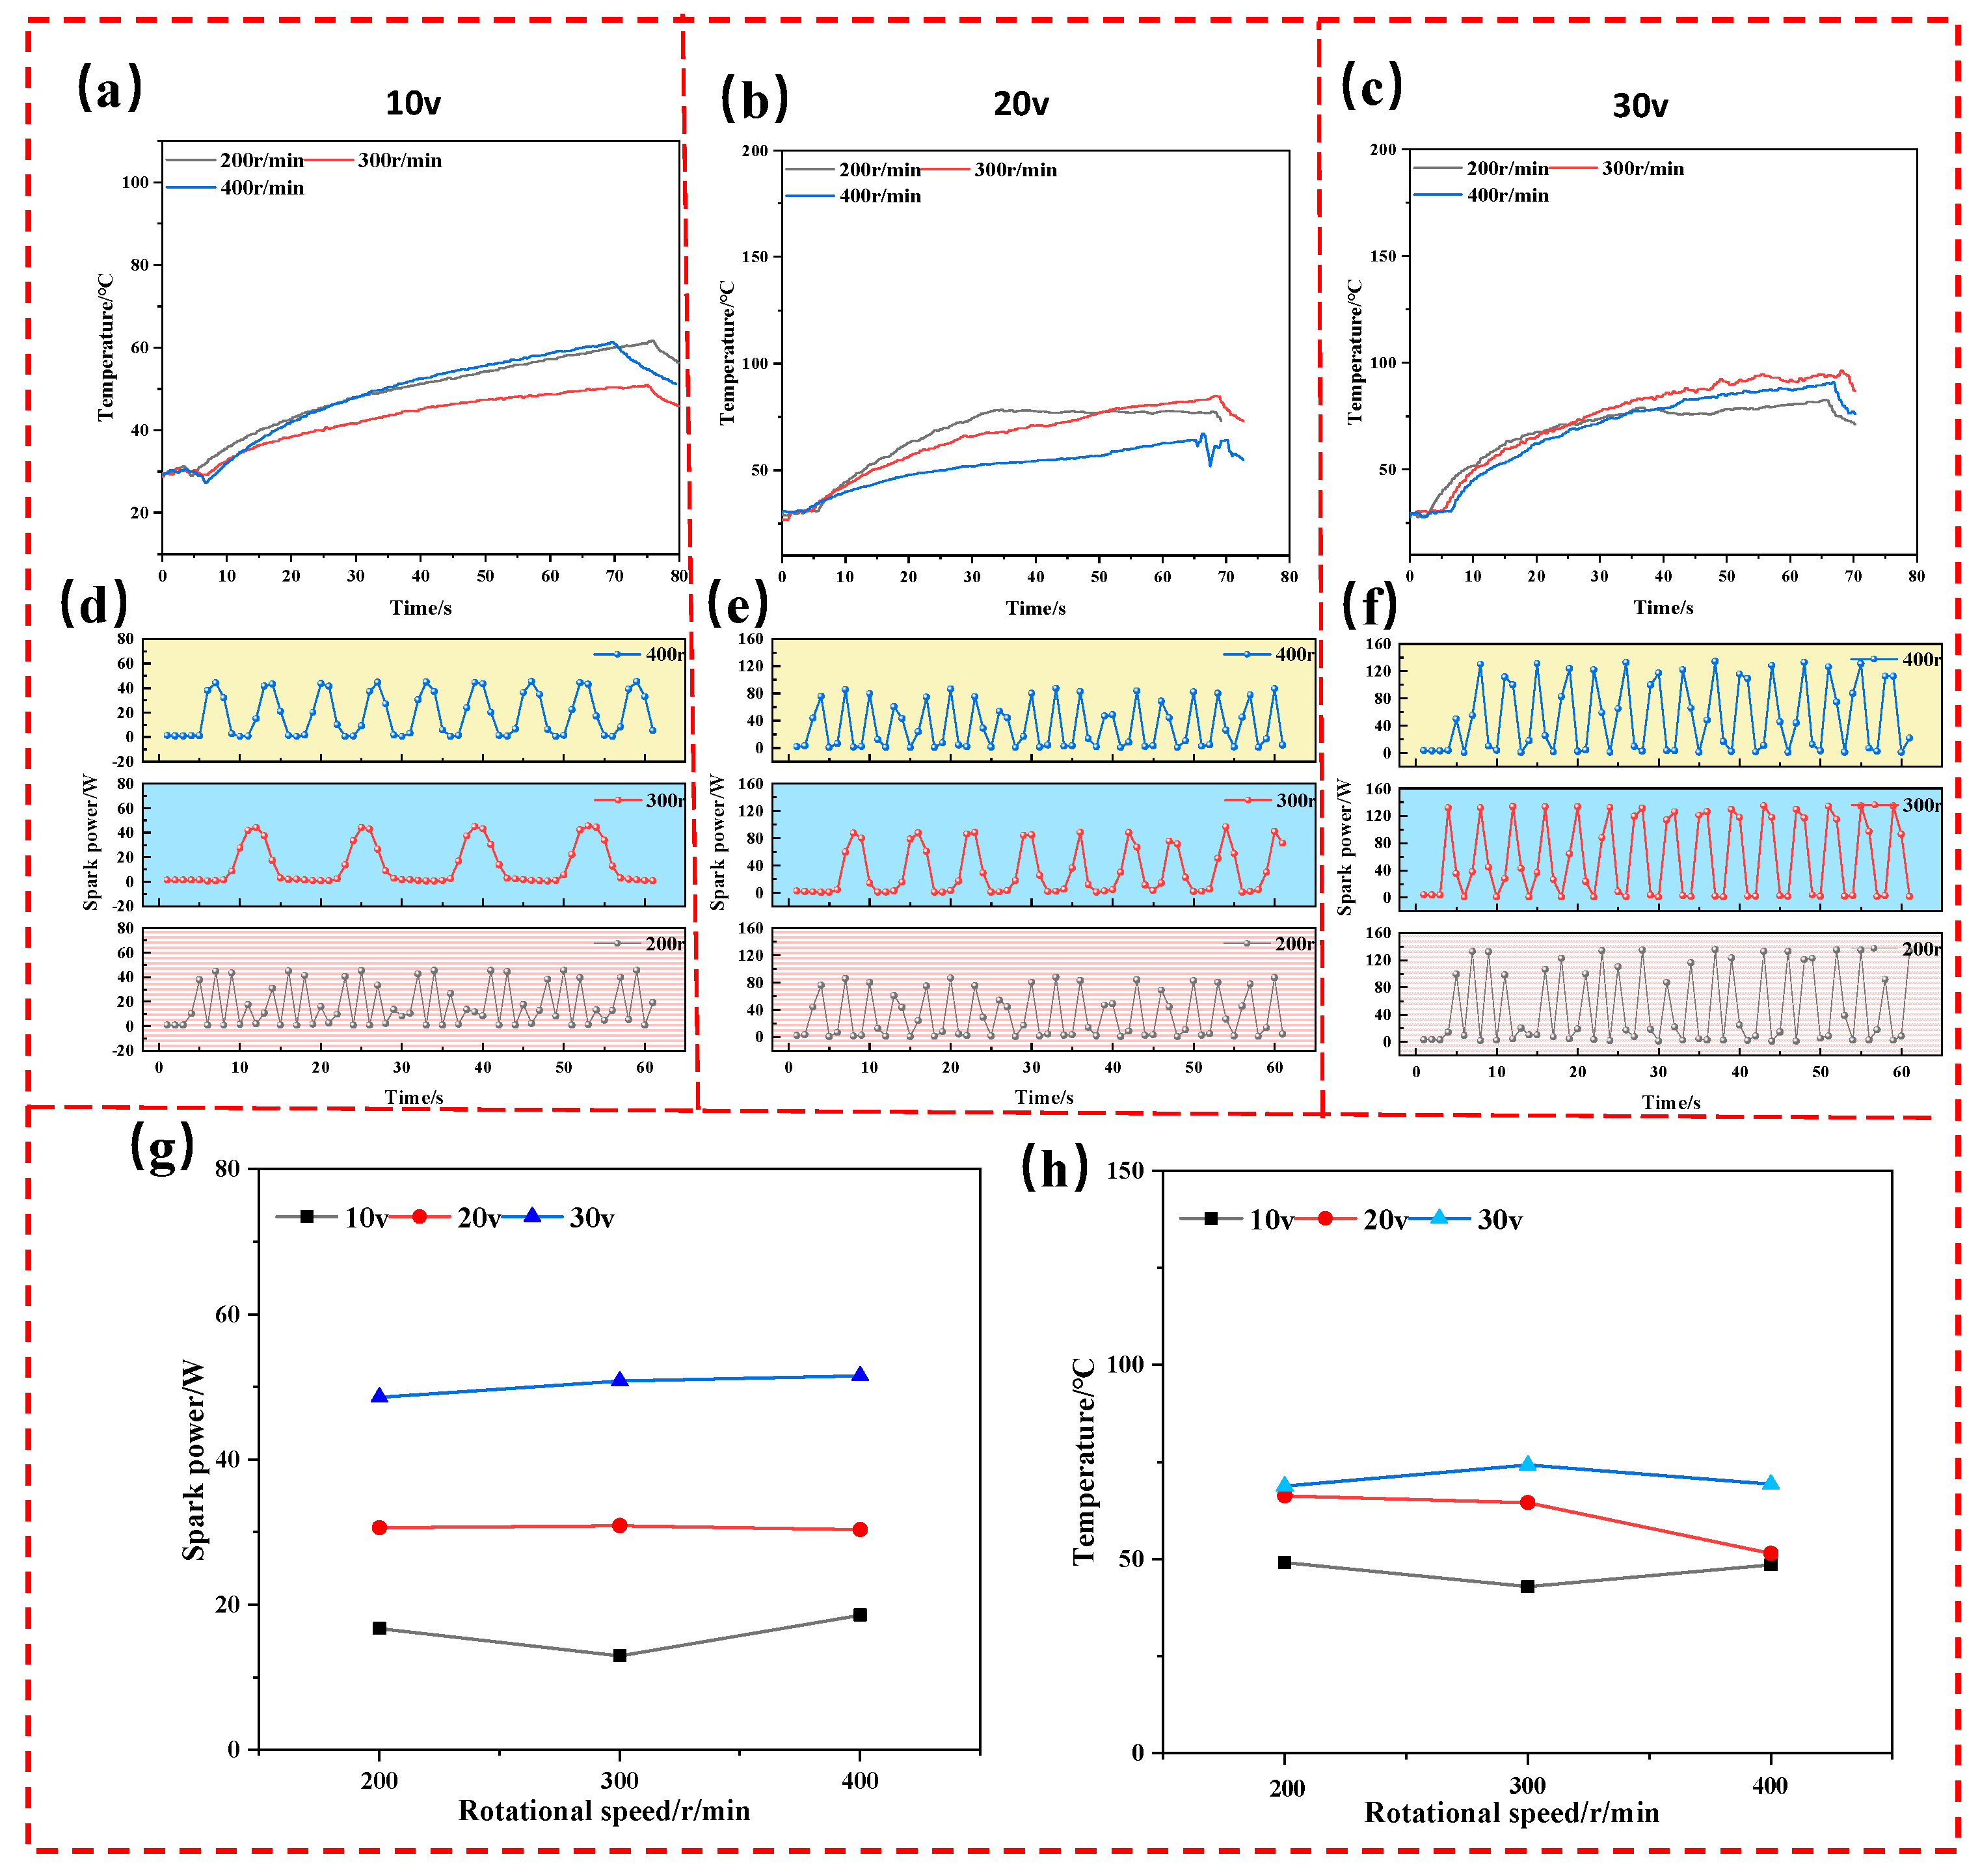
Figure 11.
Temperature change of contact surface at different voltages of carbon brush positive pole: (a) 10v; (b) 20v;(c) 30v; (I) speed of 200r/min; (II) speed of 300r/min; (III) speed of 400r/min.
Figure 11.
Temperature change of contact surface at different voltages of carbon brush positive pole: (a) 10v; (b) 20v;(c) 30v; (I) speed of 200r/min; (II) speed of 300r/min; (III) speed of 400r/min.
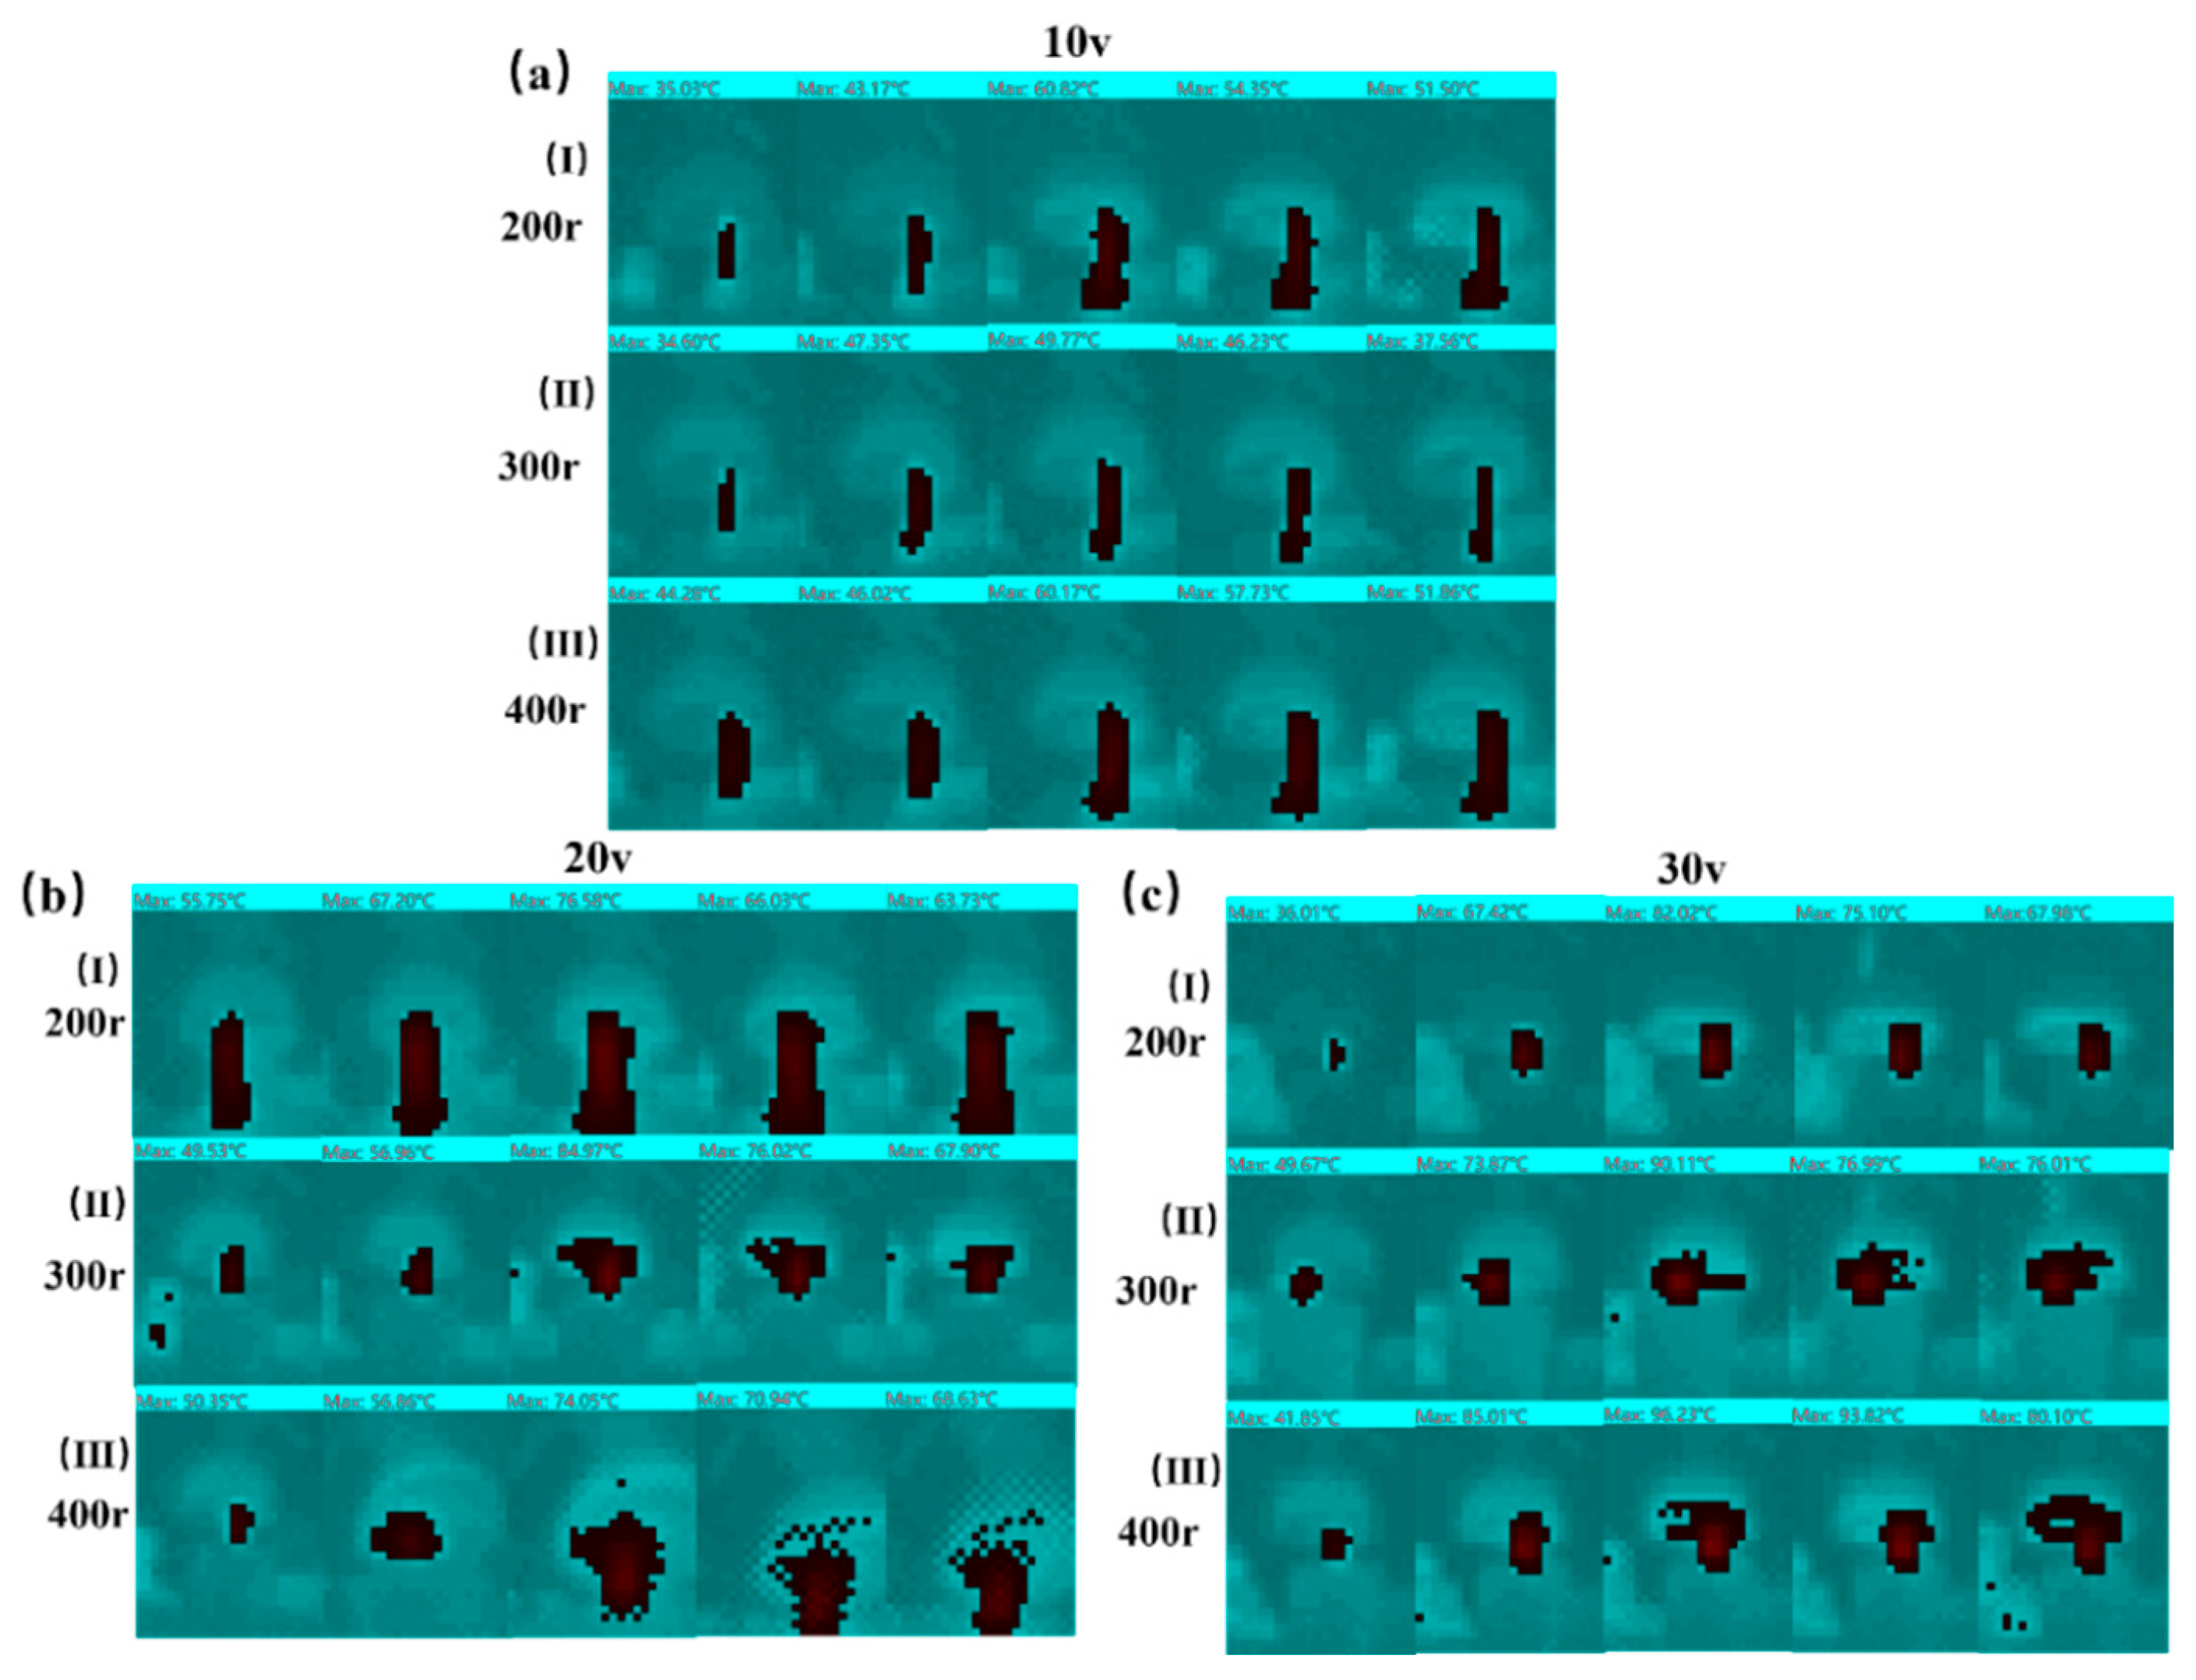
Figure 12.
Ablation morphology of carbon brush positive collector ring surface (a)-(c) 200r-400r at 10v; (d)-(f) 200r-400r at 20v; (g)-(i) 200r-400r at 30v.
Figure 12.
Ablation morphology of carbon brush positive collector ring surface (a)-(c) 200r-400r at 10v; (d)-(f) 200r-400r at 20v; (g)-(i) 200r-400r at 30v.
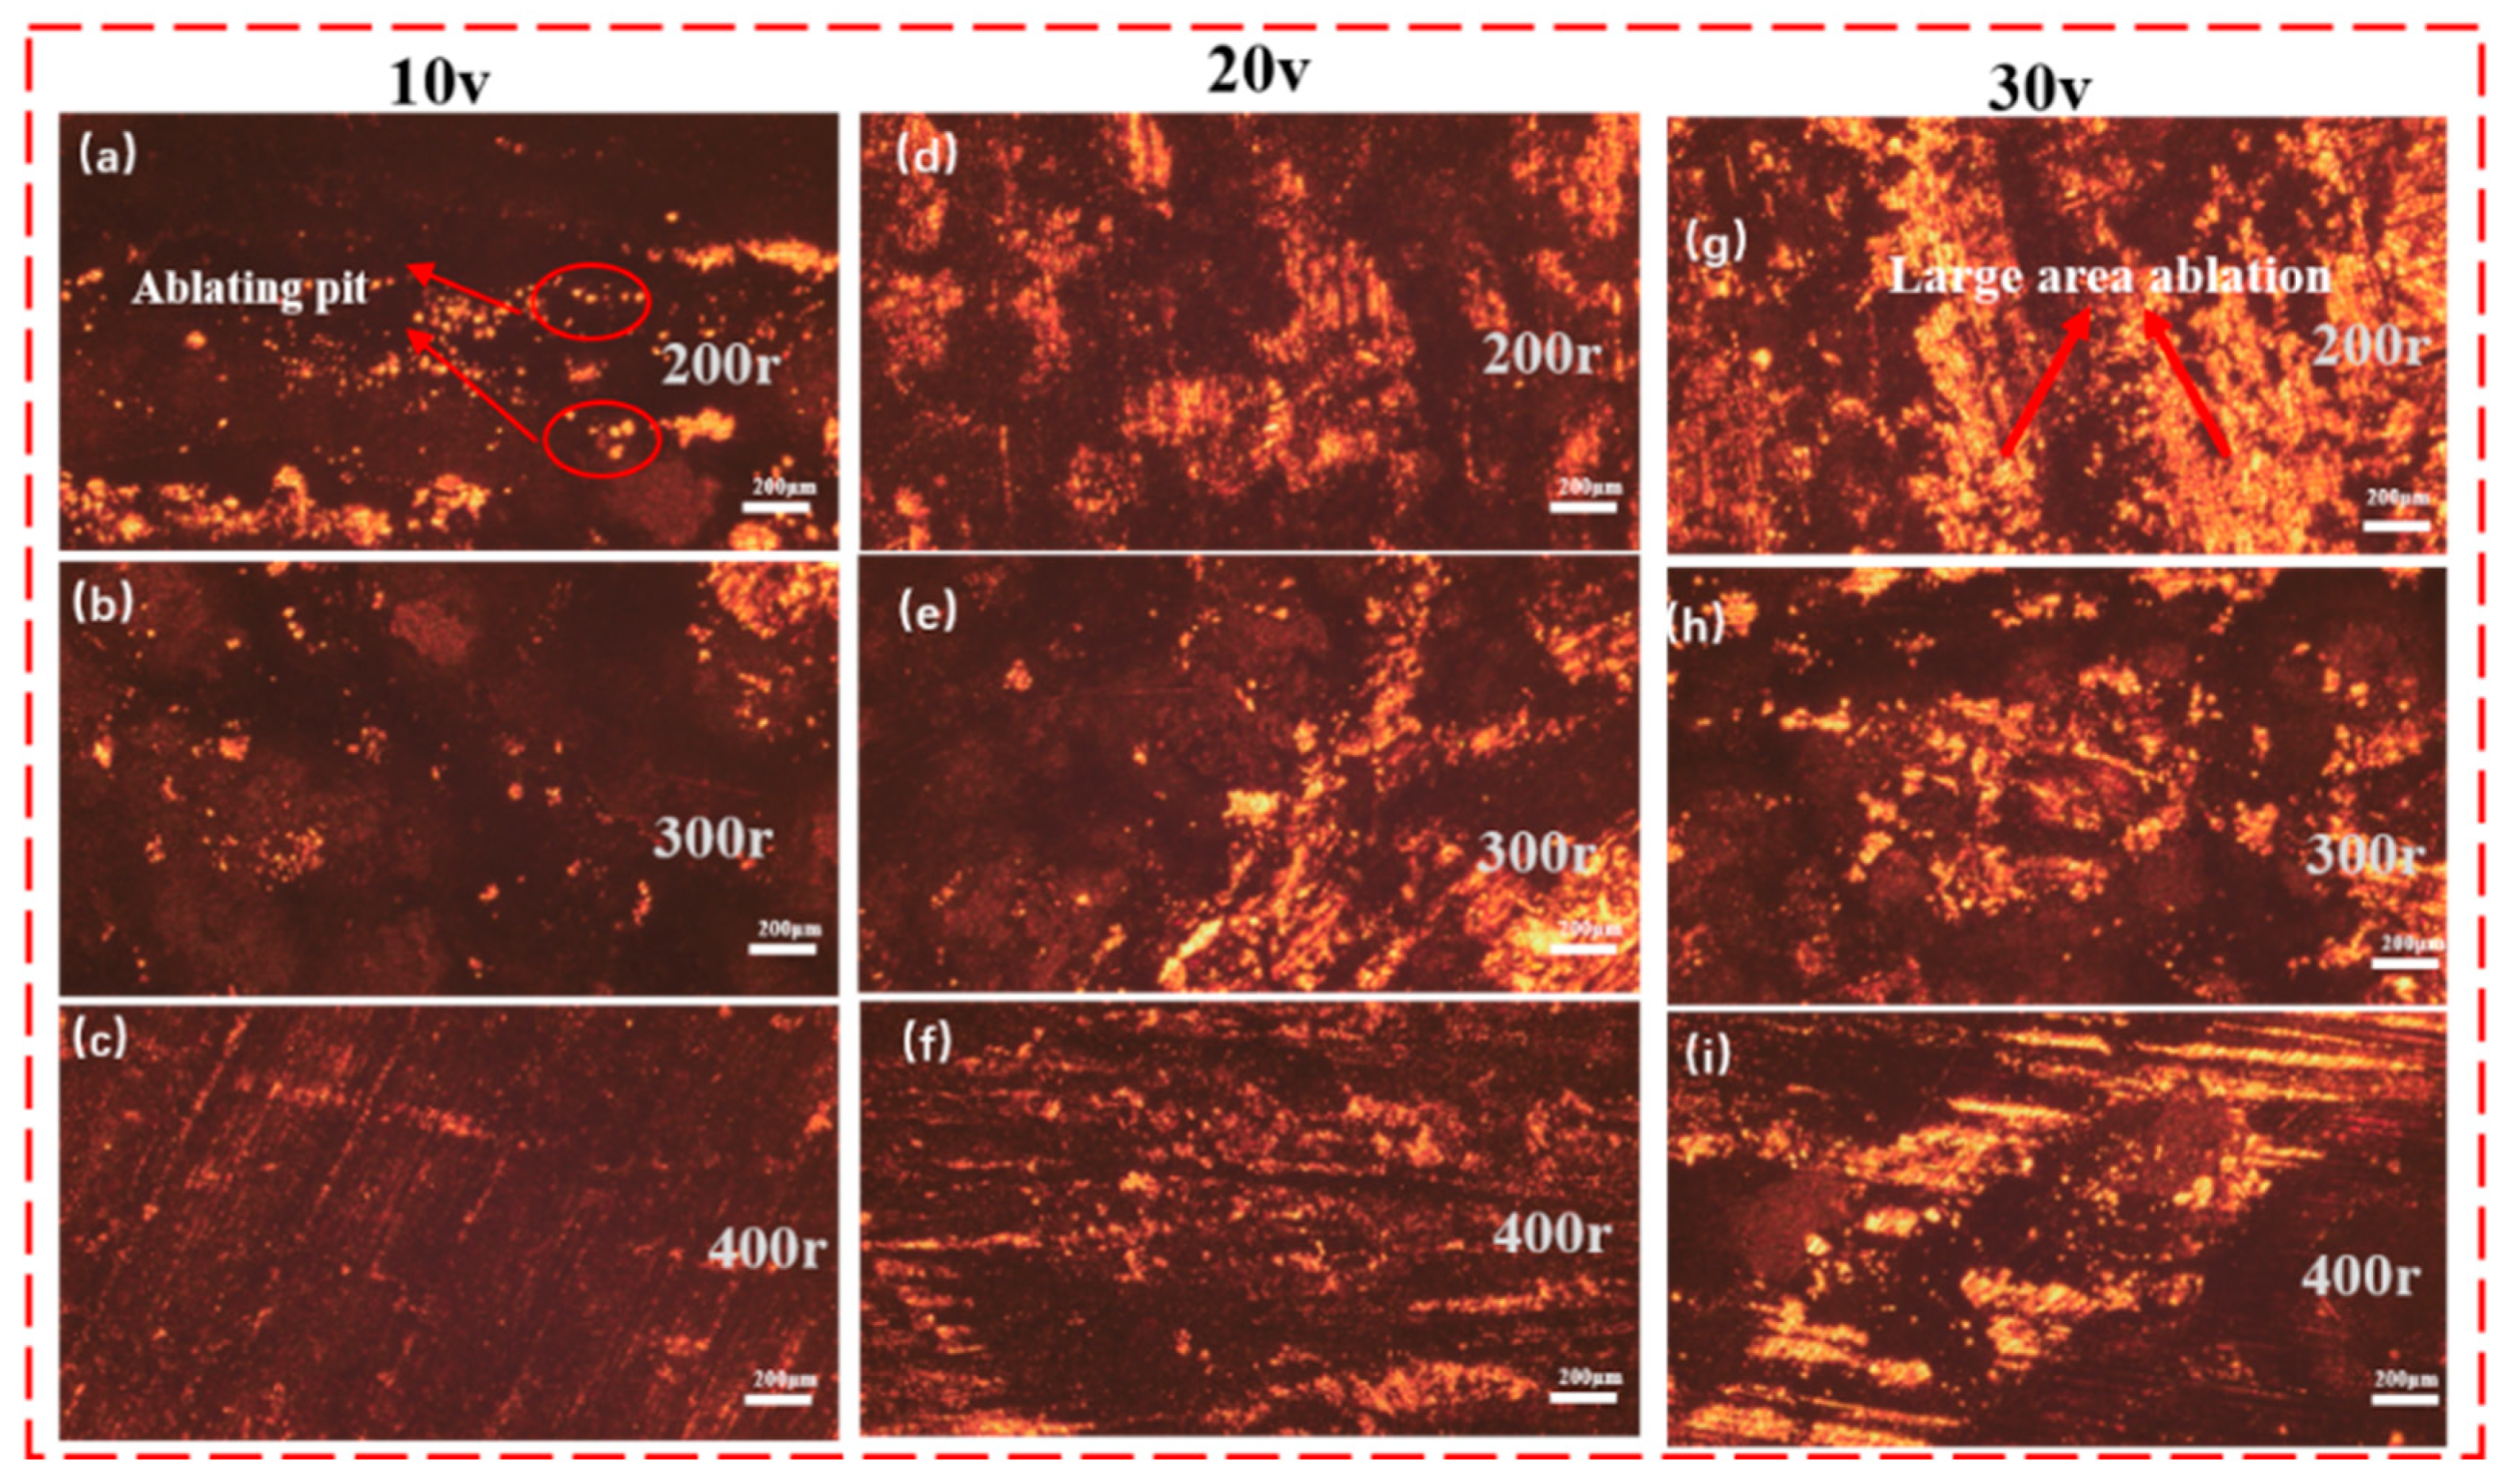
Figure 13.
Ablation morphology of carbon brush negative collector ring surface: (a)-(c) 200r-400r at 10v; (d)-(f) 200r-400r at 20v; (g)-(i) 200r-400r at 30v.
Figure 13.
Ablation morphology of carbon brush negative collector ring surface: (a)-(c) 200r-400r at 10v; (d)-(f) 200r-400r at 20v; (g)-(i) 200r-400r at 30v.
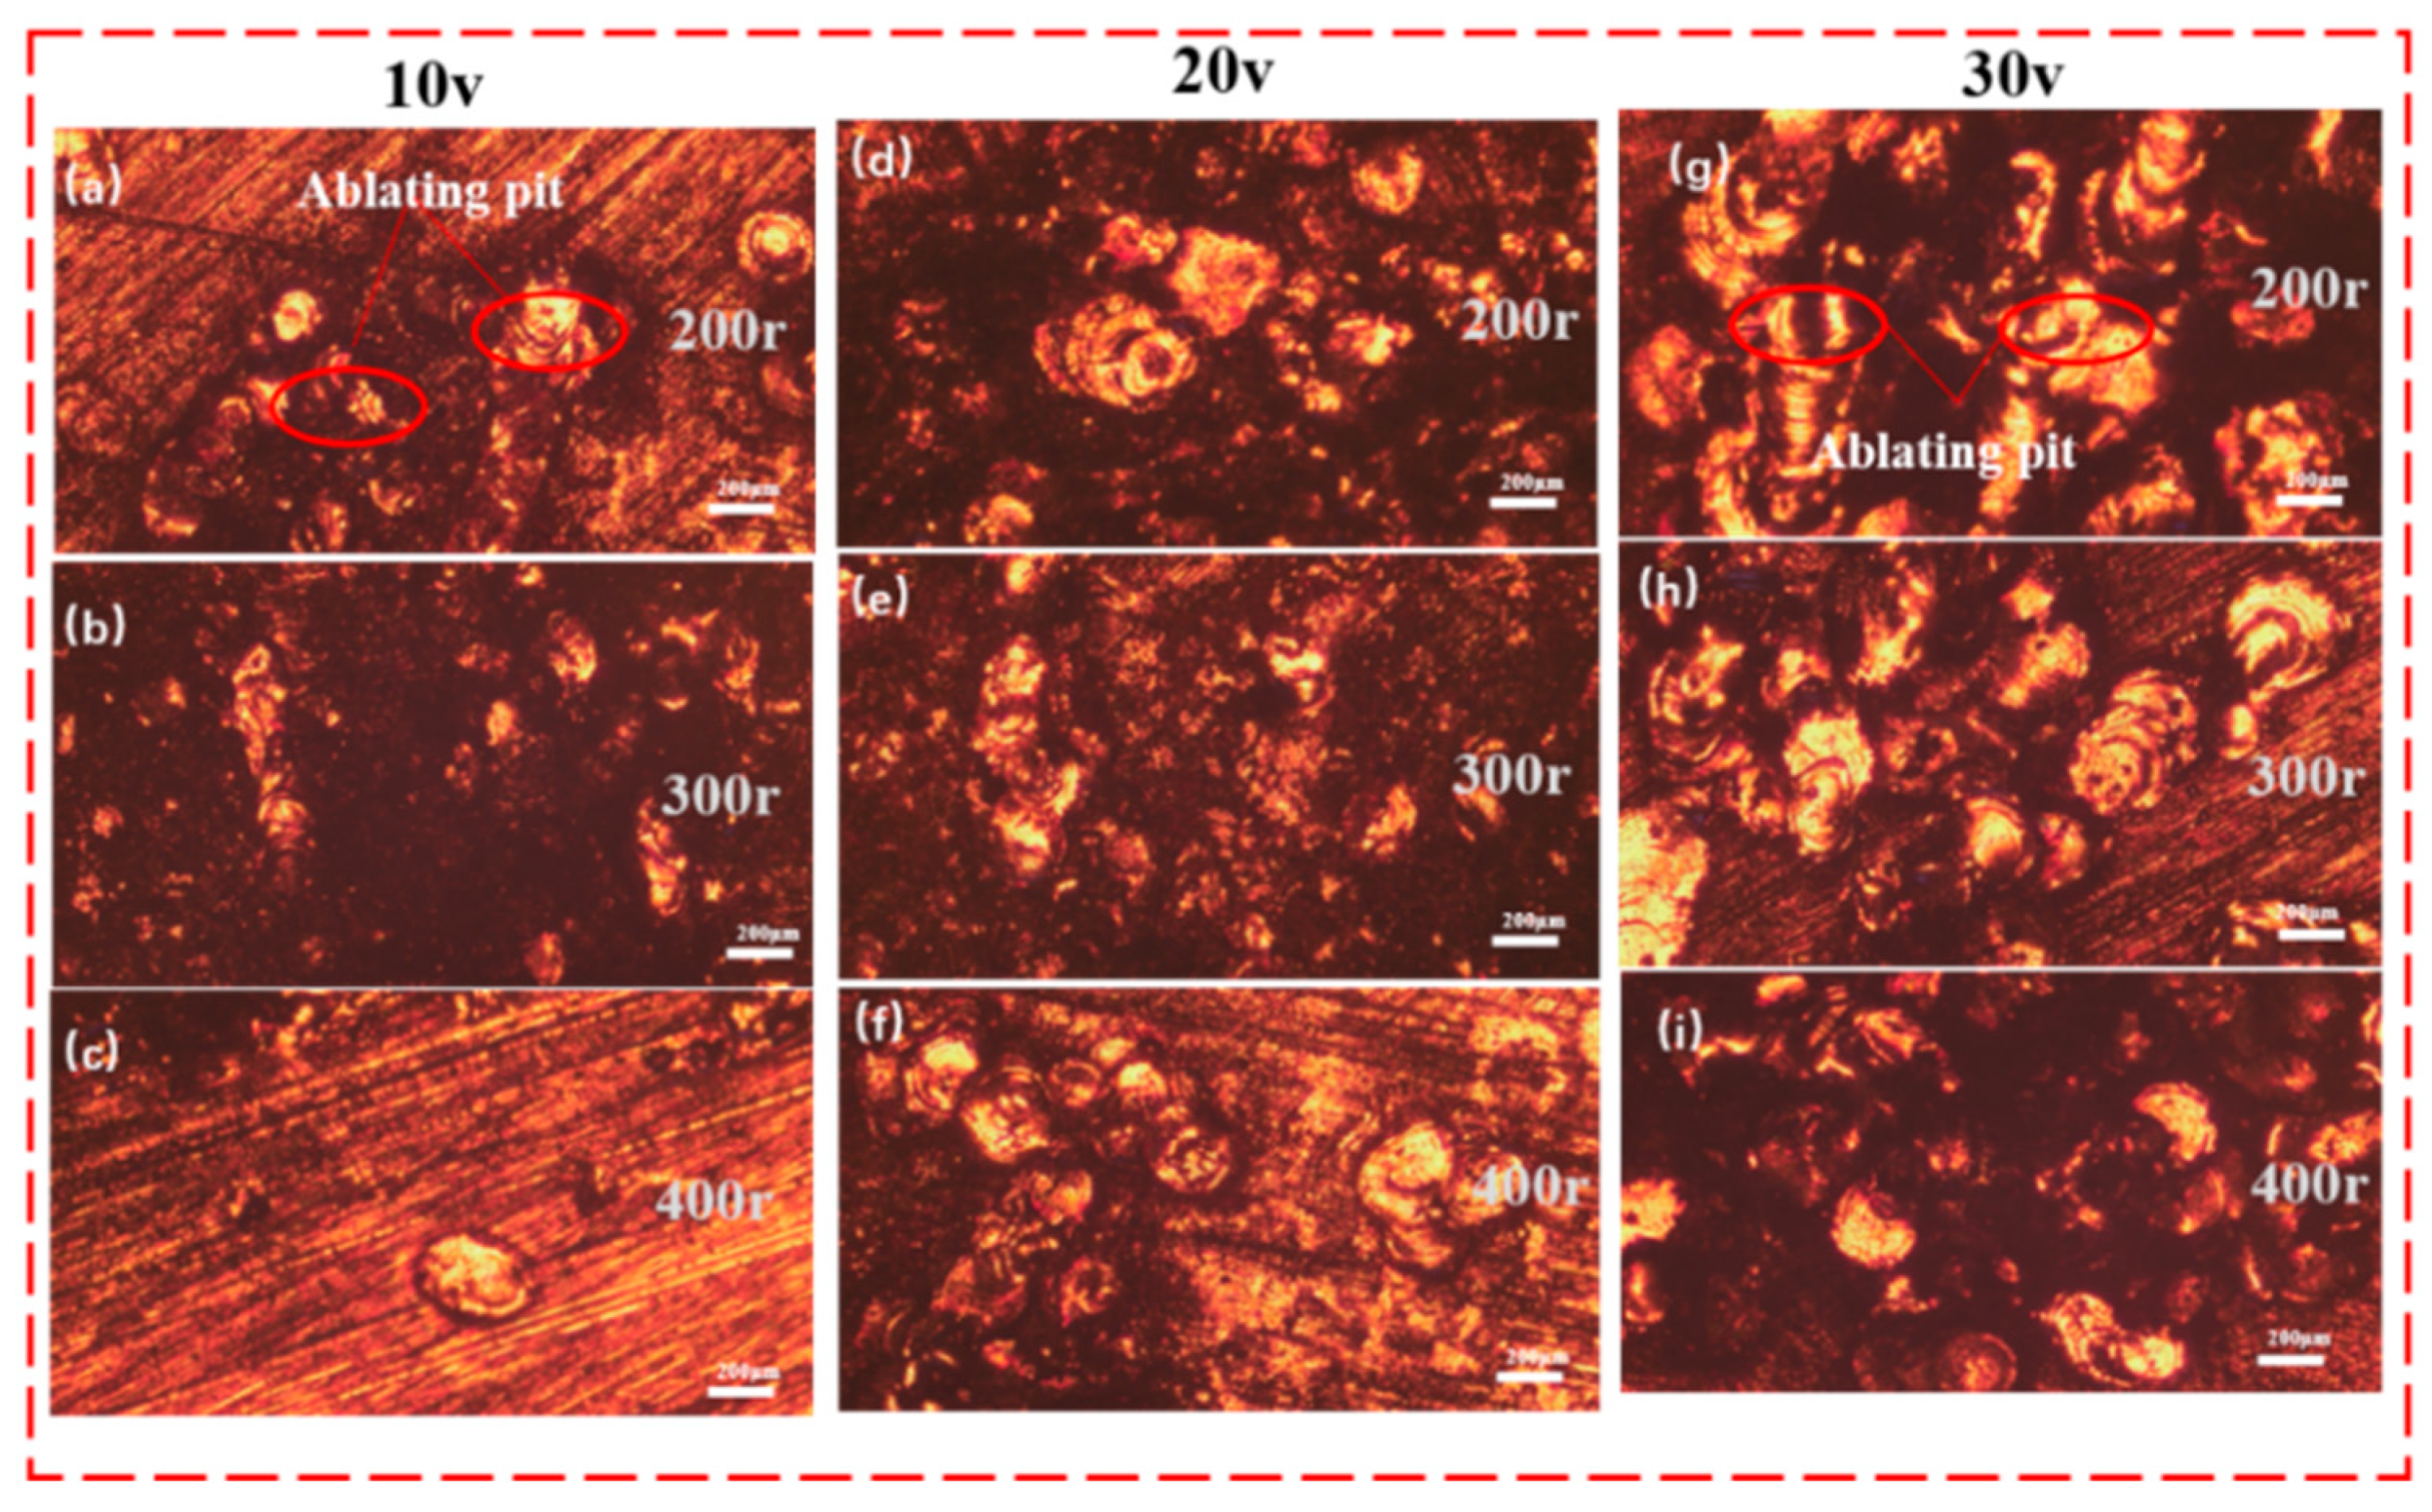
Figure 14.
Morphology of carbon brushes of different polarities after ablation at the same rotational speed: (a-c) Ablation of positive carbon brushes at 10-30v; (d-e) Ablation of negative carbon brushes at 10v-30v.
Figure 14.
Morphology of carbon brushes of different polarities after ablation at the same rotational speed: (a-c) Ablation of positive carbon brushes at 10-30v; (d-e) Ablation of negative carbon brushes at 10v-30v.
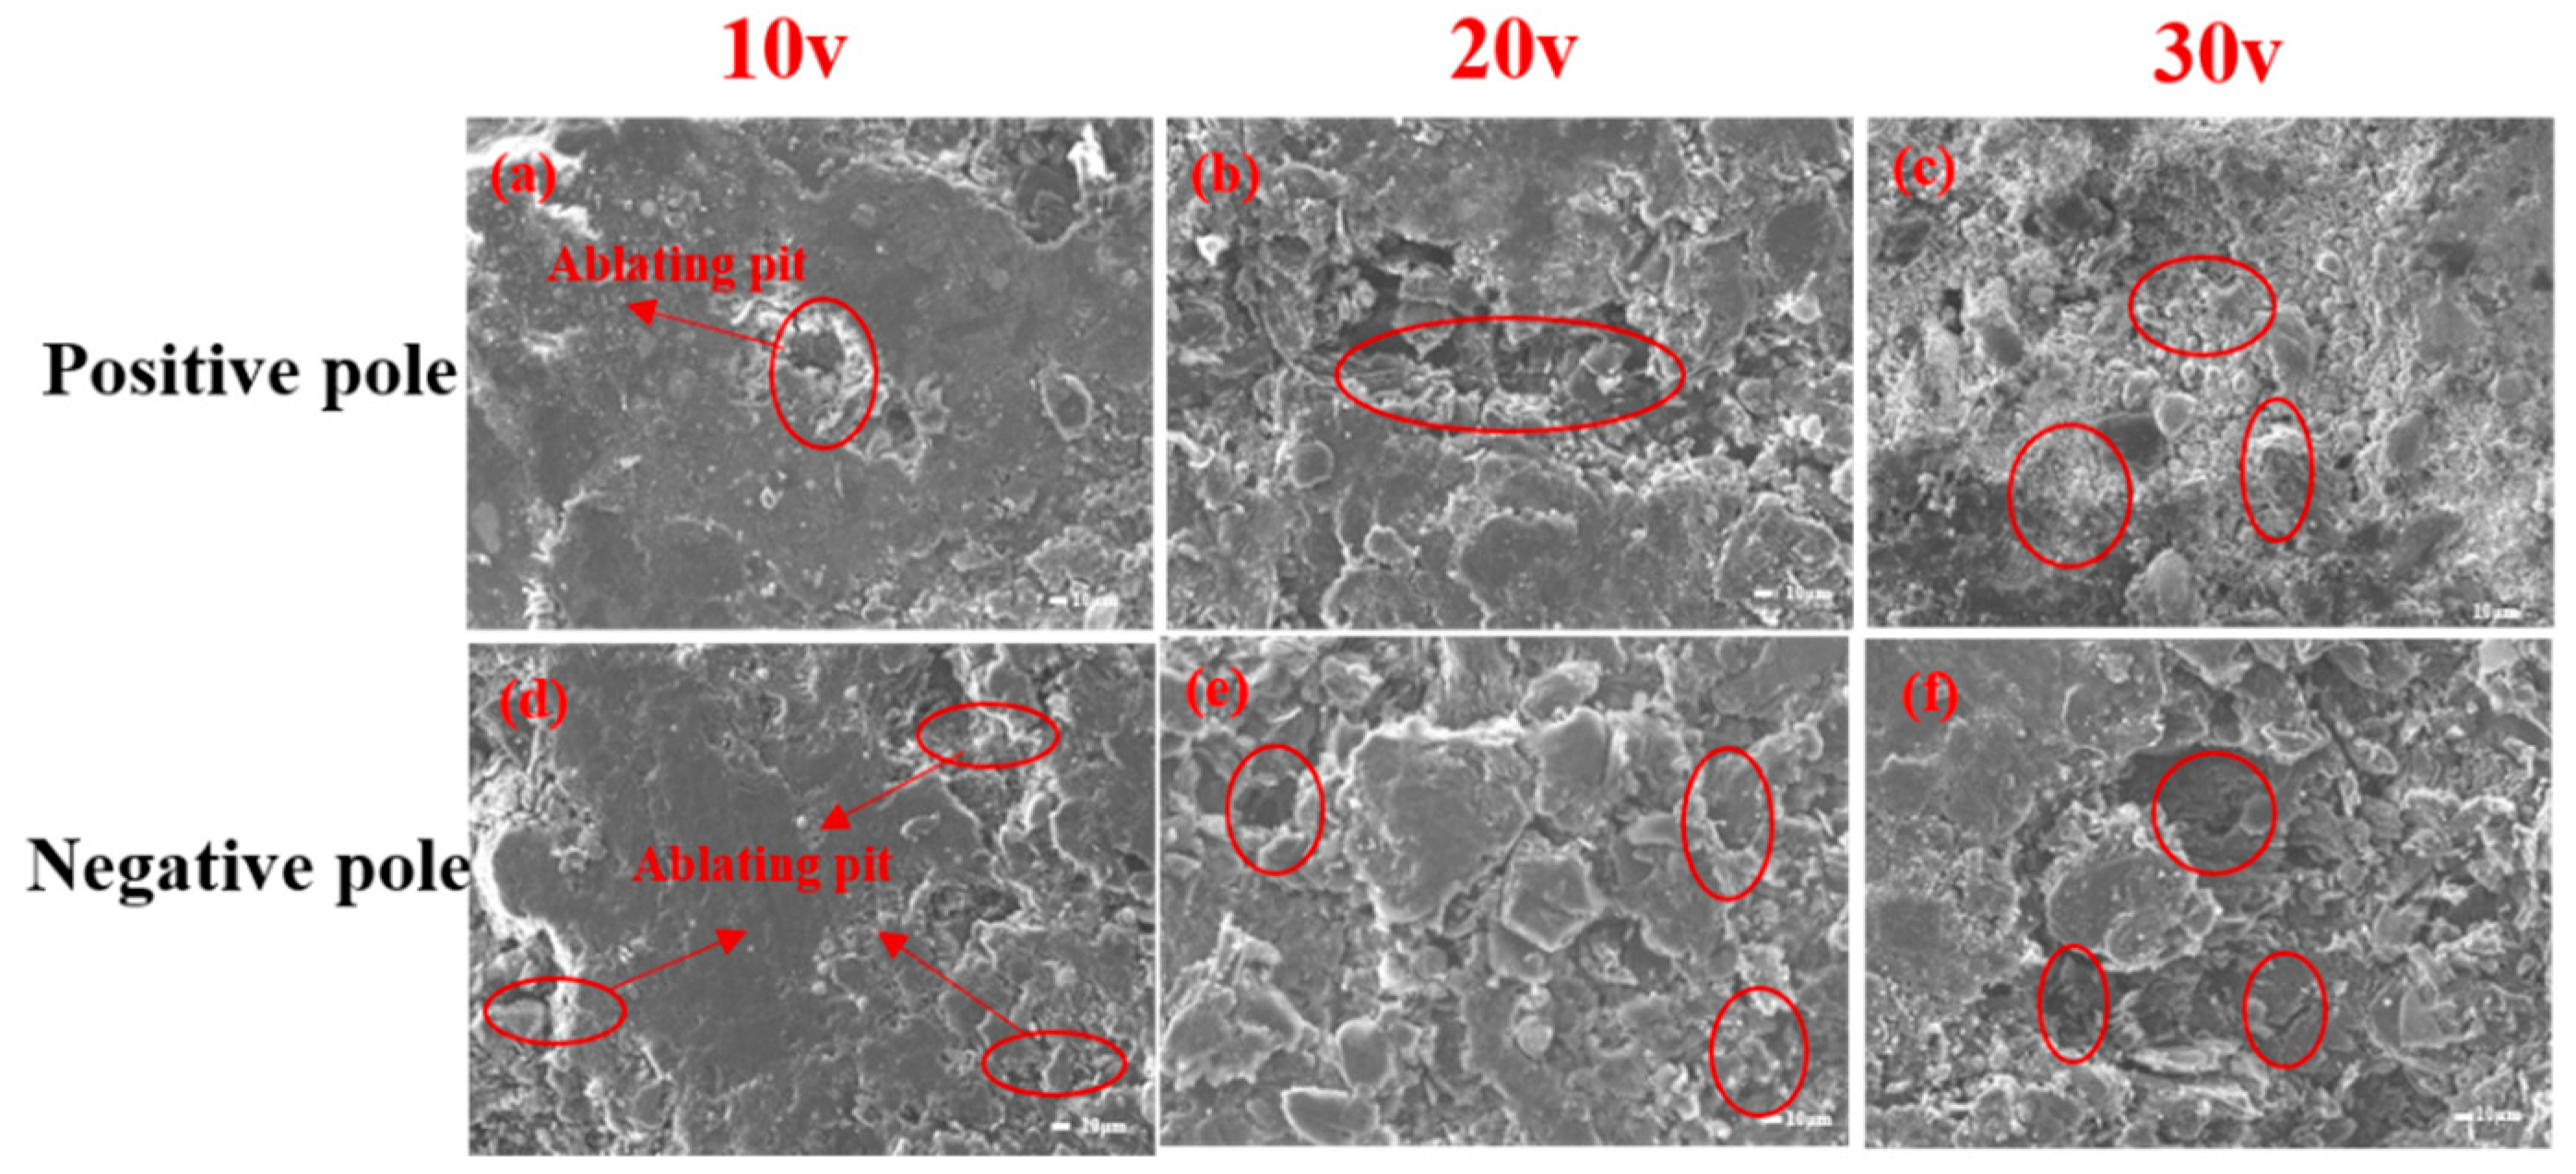
Figure 15.
Are morphology under different current-carrying polarity: (a) Carbon brush connected to the negative electrode; (b) Carbon brush connected to the negative electrode.
Figure 15.
Are morphology under different current-carrying polarity: (a) Carbon brush connected to the negative electrode; (b) Carbon brush connected to the negative electrode.
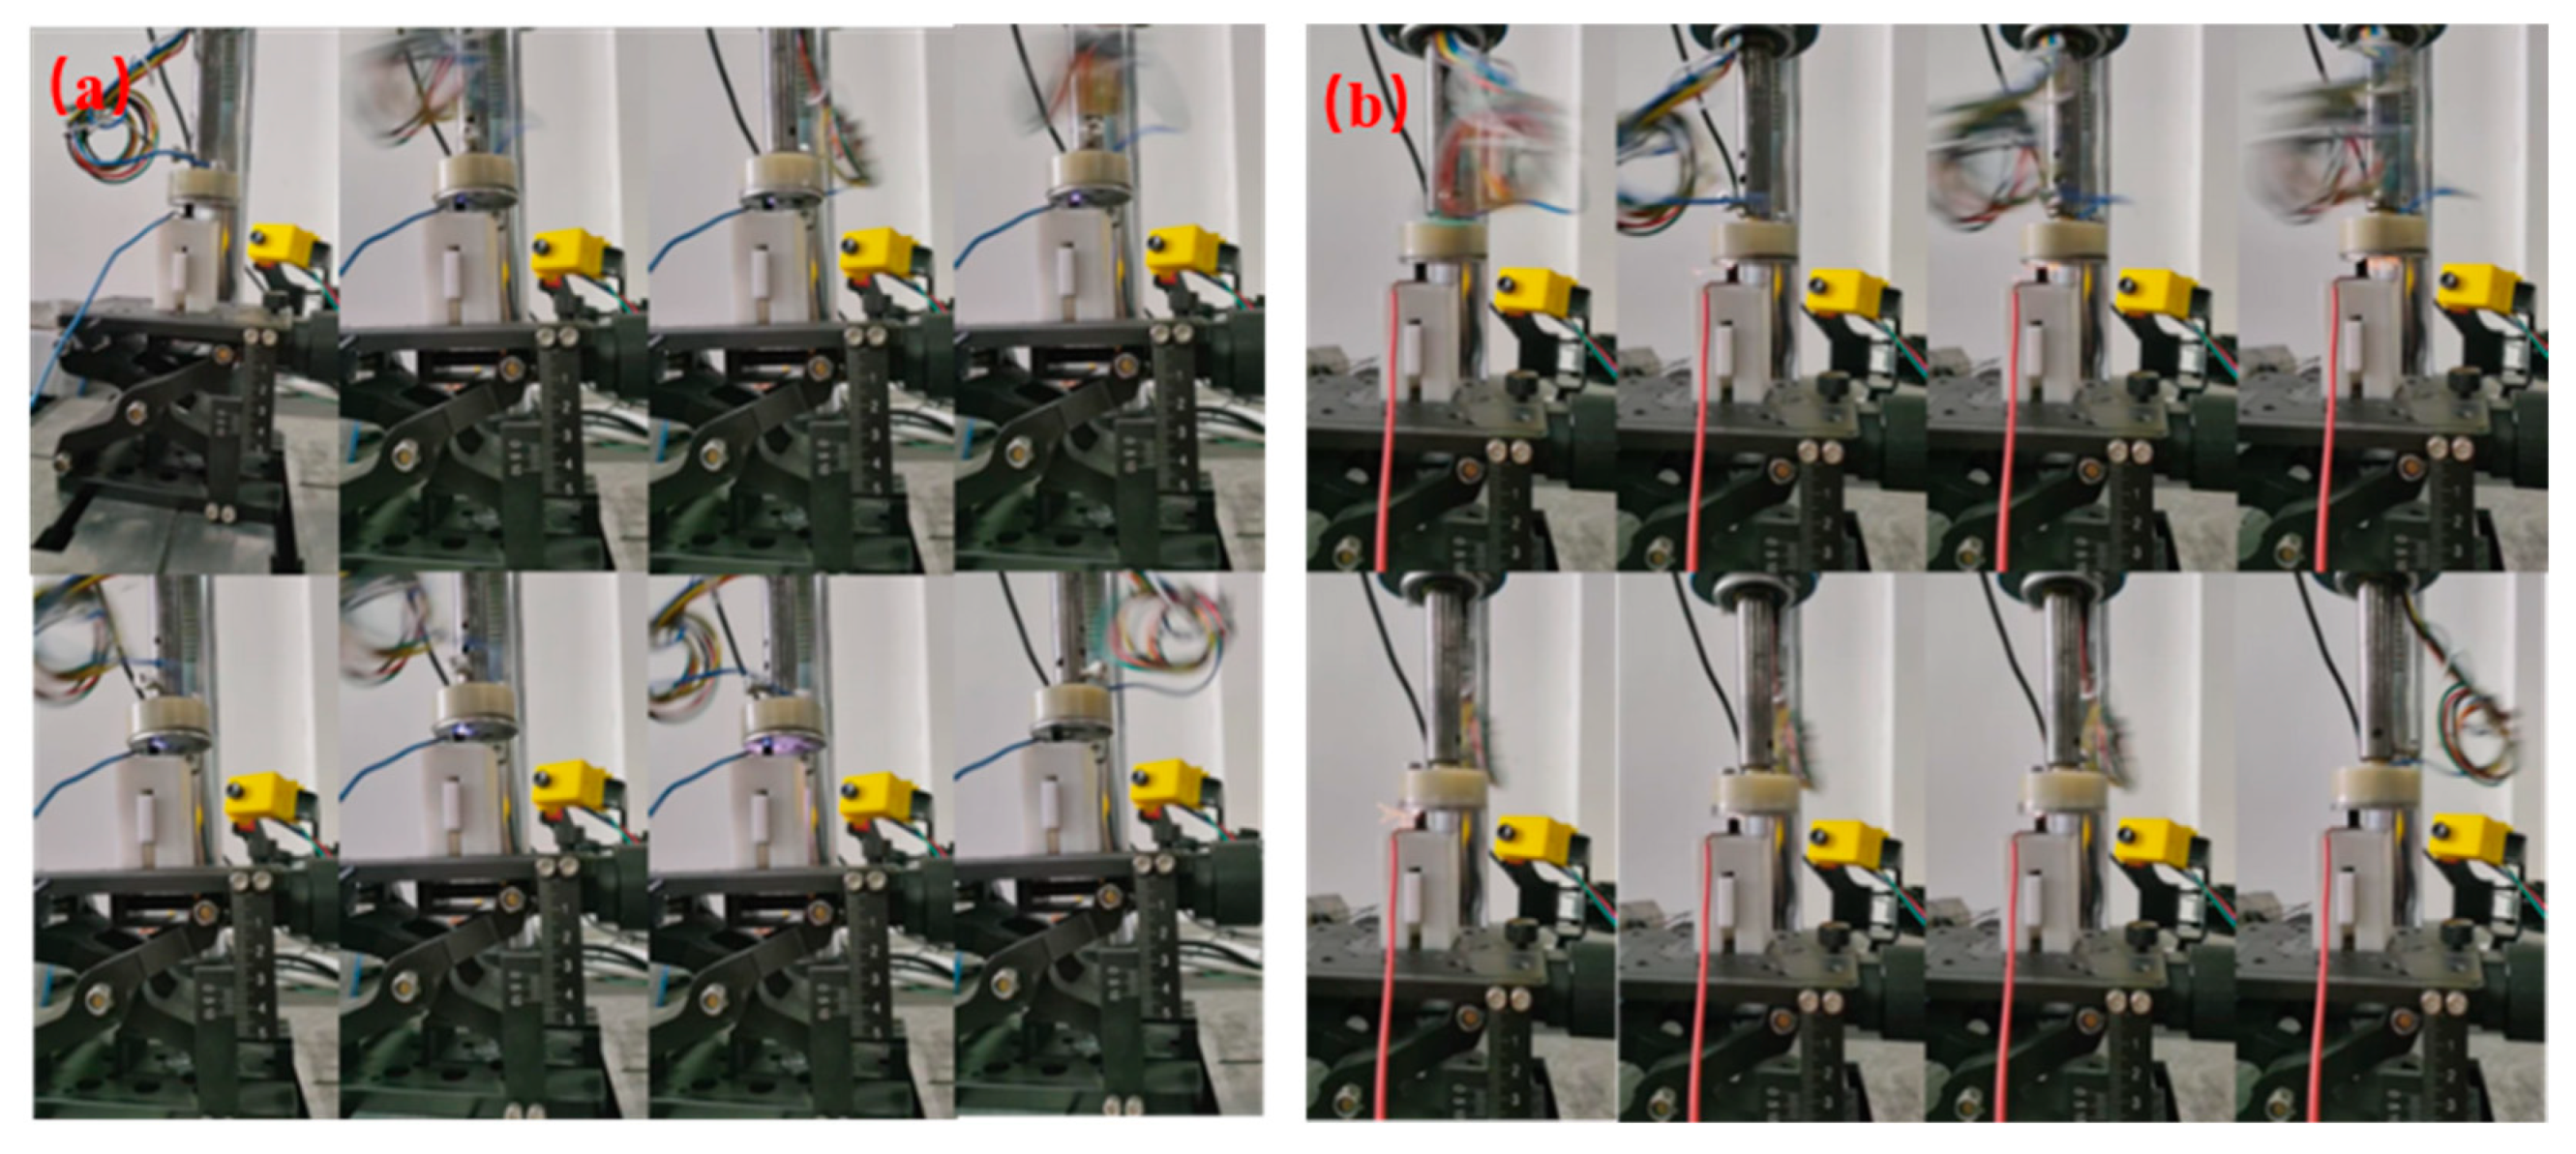
Figure 16.
Mechanism of arc generation under different polarity (a) Brush connected to negative pole; (b) Brush connected to positive pole.
Figure 16.
Mechanism of arc generation under different polarity (a) Brush connected to negative pole; (b) Brush connected to positive pole.
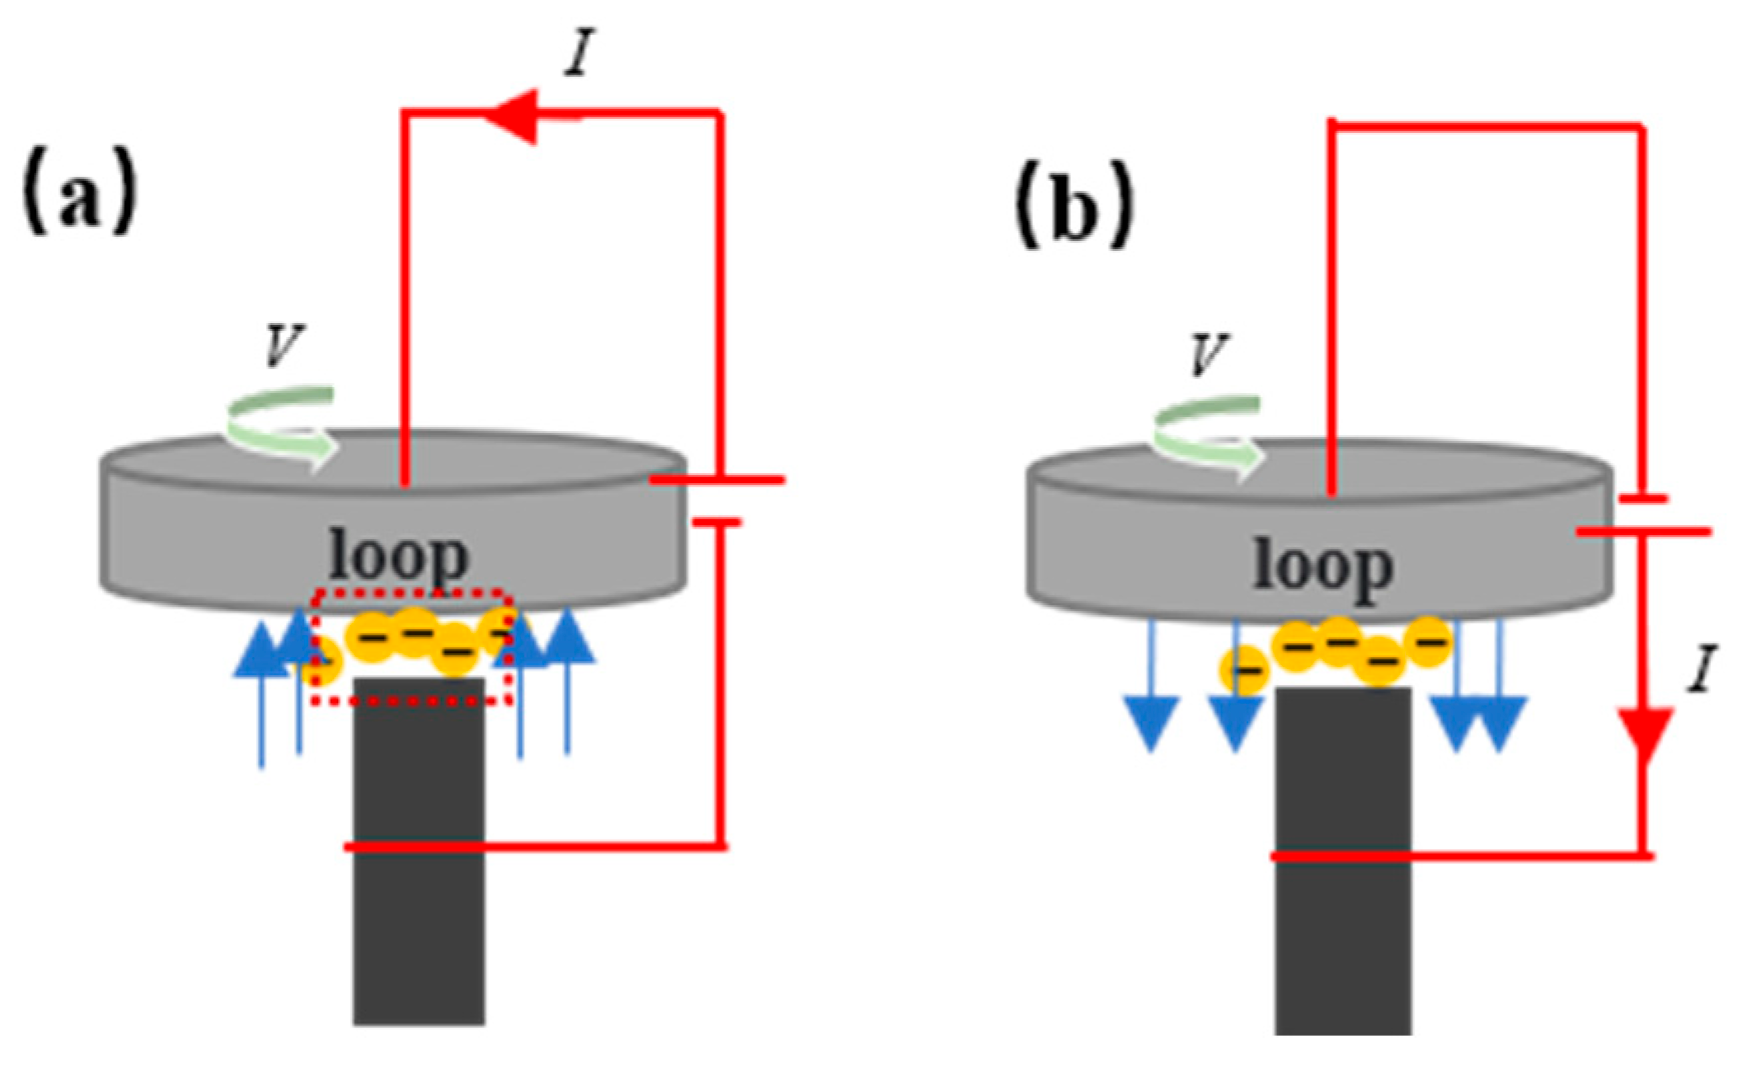
Figure 17.
Temperature and contact resistance variation with different toner coverage: (a) Temperature variation curve; (b) Average temperature variation; (c) Dynamic contact resistance variation curve; (d) Line graph of average contact resistance variation.
Figure 17.
Temperature and contact resistance variation with different toner coverage: (a) Temperature variation curve; (b) Average temperature variation; (c) Dynamic contact resistance variation curve; (d) Line graph of average contact resistance variation.
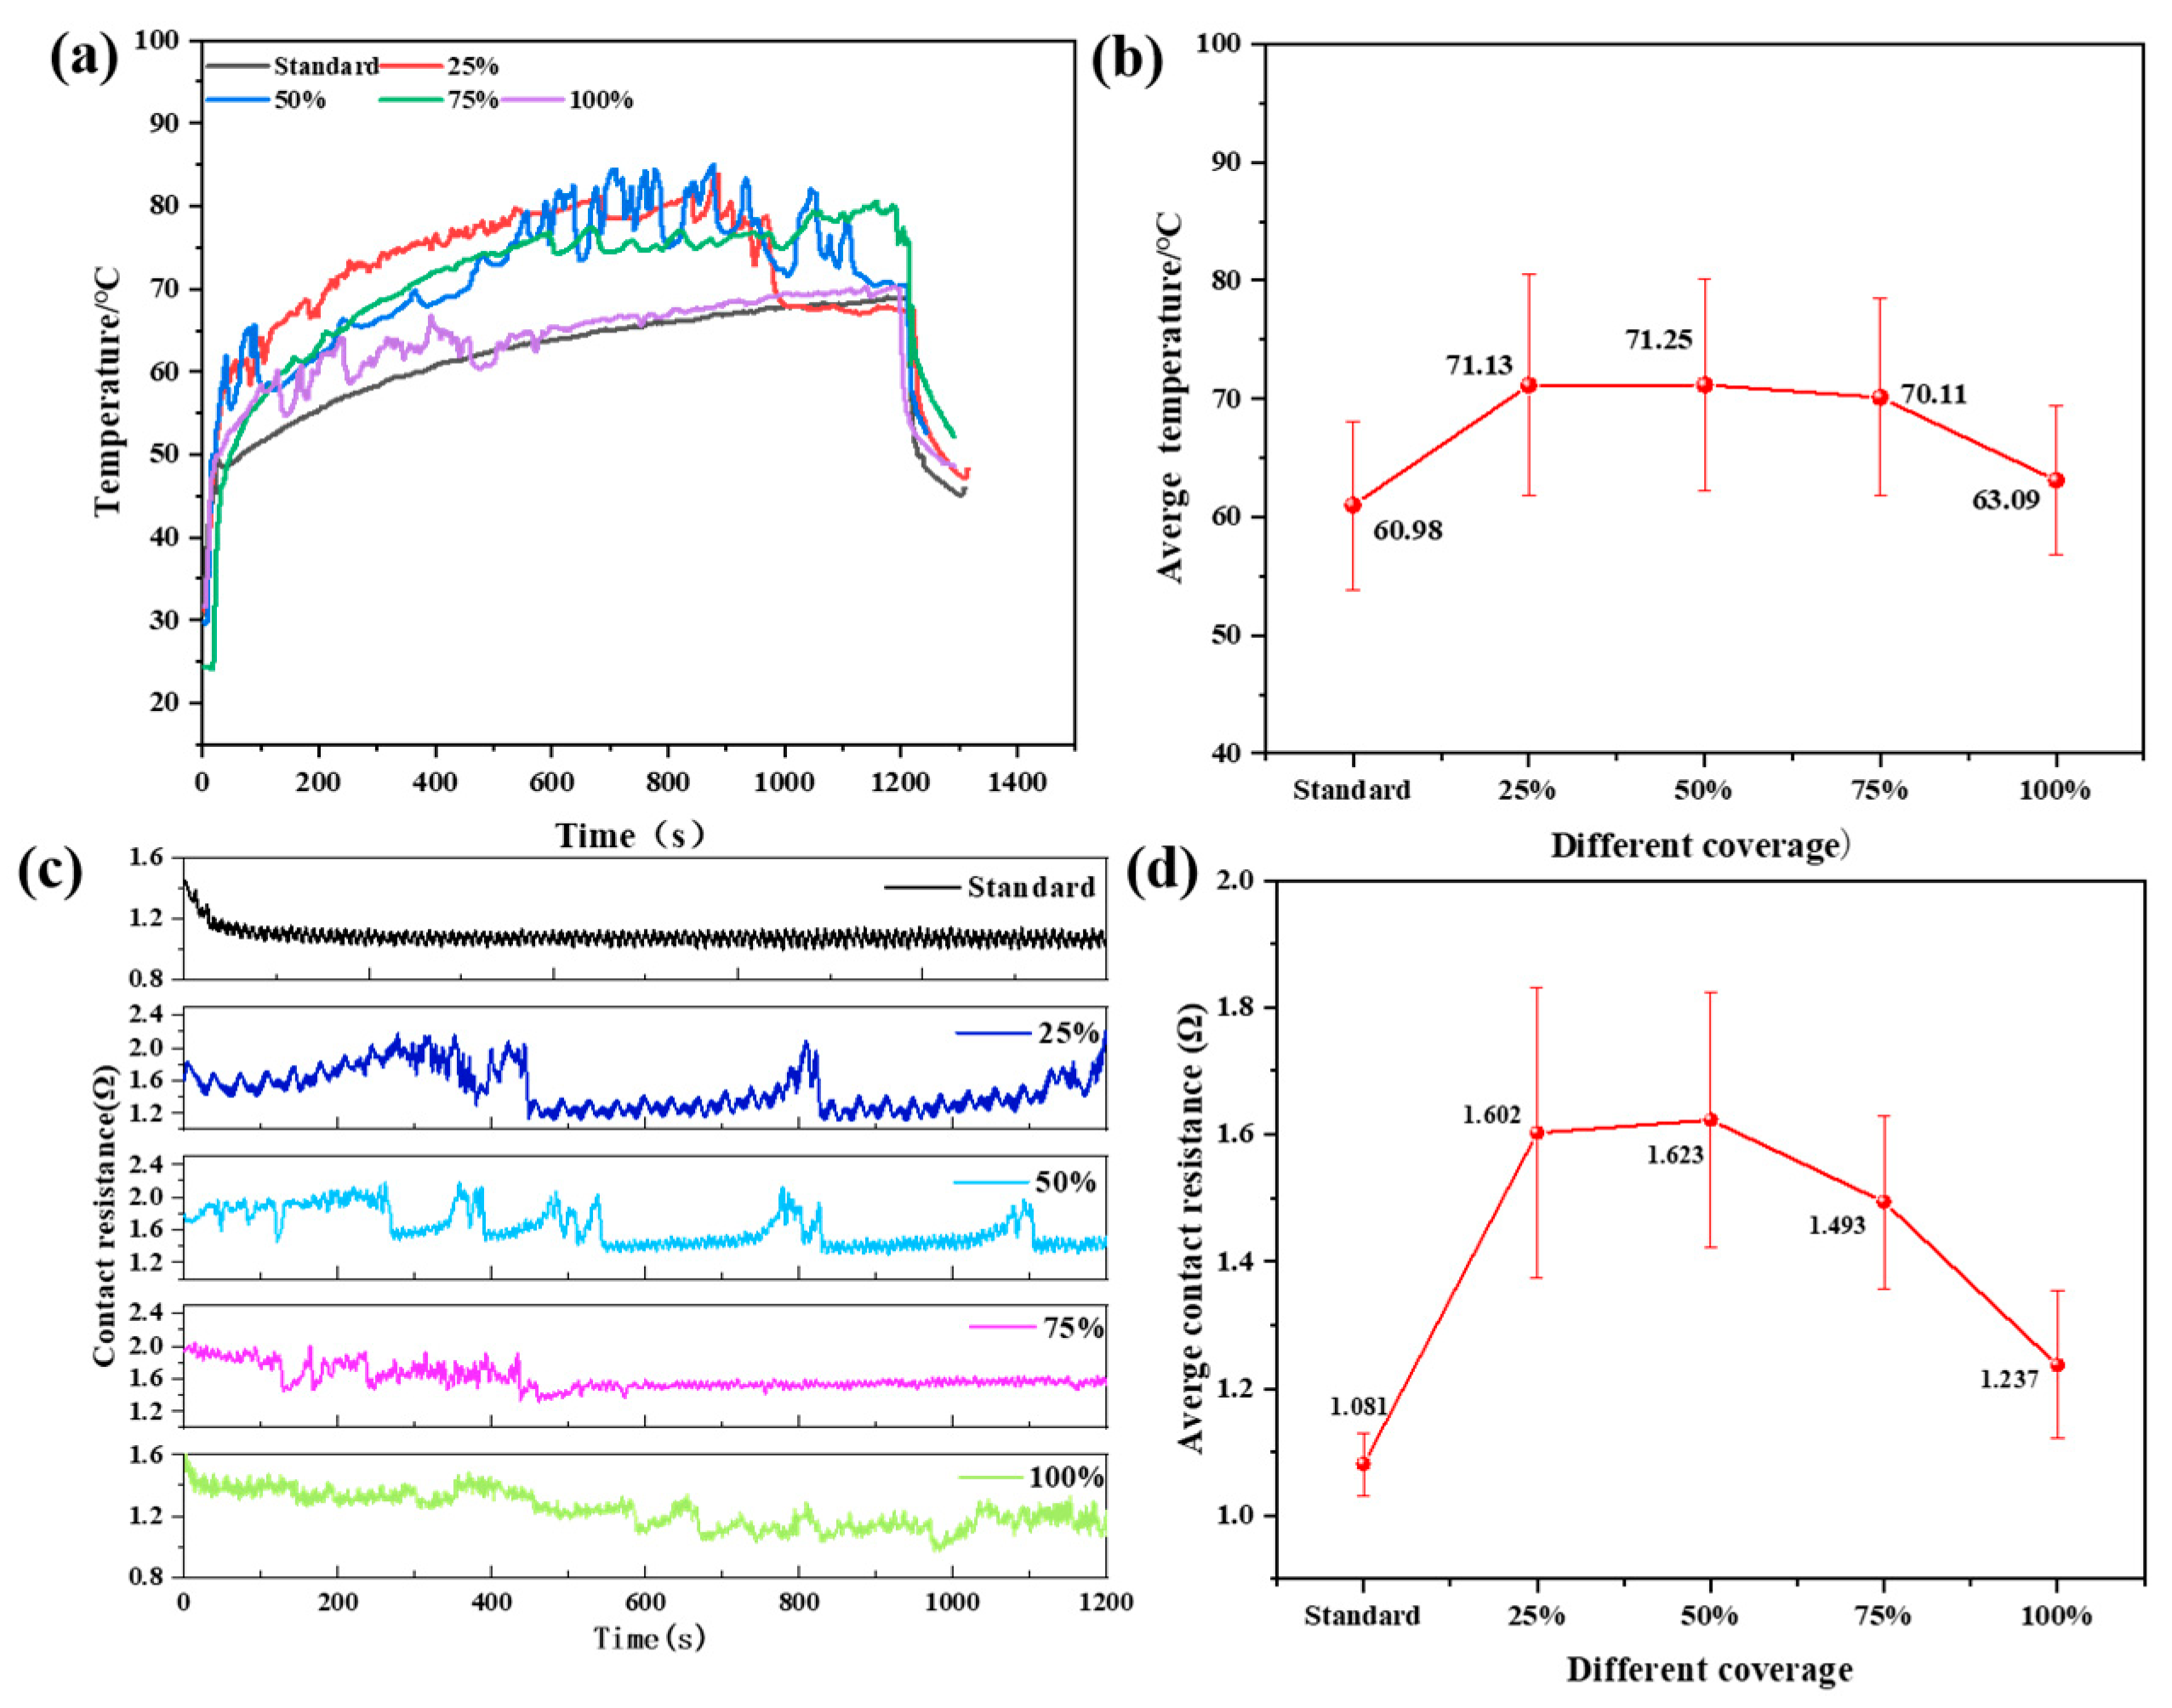
Figure 18.
Variation of brush/ring friction performance with different toner coverage: (a) Dynamic friction coefficient variation curve; (b) Average friction coefficient line plot.
Figure 18.
Variation of brush/ring friction performance with different toner coverage: (a) Dynamic friction coefficient variation curve; (b) Average friction coefficient line plot.
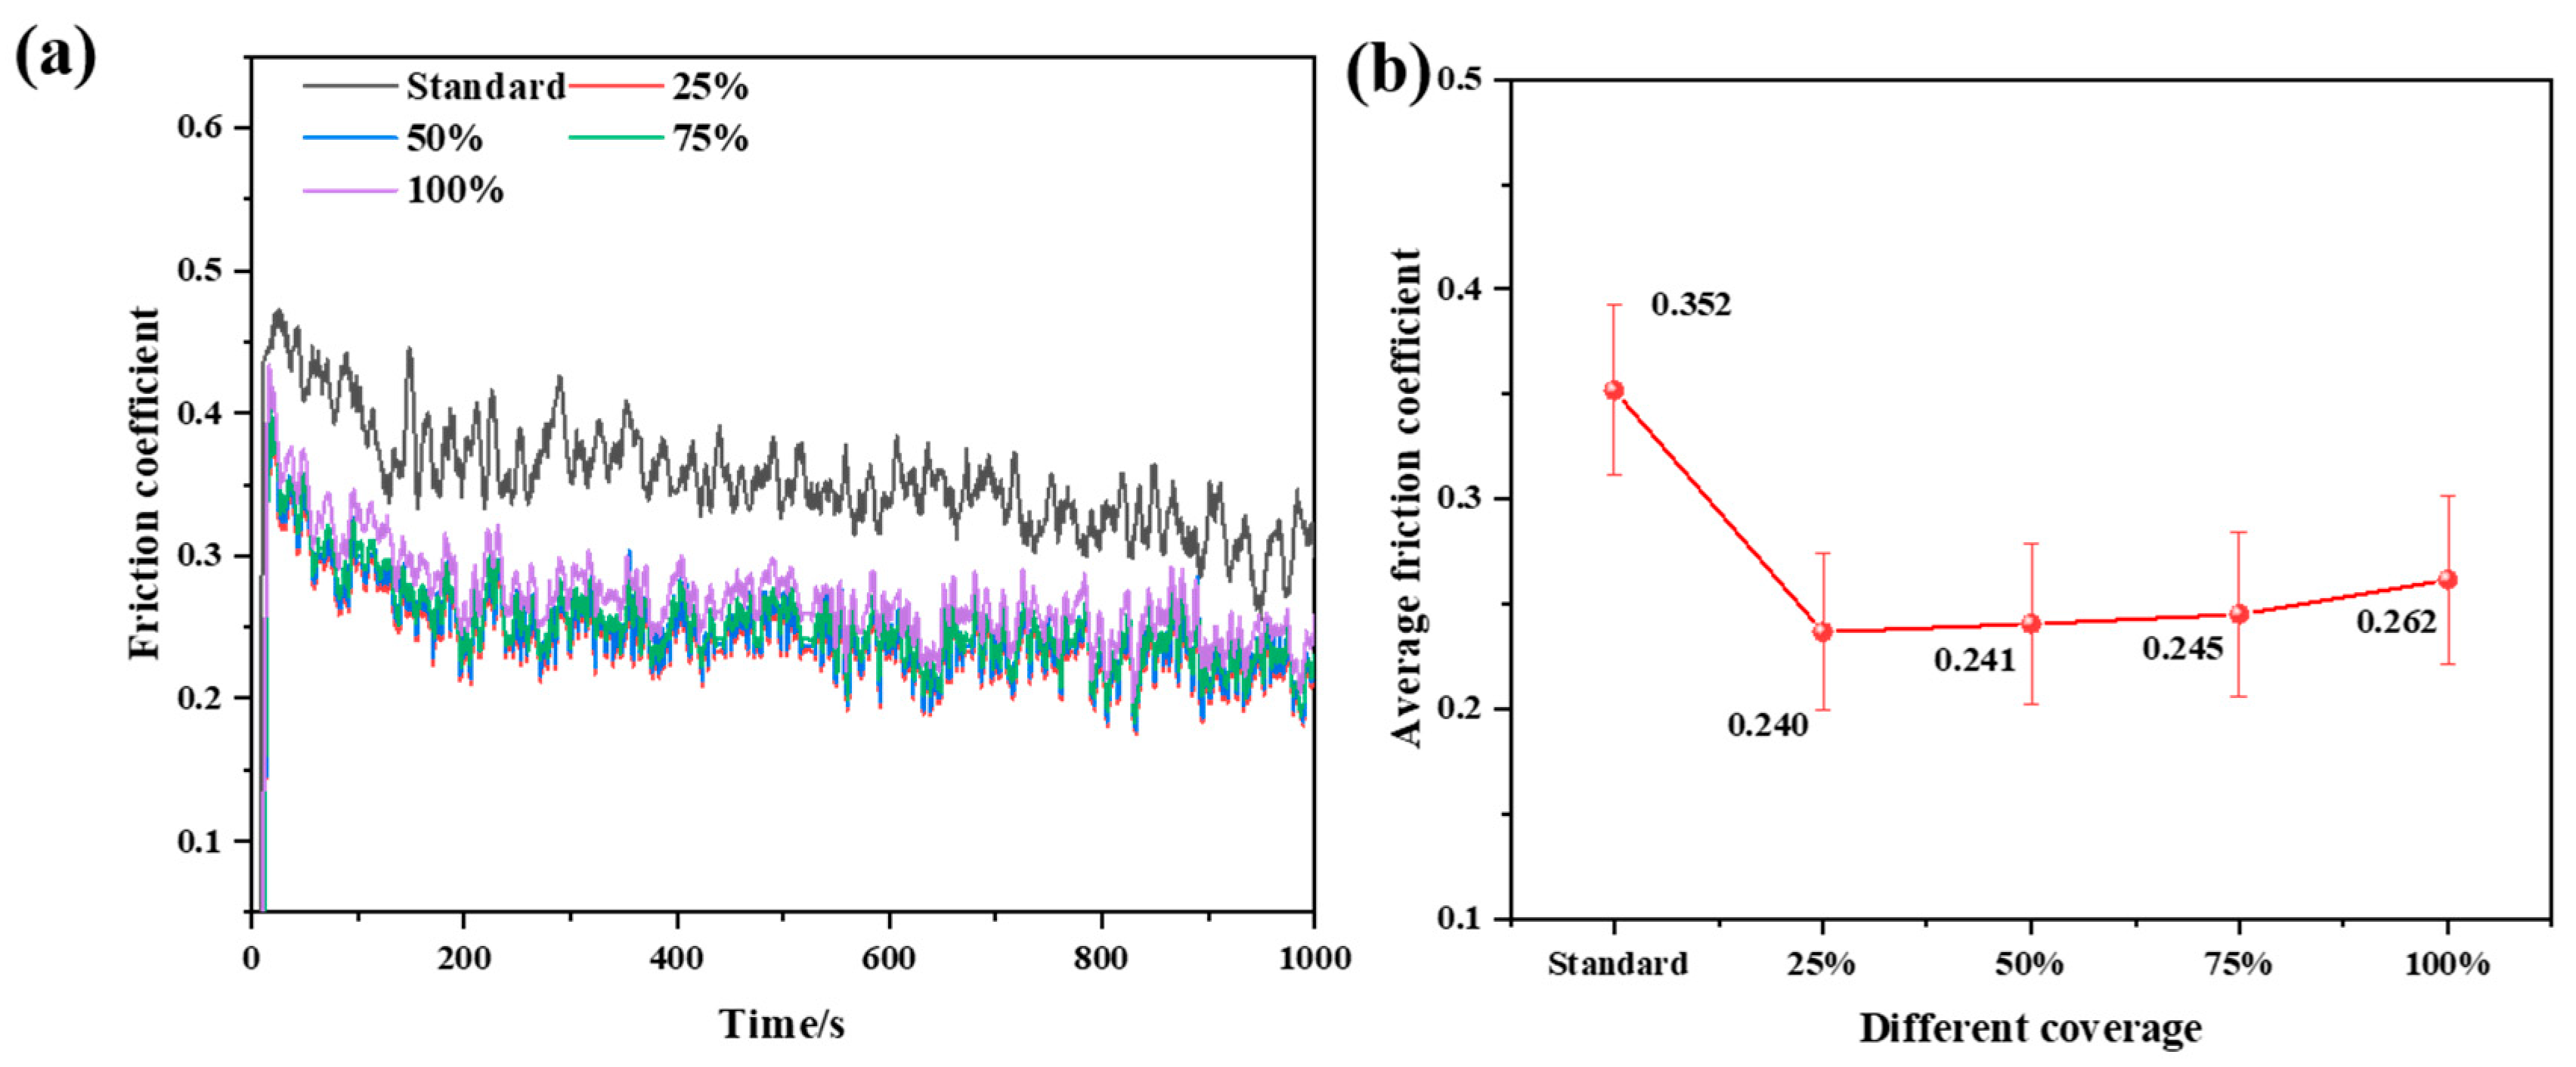
Figure 19.
Temperature and contact resistance variation of pore brushes/rings with different arrangements: (a) Temperature variation curve; (b) Average temperature variation; (c) Dynamic contact resistance variation curve; (d) Line graph of average contact resistance variation.
Figure 19.
Temperature and contact resistance variation of pore brushes/rings with different arrangements: (a) Temperature variation curve; (b) Average temperature variation; (c) Dynamic contact resistance variation curve; (d) Line graph of average contact resistance variation.
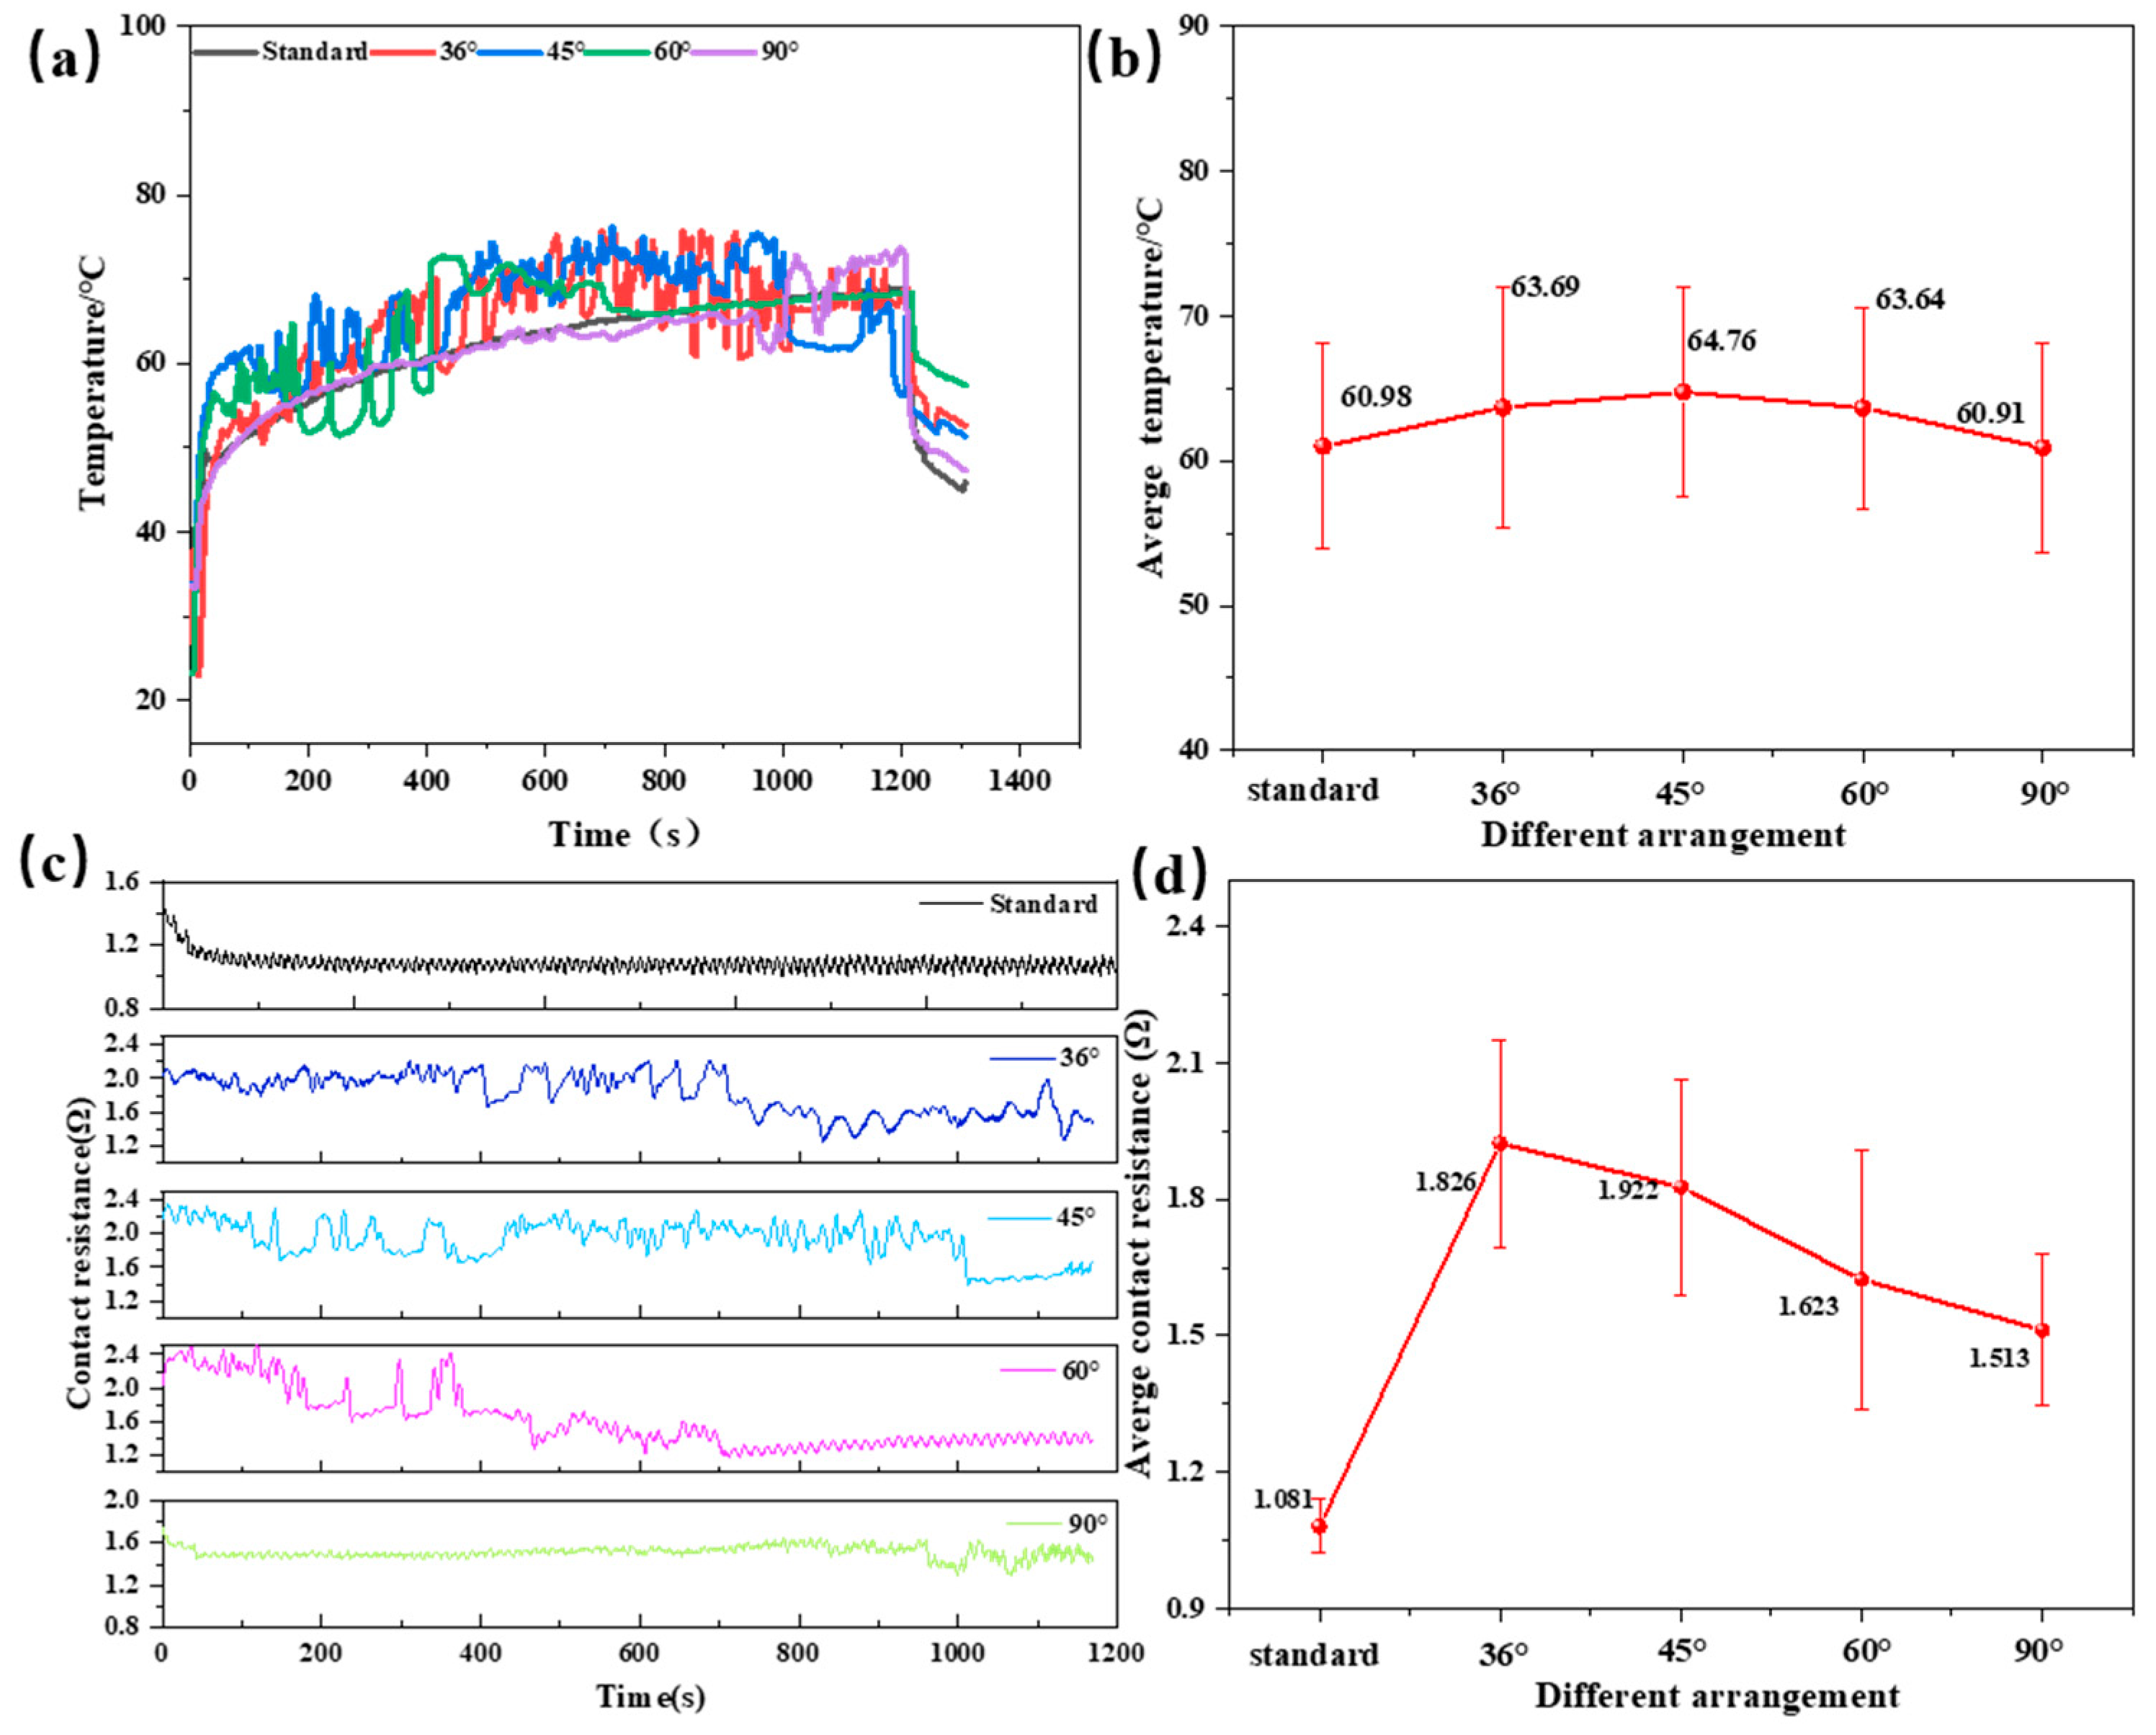
Figure 20.
Variation of friction performance of different arrangement of pore brushes/rings: (a) Dynamic friction coefficient variation curve; (b) Average friction coefficient line plot.
Figure 20.
Variation of friction performance of different arrangement of pore brushes/rings: (a) Dynamic friction coefficient variation curve; (b) Average friction coefficient line plot.
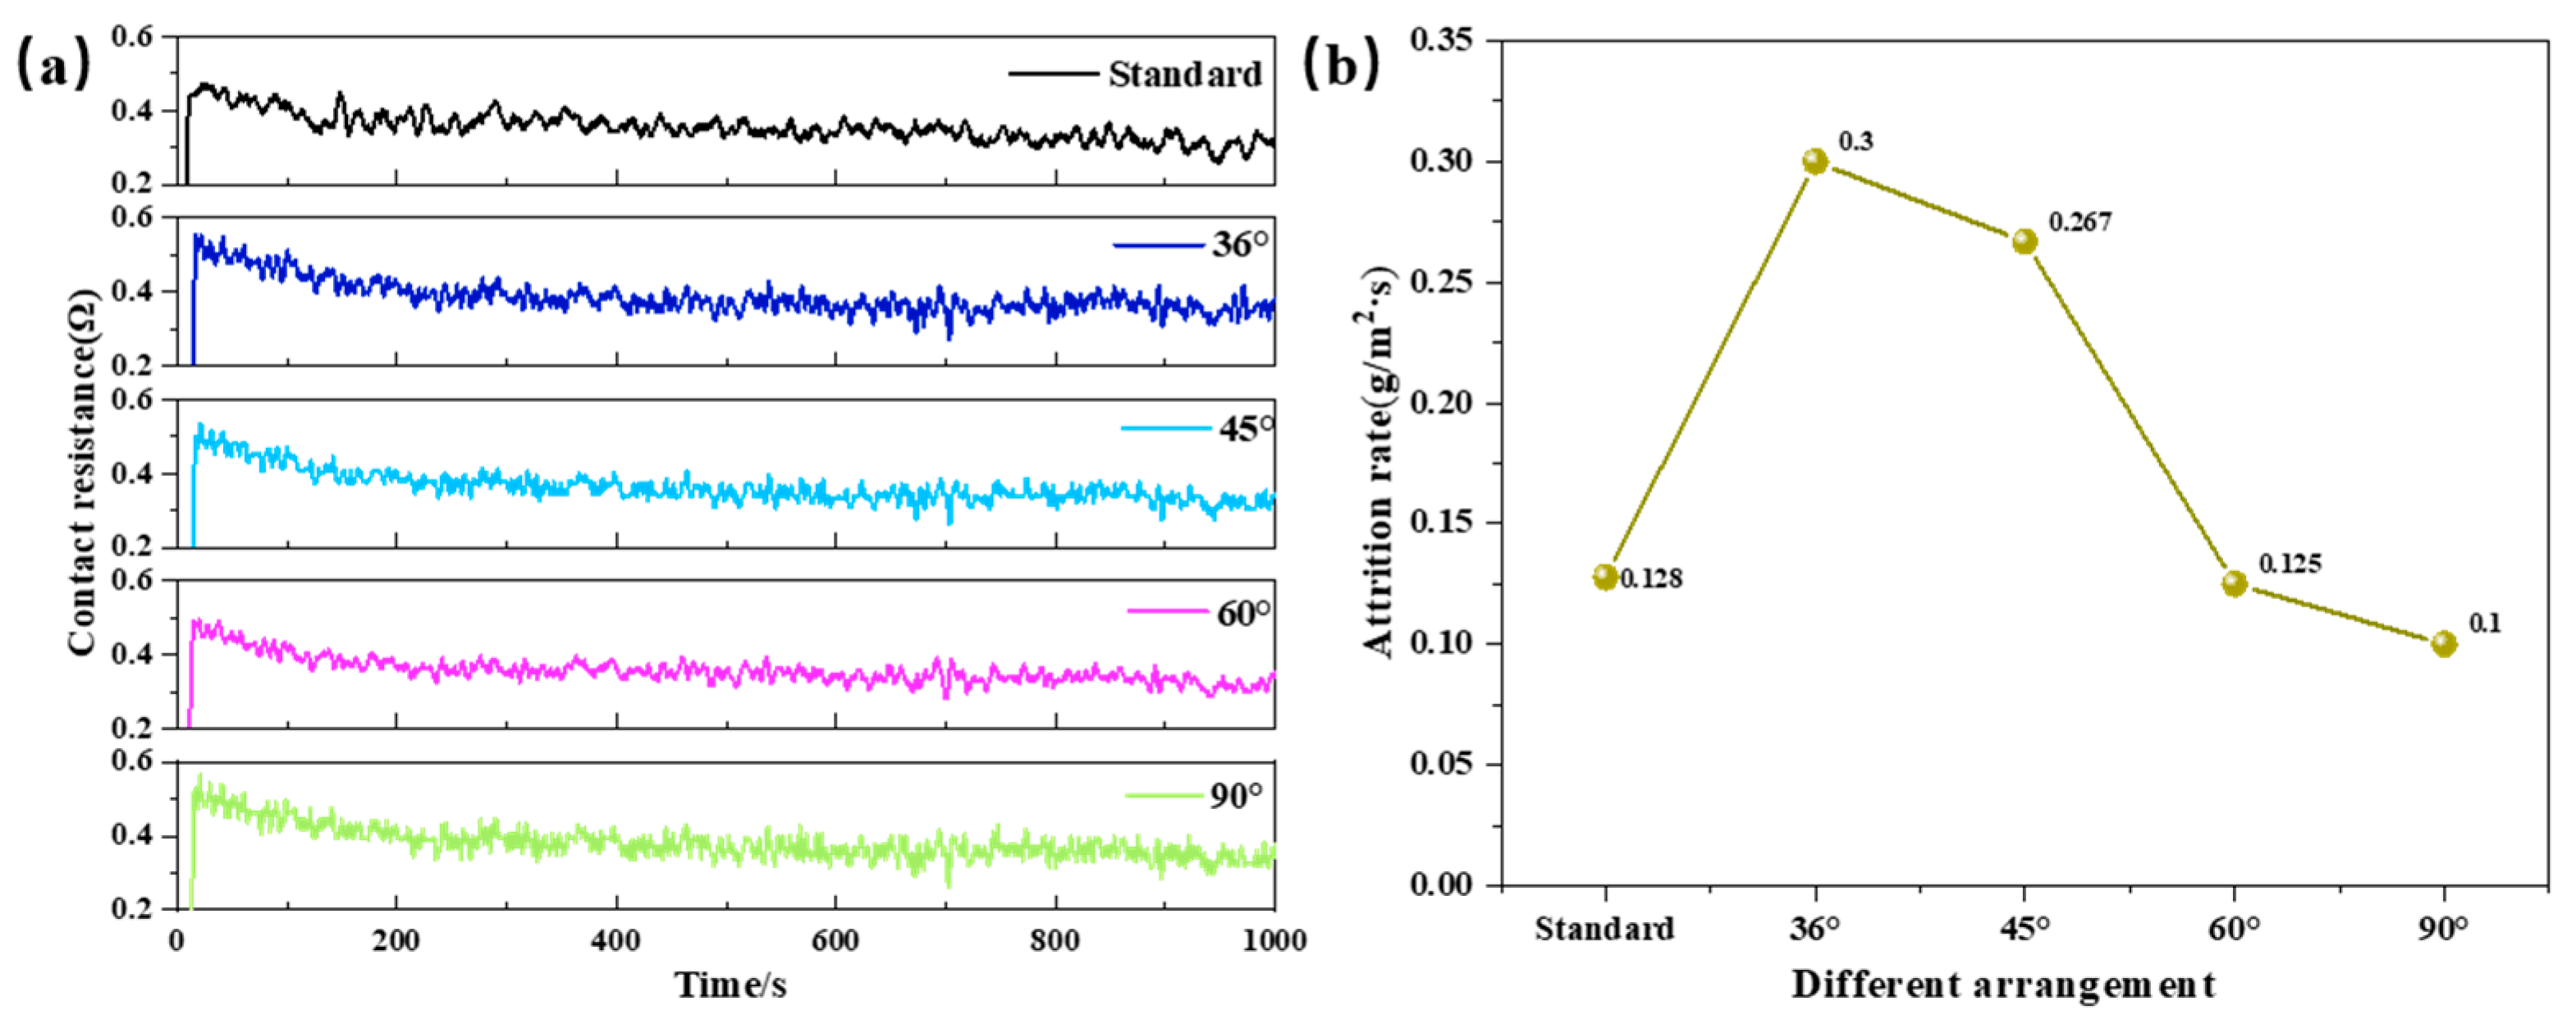

Table 1.
Chemical composition of 45 steel (mass fraction, %).
| C | Si | Mn | S | P | Cr | Ni | Cu | Fe |
| 0.42~0.50 | 0.17~0.37 | 0.50~0.80 | 0.035 | 0.035 | 00.25 | 0.25 | 0.25 | tolerance |
Table 2.
Operational parameters of the load current experiment.
| Running parameter | Parameter variation |
| Current density /A/cm2 | 9 |
| Rotational speed/r/min | 200 |
| Load /N | 3 |
Table 3.
Air contact operating parameters.
| Running parameter | Parameter variation |
| Voltage /V | 10, 20, 30 |
| Rotational speed/r/min | 200, 300, 400 |
| Air gap /mm Testing time /s |
0.3 60 |
Disclaimer/Publisher’s Note: The statements, opinions and data contained in all publications are solely those of the individual author(s) and contributor(s) and not of MDPI and/or the editor(s). MDPI and/or the editor(s) disclaim responsibility for any injury to people or property resulting from any ideas, methods, instructions or products referred to in the content. |
© 2024 by the authors. Licensee MDPI, Basel, Switzerland. This article is an open access article distributed under the terms and conditions of the Creative Commons Attribution (CC BY) license (http://creativecommons.org/licenses/by/4.0/).
Copyright: This open access article is published under a Creative Commons CC BY 4.0 license, which permit the free download, distribution, and reuse, provided that the author and preprint are cited in any reuse.


