
Submitted:
06 November 2024
Posted:
07 November 2024
You are already at the latest version
Abstract
Background/Objectives: Hospitalization among older adults represents an increasingly significant challenge in Mexico due to the high prevalence of chronic diseases and the current strain on the country’s public healthcare services. This study aims to develop a predictive model for hospitalization using longitudinal data from the Mexican Health and Aging Study (MHAS) using the Random Forest (RF) algorithm. Methods: Three machine learning models based on RF were designed and evaluated under different data partition configurations, with and without interaction between inputs. The models were validated using nested cross-validation to ensure robustness and prevent overfitting. Evaluation metrics included sensitivity, specificity, and the kappa coefficient, along with their respective standard errors. Results: The M2 model, which included interaction and a 20% test proportion, achieved the best balance between sensitivity (0.7215, standard error ±0.0038) and specificity (0.4935, standard error ±0.0039), despite the imbalance in the dataset and the heterogeneity of the population. This ability of the model to balance performance allows it to handle the complexities of predicting hospitalizations well across different patient profiles. Conclusions: The M2 model shows great potential for clinical application by enabling the anticipation of hospital demand and enhancing resource planning. This suggests substantial benefits for healthcare systems, particularly in optimizing the care of older adults. Future research will focus on integrating subgroups based on comorbidities and applying advanced techniques for handling missing data to further optimize predictive capacity.
Keywords:
hospitalization
; older adults
; health prediction
; machine learning
; Random Forest
1. Introduction
Hospitalization among older adults is a critical public health issue in Mexico. This age group, currently exceeding 17 million individuals aged 60 and over, is projected to triple in the next 40 years [1,2]. As this population ages, they face increasing health problems, including high prevalence of chronic diseases such as obesity, diabetes, hypertension, and cardiovascular diseases [1]. In 2021, the most prevalent conditions among individuals aged 53 and over were hypertension (43.3%), diabetes (25.6%), and arthritis (10.7%). Additionally, 62.3% of this age group perceived their health status as fair to poor [3]. It has been demonstrated that patients with comorbidities such as hypertension, obesity, and diabetes significantly increase their risk of hospitalization [4].
This situation, combined with the health issues of the rest of the population (individuals < 60 years), anticipates an unfavorable scenario for hospitalization services in Mexico. For instance, Rojas-Martínez et al. [5] estimate that approximately 10 million Mexicans could be at risk of developing diabetes or hypertension over the next decade. Additionally, events such as the COVID-19 pandemic can overwhelm public health services, further limiting timely and adequate medical care for older adults. This situation not only affects the health and well-being of the population but also imposes a significant economic burden due to the high demand for hospital services.
Given these challenges, research on predictive models that anticipate hospitalization in older adults becomes crucial. Such models enable health and stakeholders to make informed decisions, improve planning, and allocate resources more effectively, ensuring more equitable and efficient medical care for this vulnerable group.
Several studies have developed predictive health models for various prediction objectives and application scenarios. For example, Carrillo-Vega et al. [4] analyzed risk factors for hospitalization and mortality in COVID-19 patients in Mexico, using two multiple logistic regression models. Their results indicated a significant increase in the risk of hospitalization in individuals reporting hypertension, obesity, and diabetes (p<0.01), compared to other combinations of chronic diseases. They also identified that men are 1.54 times more likely to be hospitalized than women (p<0.001, 95% CI 1.37–1.74), and that individuals aged 75 and older have a higher risk of hospitalization compared to those aged 49, with an odds ratio (OR) of 3.84.
Although logistic regression models are useful to identify associations, their limitation in capturing complex variable relationships can reduce predictive effectiveness, as they rely on an assumed linear relationship between independent variables and the log odds of the outcome [6]. In this regard, recent advances in machine learning (ML) have overcome these limitations, allowing for the analysis of large volumes of longitudinal data and capturing complex patterns in health determinants.
For instance, Kraus et al. [7] proposed an ML-based approach to predict the Time-Up-and-Go (TUG) test in older adults with orthopedic disabilities. In their study, they used 67 multifactorial parameters unrelated to mobility and six feature selection algorithms in the preprocessing phase. Subsequently, they trained four ML models—generalized linear model, support vector machine (SVM), random forest (RF), and XGBoost—to predict the time required for the TUG, using five-fold internal cross-validation resampling and splitting the data into an 80/20 ratio for training and validation. The RF algorithm demonstrated the best performance among the four. This study highlights the potential of ML models for risk stratification in clinical settings, emphasizing the need to incorporate real-time clinical data and expand the dataset size to improve prediction accuracy.
Another case of using ML in the health field is that of Song et al. [8], who demonstrated the advantages of ML in predicting hospitalizations in patients with chronic diseases, revealing how health factors interact non-linearly to influence hospitalization risk. They implemented four machine learning approaches: regularized logistic regression, SVM, RF, and neural networks, to predict hospitalization in patients over 65 years old with COVID-19. The RF model achieved the best performance, with an AUC of 0.83, due to its ability to capture complex relationships between variables and avoid overfitting by combining multiple decision trees. Their findings highlight the potential of predictive models not only to identify individuals at risk but also to enable early interventions that prevent complications.
Taloba et al. [9] present a comparative analysis of linear regression, Naive Bayes, and RF models to predict hospitalization and healthcare costs, using data from patients with risk factors such as body mass index (BMI) and other demographic characteristics. Their results show that the linear regression model had the best performance, achieving a predictive accuracy of 97.89%. However, a key limitation of the study is its exclusive focus on the accuracy metric; in health prediction with imbalanced data, metrics such as sensitivity and specificity are essential to measure a model’s ability to correctly identify both positive and negative cases.
In the study by Kandel et al. [10], a predictive model for hospitalization of patients in skilled nursing facilities was used, employing the LightGBM algorithm, known for its high computational efficiency in handling large volumes of data. They identified important risk factors, such as comorbidities and levels of dependency in daily activities, providing a valuable tool for resource planning and management in these facilities. LightGBM achieved good results in predicting hospitalizations, using metrics such as F1-score, sensitivity, and positive predictive value. However, the authors noted that while LightGBM is accurate, its implementation requires careful hyperparameter tuning, which increases the risk of overfitting and adds complexity. In contrast, more robust and simpler methods, such as RF, offer a better balance between accuracy and ease of implementation, making it more suitable for clinical applications.
The study by Friesner et al. [11] focus on the development and validation of ML models based on physical activity data collected through wearable devices, aiming to predict unplanned hospitalizations during concurrent chemotherapy and radiotherapy (CRT). The analysis included 214 patients with various types of cancer, employing approaches such as regularized logistic regression, RF, and neural networks to assess hospitalization risk. The results showed that the regression model achieved an area under the curve (AUC) of 0.83, followed by the neural network with an AUC of 0.80 and the RF with an AUC of 0.76. This suggests that, although the regression model had the best performance, the other models were also effective. The study highlights the importance of including physical activity data in models to improve the identification of patients at risk of complications during oncological treatments and facilitate preventive interventions. For more insights, refer to the work of Durán-Vega et al. [12], which emphasizes the significance of wearables in health monitoring. However, the study by Friesner et al. [11] has some limitations. Firstly, the data collection period was only one month, which may not be sufficient to train a robust model. Additionally, the study was conducted in an academic setting, which could introduce selection biases and limit the generalizability of the findings. The absence of more complex clinical data may also have affected the model's predictive capacity. These limitations highlight the importance of considering multiple data dimensions in future studies, especially for developing predictive models in older adult populations.
Another relevant study is the work by Ermak et al. [13], who evaluated ten machine learning models to predict hospitalizations in patients with coronary artery disease, highlighting CatBoost for its ability to handle imbalanced data and categorical variables, achieving an AUC of 0.875. Additionally, the authors emphasize the use of activation thresholds, such as the Youden index, and the application of techniques to handle missing data, such as imputation and resampling, which ensure the model’s generalizability. However, a significant limitation of this study was that the selection of the best model was based solely on AUROC, without considering metrics such as sensitivity and specificity that are crucial in medical prediction. Furthermore, the use of techniques like RandomGridSearch and multiple iterations in hyperparameter optimization adds complexity to the model. This complexity, combined with CatBoost’s inherent complexity and lower interpretability, presents significant challenges for its adoption in clinical settings, where simplicity and speed are essential [14].
Finally, a recent study that highlights the advantages of ML models in the health domain is the work by Amanollahi et al. [15], which conducted a systematic review (using the PRISMA model for systematic reviews and meta-analyses (Page et al. [16]) on the prediction of relapses, hospitalizations, and suicides in patients with bipolar disorder. The review included 18 studies with over 30,000 patients, noting that RF, SVM, and logistic regression are the most used models in the studies. The authors emphasize the robustness of RF in handling imbalanced and noisy data, which reduces prediction error and makes it a reliable option in clinical contexts, where data are often quite complex and unpredictable. Additionally, they highlighted the importance of applying nested cross-validation, a technique rarely used in the reviewed studies, to ensure more reliable results. Regarding evaluation, Amanollahi et al. [15] stress the importance of using metrics such as sensitivity and specificity to predict adverse clinical events.
The objective of this study is to develop a predictive model for hospitalizations in older adults using longitudinal data from the Mexican Health and Aging Study (MHAS) [17] and machine learning techniques. This model will enable the identification of individuals at higher health risk and anticipate medical care needs. In a context where the demand for hospital services exceeds the healthcare system’s capacity, the implementation of predictive models is crucial to address these challenges and enhance resource planning. The combination of advanced age and comorbidities in the Mexican population presents a significant challenge for the healthcare system, and the use of data analysis and ML tools is key to ensuring that older adults receive the necessary care during critical moments.
2. Materials and Methods
The objective of this study is to develop a predictive model to identify future hospitalizations in older adults. To achieve this, a prediction strategy was designed using the RF algorithm and the MHAS dataset [17]. The MHAS dataset comes from a national longitudinal study, we are using information from the waves: 2012, 2015, and 2018. MHAS includes socioeconomic, health, and lifestyle information of individuals 50 years and older, residing in various states of Mexico.
The RF algorithm was selected for this study due to its ability to handle datasets with multiple predictor variables and its robustness against overfitting, a crucial aspect in medical applications [15]. Additionally, this algorithm is particularly suitable for processing binary, categorical, and ordinal variables, which constitute the majority of our dataset. Not assuming linear relationships between variables allows for capturing more complex interactions among predictive factors, regardless of the variables used [8,18]. Therefore, RF is essential for predicting events such as hospitalizations, where the factors influencing the likelihood of hospitalization are complex and often do not follow linear patterns. Factors such as age, health status, access to medical services, and socioeconomic conditions interact in ways that cannot always be represented by simple cause-and-effect relationships, making RF the best option for this analysis.
2.1. General Review of the Dataset
The dataset used in this study is derived from the Mexican Health and Aging Study (MHAS), a national longitudinal study of adults aged 50 and older, partially funded by the National Institutes of Health (NIA), the National Institute on Aging (NIH) and the Mexican National Institute of Statistics and Geography (INEGI). Data collection waves were conducted in 2001, 2003, 2012, 2015, 2018, and 2021. The study's protocols and instruments are highly comparable to those used in the U.S. Health and Retirement Study (HRS), ensuring cross-national comparability. The study included private households with at least one resident aged 50 or older, randomly selecting one eligible participant per household. If the selected participant was married or cohabiting, their spouse was also recruited, regardless of age [17].
For the purposes of this research, the MHAS dataset underwent a pre-processing phase specifically designed and executed to meet the study's requirements. This phase included the removal of empty fields, handling incomplete data through deletion, selection of individuals aged 50 and older, and the appropriate encoding of each input variable (e.g., binary and ordinal categorical encoding). After this pre-processing stage, the final dataset comprised 30,603 rows and 17 columns. A description of these columns is provided below:
- Fourteen columns correspond to the predictor variables: sex, age, diabetes, stroke, educational level, place of residence (urban or rural), living with someone, body mass index, hypertension, level of physical limitation, falls, access to public health services, smoking history, and current alcohol consumption;
- Two columns represent the individual’s ID and the year in which the information was collected;
- Finally, the column for the target variable is included: hospitalization in the last 12 months. The MHAS dataset shows a marked imbalance in this variable (9.9% in 2012, 12.8% in 2015 and 15.6% in 2018 were hospitalized), which must be considered in the machine learning model design to avoid biased results.
A descriptive summary of the dataset is presented in Table 1. The data are organized by year and expressed as percentages for each variable used in the machine learning model.
The analysis focused on data from the years 2012, 2015, and 2018 to maintain a consistent temporal pattern. Earlier waves from 2001 and 2003 were excluded due to the significant gap between them and subsequent years, which could disrupt the temporal continuity necessary for robust longitudinal analysis. Additionally, the 2021 wave was excluded because the COVID-19 pandemic represents a different scenario for hospitalization. By focusing on these three years, the model was able to better capture the progression of hospitalization risks over time.
2.2. Designs of Machine Learning Models
To predict hospitalizations, three machine learning models were constructed using the RF algorithm (M1, M2, and M3), each focused on different data sets. The data partitions for training and testing were made using information from different years. The configuration of the models was as follows:
- Model M1: Predicts hospitalization events in the three years studied (2012, 2015, and 2018) for each individual;
- Model M2: Predicts hospitalization events in 2015 and 2018 using the data available from 2012 as part of the training sample;
- Model M3: Predicts hospitalization events in 2018, using data collected in 2012 and 2015 as part of the training set.
This combination in model design allows for the evaluation of the predictive capacity of the RF algorithm in different temporal scenarios, providing a comprehensive view of the evolution of hospitalizations throughout time.
2.3. Validation of Machine Learning Models
To ensure the robustness of the models and avoid overfitting, a nested cross-validation scheme was implemented. This method consists of an inner cross-validation and an outer cross-validation, applied as follows:
Inner cross-validation: Used to estimate the hyperparameters of the RF algorithm. Instead of using the traditional k-fold cross-validation, 10 random partitions of the dataset were employed.
Outer cross-validation: Once the optimal hyperparameters were selected, a second cross-validation was performed to evaluate the model’s performance. Ten random partitions were also used to measure the model’s generalization capacity on unseen data, applying the training and testing scheme on external partitions different from those used in the inner validation. The average of these 10 partitions is reported as the predictive capacity of the models.
This nested procedure ensures that the hyperparameters are not overfitted to a particular subset of data, improving the model’s predictive capacity by evaluating its performance across different data partitions.
In the outer cross-validation four data partitioning for testing and training were proposed as a complementary prediction strategy: 10% - 90%, 20% - 80%, 30% - 70%, and 40% - 60%. By testing these different proportions, a broader and more robust view of the model’s performance is obtained, allowing for the identification of the optimal configuration for different scenarios and ensuring greater reliability in predictions.
2.4. Study Evaluation Metrics
The primary objective of the experiments was to identify the model that optimizes the balance between sensitivity and specificity, with the aim of minimizing both false positives and false negatives, a critical factor in medical applications such as hospitalization prediction [cite source]. Therefore, the performance of the models was evaluated using the following metrics:
- Kappa coefficient: A statistic that measures the agreement between predictions and observations adjusted for the possibility that predictions could be made by chance;
- Sensitivity: Also known as "recall," it measures the model's ability to correctly identify positive cases (hospitalizations);
- Specificity: This metric assesses the model's ability to correctly identify true negative cases (non-hospitalizations), helping to reduce the number of false positives that could lead to an unnecessary strain on hospital resources.
Due to the significant imbalance in the dataset, where the percentage of hospitalizations is relatively low (only 12.8% of the 30,603 records), the Accuracy metric was excluded from the analysis. In situations where there is an imbalance in the target variable, Accuracy tends to favor the majority class (non-hospitalizations), which does not adequately reflect the model's performance in identifying the minority class. Consequently, Accuracy is not an appropriate metric in this context, as it could lead to misleading interpretations and underestimate the model’s performance in predicting the minority class (hospitalizations). Instead, we focused on sensitivity, specificity, and the kappa coefficient, which more accurately captures the model's behavior in the face of data imbalance and aligns with the study’s goal of correctly identifying both true positive and true negative cases.
2.5. Case Studies
The primary objective of these experiments is to evaluate the performance of each model under various data partition scenarios to identify the most effective machine learning model for predicting hospitalizations in individuals aged 50 and older. The final model selection was based exclusively on the previously described evaluation metrics, aiming for an optimal balance between sensitivity and specificity. In this context, two case studies were designed to assess the effectiveness of models M1, M2, and M3:
- Case 1 (Variables without Interaction): Uses 14 predictor variables, as previously mentioned, along with the individual's ID and the year the data was collected;
- Case 2 (Variables with Interaction): Includes the 14 original predictor variables and all possible first-order interactions, meaning combinations between each pair of the 14 input variables.
The inclusion of variable interactions aims to capture additional relationships between predictive factors that could influence hospitalizations. This approach enriches the information provided to the machine learning models, allowing for an exploration of whether these interactions enhance predictive performance.
These two case studies enable a comprehensive evaluation of the models under different data configurations, providing a holistic view of their performance and permitting the identification of the model that best fits the data, thus ensuring robust and reliable application in real-world settings.
3. Results
3.1. Overall Performance of the Models
Table 2 and Figure 1 and Figure 2 present the average results and standard error values for each metric obtained by models M1, M2, and M3 when applying the RF algorithm to the MHAS dataset with different test proportions. The results vary depending on the presence or absence of variable interaction and the test proportion. In general, the standard error values are low across all models and configurations, demonstrating high precision and stability in the metric estimates. Moreover, no overlap is observed in the error intervals between the models, particularly in sensitivity and specificity, confirming that the differences in their performance are statistically significant. Although the overall results show reliable performance regardless of the configuration, the models with variable interaction stand out by having on average lower margin errors. Furthermore, they outperform the non-interaction models in two out of the three metrics (specificity and kappa coefficient), reinforcing their consistency and accuracy in prediction, particularly in complex scenarios such as the hospitalization of older adults.
Regarding the average performance values of the metrics, Figure 1 shows that, in general, the models tend to perform better in sensitivity than specificity, regardless of the test ratio. Furthermore, the models without interaction (dotted lines) excel in sensitivity, with M3 reaching its highest value (0.7729) at a test ratio of 0.4. However, this result is accompanied by poor performance in specificity (0.4124) and the kappa coefficient (0.0814) (see Table 2), which may lead to an increase in false positives.
From Figure 1 and Figure 2, it is observed that M1 achieves the highest values in specificity, with a maximum value of 0.5271 at a test ratio of 0.1. However, its low performance in sensitivity (0.6537) and kappa coefficient (0.08) suggests a significant risk of failing to correctly identify hospitalization cases, a critical aspect in medical prediction.
An important observation from Figure 1 and Figure 2 is that M2 is the only model that presents balanced results across the metrics studied. In sensitivity, M2 remains significantly above M1 and approaches the performance of M3 across all test ratios. Comparing the best values, M1 reaches 0.6812 while M2 achieves 0.7402, representing an 8.7% increase in sensitivity. The percentage difference between M2 (0.7402) and M3 (0.7729) is 4.2% in the same metric. A similar pattern is observed in the specificity metric, where M2 outperforms M3 and approaches M1. Regarding the kappa coefficient metric (Table 2 and Figure 2), models that include variable interaction consistently outperform models without interaction in almost all test ratios. The best performance in the kappa coefficient was achieved by M2, which reached a value of 0.099 at a test ratio of 0.2. The typical error of ±0.0248 suggests that this result is statistically significant, with no overlap in error intervals compared to other models. This indicates that model M2 presents better agreement between predictions and actual observations, highlighting its effectiveness compared to the other evaluated models.
3.2. Machine Learning Model Selection
In the context of predicting hospitalization, it is preferable to balance the performance metrics of ML models rather than focusing exclusively on maximizing a single metric. A balance between sensitivity and specificity is crucial to avoid biases that may lead to the overestimation or underestimation of hospitalizations.
Among the evaluated models, model M2, which includes variable interaction and a test ratio of 0.2, stands out for offering an optimal balance. This model achieved a sensitivity of 0.7215 and a specificity of 0.4935 (Figure 3a), effectively minimizing both false negatives and false positives—essential aspects in medical prediction. The standard errors of ±0.0038 for sensitivity and ±0.0039 for specificity confirm that the differences between models are statistically significant. Additionally, model M2 achieved the highest value in the kappa coefficient metric (0.099), as shown in Figure 3b, reflecting greater agreement between the predictions and the actual observations compared to the other models analyzed. As a result, M2 efficiently balances the identification of positive and negative cases, thus meeting the study's objectives. Therefore, M2, with variable interaction and a 20% test ratio, is selected as the optimal model for predicting hospitalization in older adults in Mexico. Moreover, based on M2's results, we can conclude that the model’s practical viability in medical prediction is highlighted, contributing to better anticipation of hospital demand in health services.
4. Discussion and Future Research Directions
The results of this study demonstrate the usefulness of machine learning models for predicting hospitalizations in older adults in Mexico, using longitudinal data from the MHAS. The performance of models M1, M2, and M3, in their respective variants, generally yielded good results. The M2 model, which included interaction of variables and a test proportion of 20%, was particularly noteworthy, achieving the best balance between sensitivity (0.7215, with a typical error of 0.0038) and specificity (0.4935, with a typical error of 0.0039). This balance allowed M2 to more effectively capture hospitalization cases without excessively increasing false positives, which is crucial in medical care to prevent inefficient allocation of hospital resources. However, it is important to recognize that the specificity result and the kappa coefficient are low, revealing areas of improvement for future research in predicting hospitalizations in older adults with this dataset.
The moderate performance of the model may also relate to the dataset's reliance on self-reported data, common in large-scale population studies. Future research could explore the potential of adding clinical biomarkers (such as glucose, cholesterol, or genetic marker levels) to refine risk distinctions, particularly in a heterogeneous population. Additionally, our study’s broader design approach, which applied the model to a diverse population of older adults with varying health conditions, likely contributed to the moderate performance observed. Unlike previous studies that focused on patients with specific diseases or comorbidities [4,13,15], this general application increased the heterogeneity of the dataset and introduced a significant imbalance between hospitalization cases (12.8%) and non-hospitalized cases (87.2%). This imbalance likely impacted the model’s predictive effectiveness, resulting in fluctuations in sensitivity and specificity values. Furthermore, our research employed a rigorous methodology to enhance the robustness of our results. This included the use of nested cross-validation, the evaluation of four testing proportions (10%, 20%, 30%, and 40%), and the comparison between models with and without variable interactions. This rigorous design methodology, along with the inherent complexity of predicting hospitalizations in a diverse population, may have resulted in a more conservative performance of our proposed models compared to previous studies. Song et al. [8], for example, achieved more favorable results in predicting hospitalizations in patients with specific comorbidities by working with more homogeneous datasets using the RF algorithm. Nevertheless, while the methodological rigor of our approach may have exposed some limitations in the performance metrics, it also provides a clearer view of the model’s actual performance under more complex conditions. Similarly, Friesner et al. [11] highlight the importance of incorporating real-time data, collected through wearable devices, to predict unplanned hospitalizations during concurrent chemotherapy and radiotherapy (CRT). Moreover, the authors also noted that the absence of more complex clinical data, such as biomarkers or specific medical parameters, may have affected the predictive capacity of the models. This underscores the importance of integrating multiple data sources, both real-time and clinical, to enhance the accuracy of prediction models in future studies.
Another important direction would be to implement advanced techniques for handling missing data, rather than eliminating entire records, to preserve relevant information about individuals and contribute to better model performance. Additionally, although the utility of the RF algorithm has been demonstrated, exploring other algorithms could further improve the predictive capacity of the model in future research.
The implications of these findings extend beyond the local context of the Mexican population. Socioeconomic factors, chronic health conditions, and access to healthcare services are common variables in studies of older adults in other regions. This suggests that the M2 model developed in this study could be adaptable and useful in similar contexts. For instance, this model could generate information to identify older adults at risk of hospitalization in advance, thus facilitating the planning and allocation of healthcare resources in hospitals and clinics across diverse populations.
In summary, this study provides a solid foundation for the implementation of predictive models in public health resource planning in Mexico, particularly in the context of an aging population. The findings highlight that as the healthcare system faces increasing hospital demand, the ability to anticipate hospitalizations and efficiently manage resources will be key to improving the medical care of older adults. The M2 model, with its strengths in sensitivity, offers a promising starting point for application in healthcare systems aiming to optimize the allocation of such health resources.
5. Conclusions
Machine learning techniques have proven effective in developing models to predict hospitalizations in older adult populations, addressing the complexity of multiple factors influencing health. In this study, the Random Forest algorithm was applied to a longitudinal dataset from the Mexican Health & Aging Study (MHAS), achieving performance metrics that reflect a good balance between sensitivity and specificity. The internal validation of the model demonstrated its stability and ability to generalize, underscoring its potential for application in clinical practice. The results suggest that the M2 model, which included variable interactions and a 20% testing proportion, is the most promising for predicting hospitalizations. Despite the challenges posed by data imbalance and the diversity of health conditions, the model offers a valuable tool for identifying at-risk patients, thereby anticipating hospital demand in the healthcare system. This facilitates more efficient hospital resource planning and enables more timely interventions for older adults.
The implementation of this type of predictive model is essential for addressing the challenges posed by population aging in Mexico, as well as for optimizing resource use in a context where demand exceeds the healthcare system’s capacity. Future research should focus on integrating subgroups of older adults with specific comorbidities to enrich the model and improve its predictive capacity.
6. Patents
Not applicable.
Supplementary Materials
Not applicable.
Author Contributions
Conceptualization, R.B.-M., O.A.M.-L., C.A.G.-G.; methodology and implementation of models, O.A.M.-L.; validation, R.B.-M., O.A.M.-L., C.A.G.-G.; formal analysis and data curation, R.B.-M. and O.A.M.-L.; Writing—original draft, R.B.-M., and O.A.M.-L.; Writing—review and editing, R.B.-M., O.A.M.-L. and C.A.G.-G. All authors have read and agreed to the published version of the manuscript. research articles with several authors, a short paragraph specifying their individual contributions must be provided.
Funding
This research received no external funding.
Institutional Review Board Statement
Not applicable.
Informed Consent Statement
Not applicable.
Data Availability Statement
Data are available on request by writing to the corresponding authors.
Acknowledgments
Not applicable.
Conflicts of Interest
The authors declare no conflicts of interest.
References
- Lazcano-Ponce, E.C. Recomendaciones de salud pública para fortalecer el derecho a la salud, Ensanut 2020-2023. Salud Pública México 2024, 66, 337–339. [Google Scholar] [CrossRef] [PubMed]
- Márquez-Colín, G. Aportaciones de la Enasem a 20 años del primer levantamiento. Salud Pública México 2023, 65, 419–420. [Google Scholar] [CrossRef] [PubMed]
- INEGI Comunicado de prensa: Resultados de la Encuesta Nacional sobre Salud y Envejecimiento en México (ENASEM) 2021 Available online:. Available online: https://www.inegi.org.mx/app/salaDeprensa/noticia.html?id=8294 (accessed on 23 October 2024).
- Carrillo-Vega, M.F.; Salinas-Escudero, G.; García-Peña, C.; Gutiérrez-Robledo, L.M.; Parra-Rodríguez, L. Early Estimation of the Risk Factors for Hospitalization and Mortality by COVID-19 in Mexico. PLOS ONE 2020, 15, e0238905. [Google Scholar] [CrossRef] [PubMed]
- Rojas-Martínez, R.; Aguilar-Salinas, C.A.; Jiménez-Corona, A.; Gómez-Pérez, F.J.; Barquera, S.; Lazcano-Ponce, E. Prevalence of Obesity and Metabolic Syndrome Components in Mexican Adults without Type 2 Diabetes or Hypertension. Salud Pública México 2012, 54, 7–12. [Google Scholar]
- Zabor, E.C.; Reddy, C.A.; Tendulkar, R.D.; Patil, S. Logistic Regression in Clinical Studies. Int. J. Radiat. Oncol. 2022, 112, 271–277. [Google Scholar] [CrossRef] [PubMed]
- Kraus, M.; Stumpf, U.C.; Keppler, A.M.; Neuerburg, C.; Böcker, W.; Wackerhage, H.; Baumbach, S.F.; Saller, M.M. Development of a Machine Learning-Based Model to Predict Timed-Up-and-Go Test in Older Adults. Geriatrics 2023, 8, 99. [Google Scholar] [CrossRef] [PubMed]
- Song, W.; Zhang, L.; Liu, L.; Sainlaire, M.; Karvar, M.; Kang, M.-J.; Pullman, A.; Lipsitz, S.; Massaro, A.; Patil, N.; et al. Predicting Hospitalization of COVID-19 Positive Patients Using Clinician-Guided Machine Learning Methods. J. Am. Med. Inform. Assoc. 2022, 29, 1661–1667. [Google Scholar] [CrossRef] [PubMed]
- Taloba, A.I.; Abd El-Aziz, R.M.; Alshanbari, H.M.; El-Bagoury, A.-A.H. Estimation and Prediction of Hospitalization and Medical Care Costs Using Regression in Machine Learning. J. Healthc. Eng. 2022, 2022, 7969220. [Google Scholar] [CrossRef] [PubMed]
- Kandel, B.; Field, C.; Kaur, J.; Slawson, D.; Ouslander, J.G. Development of a Predictive Hospitalization Model for Skilled Nursing Facility Patients. J. Am. Med. Dir. Assoc. 2024, 105288. [Google Scholar] [CrossRef] [PubMed]
- Friesner, I.D.; Feng, J.; Kalnicki, S.; Garg, M.; Ohri, N.; Hong, J.C. Machine Learning–Based Prediction of Hospitalization During Chemoradiotherapy With Daily Step Counts. JAMA Oncol. 2024, 10, 642–647. [Google Scholar] [CrossRef] [PubMed]
- Durán-Vega, L.A.; Santana-Mancilla, P.C.; Buenrostro-Mariscal, R.; Contreras-Castillo, J.; Anido-Rifón, L.E.; García-Ruiz, M.A.; Montesinos-López, O.A.; Estrada-González, F. An IoT System for Remote Health Monitoring in Elderly Adults through a Wearable Device and Mobile Application. Geriatrics 2019, 4, 34. [Google Scholar] [CrossRef] [PubMed]
- Ermak, A.D.; Gavrilov, D.V.; Novitskiy, R.E.; Gusev, A.V.; Andreychenko, A.E. Development, Evaluation and Validation of Machine Learning Models to Predict Hospitalizations of Patients with Coronary Artery Disease within the next 12 Months. Int. J. Med. Inf. 2024, 188, 105476. [Google Scholar] [CrossRef] [PubMed]
- Hancock, J.T.; Khoshgoftaar, T.M. CatBoost for Big Data: An Interdisciplinary Review. J. Big Data 2020, 7, 94. [Google Scholar] [CrossRef] [PubMed]
- Amanollahi, M.; Jameie, M.; Looha, M.A.; A. Basti, F.; Cattarinussi, G.; Moghaddam, H.S.; Di Camillo, F.; Akhondzadeh, S.; Pigoni, A.; Sambataro, F.; et al. Machine Learning Applied to the Prediction of Relapse, Hospitalization, and Suicide in Bipolar Disorder Using Neuroimaging and Clinical Data: A Systematic Review. J. Affect. Disord. 2024, 361, 778–797. [Google Scholar] [CrossRef] [PubMed]
- Page, M.J.; McKenzie, J.E.; Bossuyt, P.M.; Boutron, I.; Hoffmann, T.C.; Mulrow, C.D.; Shamseer, L.; Tetzlaff, J.M.; Akl, E.A.; Brennan, S.E.; et al. The PRISMA 2020 Statement: An Updated Guideline for Reporting Systematic Reviews. Int. J. Surg. 2021, 88, 105906. [Google Scholar] [CrossRef]
- MHAS Mexican Health and Aging Study Available online:. Available online: https://mhasweb.org/Home/Index.aspx (accessed on 23 October 2024).
- Tutz, G. Ordinal Trees and Random Forests: Score-Free Recursive Partitioning and Improved Ensembles. J. Classif. 2022, 39, 241–263. [Google Scholar] [CrossRef]
Figure 1.
Performance of models M1, M2, and M3 for the Two Case Studies in Terms of sensitivity and specificity.
Figure 1.
Performance of models M1, M2, and M3 for the Two Case Studies in Terms of sensitivity and specificity.
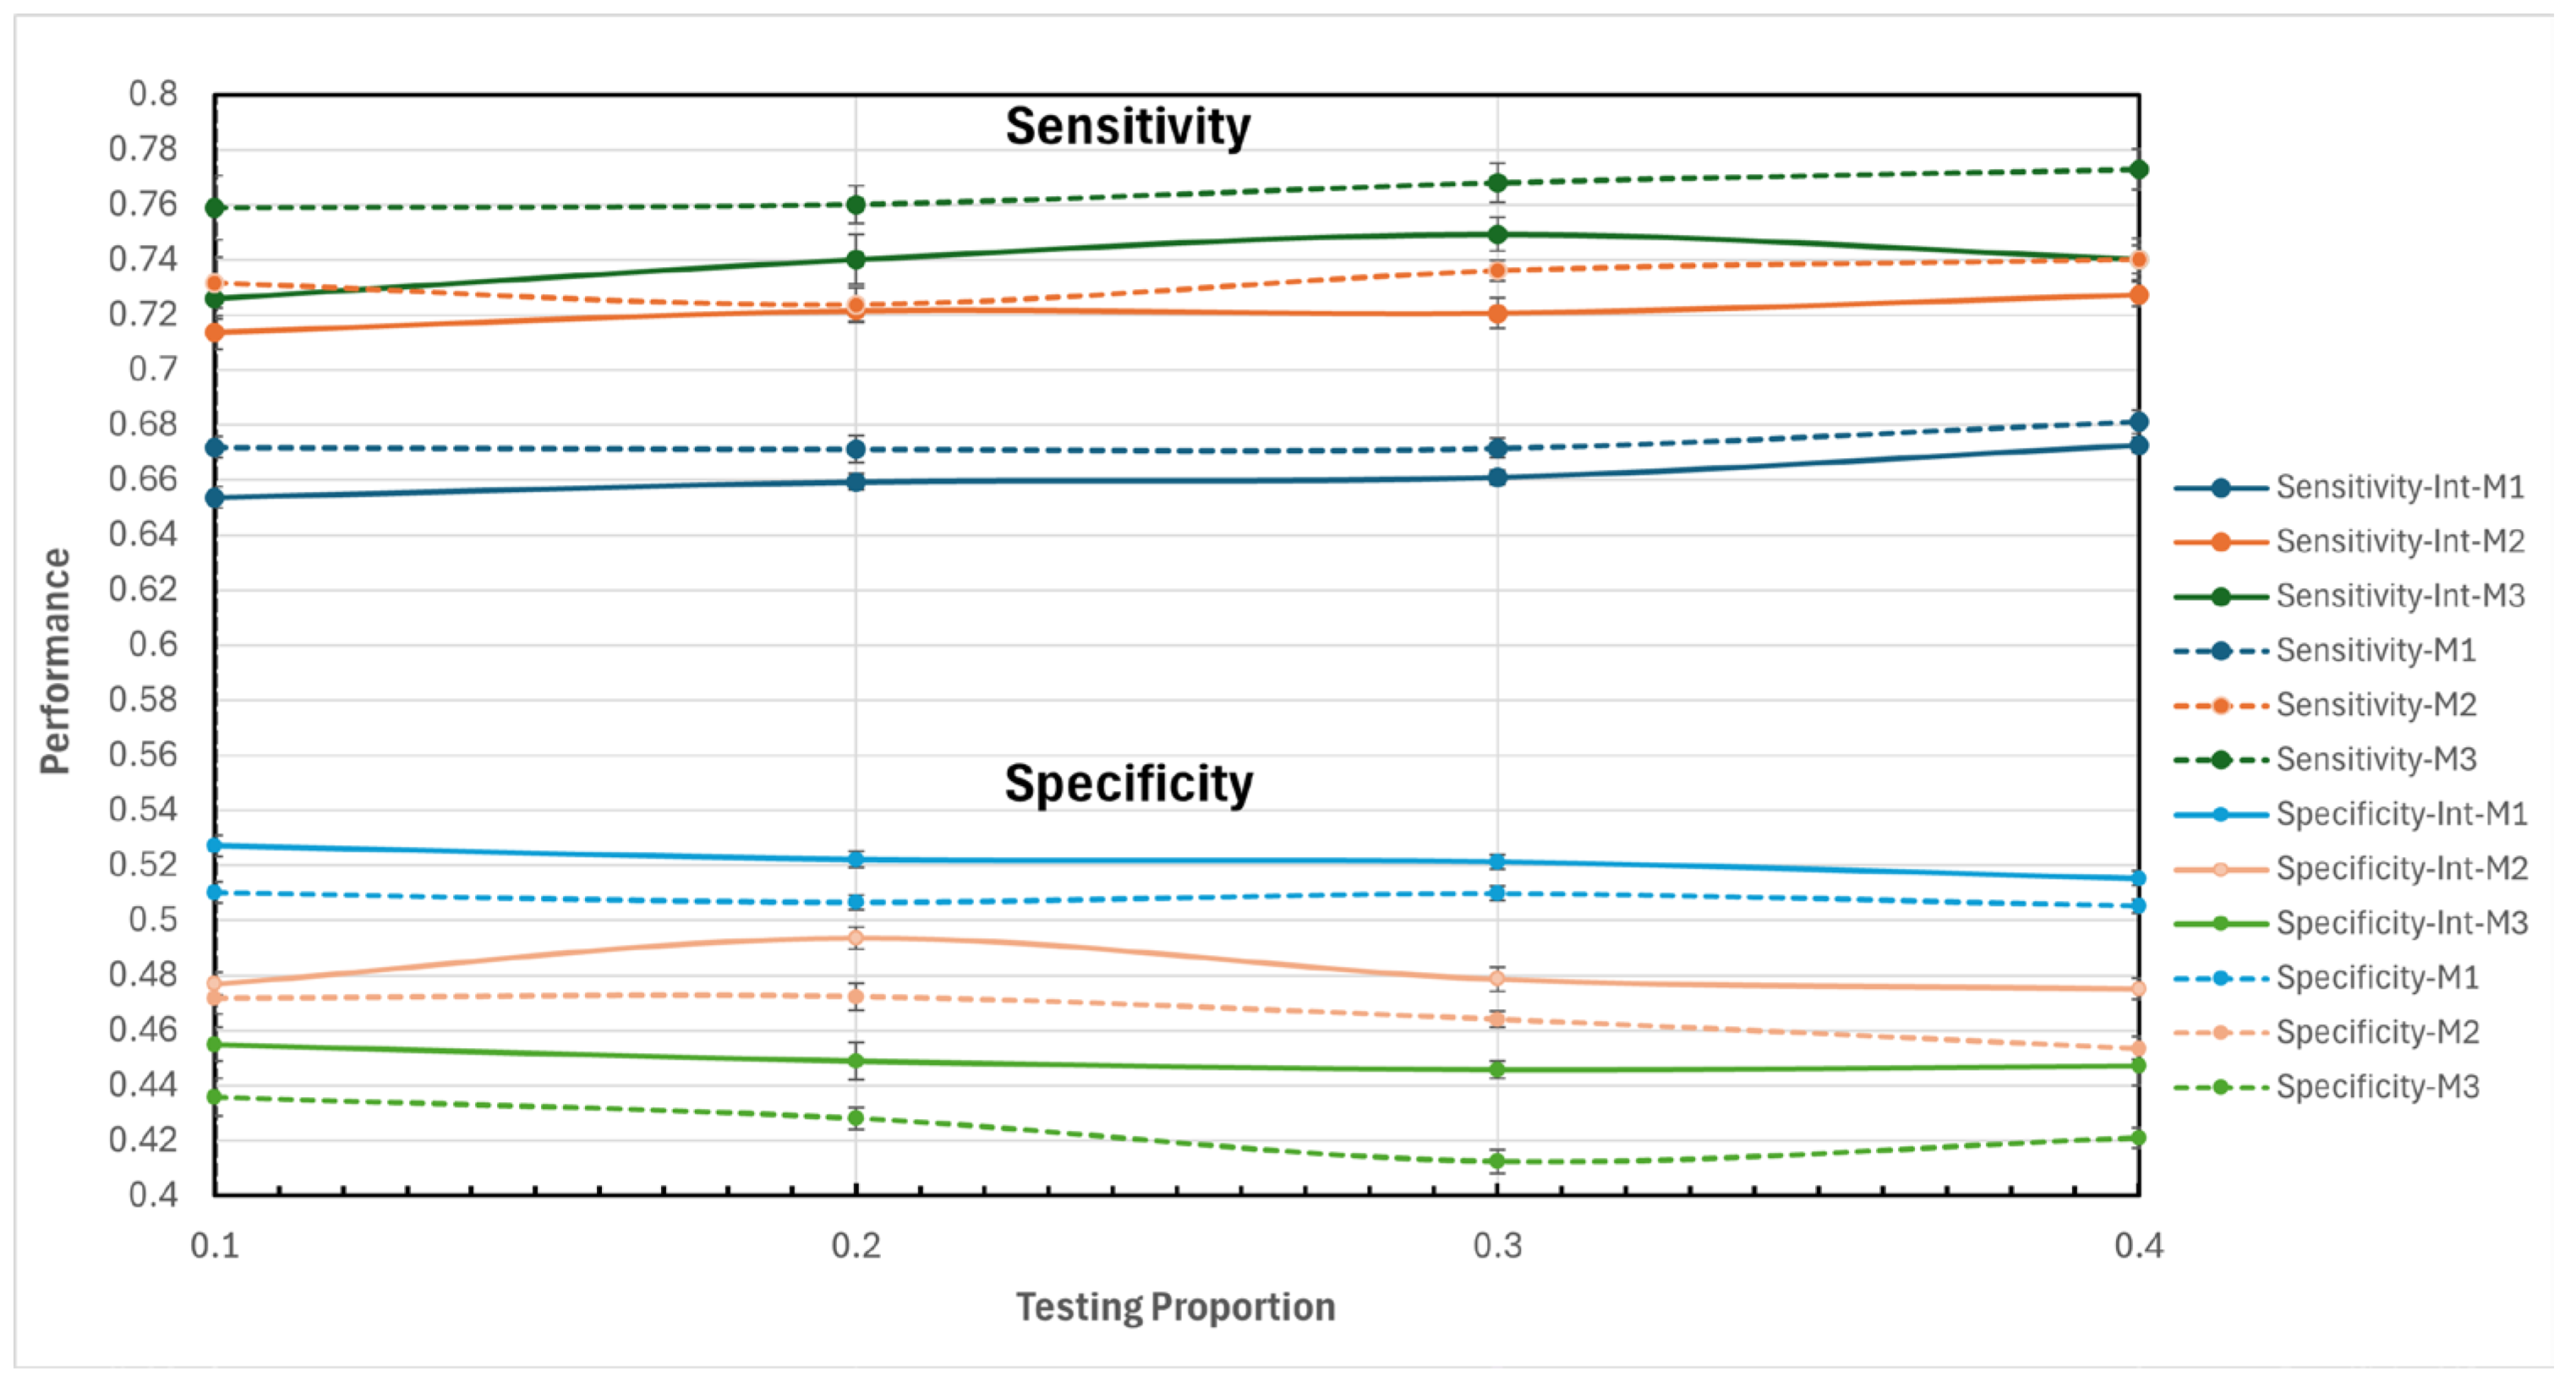
Figure 2.
Performance of M1, M2, and M3 in kappa coefficient for the Two Case Studies.
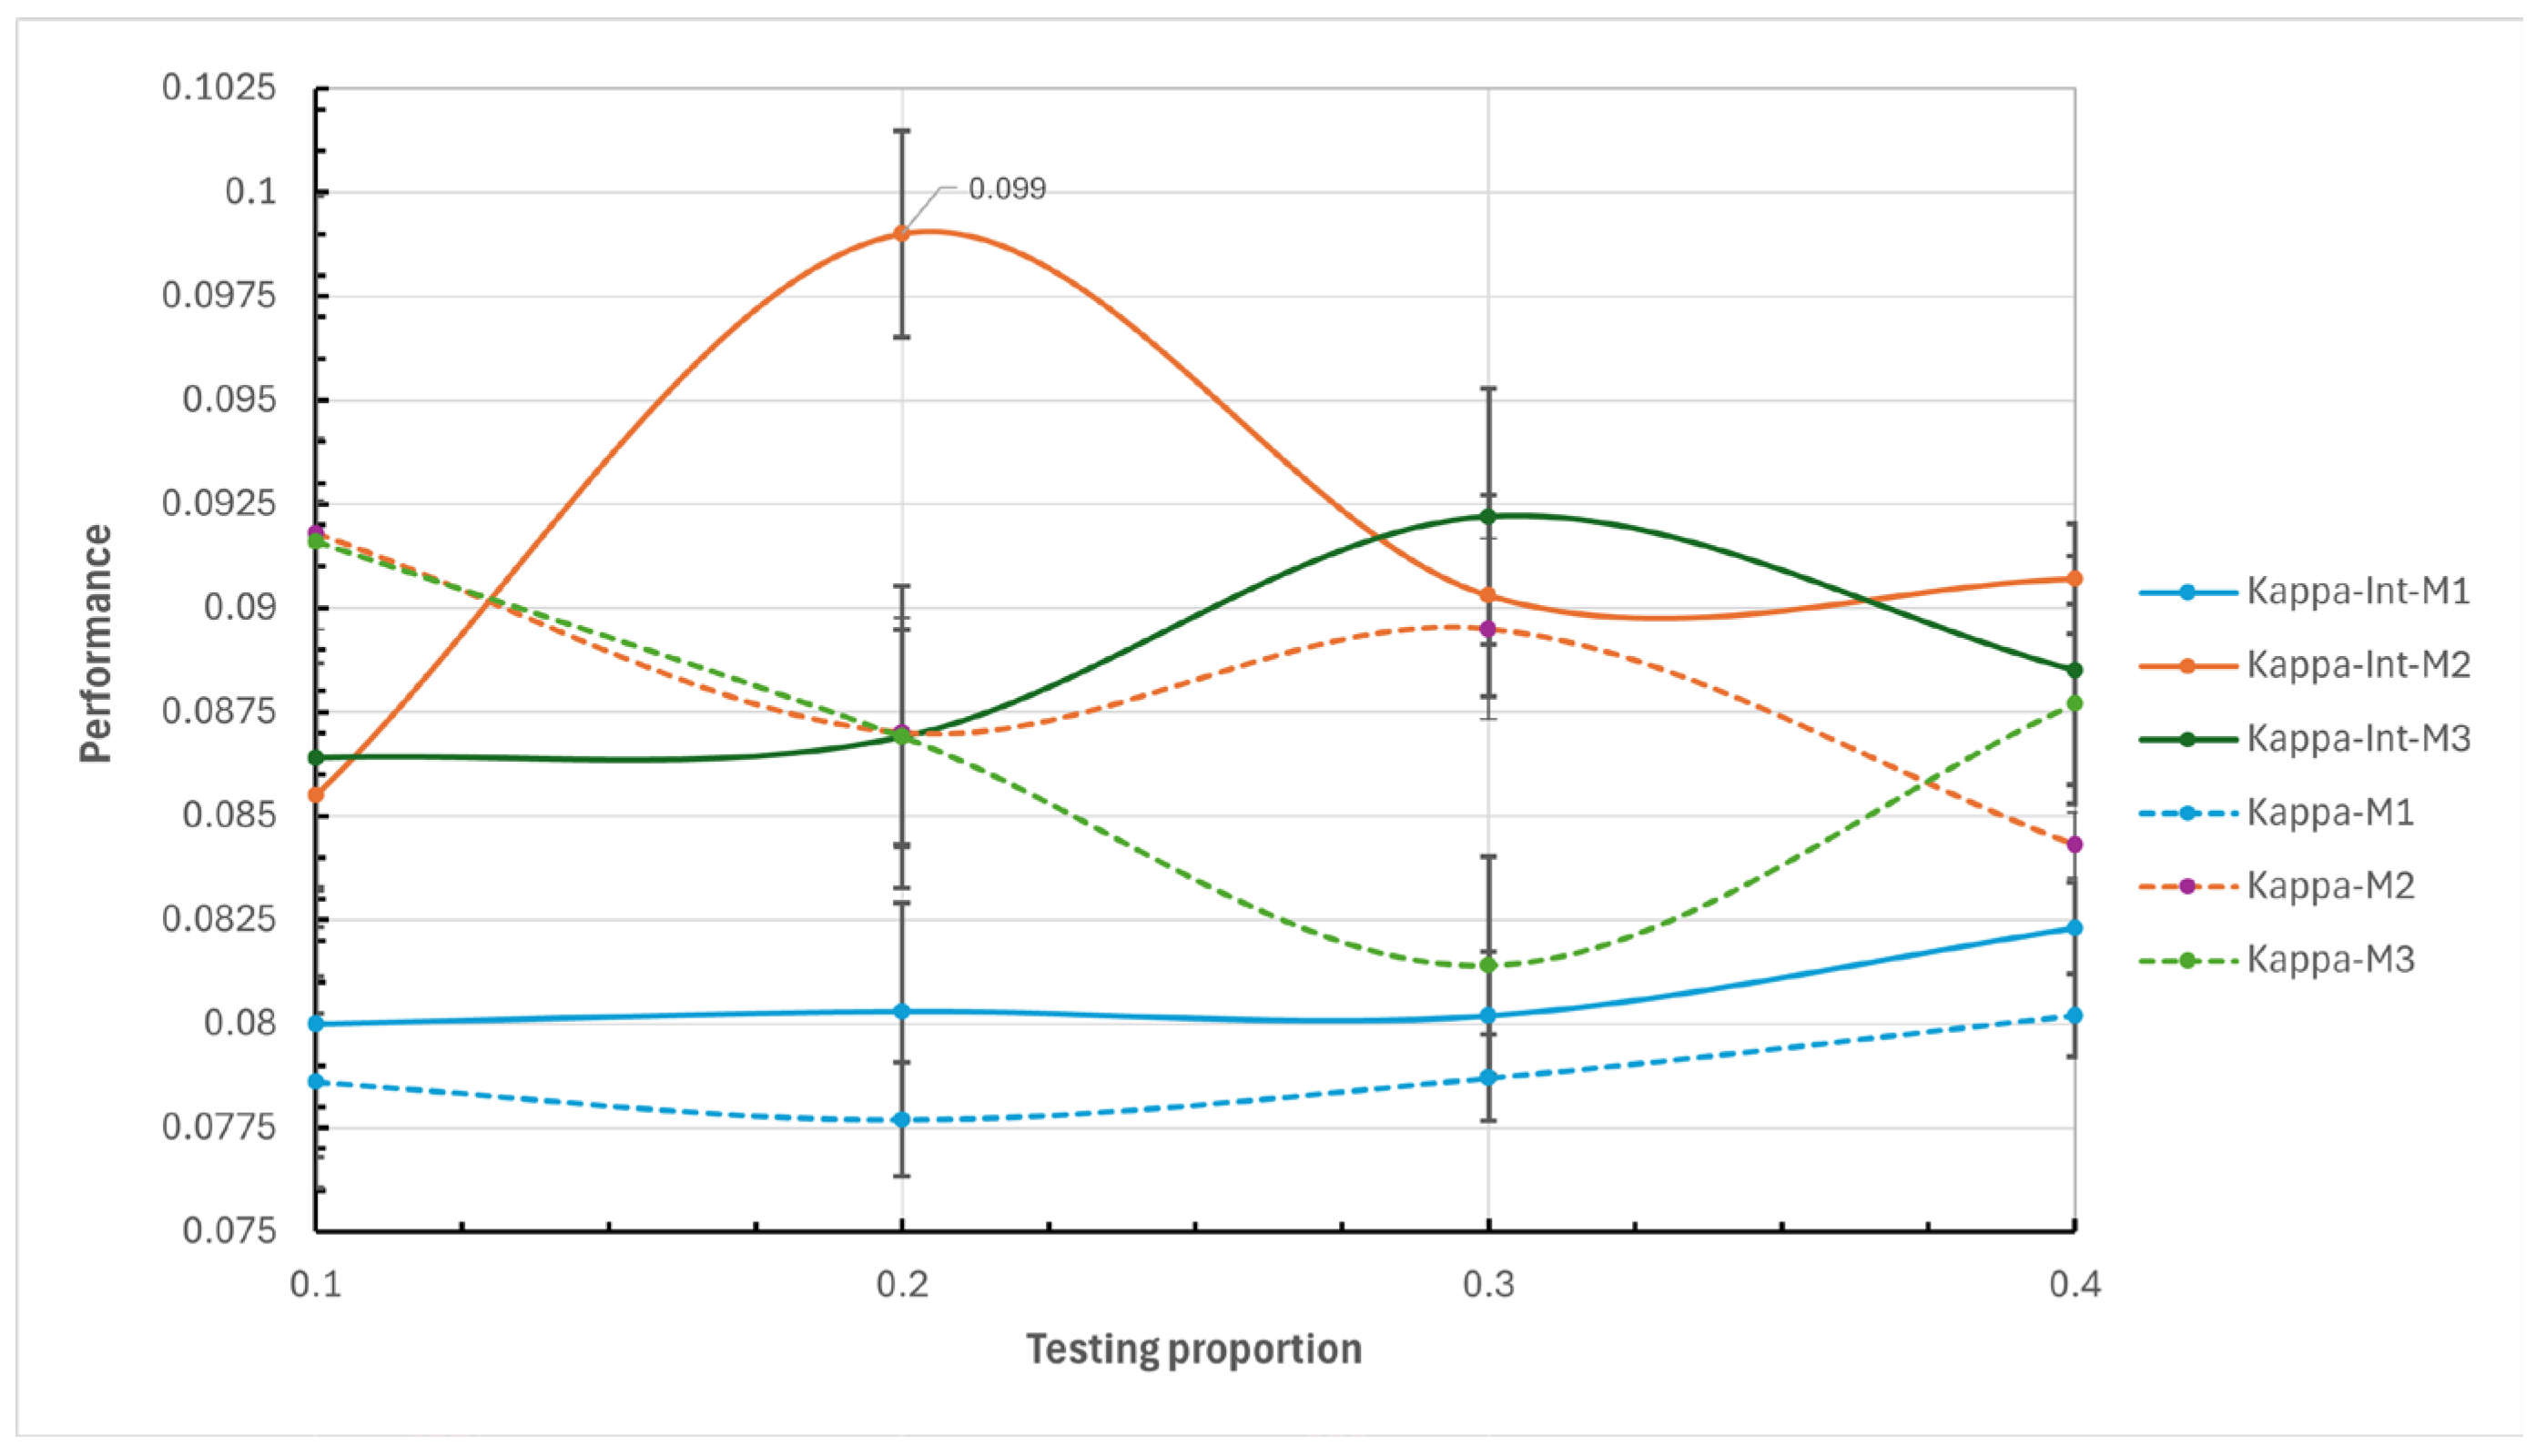
Figure 3.
(a) Performance of models M1, M2, and M3 in sensitivity and specificity with variable interaction and a 0.2 test ratio; (b) Performance of M1, M2, and M3 in kappa coefficient under the same configuration.
Figure 3.
(a) Performance of models M1, M2, and M3 in sensitivity and specificity with variable interaction and a 0.2 test ratio; (b) Performance of M1, M2, and M3 in kappa coefficient under the same configuration.
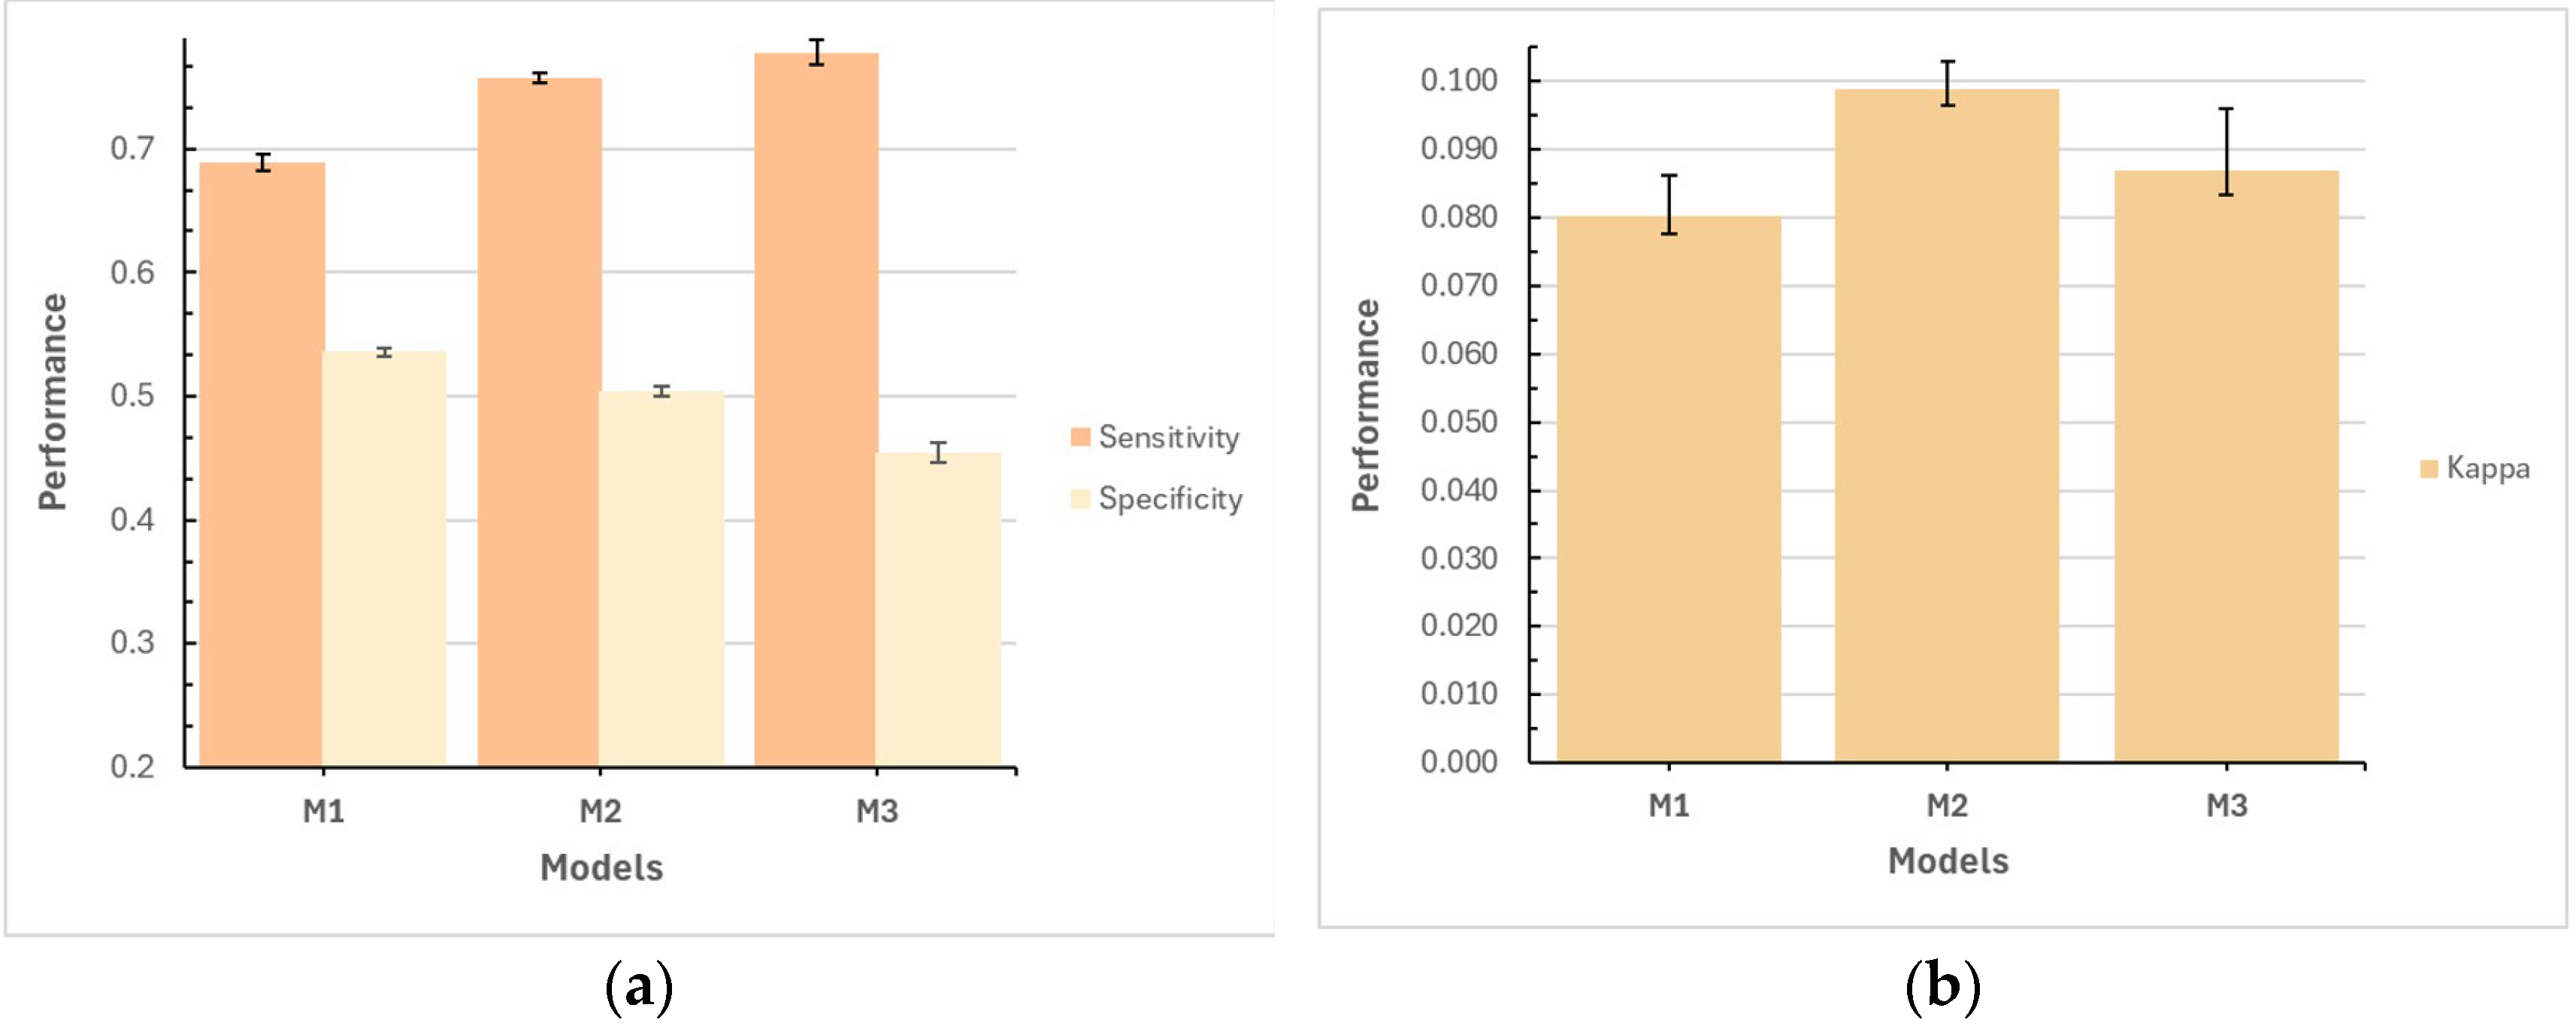

Table 1.
Descriptive Table of preprocessed dataset from the original Mexican Health and Aging Study (MHAS).
Table 1.
Descriptive Table of preprocessed dataset from the original Mexican Health and Aging Study (MHAS).
| 2012 | 2015 | 2018 | |
|---|---|---|---|
| Records | 10,201 | 10,201 | 10,201 |
| Hospitalized | 9.9 | 12.8 | 15.6 |
| 50≥Age<60 | 34.68 | 23.99 | 13.11 |
| Age ≥60 | 65.32 | 76.00 | 86.88 |
| 0≤Education≤6 | 71.54 | 71.54 | 71.54 |
| 6< Education ≤12 | 20.24 | 20.24 | 20.24 |
| 12< Education ≤22 | 8.21 | 8.21 | 8.21 |
| Women | 58.2 | 58.1 | 58.1 |
| Urban (≥100 thousand) | 55.5 | 54.7 | 54.7 |
| Lives with a Companion | 70.14 | 66.06 | 62.04 |
| With Diabetes | 22.1 | 25.0 | 27.6 |
| With Hypertension | 43.6 | 48.5 | 50.3 |
| With Stroke | 1.8 | 2.1 | 3.1 |
| With Falls | 39.7 | 44.6 | 44.5 |
| With Access to Health Services | 88.1 | 91.8 | 92.5 |
| With Difficulty in 1+ ADL | 11.8 | 14.9 | 17.4 |
| Underweight | 1.0 | 1.3 | 1.6 |
| Normal | 29.4 | 31.0 | 32.2 |
| Overweight | 44.0 | 43.8 | 42.9 |
| Obesity I | 24.0 | 22.4 | 21.9 |
| Obesity II | 1.6 | 1.6 | 1.4 |
| Has Smoked | 36.1 | 39.4 | 37.2 |
| Has Consumed Alcohol | 23.6 | 23.0 | 23.5 |
* Values are expressed as a percentage, except for the Records row, which is expressed in units. ADL(Activities of Daily Living).
Table 2.
Evaluation Results of models M1, M2, and M3.
| Model | Testing Proportion | Sensitivity average |
Sensitivity error |
Specificity average |
Specificity error |
Kappa Coefficient average |
Kappa Coefficient error |
Variable Interaction |
|---|---|---|---|---|---|---|---|---|
| M1 | 0.1 | 0.6719 | 0.0038 | 0.5102 | 0.0037 | 0.0786 | 0.0025 | No |
| 0.1 | 0.6537 | 0.0086 | 0.5271 | 0.0039 | 0.0800 | 0.0032 | Yes | |
| 0.2 | 0.6713 | 0.0048 | 0.5066 | 0.0027 | 0.0777 | 0.0014 | No | |
| 0.2 | 0.6594 | 0.0060 | 0.5222 | 0.0030 | 0.0803 | 0.0026 | Yes | |
| 0.3 | 0.6716 | 0.0036 | 0.5098 | 0.0026 | 0.0787 | 0.0010 | No | |
| 0.3 | 0.6611 | 0.0056 | 0.5213 | 0.0026 | 0.0802 | 0.0015 | Yes | |
| 0.4 | 0.6812 | 0.0043 | 0.5052 | 0.0024 | 0.0802 | 0.0010 | No | |
| 0.4 | 0.6728 | 0.0046 | 0.5153 | 0.0026 | 0.0823 | 0.0011 | Yes | |
| M2 | 0.1 | 0.7317 | 0.0092 | 0.4717 | 0.0057 | 0.0918 | 0.0023 | No |
| 0.1 | 0.7136 | 0.0061 | 0.477 | 0.0041 | 0.0855 | 0.0032 | Yes | |
| 0.2 | 0.7237 | 0.0062 | 0.4723 | 0.0049 | 0.0870 | 0.0028 | No | |
| 0.2 | 0.7215 | 0.0039 | 0.4935 | 0.0040 | 0.0990 | 0.0025 | Yes | |
| 0.3 | 0.7361 | 0.0036 | 0.4641 | 0.0030 | 0.0895 | 0.0022 | No | |
| 0.3 | 0.7206 | 0.0056 | 0.4787 | 0.0044 | 0.0903 | 0.0024 | Yes | |
| 0.4 | 0.7402 | 0.0052 | 0.4535 | 0.0041 | 0.0843 | 0.0008 | No | |
| 0.4 | 0.7274 | 0.0044 | 0.4752 | 0.0038 | 0.0907 | 0.0013 | Yes | |
| M3 | 0.1 | 0.7589 | 0.0117 | 0.4358 | 0.0067 | 0.0916 | 0.0083 | No |
| 0.1 | 0.7258 | 0.0073 | 0.455 | 0.0060 | 0.0864 | 0.0062 | Yes | |
| 0.2 | 0.7601 | 0.0069 | 0.4281 | 0.0039 | 0.0869 | 0.0026 | No | |
| 0.2 | 0.7401 | 0.0090 | 0.4489 | 0.0069 | 0.0869 | 0.0036 | Yes | |
| 0.3 | 0.768 | 0.0072 | 0.4124 | 0.0042 | 0.0814 | 0.0026 | No | |
| 0.3 | 0.7493 | 0.0061 | 0.4457 | 0.0032 | 0.0922 | 0.0031 | Yes | |
| 0.4 | 0.7729 | 0.0075 | 0.4210 | 0.0036 | 0.0877 | 0.0024 | No | |
| 0.4 | 0.7402 | 0.0076 | 0.4471 | 0.0071 | 0.0885 | 0.0028 | Yes |
Disclaimer/Publisher’s Note: The statements, opinions and data contained in all publications are solely those of the individual author(s) and contributor(s) and not of MDPI and/or the editor(s). MDPI and/or the editor(s) disclaim responsibility for any injury to people or property resulting from any ideas, methods, instructions or products referred to in the content. |
© 2024 by the authors. Licensee MDPI, Basel, Switzerland. This article is an open access article distributed under the terms and conditions of the Creative Commons Attribution (CC BY) license (http://creativecommons.org/licenses/by/4.0/).
Copyright: This open access article is published under a Creative Commons CC BY 4.0 license, which permit the free download, distribution, and reuse, provided that the author and preprint are cited in any reuse.


