
Submitted:
06 September 2024
Posted:
06 September 2024
You are already at the latest version
Abstract
This study describes the development of an optical-based surface plasmon resonance (SPR) aptasensor for the detection of cocaine. The aptasensor was prepared by first attaching gold nanoparticles to a clean SPR chip surface, followed by the addition of an aptamer to create a modified surface. This surface was characterized using Contact Angle and Atomic Force Microscopy, revealing surface roughness values of 0.28 nm and 28.12 nm for the blank and modified surfaces, respectively. The detection of cocaine was carried out in the concentration range of 1 ng/mL to 1000 ng/mL, with a detection time of approximately 8 minutes and a cocaine limit of detection (LOD) of 0.43 ng/mL. Repeatability studies were conducted, and the stability of the signal response was examined at a concentration of 200 ng/mL. Adsorption isotherm models, including Scatchard, Langmuir, and Freundlich, were calculated to assess the surface homogeneity of the SPR aptasensor chip, with the results indicating compatibility with the Langmuir isotherm model.

Keywords:
synthetic urine
; aptamer
; gold nanoparticle
; surface characterization
1. Introduction
Cocaine is a naturally occurring alkaloid with a tropane ring structure, classified as a local anesthetic. The average lethal dose for an average 70 kg individual is 500 mg, but this can increase to 1-2 grams in individuals with addiction. Cocaine is excreted from the body within 75 minutes via the nose, 48 minutes orally, and 54 minutes intravenously [1]. Urine is the preferred biological sample used to determine the use of illegal substances due to its ease of collection and the presence of high concentrations of the substance and its metabolites [2]. Various methods are employed for cocaine analysis in toxicology laboratories, including immunoassay, radioimmunoassay, enzyme-enhanced immunoassay technique, fluorescent polarization principles, ion selective electrodes, gas chromatography, gas chromatography/mass spectrophotometer, thin layer chromatography, ultraviolet visible region spectrophotometer, atomic absorption spectrophotometer, and surface plasmon resonance [3,4].
Surface plasmon resonance (SPR) was first described by Wood and later elaborated upon by Fano and Otto. SPR sensors are widely used in fields such as biology, food, electrochemistry, medicine, and the environment. In medical diagnostics, they are particularly useful for the development of biosensors with rapid response times and label-free methods. Aptasensors, which utilize aptamers as molecular recognition elements, are an emerging alternative to traditional biosensors. Aptamers offer advantages such as high selectivity, easy synthesis, and reusability. They are also smaller in molecular weight compared to antibodies, making them attractive for various applications, including environmental monitoring, toxin detection, food safety, law enforcement, illicit drug detection, and medical diagnostics [5,6,7,8]. So, rapid instruments in science fields such as life engineering and genomics in recent years, new applications have been taken for the treatment of many diseases. For this reason, studies in the field of finding markers that will enable the diagnosis and early treatment of diseases and developing analysis methods for these have gained momentum. Today, different methods are used in private laboratories and hospitals for the determination of biomarkers in body fluids.
Traditional tests such as Enzyme-Linked Immunosorbent Test (ELISA), Radioimmune Test (RIA), Fluorescence İmmunoassay (FIA), and immunoagglutination test (IAA) come first among these methods. These tests have advantages such as high affinity and wide detection range. However, antibodies are oftenly used as biological recognition elements in immunoassays. Recognition requires a labeling step and chemicals to show the interaction between the receptor and the analyte. The main types of biosensors are electrochemical, optical, calorimetric and aptasensors [9,10,11].
Aptamers are molecules with oligonucleotide or polypeptide structures that can bind to target sites with high selectivity and specificity. In other words, they are artificial nucleic acid ligands. Aptamers have many advantages. These are high selectivity, easy and economical synthesis, easy storage under room conditions, being used repeatedly can be counted among the most important advantages. In addition, the molecular weights of aptamers are low compared to antibodies. Sensitive and accurate the detection of small molecule targets is essential in areas such as environmental monitoring, toxins, heavy metals, food safety, law enforcement, illicit drugs and medical diagnostics [12,13,14,15].
Aptasensors have emerged as an alternative for simple and portable detection applications, from on-site drug testing and personal glucose meters to point-of-care disease biomarker screens. The widespread proliferation of aptasensors is due to their ability to combine high sensitivity and specificity with ease of use, cost effectiveness and fast turnaround times [16]. Current analytical techniques for cocaine detection include GC, capillary electrophoresis, MS and HPLC. These methods are sensitive for cocaine detection, but high cost, complex and time-consuming processes limit their wide application [17]. For this reason, it is highly preferred to introduce sensitive, fast and cost-effective analytical methods for the determination of cocaine, especially in pharmacy and forensic sciences. Among the different analytical methods, aptamer-based optical sensors are of great interest due to their simplicity and convenience. In addition, the results can be observed with the naked eye [18].
2. Materials and Methods
2.1. Chemicals and Equipments
6-Mercapto-1-hexanol, gold (III) chloride hydrate, 3-Aminopropyl trimethoxylane, HEPES, phosphate buffer, tween 20 (Sigma-Aldrich), dimethylaminepropyl (EDC-HCl) (ROTH), and an aptamer (100 µM) as 5’-Thiol-C6 –AAG GAT AAA TCC TTC AAT GAA GTG GGT CTC CC-3’ The aptamer (Helix Biotechnology, Knoxville, USA) with the GGTC TCCC-3’ sequence [19], standard cocaine solution (Sigma-Aldrich, Istanbul, Türkiye) and synthetic urine (Sigma-Aldrich, Istanbul, Turkey), (pH adjusted to 7.4 with PBS) were used during the experiments. As equilibrium buffer, PBS (phosphate buffered saline for the SPR sensor system solution) pH 7.4 was used. Glassware that would need during the experiments consumables were treated with 4 M HNO3 (nitric acid) for 24 hours sterilization has been achieved.
SPR imager II (GWC Technologies, WI, USA) device was used for the SPR sensor. Additionally, SPRchipTM gold SPR sensor chip (SPRimager®II GWC Technologies) was used. The dimensions of the gold chip was 1 mm x 18 mm x 18 mm and the surface thickness of the gold part was approximately 50 nm. Size analysis of the synthesized gold nanoparticle was determined with the Nano Zeta-sizer (NanoS, Malvern Instruments, London UK) device.
2.2. Synthesis of Gold Nanoparticles
Gold nanoparticles (AuNPs) was synthesized using Turkevich method of that gold (III)chloride trihydrate (HAuCl4•3H2O) salt is reduced to Au using sodium citrate [20]. 12 mL of preheated sodium citrate solution (1%, w/w) and 8.5 mg of HAuCl4 salt were added to 100 mL boiling water. This solution was strongly stirred while heating until turned into a deep red color for 20 minutes indeed. In the last step, the solution was cooled and the AuNP solution last volume was completed to 100 mL.
2.3. Surface Plasmon Resonance Chip Modification
For functionalization of cocaine aptamer with AuNPs, 20 μL of AuNPs colloid was added to 20 μL of 3′-thiol-terminated DNA aptamer, 10 μL of NaCl (0.1 M) and 10 μL of PBS (0.1 M) pH 7.4, and the mixture was mixed at room temperature. It was stirred at temperature for 24 hours. AuNPs were thiolated and attached to the aptamer via covalent S-Au bonds. After 24 hours of waiting, 10 μL of the solution was taken and dropped onto the chip surface. It was kept under room conditions for 24 hours. Contact angle was used to analyze the hydrophilicity of the modified chip surface. Measurements of the contact angle were made on the KRÜSS DSA100 (Hamburg, Germany). In device components; It includes a high-resolution camera, microscope optics, syringe, lens, focusing and control elements in a closed housing. A stainless steel needle (0.5 mm) with PP luer-lock connector was used with a disposable syringe (1 mL). Liquid-liquid interfacial tension and surface tension were examined using the Sessile Drop method. As a result, the approximate contact angle value of the SPR chip was found. Contact angle analysis was performed to demonstrate the hydrophilicity of the surface of the surface-modified SPR chip. The contact angle between a liquid substance and a solid surface (for example, the SPR chip surface) was measured with the KRÜSS DSA100 device. An angle, that is, a tangent, is formed between the solid surface and the liquid. The possibility of finding tensions on solid surfaces due to contact was concluded by Young in 1805 [21]. Contact angle of a liquid substance on a solid surface; It is defined by mechanical equilibrium under the influence of solid-liquid, solid-vapor, liquid-vapor interfacial tensions. A contact angle below 90° indicates that the solid surfaces are susceptible to moisture and that there is a liquid drop spread over the solid surface in an expanding area. A contact angle greater than 90° generally indicates that the surface is not suitable for moistening and creates a liquid drop on the solid surface, reducing the contact. By dropping 10 μL of distilled water onto the gold surface of the SPR chip, the contact angle was determined via the adhered drop [22]. Two different frames were photographed by dropping water on different areas of the chip gold surface, and the contact angle was calculated separately for each examination. The values of the calculated contact angle were determined as the contact angle taken from the left side of the droplet with the surface and the contact angle taken from the right side. In addition, the average of the values of these two points was calculated. The same processes were applied to the modified chip surface.
2.4. Characterization Studies of SPR Aptasensor
Contact Angle analysis of the blank chip surface, Au-modified-SPR aptasensor chip surface were performed with KRUSS DSA 100 (Hamburg, Germany) instrument. Sessile drop method was applied in the measurements and average Contact Angle values were calculated of the SPR aptasensors. SPR gold surfaces were characterized by AFM (Park System, XE-100E, Korea). In the noncontact mode performed visualization studies. The sample area was shown with a resolution of 256×256 pixels and a 2 μm s-1 scanning rate. SPR aptasensor gold surface was modified using the self-assembled monolayers (SAMs) technique. After the SPR aptasensor chip prepared with the SAM technique was placed in the device, pH 7.4 equilibrium PBS buffer was passed through the system in order to equilibrate the chip surface. In order to examine the relationship between the cocaine concentration and the SPR aptasensor signal change prepared, cocaine solutions at different concentrations were prepared. Then, cocaine samples prepared with PBS 7.4 buffer solution were sent to selected areas on the SPR aptasensor chip surface.
2.5. Preparation of Standard Cocaine Solution
Cocaine solutions were prepared to examine the relationship between total cocaine concentration and SPR aptasensor signal. 1; 5; 10; 50; 100; 200; 500; 1000 ng/mL of cocaine samples prepared with linear and wide concentration range PBS 7.4 buffer solution were passed through the system simultaneously to selected regions on the SPR chip surface.
2.6. Preparation of Standard Cocaine Solution with Urine
Cocaine solutions were prepared to examine the relationship between total cocaine concentration and SPR aptasensor signal. 1; 5; 10; 50; 100; 200; 500; 1000 ng/mL of cocaine samples prepared with linear and wide concentration range PBS 7.4 buffer solution were passed through the system simultaneously to selected regions on the SPR chip surface.
3. Results
Gold nanoparticles were synthesized based on the Turkhevic method. Characterization of the synthesized gold nanoparticles was carried out with a zeta size analysis device. The size of gold nanoparticles was calculated as 20.55 nanometers based on the zeta size analysis results. Zeta size analysis data and PdI value of gold nanoparticles are shown in Figure 1.
Characterization studies of the SPR aptasensor chip were performed with Contact Angle and AFM. The contact angle values of the blank and modified SPR aptasensor chip with the adhered drop method were investigated by dropping a drop of water on its surface. Two different contact angle values were recorded and images were obtained by dripping water on different parts of the SPR aptasensor chip. The Contact Angle value of the blank gold surface was measured as 69.6°, and on the aptamer-modified surface as 62°. According to the results it was obtained that the contact angle decreased after the blank gold chip surface was modified with aptamer. This decrease indicates that hydrophilic groups were attached to the surface.
Surface characterization studies were performed with AFM to examine the surface morphology of the blank SPR chip surface and the Au-modified-SPR aptasensor chip. The surface of blank SPR chip was cleaned with an acidic piranha solution. The surface depth of the unmodified blank SPR chip was measured at 13.28 nanometers. The average thickness of the SPR aptasensor chip modified with gold nanoparticle-aptamer was determined as 28.12 nm. It is shown from the results that the modification process was performed correctly on the gold surface of the SPR chip. In Figure 2, AFM images of the blank SPR chip and the Au-modified-SPR aptasensor chip were given.
The evaluation of surface roughness is very important for many fundamental problems such as friction, contact deformation, conduction of heat and electric current, tightness of contact joints [23]. The surface roughness average values of the blank SPR chip and the modified SPR chip were calculated as 1.44 nm (a) and 3.32 nm (b), respectively as indicated in Figure 2(a). The fact that the average surface roughness value in Figure 2(b) is higher than the value in Figure 2(a) indicates that the surface modification was carried out successfully.
3.1. Data Evaluation of Cocaine Determination at Different Concentrations
Figure 3 shows the sensograms obtained from the interaction of cocaine solutions prepared at different concentrations between the SPR aptasensor. During the measurements; firstly equilibrium buffer solution was passed through the SPR system for about three minutes, then cocaine samples were given from the smaller to the bigger concentration value for about five minutes. Towards the end of about eight minutes, the system reached equilibrium again. Then, 0.1 M pH 2.5 glycine-HCl desorption solution was passed through the system for about 3 minutes. Between two consecutive measurements, PBS equilibrium buffer at pH 7.4 was given to the system for fifteen minutes in order for the system to reach equilibrium again [24].
ΔRmax values increase with increasing cocaine concentration. As the concentration of cocaine increases, the concentration of the analyte that binded to the active selective binding sites and it was increased the ΔRmax value.
3.2. Data Evaluation of Cocaine Determiniation with Urine
The sensograms were given in Figure 4 to obtained from the interaction of cocaine containing synthetic urine solutions with different concentrations between the SPR aptasensor. During the measurements taken to obtain these sensograms; an equilibrium buffer solution was first passed through the SPR system for approximately 3 minutes. Then synthetic urine samples containing cocaine were then passed for approximately 5 minutes. Towards the end of approximately 8 minutes, the system reached equilibrium again. A 0.1 M pH 2.5 glycine-HCl desorption solution was then passed through the system for about 3 minutes. For consecutive measurements, pH 7.4 PBS equilibrium buffer was given to the system for 15 minutes in order for the system to reach equilibrium between both measurements.
The sensograms were given in Figure 4 to obtained from the interaction of cocaine containing synthetic urine solutions with different concentrations between the SPR aptasensor. During the measurements taken to obtain these sensograms; an equilibrium buffer solution was first passed through the SPR system for approximately 3 minutes. Then synthetic urine samples containing cocaine were then passed for approximately 5 minutes. Towards the end of approximately 8 minutes, the system reached equilibrium again. A 0.1 M pH 2.5 glycine-HCl desorption solution was then passed through the system for about 3 minutes. For consecutive measurements, pH 7.4 PBS equilibrium buffer was given to the system for 15 minutes in order for the system to reach equilibrium between both measurements.
In Figure 4; it is easily seen that with the increase of cocaine concentration, the ΔRmax value also increases. The reason of this was that the increase of the cocaine concentration was caused an increase in the active binding sites and thus an increase in the binding analyte concentration. There was no appreciable changings in ΔRmax when maximum binding has been occured. ΔR values signaling in the 0-50 ng/mL concentration range were calculated as y=0.0673x+0.5677 and the linear equation in the 200-1000 ng/mL range as y=0.0104x+6.5595. Calibration charts prepared for the determination of total cocaine are shown in Figure 5(a,b).
As a result of the calculations made, the determination of cocaine was found to be approximately 89% accurate in the 0-50 ng/mL concentration range and approximately 93% in the 200-1000 ng/mL concentration range, as shown in Figure 5.
3.3. Repeatability Results of SPR Experiments
One of the important advantage of SPR aptasensors is repeatability. The fact that the analyzes performed on SPR-based sensors can be repeated without any labeling and as a result the values in the analysis results did not show a large change confirms this advantage of SPR aptasensors. Therefore, cocaine solution with a concentration of 200 ng/ml was choosen for the repeatability step. The purpose of choosing this concentration was that this concentration was not low or high and so reliable results has been obtained.
200 ng/mL concentration of cocain standard was sent to the SPR system four times in succession and the repeatability of the signals were observed. It was shown in Figure 6, the detection of the cocaine was carried out successively without any decrease in signal change by cocaine aptasensors.
3.4. Kinetic Model of Aptasensor
Kinetic analysis of SPR aptasensors has been calculated to show the interaction between target molecule and SPR chip. Scathard and attachment kinetic lines those were ’ΔRmax’, ’ka ‘, ’kd’, ’KA’ and ’KD’ values obtained from the equations are given in Table 1.
Adsorption isotherms were formed by plotting the concentration of the solute remaining without being adsorbed against the amount adsorbed in unit adsorbent mass when the equilibrium state of the solutions was achieved at constant ambient temperature. Langmuir, Freundlich, and Langmuir-Freundlich adsorption isotherm models were investigated to determine the surface binding homogeneity of the SPR aptasensor chip and describe the interaction between the SPR aptasensor and cocaine. The results obtained from the Langmuir and Freundlich isotherm models are given in Table 2.
According to Table 2, the most suitable adsorption model was determined as the Langmuir isotherm model, according to the results of experimental studies in cocaine determination. Furthermore R2=0.9992 and ΔRmax=10.86 were determined for cocaine. According to these results the junction points on the designed SPR aptasensor chip surface were homogeneously distributed and it was specified that an equi-energy, monolayer and minimal lateral interaction.
Furthermore when the correlation coefficient values (R) of Figure7 (a), (b) and (c) were compared, it was observed that the Langmiur isotherm model was valid for the SPR aptasensor and cocaine. The highest signal value (∆Rmax) calculated from the Langmuir isotherm was obtained as 0.9992. According to this result, the binding properties of cocaine binded on the aptasensor surface was as a monolayer, it has the lowest lateral interaction with the same energy and it has been homogeneously distributed.
4. Discussion
In this research, an affinity-based aptasensor was used for cocaine detection; a rapid and economical detection method sensitive to cocaine has been demonstrated. SPR aptasensor chip with increased conductivity with gold nanoparticles was designed for more sensitive and selective determination of analytes with low molecular weight and low concentrations. By this aptasensor, the presence of cocaine in different concentrations and synthetic urine has been positively concluded. The cocaine aptasensor prepared with good sensitivity and repeatability has demonstrated its potential to be a striking optical method for cocaine detection in urine samples. The robustness and easy design has been make SPR chip advantageous for designing portable devices. Binding of aptamers to gold nanoparticles in urine cocaine analysis had been indicated that the sensitized SPR aptasensor was acceptable. These analyzes is demonstrated that in the future researches the feasibility of the biodetection system for cocaine detection in real biological samples.
In conclusion, the SPR aptasensor developed in this study offers a promising approach for the detection of cocaine in human urine, with potential applications in forensic science and drug monitoring. The sensor’s high sensitivity, fast response time, and ease of use make it a valuable addition to the field of biosensors, particularly for on-site drug testing. The authors acknowledge the support of various institutions that contributed to the research.
Acknowledgments
Auhors thank to “Turkish National Police Academy Forensic Sciences Institute Criminalistics Establishment of Research and Application Center Forensic Chemistry Laboratory" Substructure Project (04/2019A) and "Imaging to Hidden Fingerprints with the Help of Aptamer" to the Master Thesis Project (03/2020-L) for the financial and technical supports of this Master Thesis. Also authors thank to Adil Denizli and Lecturer Semra Akgönüllü from Hacettepe University for the experimental sections and SPR experiments.
References
- Goldstein R. A., DesLauriers C., Burda A., Johnson-Arbor K., Cocaine: history, social implications, and toxicity: a review, Seminars in Diagnostic Pathology, Sem. Diagnost. Pathol. 2009, 26, 10. [CrossRef]
- Dinis-Oliveira R.J. , Duarte J.A. , Remião F. , Marques A., Santos A., Magalhães T., Carvalho F., Collection of biological samples in forensic toxicology Toxic. Lett. 2011, 205, 198.
- Wolff K., Farrell M., Marsden J., Monteiro M. G., Ali R., Welch S., Strang J., A review of biological indicators of illicit drug use, practical considerations and clinical usefulness, Society for the Study of Addiction Addict. 1999, 94, 1279. [CrossRef]
- Saylan Y., Akgönüllü S., Yavuz H., Ünal S., Denizli A., Molecularly Imprinted Polymer Based Sensors for Medical Applications, Sensors, 2019, 19, 4. [CrossRef]
- Homola J., Surface Plasmon Resonance Sensors for Detection of Chemical and Biological Species, Chem. Rev. 2008,108, 462. [CrossRef]
- Otto A., Excitation of nonradiative surface plasma waves in silver by the method of frustrated total reflection, Z. Physik. 1968, 216, 398. [CrossRef]
- Karlsson, R. SPR for molecular interaction analysis: a review of emerging application areas, J Mol. Recogn. 2004, 17, 151. [Google Scholar] [CrossRef] [PubMed]
- Akgönüllü, S., Yavuz H., Denizli A., SPR nanosensor based on molecularly imprinted polymer film with gold nanoparticles for sensitive detection of aflatoxin B1, Talanta. 2020, 219, 1. [CrossRef]
- Hock, B. Antibodies for immunosensors a review. Anal Chim. Acta. 1997, 347, 177. [Google Scholar] [CrossRef]
- Morgan C. L., Newman D. J., Price C. P., Immunosensors: technology and opportunities in laboratory medicine, Clin. Chem. 1996, 42, 193. [CrossRef]
- Yılmaz, E., Özgür E., Denizli A., Afinite Temelli Biyosensörler, 1. Baskı ve Cilt, Kukla Kırtasiye Bilgisayar ve Malz. Tic.Ltd. Şti. Ankara, 2016 ISBN: 978-605-88783-2-7.
- Hoppe-Seyler F., Butz K., Peptide aptamers: powerful new tools for molecular medicine, J. Mol. Med. 2000, 78, 426. [CrossRef]
- Gold, L., Janjic N., Jarvis T., Schneider D., Walker J. J., Wilcox S. K., Zichi D., Aptamers and the RNA World, Past and Present, Cold Spring Harb Perspect Biol 2012, 4, a003582. [CrossRef]
- White R.R., Sullenger B. A., Rusconi C. P., Developing aptamers into therapeutics, J. Clin. Invest. 2000, 106, 929. [CrossRef]
- Peltomaa R., Glahn-Martínez B., Peña E. B., Moreno-Bondi M. C., Optical Biosensors for Label-Free Detection of Small Molecules, Sensors. 2018, 18, 4126. [CrossRef]
- Payam A. F., Kim B., Bhalla N., Unraveling the liquid gliding on vibrating solid liquid interfaces with dynamic nanoslip enactment, Nat. Commun. 2022, 13, 6608. [CrossRef]
- Roushani M., Shahdost-fard F., Fabrication of an electrochemical nanoaptasensor based on AuNPs for ultrasensitive determination of cocaine in serum sample, Materials Sci. Eng. 2016, 61, 599. [CrossRef]
- Gao Z., Qiu Z., Lu M., Shu J., Tang D., Hybridization chain reaction-based colorimetric aptasensor of adenosine 5′-triphosphate on unmodified gold nanoparticles and two label-free hairpin probes, Biosensors. Bioelectron. 2017, 89, 1006. [CrossRef]
- Baker B.R., La R.Y., Wood M.S., Doctor E.H., Heeger A.J., Plaxco K.W., An electronic, aptamer-based small-molecule sensor for the rapid, label-free detection of cocaine in adulterated samples and biological fluids, J. Am. Chem. Soc. 2006, 128, 3138. [CrossRef]
- Hammami, I., Alabdallah N. M., Kamoun M., Gold nanoparticles: Synthesis properties and applications, J. King Saud Univ. Sci. 2021, 33, 101560. [CrossRef]
- Kwok D. Y., Neumann A. W., Contact angle measurement and contact angle interpretation, Adv. Colloid Interface Sci. 1999, 81, 167. [CrossRef]
- Susana L., Campaci F., Santomaso A. C., Wettability of mineral and metallic powders: Applicability and limitations of sessile drop method and Washburn’s technique, Powder Technol. 2012, 226, 68. [CrossRef]
- Gadelmawla E.S., Koura M.M., Maksoud T.M.A., Elewa I.M., Soliman H.H., Roughness parameters, Journal of Materials Processing Technology, J. Mater. Process Tech. 2002, 123, 133. [CrossRef]
- Koyun S., Akgönüllü S., Yavuz H., Erdem A., Denizli A., Surface plasmon resonance aptasensor for detection of human activated protein C, Talanta. 2019, 194, 528. [CrossRef]
- Ertürk G., Uzun L., Tümer M. A., Say R., Denizli A., Fab fragments imprinted SPR biosensor for real-time human immunoglobulin G detection, Biosensors and Bioelectronics 2011, 28, 97. [CrossRef]
- Özgür E., Topçu A.A., Yılmaz E., Denizli A., Surface Plasmon Resonance Based Biomimetic Sensor for Urinary Tract Infections, Talanta, 2020, 212, 5. [CrossRef]
Figure 1.
Zeta Size Analysis Data.
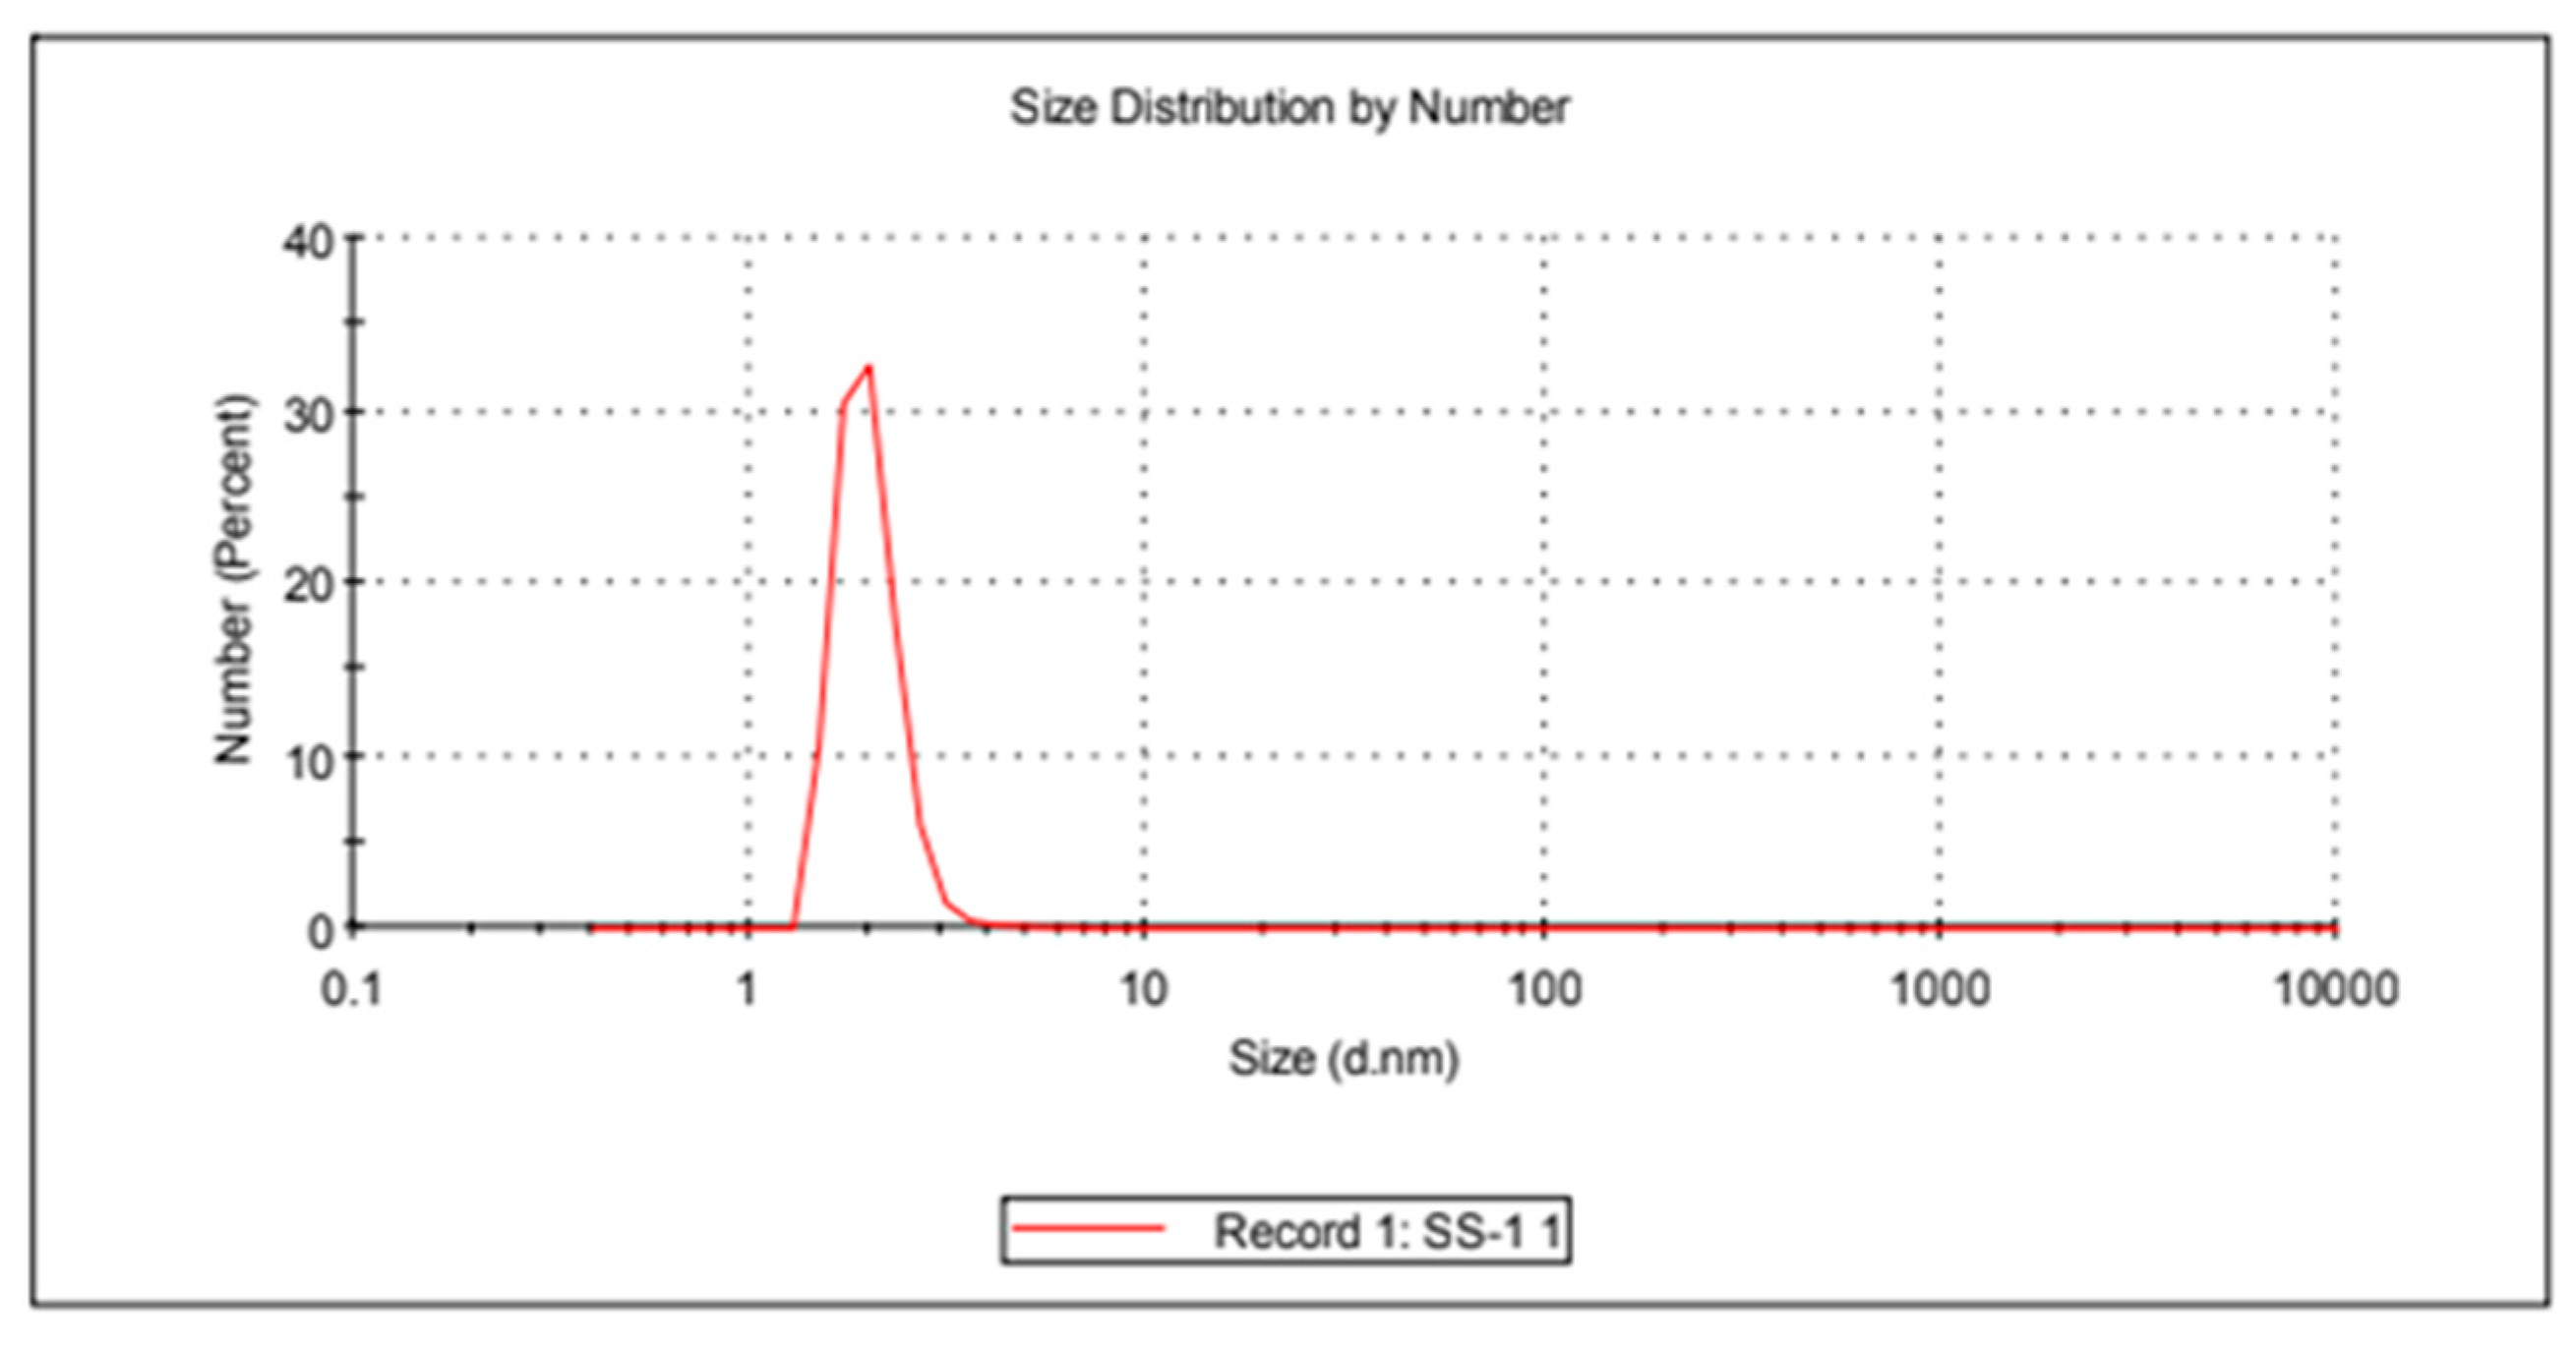
Figure 2.
(a) Blank chip; (b) Au-modified-SPR-aptasensor chip.
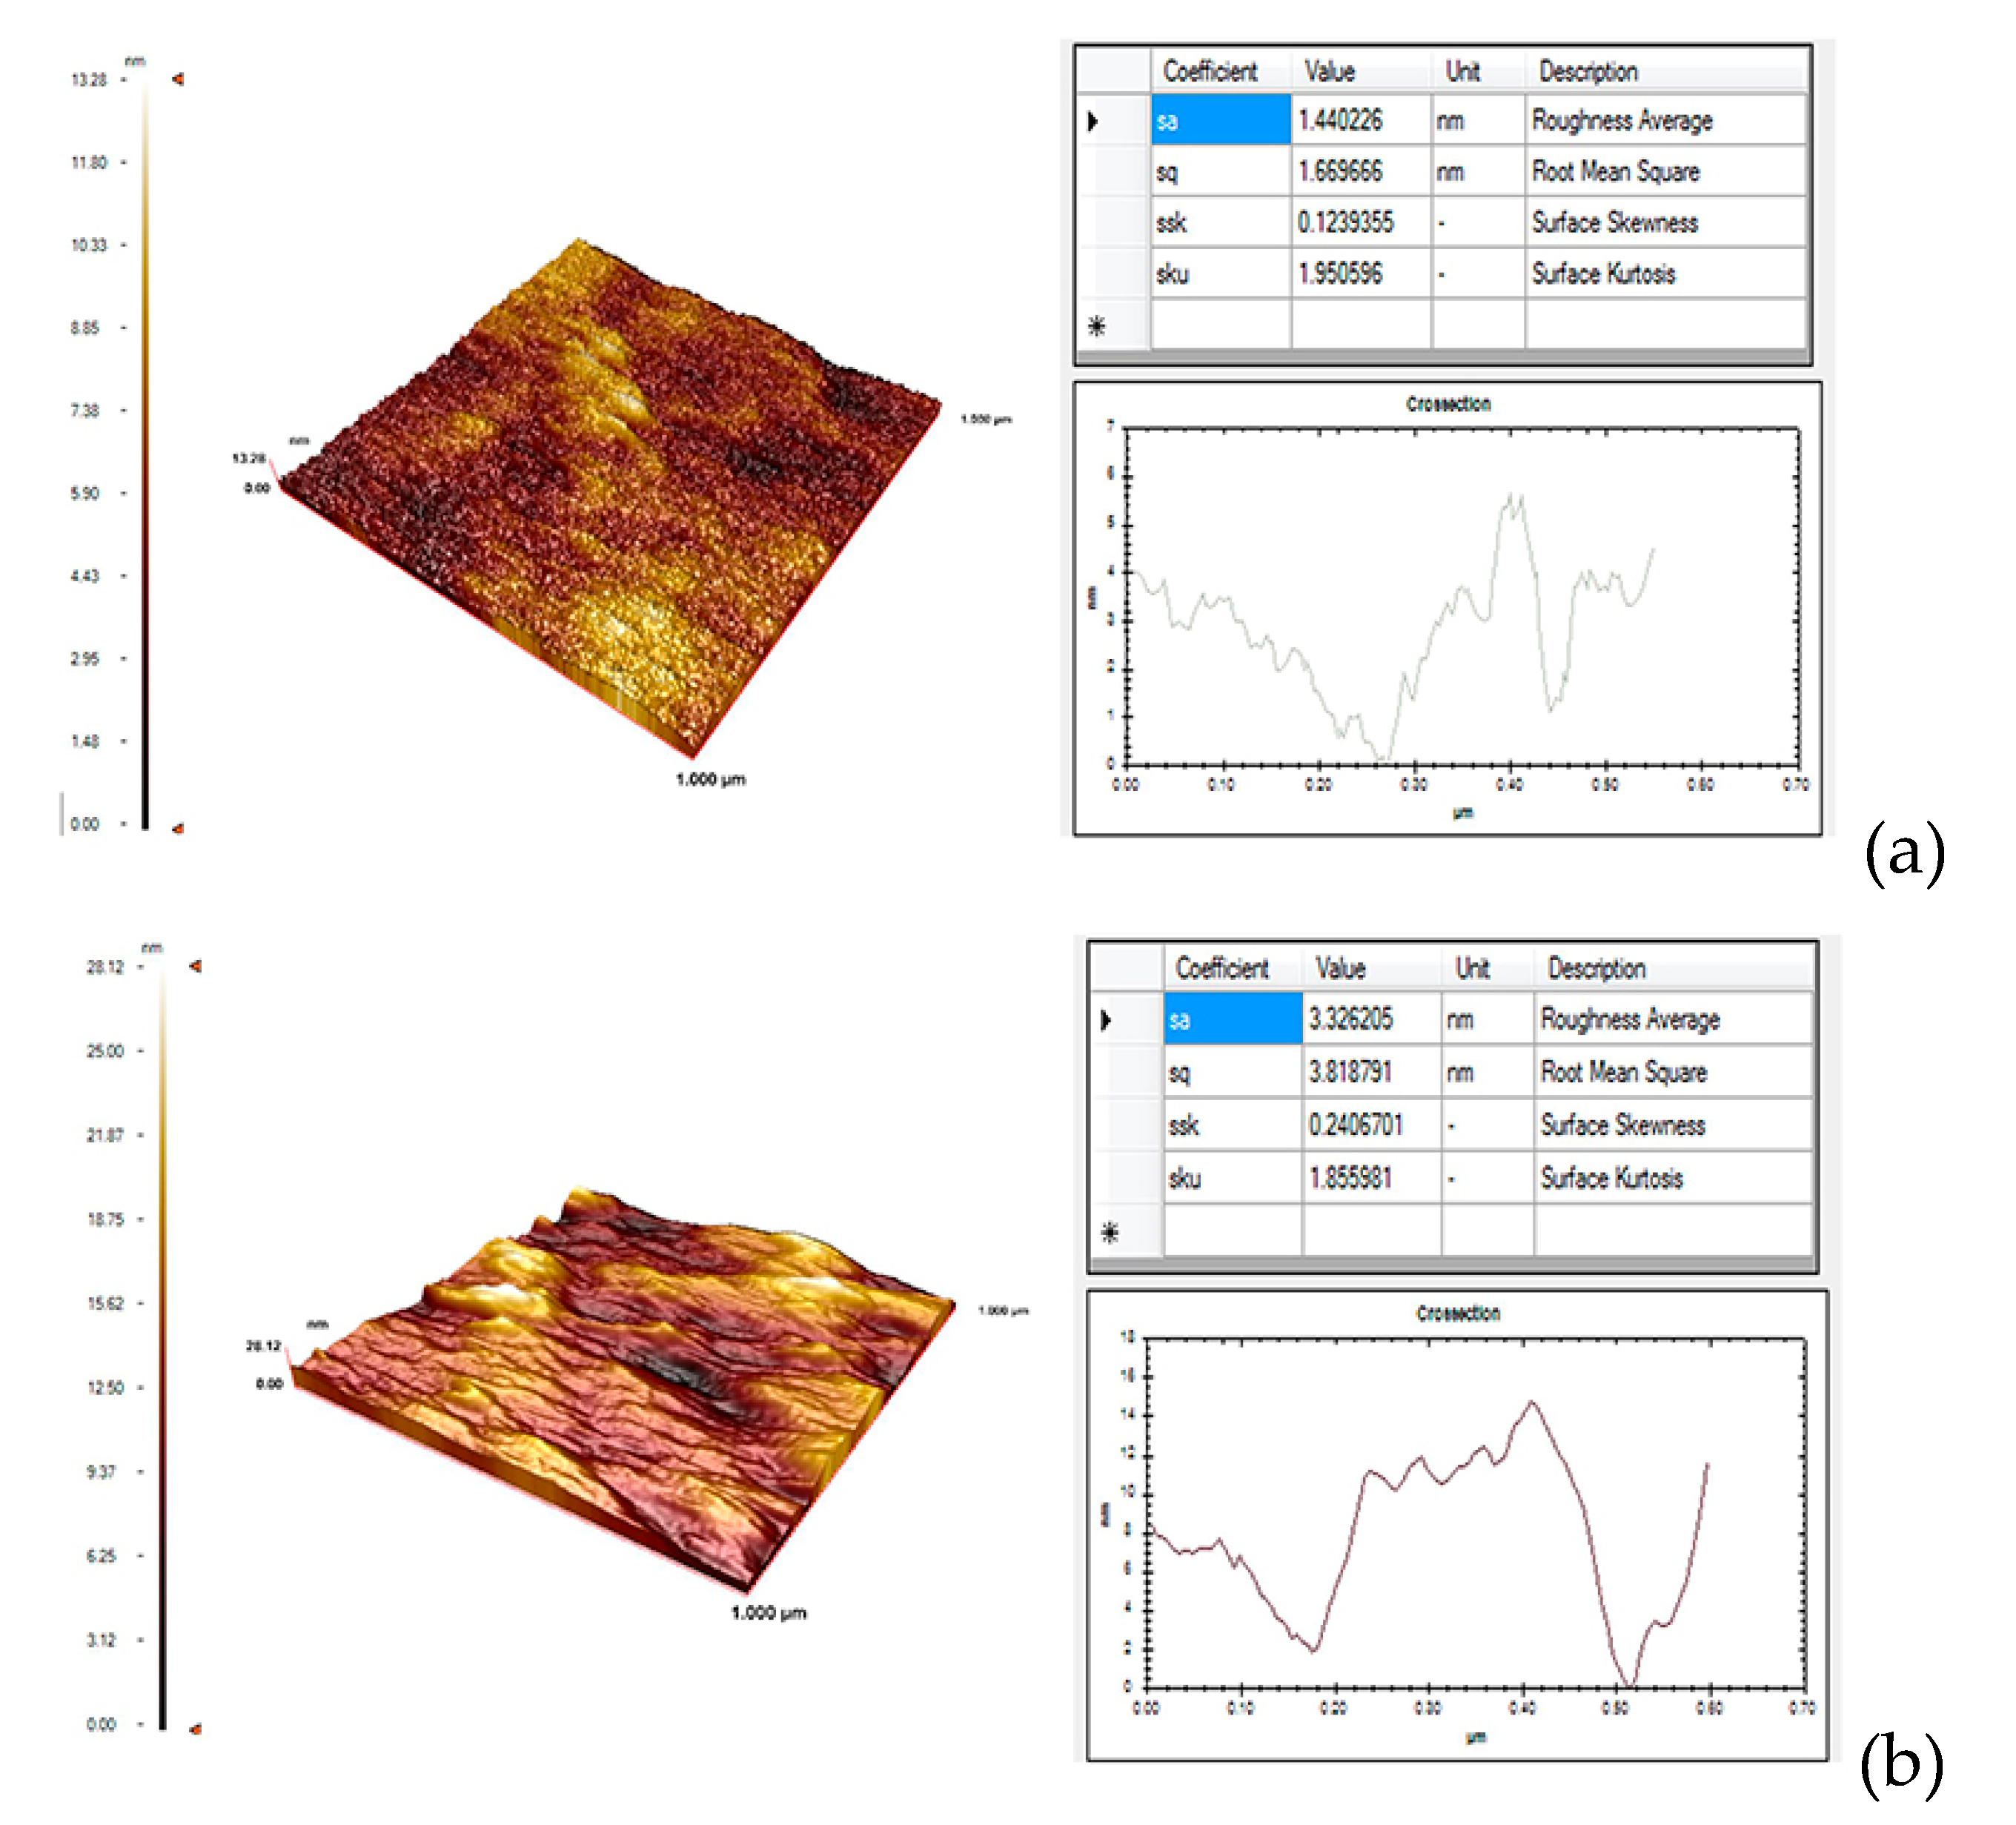
Figure 3.
Sensogram graph of the signals of interactions between the SPR aptasensor and total cocaine samples in the concentration range of 0-1000 ng/mL; (a) PBS 7.4 equilibrium solution; (b) adsorption step; (c) the desorption step.
Figure 3.
Sensogram graph of the signals of interactions between the SPR aptasensor and total cocaine samples in the concentration range of 0-1000 ng/mL; (a) PBS 7.4 equilibrium solution; (b) adsorption step; (c) the desorption step.
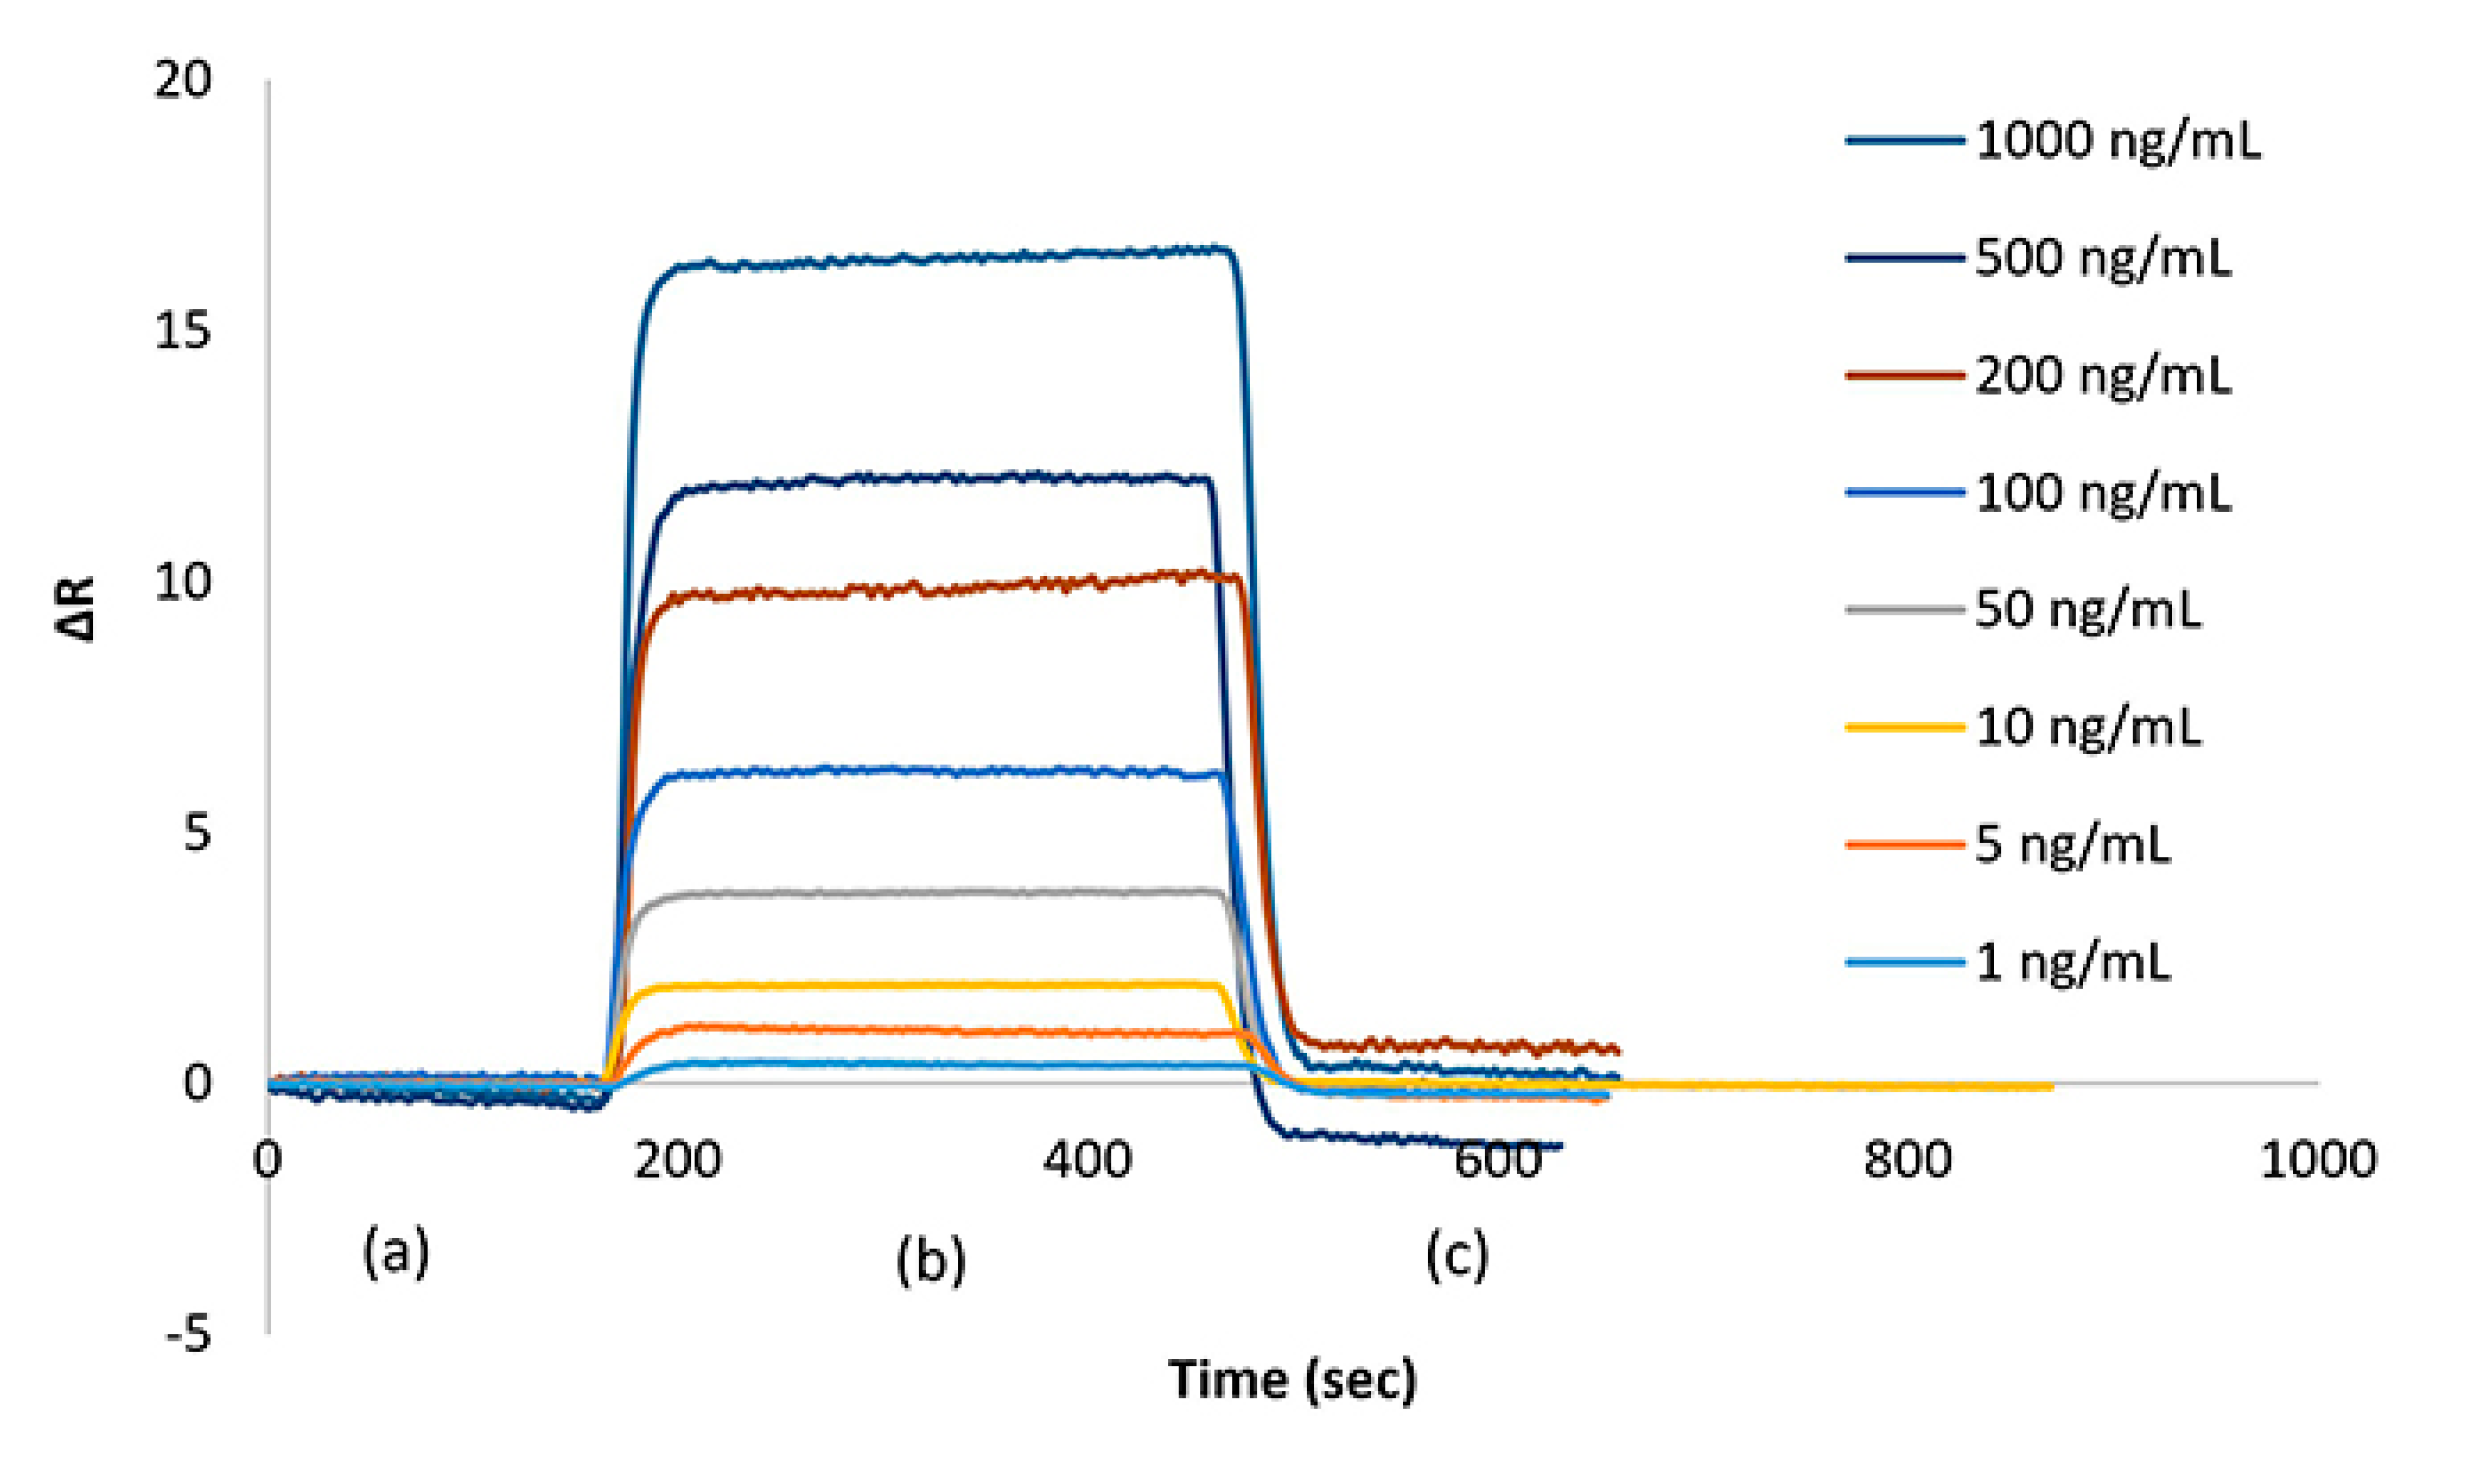
Figure 4.
Sensogram plot of the signals of interactions between the SPR aptasensor and synthetic urine samples containing total cocaine in the concentration range of 0-1000 ng/mL; (a) PBS 7.4 equilibrium solution; (b) adsorption step; (c) the desorption step.
Figure 4.
Sensogram plot of the signals of interactions between the SPR aptasensor and synthetic urine samples containing total cocaine in the concentration range of 0-1000 ng/mL; (a) PBS 7.4 equilibrium solution; (b) adsorption step; (c) the desorption step.
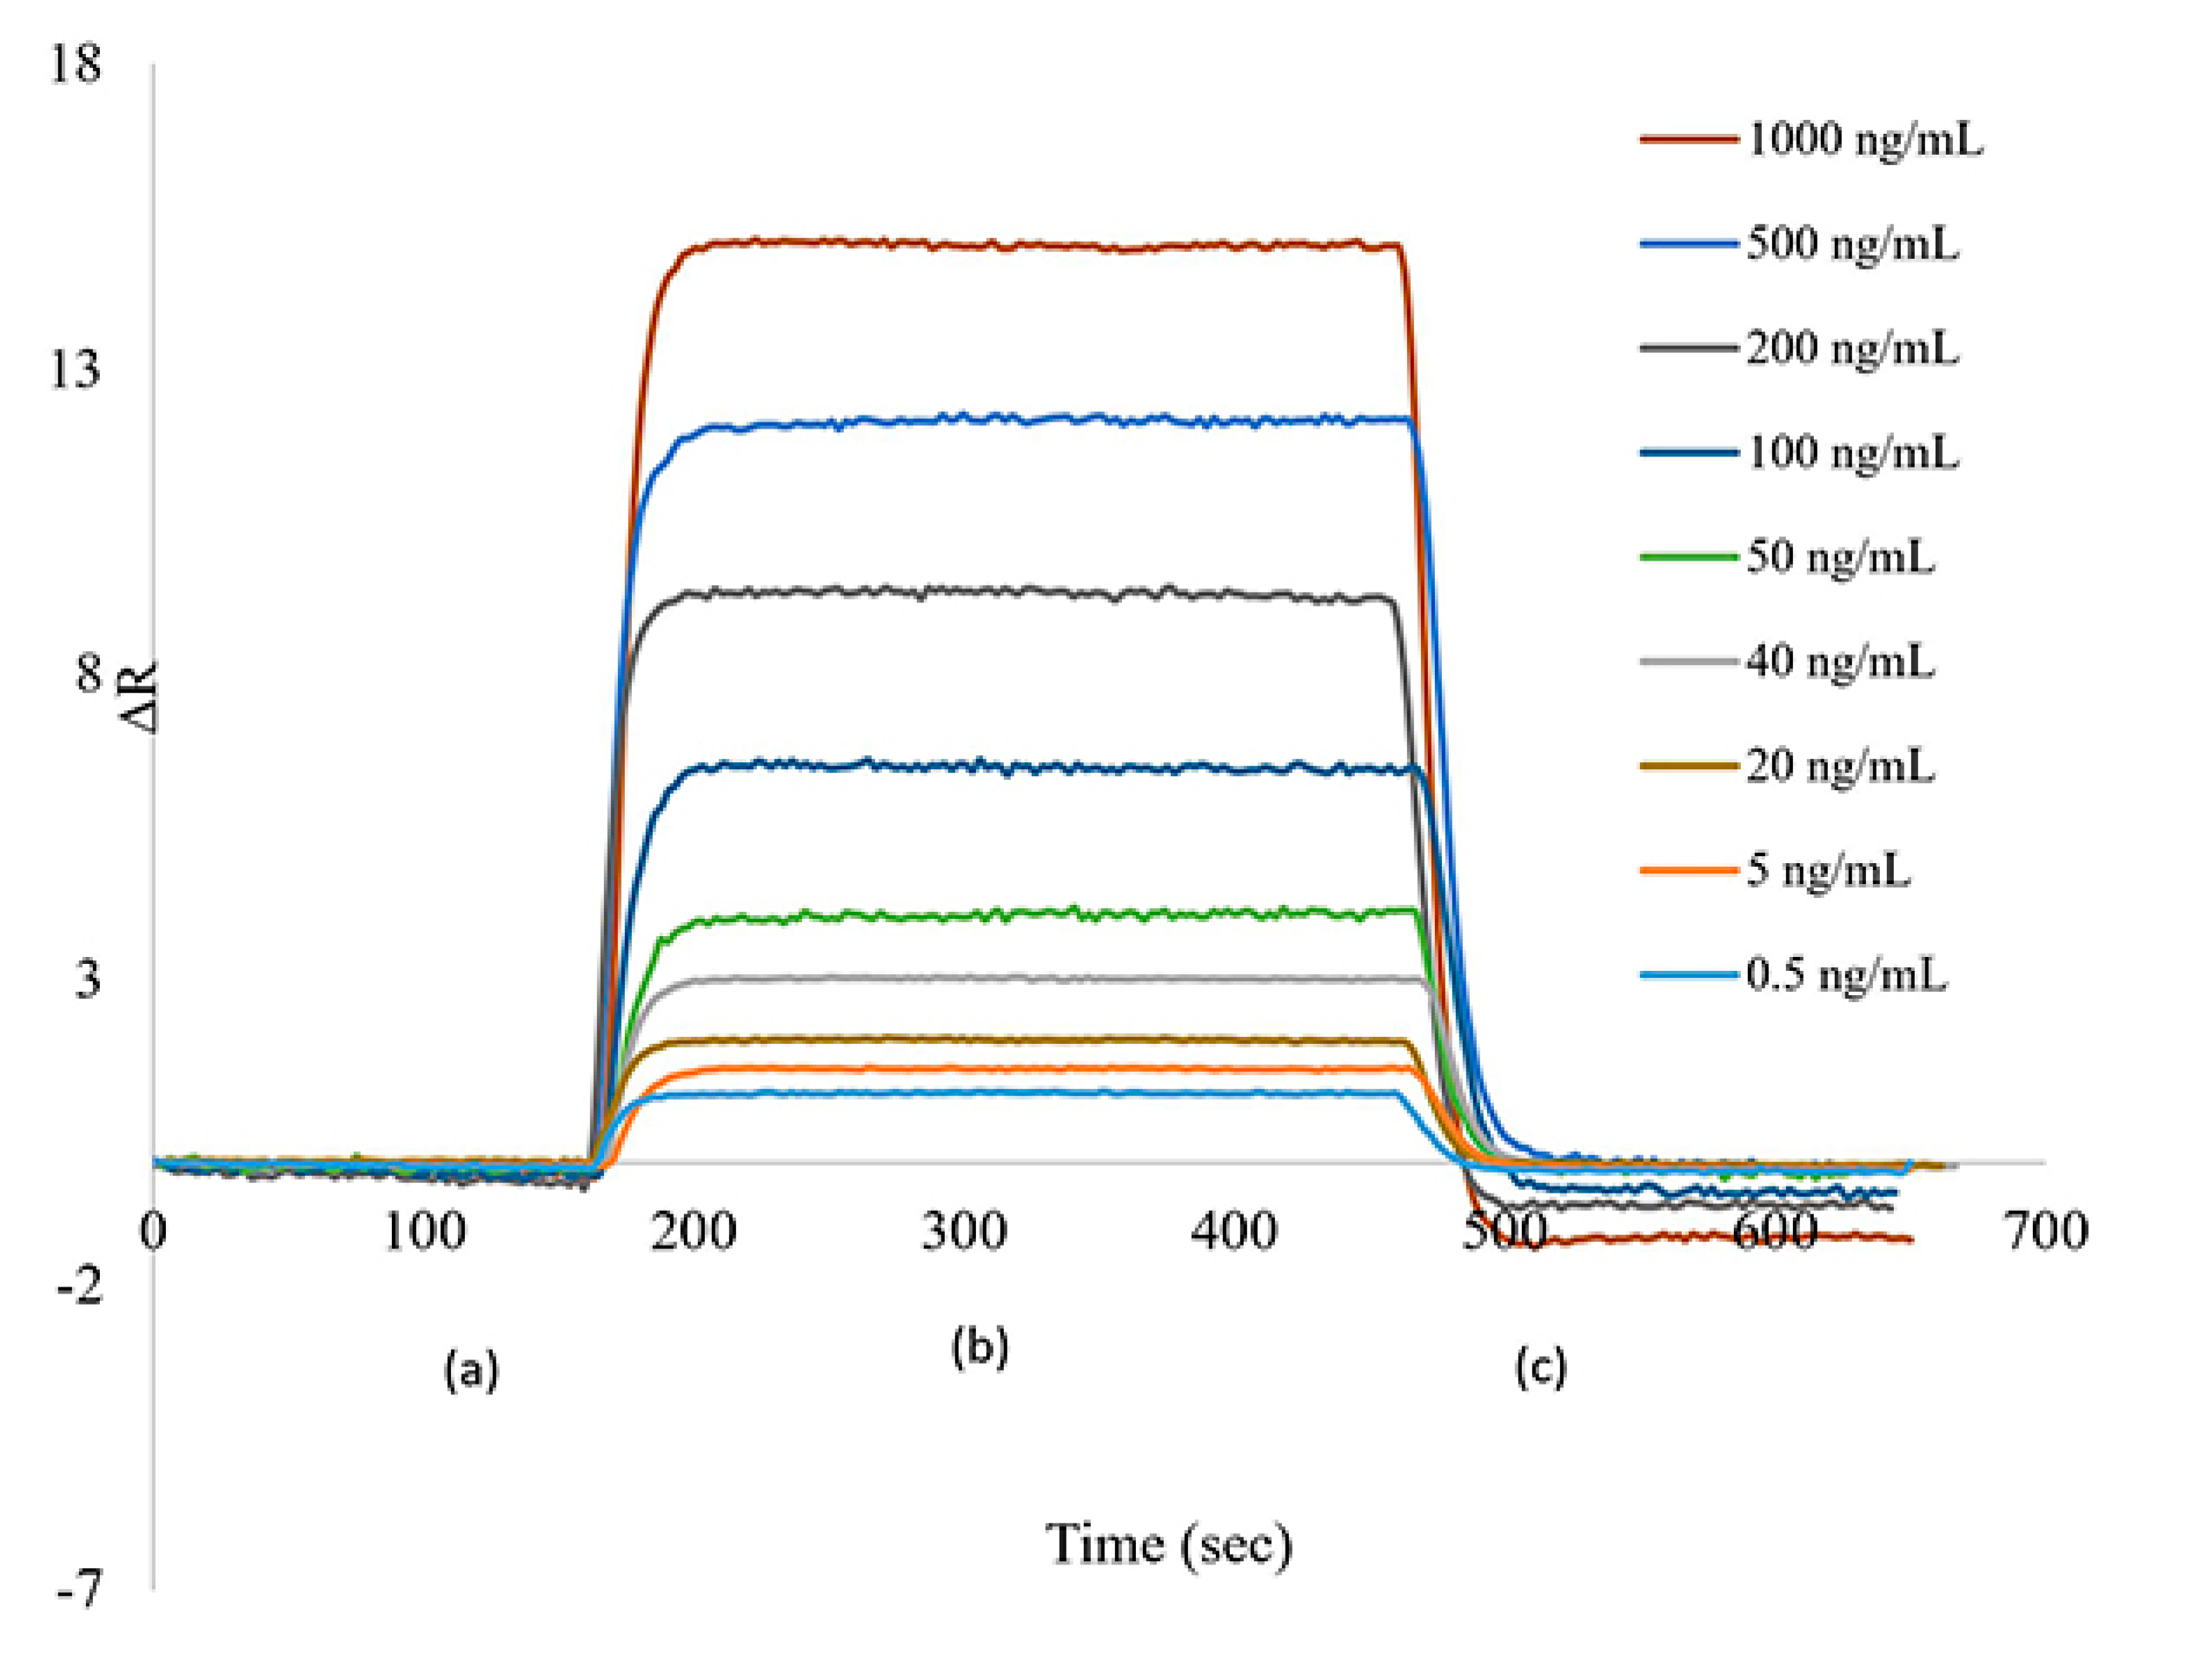
Figure 5.
(a) Concentration-dependent calibration plots with SPR aptasensor: 0 ng/mL-50 ng/mL cocaine; PBS 7.4 buffer. (b) Concentration-dependent calibration plots with SPR aptasensor: 200 ng/mL-1000 ng/mL cocaine; PBS 7.4 buffer.
Figure 5.
(a) Concentration-dependent calibration plots with SPR aptasensor: 0 ng/mL-50 ng/mL cocaine; PBS 7.4 buffer. (b) Concentration-dependent calibration plots with SPR aptasensor: 200 ng/mL-1000 ng/mL cocaine; PBS 7.4 buffer.
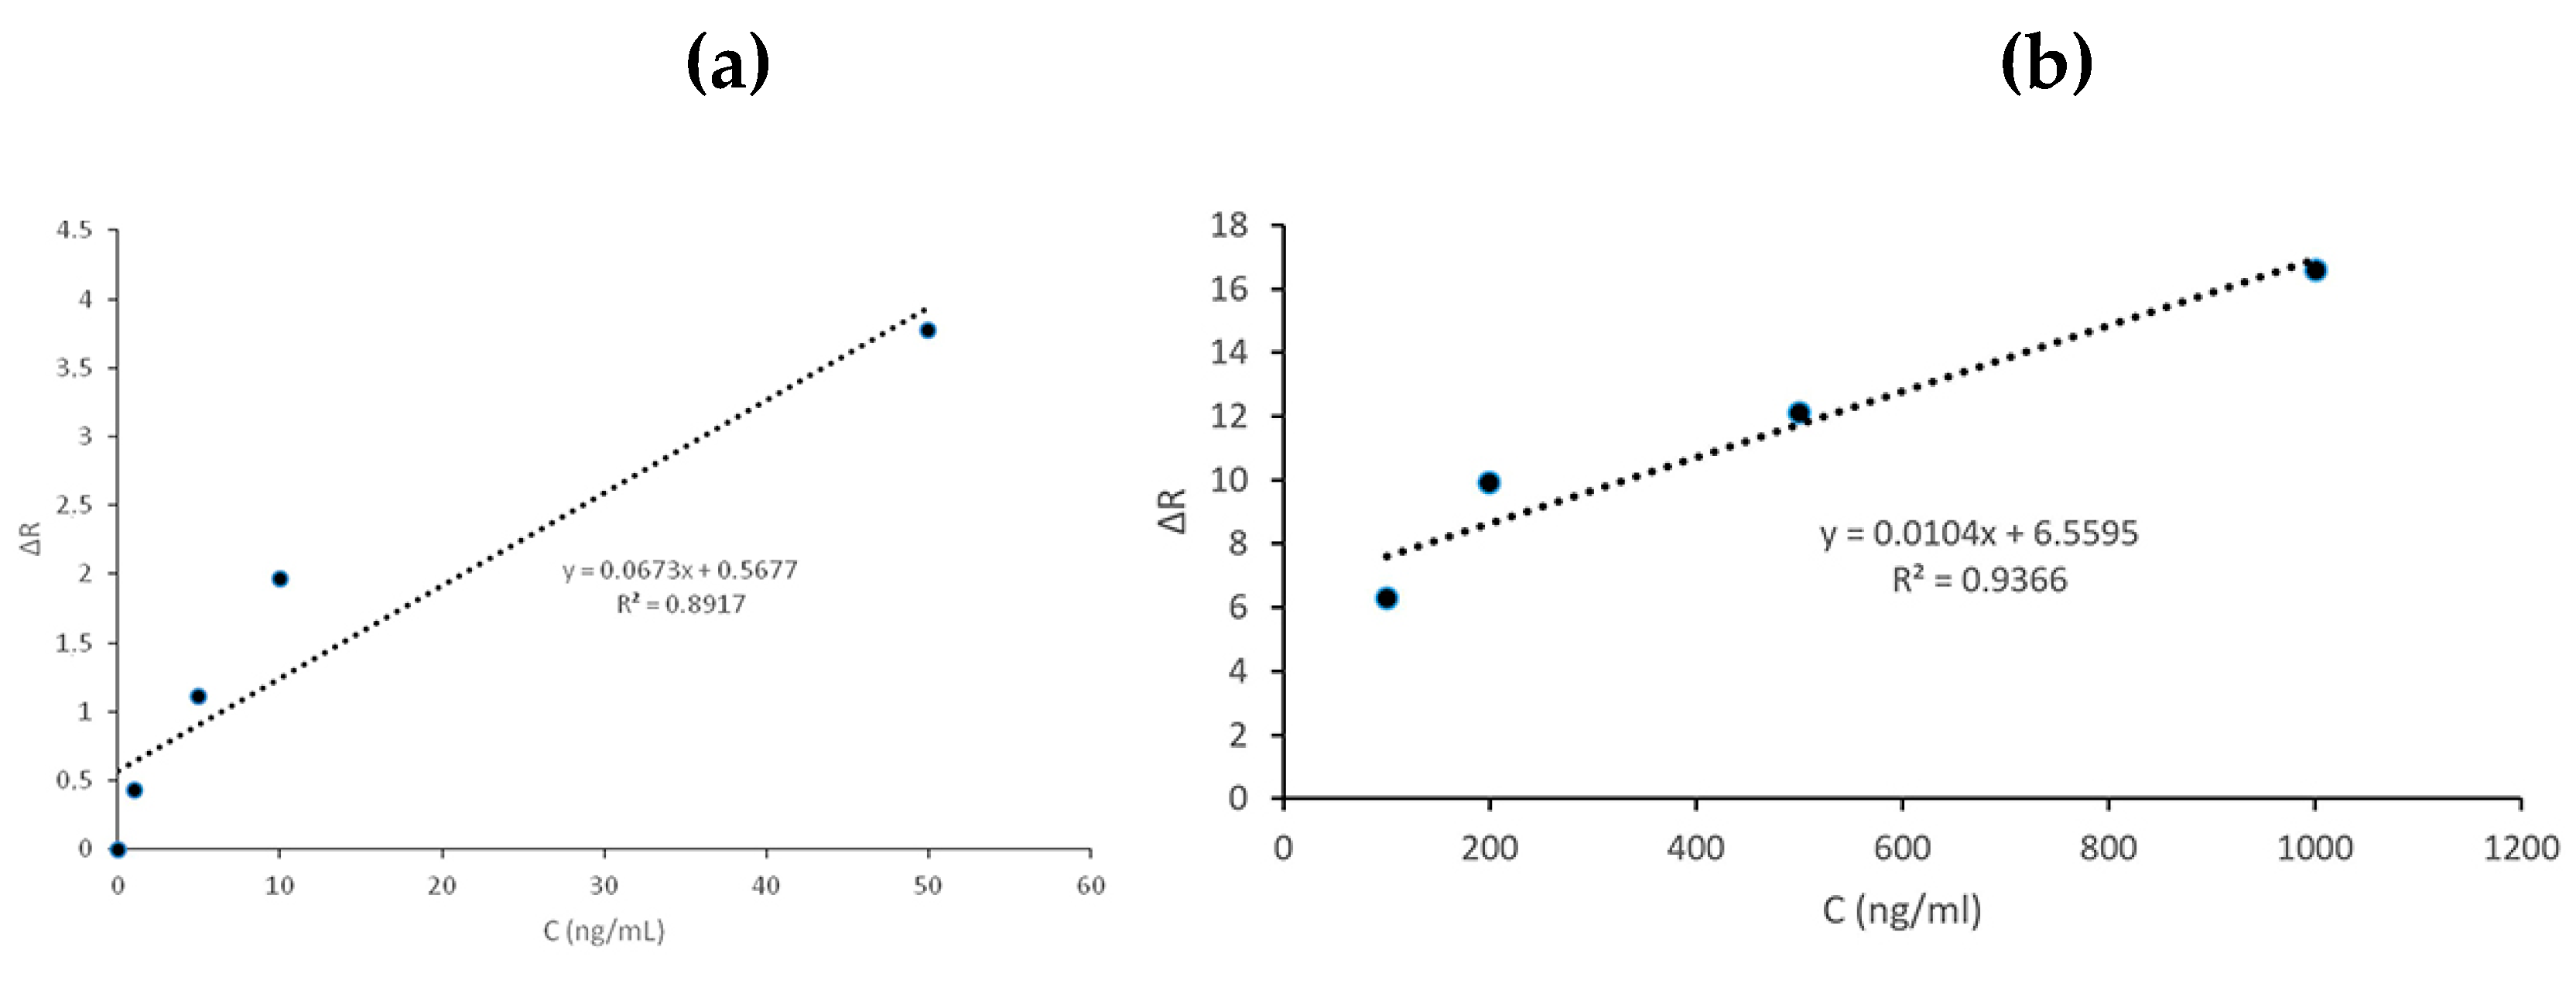
Figure 6.
Repeatability results of the SPR aptasensor: Concentration 200 ng/mL.
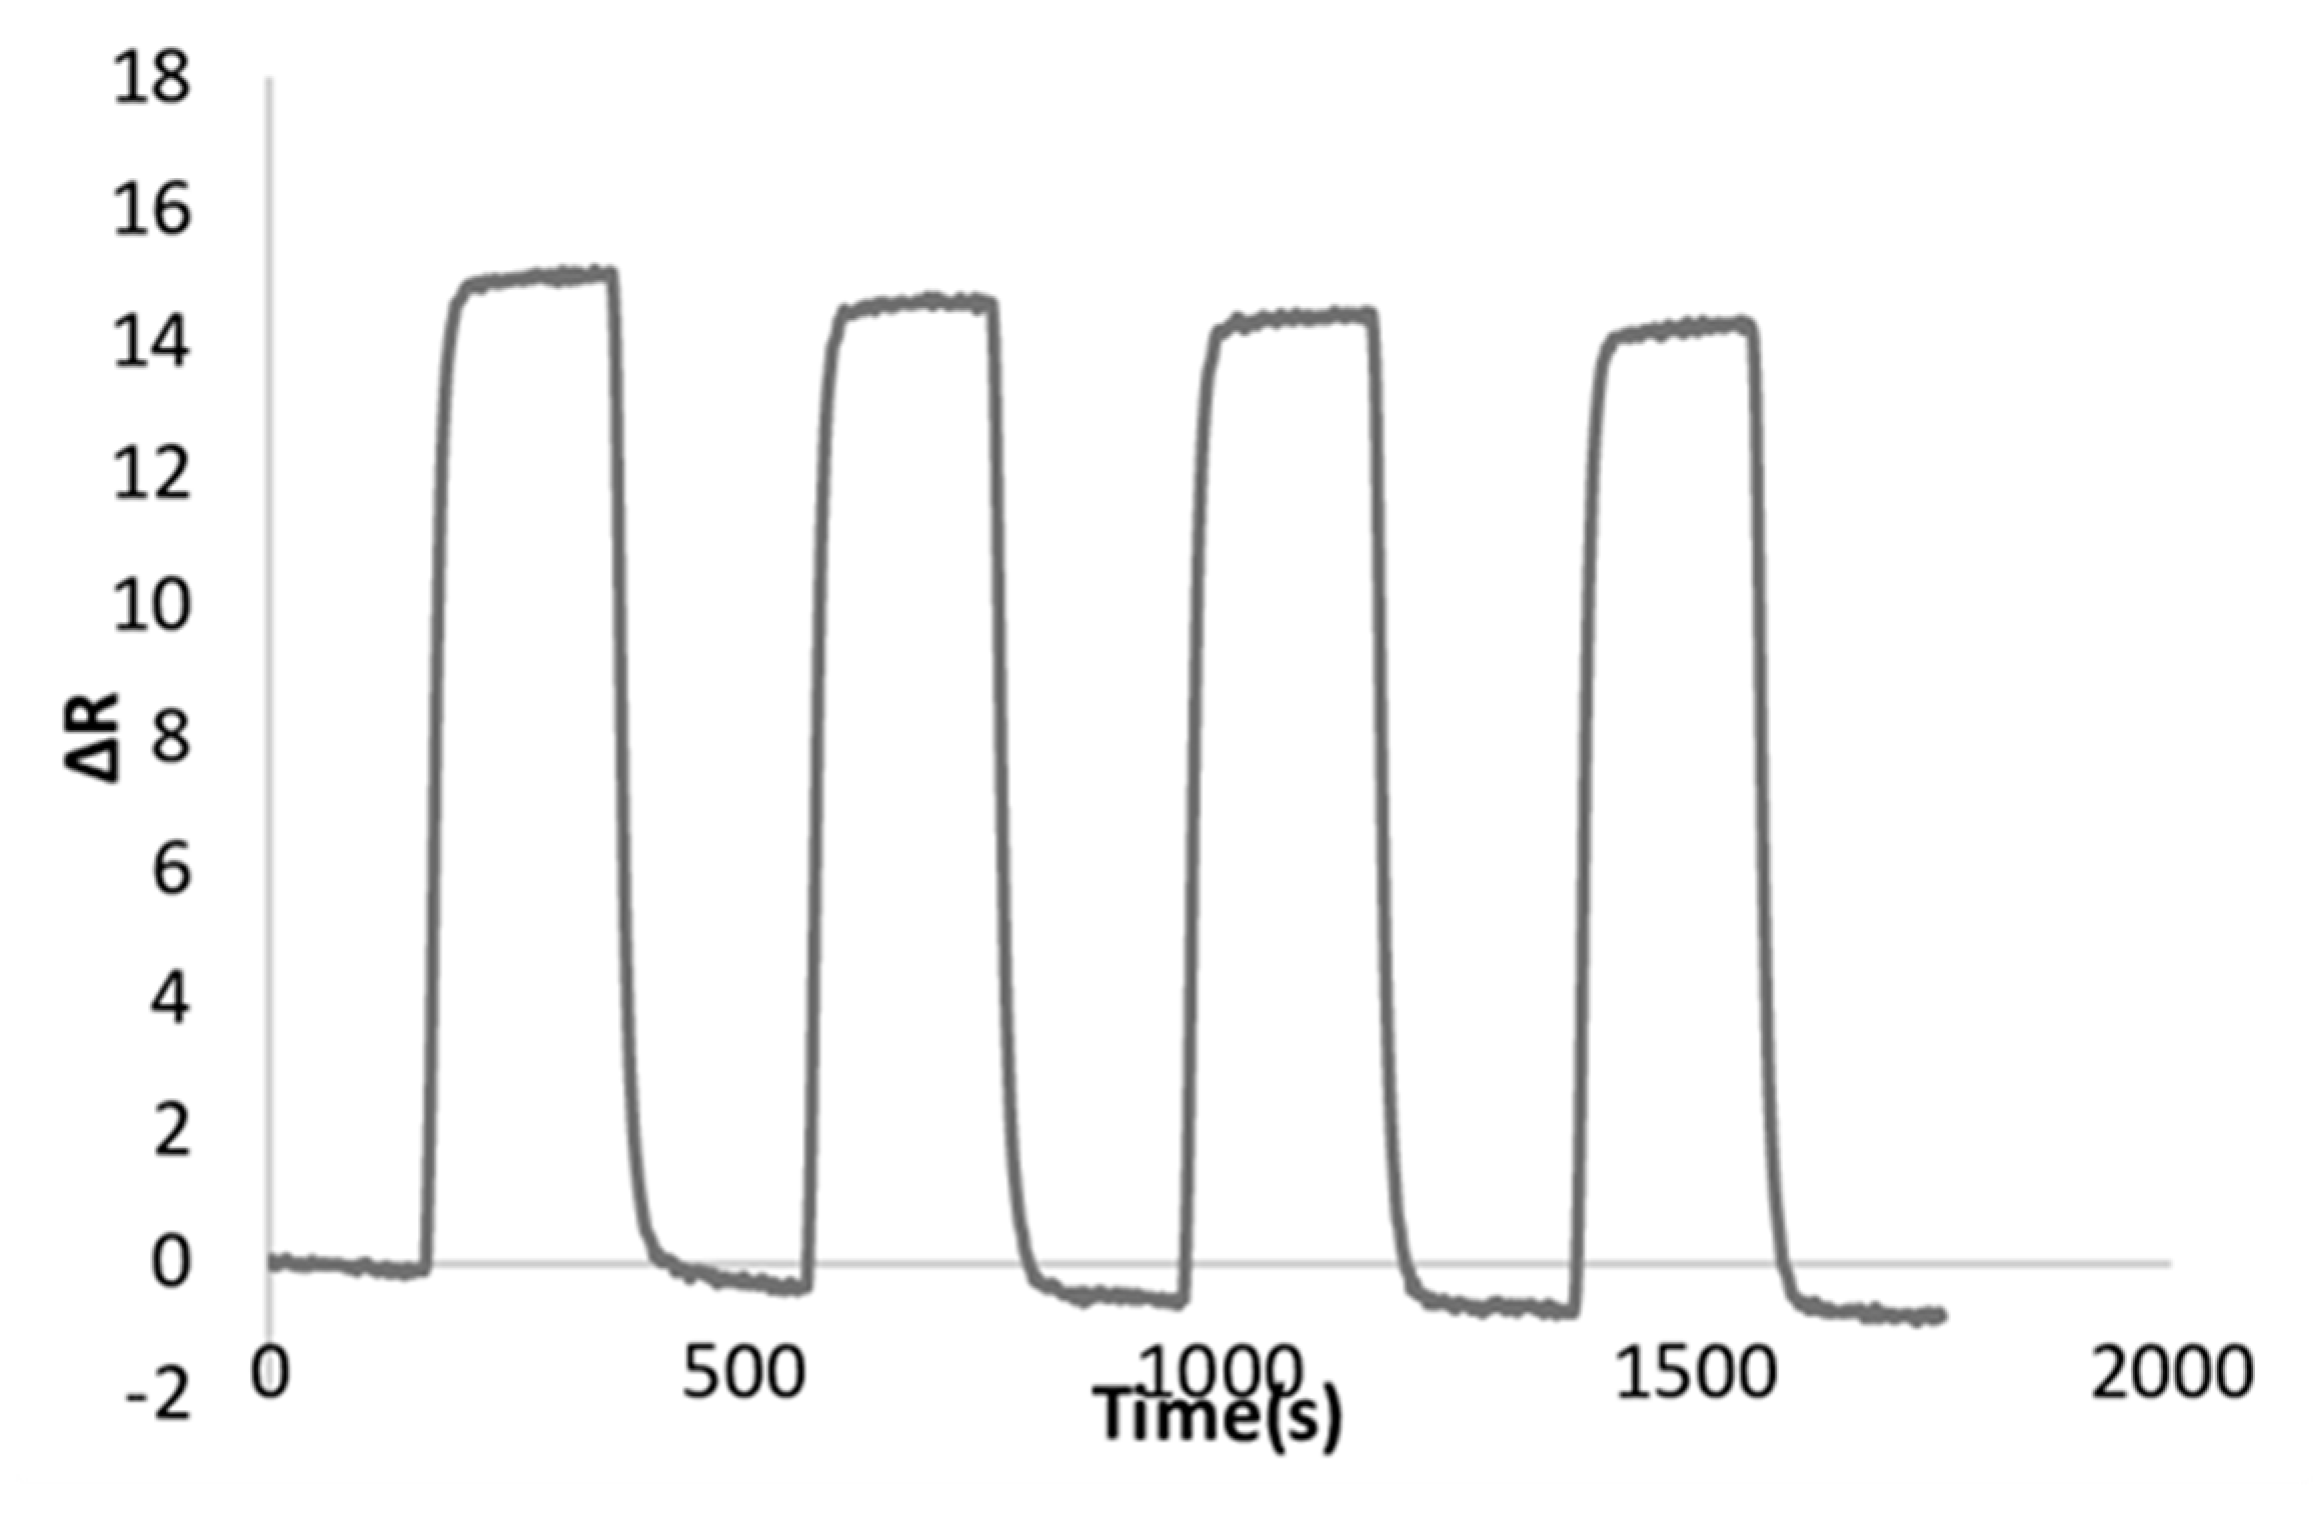
Figure 7.
(a) Plot of modified SPR aptasensor Langmuir adsorption model, (b) modified SPR aptasensor Freundlich model, (c) modified SPR aptasensor Langmiur-Freundlich model.
Figure 7.
(a) Plot of modified SPR aptasensor Langmuir adsorption model, (b) modified SPR aptasensor Freundlich model, (c) modified SPR aptasensor Langmiur-Freundlich model.
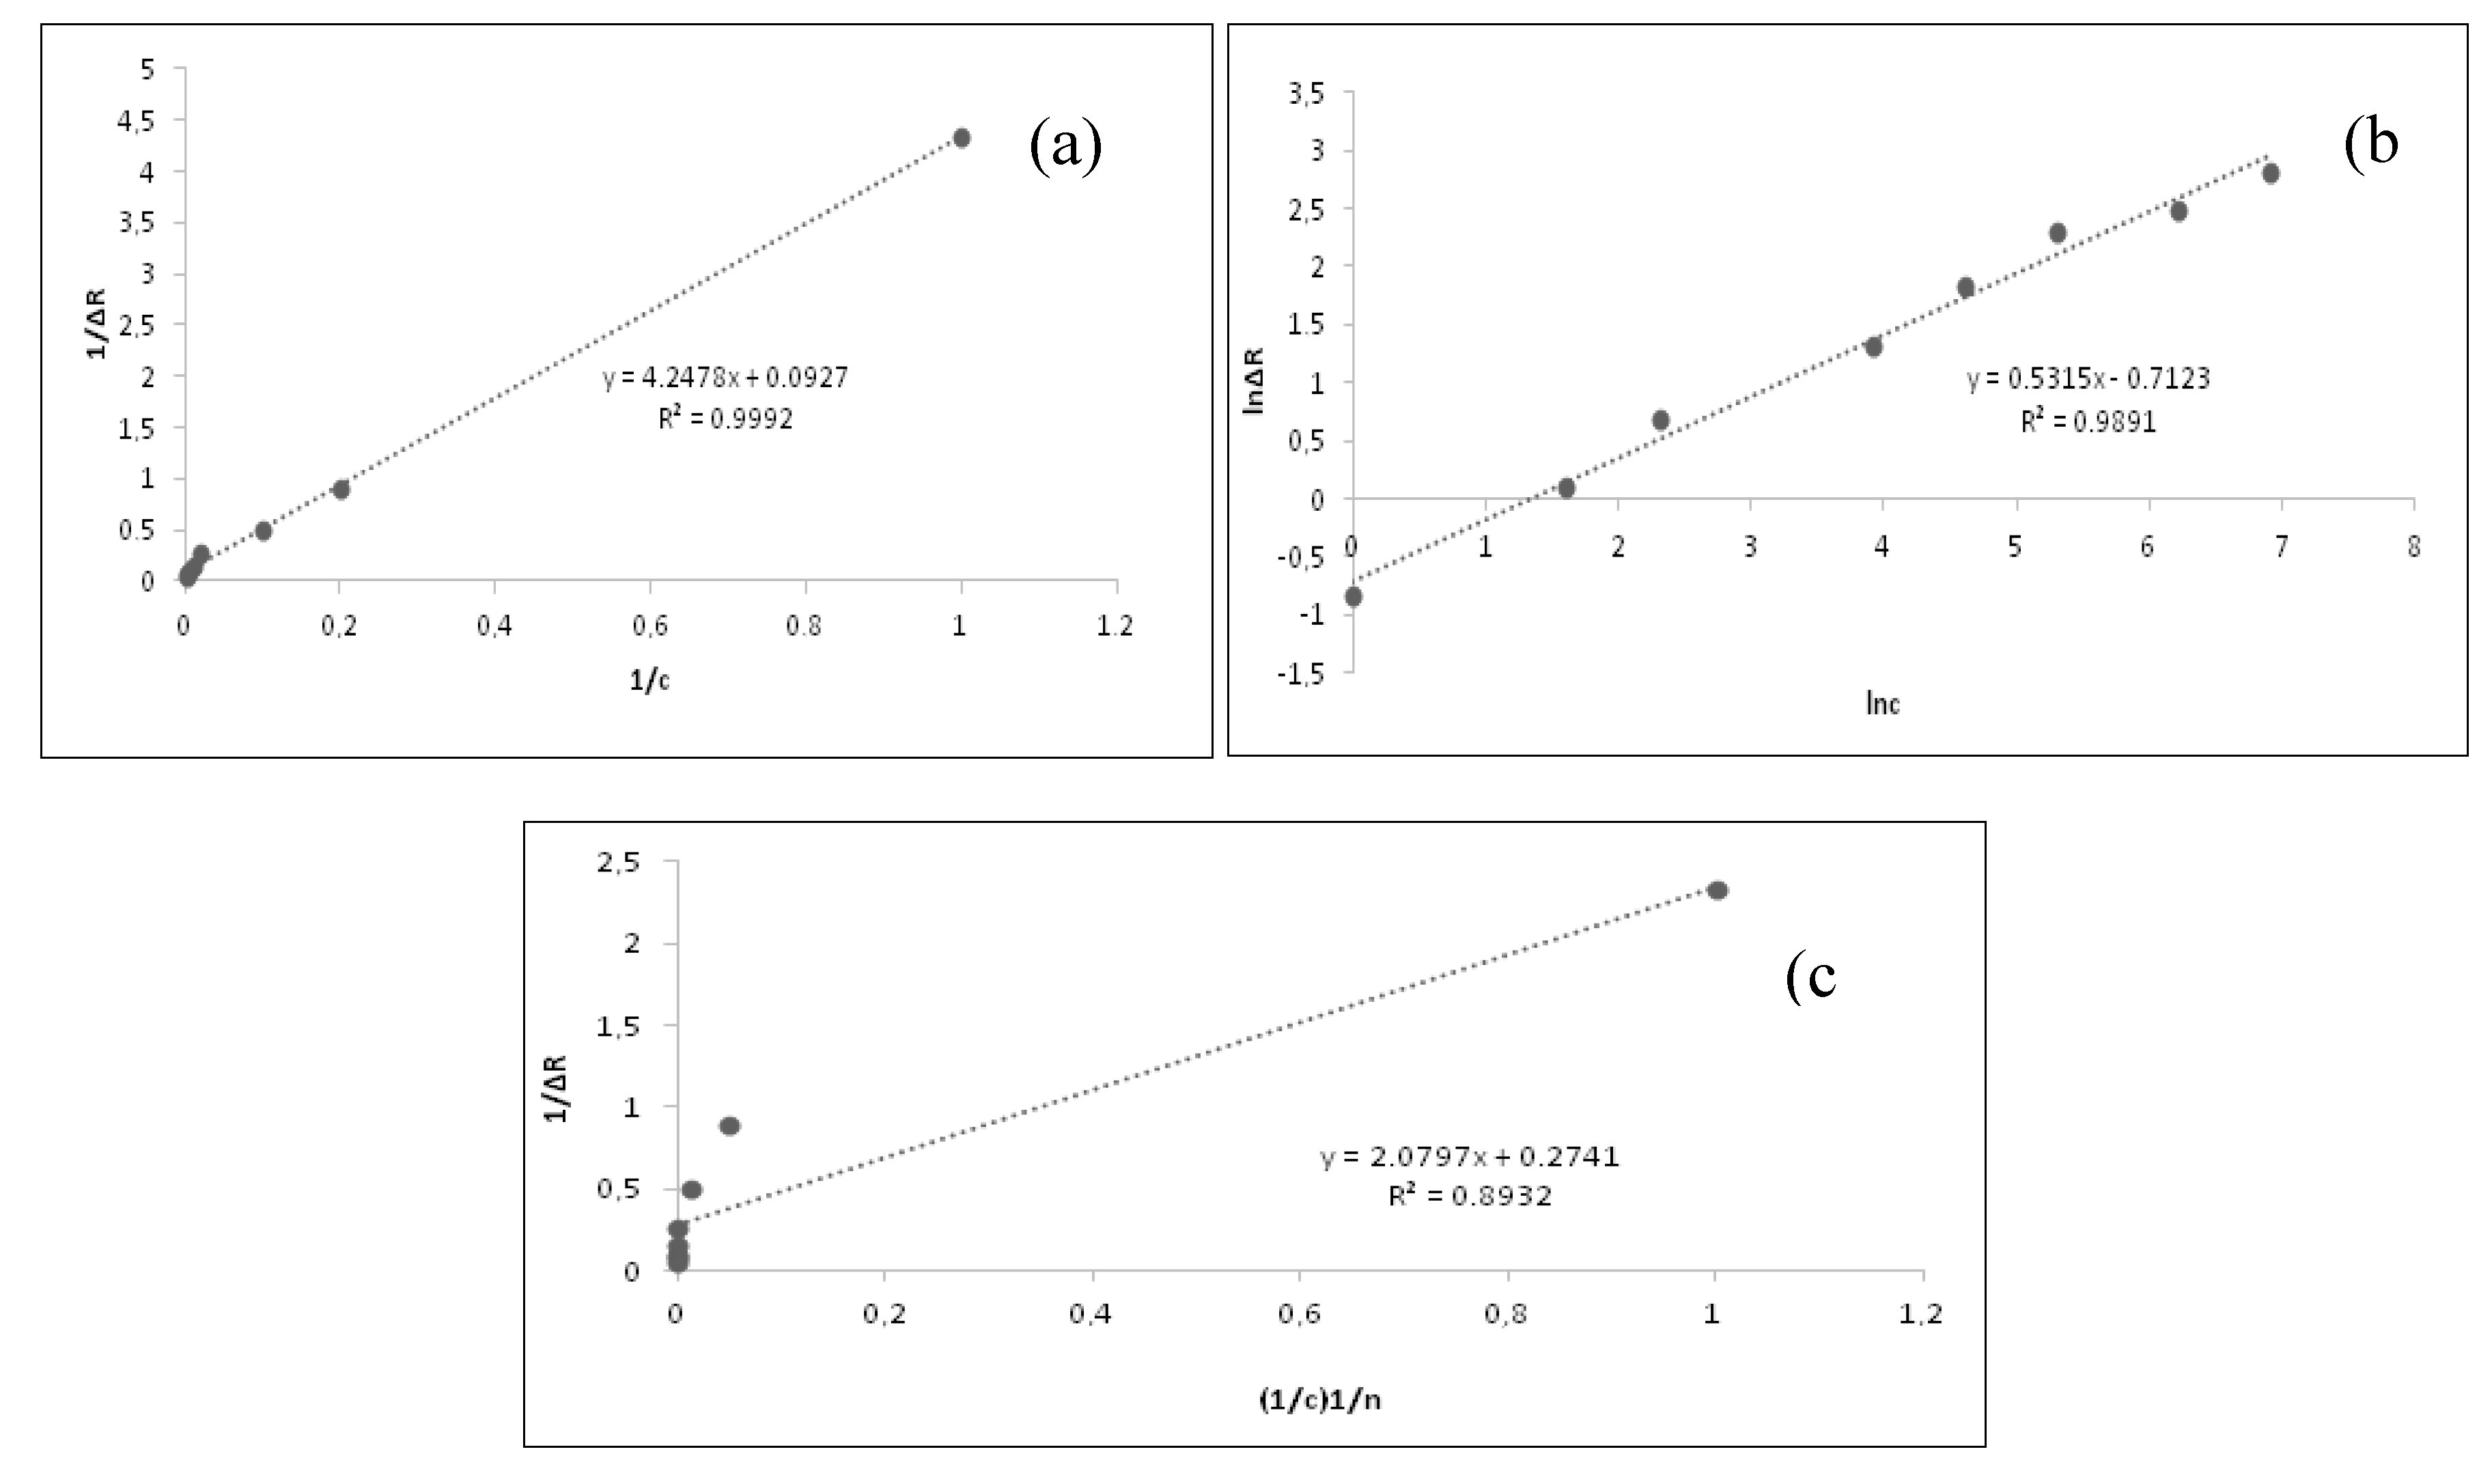

Table 1.
Balance and binding kinetic parameter values of SPR chip [25].
Table 1.
Balance and binding kinetic parameter values of SPR chip [25].
| Scatchard | Binding Kinetic Analysis | ||
|---|---|---|---|
| ΔRmax | 13.88 | ka / (ng/mL)-1.s-1 | 0.0005 |
| KA / (ng/mL)-1 | 0.018 | kd / s-1 | 0.0042 |
| KD / ng/mL | 55.55 | KD / ng/mL | 8.4 |
| R2 | 0.5932 | KA / (ng/mL)-1 | 0.11 |
| R2 | 0.9161 | ||
Table 2.
Langmuir, Freundlich and Langmuir-Freundlich isotherm model parameters of the SPR aptasensor [26].
Table 2.
Langmuir, Freundlich and Langmuir-Freundlich isotherm model parameters of the SPR aptasensor [26].
| Langmuir | Freundlich | Langmuir-Freundlich | |||
|---|---|---|---|---|---|
| ΔRmax | 10.86 | ΔRmax | 1.69 | ΔRmax | 3.70 |
| KD / ng/mL | 66.57 | 1/n | 0.53 | 1/n | 1.88 |
| KA / (ng/mL)-1 | 0.01 | R2 | 0.9891 | KD / ng/mL | 7.66 |
| R2 | 0.9992 | KA / (ng/mL)-1 | 0.13 | ||
| R2 | 0.8932 | ||||
Disclaimer/Publisher’s Note: The statements, opinions and data contained in all publications are solely those of the individual author(s) and contributor(s) and not of MDPI and/or the editor(s). MDPI and/or the editor(s) disclaim responsibility for any injury to people or property resulting from any ideas, methods, instructions or products referred to in the content. |
© 2024 by the authors. Licensee MDPI, Basel, Switzerland. This article is an open access article distributed under the terms and conditions of the Creative Commons Attribution (CC BY) license (http://creativecommons.org/licenses/by/4.0/).
Copyright: This open access article is published under a Creative Commons CC BY 4.0 license, which permit the free download, distribution, and reuse, provided that the author and preprint are cited in any reuse.


