
Submitted:
30 August 2024
Posted:
02 September 2024
You are already at the latest version
Abstract
Chronic noncommunicable diseases (NCDs) are responsible for approximately 74% of deaths globally. Medicinal plants have traditionally been used to treat NCDs, including diabetes, cancer, and rheumatic diseases, and are a source of anti-inflammatory compounds. This study aimed to evaluate the anti-inflammatory effects of Rhus trilobata (Rt) extracts and fractions in lipopolysaccharide (LPS)-induced inflammation models in vitro and in vivo. The aqueous extract (RtAE) and five fractions (F2 to F6) were obtained via C18 solid-phase separation and tested in murine LPS-induced J774.1 macrophages. Key inflammatory markers such as IL-1β, IL-6, TNF-α, and COX-2 gene expression were measured using RT-qPCR, and PGE2 production was assessed via HPLC-DAD. The in vivo effects were tested in an LPS-induced paw edema model in Wistar rats. Results showed that RtAE at 15 μg/mL significantly decreased IL-1β and IL-6 gene expression in vitro. Fraction F6 further reduced IL-1β, TNF-α, and IL-6 gene expression, COX-2 expression, and PGE2 production. In vivo, F6 significantly reduced LPS-induced paw edema, inflammatory infiltration, and IL-1β and COX-2 protein expression. These findings support the anti-inflammatory potential of RtAE and F6, reinforcing the medicinal use of Rt.

Keywords:
cyclooxygenase
; inflammation
; interleukin-1
; macrophages
; paw edema
; prostaglandin E2
; Rhus trilobata
1. Introduction
Chronic noncommunicable diseases (NCDs), such as systemic lupus erythematosus, multiple sclerosis, and rheumatoid arthritis, significantly impact the healthcare system [1]. It is estimated that 74% of deaths globally are caused by NCD [2]. In developing countries such as Mexico, public health systems face many challenges in caring for these diseases efficiently, and most patients have difficulty accessing private care due to the high costs. All these diseases commonly involve the development of an ongoing inflammatory process [3].
Inflammation is a complex set of interactions between soluble factors and cells that lead to the healing of damaged tissue; these interactions can be acute or chronic, the latter generating health consequences [4]. During inflammation, activated macrophages (MOs) produce chemical mediators such as prostaglandin E2 (PGE2) through the induction of the cyclooxygenase (COX)-2 isoenzyme [5], as well as proinflammatory cytokines such as interleukin (IL)-1β, IL-6, and tumor necrosis factor (TNF)-α [6,7]. IL-1β acts in the innate immune response on several cell types, mainly on MOs [8,9]. IL-6 has several functions, primarily promoting cell growth and differentiation and mediating the acute phase response to the onset of inflammation [10]. TNF-α is involved in transendothelial differentiation and migration, leukocyte adhesion, and apoptosis [11]. Excessive production of proinflammatory cytokines or dysregulation of this process can lead to inflammation, resulting in tissue damage, hemodynamic changes, and organ failure [12].
The discovery of plant secondary metabolites that inhibit the production of proinflammatory mediators with a positive effect on the resolution of inflammation is of increasing interest to the scientific community [13,14].
Rhus trilobata Nutt. (Rt; Anacardiaceae) grows widely from southern Canada to central Mexico [15]. Rt is traditionally used to treat gastrointestinal diseases and cancer; however, scientific information on its use and potential pharmacological properties is scarce [16]. Recently, our research group reported the antineoplastic effect of RtAE in colon and ovarian cancer cell lines. Additionally, in vivo toxicological studies in mice revealed that intraperitoneal administration of 200 mg/kg RtAE or an active antineoplastic fraction caused significant changes neither in behavioral or histological parameters nor in biochemical markers [17,18]. However, slight leukopenia in mice treated with RtAE and the antineoplastic fraction at 14 days posttreatment was detected, although no studies have been conducted to clarify this point [18]. Chemical characterization of RtAE revealed high contents of polyphenols and flavonoids, which are reportedly antioxidant and anti-inflammatory compounds [18].
The components included methyl gallate, epigallocatechin 3-cinnamate, quercetin 3-(2″”-galloylglucosyl)-(1→2)-alpha-L-arabinofuranoside, β-PGG, 4-O-digalloyl-1,2,3,6-tetra-O-β-D-galloylglucose, myricetin 3-(4″-galloylrhamnoside), and fisetin, some of which have been reported to have anti-inflammatory effects [19,20,21]. Some of these compounds have been studied in extracts from other plants of the Rhus genus; for example, dyhidrofisetin, a polyphenol compound derived from fisetin present in Rhus verniciflua Stokes, significantly reduced TNF-α, IL-1β, IL-6, and monocyte chemotactic protein (MCP-1) in carrageenan-stimulated RAW 264.7 macrophages or in in vivo carrageenan-induced mouse paws [22]. Since inflammation is a multistep cascade, in vitro studies are required to screen for anti-inflammatory activity and discover cell targets; moreover, in vivo studies allow the evaluation of cytokine modulation. In this study, we first evaluated the effect of RtAE, and fractions obtained by solid phase separation on the mRNA expression of IL-1β, TNF-α, IL-6, and COX-2 in cultures of macrophages (MOs) J774A.1 stimulated in vitro with lipopolysaccharide (LPS). After that, we evaluated the effect of RtAE and fractions in the LPS-induced paw edema model. LPS-induced paw edema is an acute inflammation in vivo model that is helpful for evaluating TNF-α, IL-1β, and COX-2 expression [23].
2. Results
2.1. Effect of Rhus trilobata Extracts on MO Cell Viability
To assess whether RtAE and its fractions had cytotoxic effects on J774.1 MOs, cell viability was analyzed by MTT assays at 24 h. As depicted in Figure 1A, at 15 μg/mL RtAE, fractions F3, F5, and F6 did not significantly decrease cell viability compared with that of nonstimulated cells, and F2 and F4 did not reduce viability by more than 40% (Figure 1 A). At 20 μg/mL, compared with nonstimulated cells, cells treated with RtEA or F2 significantly decreased MOs viability. In the cultures treated with F4 and F6, cell viability was reduced by more than 60% (Figure 1B). Therefore, 15 μg/mL was used to evaluate the secretion of inflammatory mediators in LPS-induced MOs.
2.2. Rhus trilobata Anti-Inflammatory Activity in LPS-Induced MOs
To analyze the effect of RtEA and the fractions on the expression of inflammatory mediators, the mRNA expression of IL-6, TNF-α, IL-1β, and COX-2 was quantified via RT‒qPCR. Figure 2A shows that treatment with RtEA, F4, F5, or F6 significantly decreased IL-1β expression in LPS-stimulated MOs; RtEA, F4, or F6 had an anti-inflammatory effect of approximately 90%, comparable to that of DXM. A similar effect on IL-6 expression was obtained with RtEA, F5, and F6 (Figure 2B). Interestingly, only F6 treatment significantly decreased TNF-α RNA expression (Figure 2C). Finally, F5 and F6 significantly reduced COX-2 RNA expression (Figure 2B).
Table 2 shows the percentage of decreased PGE2 production by RtAE and fractions. Compared with LPS-stimulated MOs, control MOs not stimulated or treated with DXM showed little or no significant increase in PGE2 production (Table 2 and Figure 3). DXM was the most effective treatment, followed by the F6 and F3 treatments, but the difference was not significant. Fractions F2 and RtAE decreased PGE2 release by half, followed by F5, and F4 was the least effective.
2.3. In Vivo Evaluation of the Anti-Inflammatory Effect of RtAE and Its Fractions
The anti-inflammatory effects of RtAE and its fractions were evaluated in an LPS-induced paw edema model. After 12 hours of stimulation, all the rats exhibited significantly greater right paw thickness (p < 0.05) than on day 0. As shown in Table 3, treatment with 500 µg of DXM reduced inflammation by 93% (p < 0.005). Treatment with 500 µg of RtAE, F3, or F6 had a significant anti-inflammatory effect, confirming the findings of the in vitro experiments. Treatment with F2 or F4 did not significantly reduce inflammation; therefore, these fractions were excluded from the subsequent tests. Therefore, the anti-inflammatory effects of AE, F3, and F6 at 750 and 1,000 µg were evaluated (Table 4).
Increasing the dose to 750 µg increased the anti-inflammatory effect of RtAE (Table 4). However, a dose-dependent effect was not observed since an increase in the concentration of 1000 µg decreased the inhibition. For F3 and F6, increasing concentration decreased the anti-inflammatory effect. Therefore, the most significant increase in inflammation was achieved with RtAE (80% at 750 µg), followed by F6 (64% at 750 µg) and F3 (59% at 500 µg). Thus, histopathological changes and COX-2 and IL-1β protein expression were analyzed in these groups by IHC.
Histopathological analysis of the LPS-induced edema controls revealed that the cellular infiltrate was composed mainly of macrophages and neutrophils in the connective tissue and the stratum spinosum. A decrease in cellular infiltration was evident in tissues treated with DXM (control), followed by F3 and F6 (Figure 4A).
The signals for IL-1β and COX-2 in the samples were detected in cells from connective tissue (Figure 4A; see also Supplementary Fig. 1). Quantification of protein expression by O.D. measurements revealed high levels of both proteins in the tissues of LPS-stimulated and untreated footpads (Figure 4B and 4C). Treatment with DXM significantly inhibited the expression of IL-1β and COX-2 by 45% and 90%, respectively (Figure 4B and 4C). Treatment with 750 µg of RtAE suppressed, to a greater degree, IL-1β expression by 62%; F3 also decreased IL-1β expression (67% with 1000 µg), and F6 had the most significant inhibitory effect on 83% of the proteins (Figure 4B). No significant difference was found among the different concentrations of RtAE and F3, which induced a significant decrease in COX-2 protein expression from 28 to 41%, respectively (Figure 4C). Conversely, for F6, an increase in dose had a favorable effect only on COX-2 expression.
3. Discussion
The results presented here demonstrate that RtAE contains compounds that regulate inflammatory mediators and cytokine release in both in vivo and in vitro inflammatory models.
First, neither the concentrations of RtAE nor the fractions of RtAE were cytotoxic to J774.1 macrophages, which supported the observed effect on PGE2 and cytokine production and did not compromise the integrity of the J744.1 MOs.
One of the main objectives in discovering new therapies for treating acute or chronic inflammatory disorders is the inhibition of inflammatory mediators [24]. Second, we quantified the mRNA expression of proinflammatory mediators and enzymes (IL-1β, IL-6, TNF-α, and COX-2) produced by LPS-stimulated macrophages [25]. The results showed that RtAE, F4, F5, and F6 significantly decreased IL-1β expression. Although the composition of these fractions is not fully known, Varela-Rodriguez et al. (2019) reported the compounds present in AE. According to the retention time in the column, there are active compounds, such as dihydrofisetin [22], quercetin [26], fisetin [21], butein [27,28], amentoflavone [29], and stigmastane [30], among others, which have already been reported to have inhibitory potential on the production of this cytokine and could be responsible for the results of this study.
For IL-6, AE, F5, and F6 decreased the expression of this cytokine (p<0.001, p<0.05). Previous studies have shown that extracts of several Rhus genus plants reduce IL-6 mRNA expression through the action of compounds such as diospyrin, fisetin, butein, and dihydrofisetin [22,31,32,33].
Interestingly, TNF-α expression was suppressed only by F6. Studies performed in other Rhus species, such as Rhus verniciflua stokes, Rhus coriaria L., and Rhus succedanea L., have demonstrated that their extracts significantly inhibited TNF-α expression and production. Some of the compounds isolated from these plants include butein, 1, 2, 3, 4, 6, penta-O-galloyl beta D-glucose, fisetin, and dihydrofisetin [22,31,34], which are also RtAE components, as Varela-Rodríguez et al. reported [18]. Studies for the complete characterization of fractions need to be performed to determine the main compound.
In addition, COX-2 mRNA expression was inhibited by F5 and F6, which could be mediated by IL-1β inhibition. In addition, F6 significantly inhibited PGE2 synthesis, which correlated with decreased COX-2 mRNA expression. Additionally, the inhibition of PGE2 production by F3 could be related to a specific effect on enzyme or protein synthesis. The compounds included in F3 are polyphenols such as gallic acid and ethyl gallates; studies performed in Rhus verniciflua have reported that some compounds, such as butein and dihydrofisetin, can suppress PGE2 production in RAW 264.7 macrophages and in primary human osteoarthritis chondrocytes, respectively [35,36].
Some of the effects observed in AE and its fractions have been previously studied in other plants of the genus Rhus, as have the underlying mechanisms, including the inhibition of NF-κB and the MAPK signaling pathway [34,37], the decrease in MCP-5 and Pro-MMP-9 cytokines [37], and the decrease in the JAK2/STAT3 pathway [38], among others. However, studies are needed to identify the main compound and its relationship with the underlying mechanism involved.
The LPS-induced rat paw edema model is a well-known model sensitive to COX inhibitors and has been used to evaluate the effect of nonsteroidal anti-inflammatory agents [39]. This work demonstrated the significant inhibition of COX-2 and IL-1β by F6. Consistent with the results observed in LPS-stimulated macrophages, protein expression in paw tissue was suppressed by F6. Therefore, F6 had a greater effect on gene expression than on COX-2 enzyme inhibition, as reported in previous studies, where the results suggest that the anti-inflammatory effect of F6 might be mediated by the inhibition of the IL-1β and TNF-α genes [36].
However, COX-2 immunodetection did not decrease in response to RtAE or F3, likely because the compounds contained in those fractions, such as luteolin, epigallocatechin, apigenin, and quercetin, act by inhibiting COX-2 function and, consequently, PGE2 production.
The active site of COX-2 is known to consist of three regions: a hydrophobic pocket defined by Tyr385, Trp387, Phe518, Ala201, Tyr248, and Leu352; the entrance of the active site lined by the hydrophilic residues Arg120, Glu524, and Tyr355; and a side pocket lined by His90, Arg513, Val523, and Ser530 [40]. A docking study demonstrated that the catechol group of the B-ring of luteolin (a compound that RtAE also contains) was oriented toward the hydrophobic pocket, with 3′,4′-dihydroxy groups forming H-bonds with Tyr385 and Ser530, which blocked its activity. Additionally, the number of hydroxyl groups on the B-ring appears to be related to the molecular conformation that influences interactions between flavonoids and enzymes, such as tyrosine kinase and protein kinase C, involved in COX-2 transcriptional activity [41].
Treatment of mice with apigenin, which is also contained in RtEA, helped reduce skin tumor formation. In postmortem assays, the skin of the mice was analyzed by Western blot and ELISA, which revealed reduced levels of COX-2, PGE2, EP1, and EP2 (E-type prostaglandin receptors), as well as decreased cell proliferation [42].
These properties of reducing inflammatory mediators are similar to those of nonsteroidal anti-inflammatory drugs (NSAIDs), which have anti-inflammatory, antipyretic, and analgesic effects [43]. Therefore, the effect of RtAE on LPS-induced acute inflammation might result from COX-2 inhibition, which consequently leads to the inhibition of prostaglandin synthesis and proinflammatory cytokine signaling.
The induction of COX-2 by Toll-like receptors activates the production of PGE2, which results in vasodilatation, chemotaxis, and the arrival of leukocytes, increasing the tumor volume; when COX-2 is inhibited, this effect does not occur; therefore, edema in the rats decreases. This effect is shown in Figure 4, where a decrease in cellular infiltration with Rt treatment was evident. Previous studies have shown that several aqueous extracts of various plants with high polyphenol contents act by exerting this mechanism of action [44,45].
4. Materials and Methods
4.1. Chemicals and Reagents
Prostaglandin E2 (Cat. 363246, Sigma‒Aldrich©, St. Louis, MO, USA) was used (HPLC grade). The control drug was dexamethasone (DXM) (10 µM; D4902, Sigma®, St. Louis, MO, USA). The vehicle controls were 1× PBS (100 µL/day in animals) or 0.5% DMSO-1× PBS (v/v in cells; D2650, Sigma®, St. Louis, MO, USA). HPLC grade water, methanol, and acetonitrile were purchased from Tedia (Ohio, OH, USA). The additional use of equipment and reagents is indicated in the text.
4.2. Recollection of Plant Material
Rhus trilobata Nutt. (common name: skunkbush sumac; Family: Anacardiaceae; WFO ID:0001049775) was collected in May 2015. Identification and validation were performed according to Varela-Rodríguez et al., 2019 [18].
4.3. Preparation of Plant Extracts and Fractionation
RtAE was obtained by decoction (25 g of stems and 500 mL of boiling distilled water, 30 min) and centrifugation (2500 rpm, 15 min, 4°C). The recovered supernatant was named fraction 2 (F2), and an aliquot of 500 µL was reserved for characterization. Later, F2 (500 µL) was fractionated using ENVI™-C18 cartridges (Supelclean™, Sigma®, St. Louis, MO, US) previously activated with absolute methanol (15 mL) followed by 1% acidified water (15 mL) in a vacuum manifold (Visiprep™, Sigma®, St. Louis, MO, US). The compounds attached to the column were eluted using 1% acidified water (15 mL) (F3), ethylic ether (F4), ethyl acetate (F5), and methanol (F6). The fractions and AEs were concentrated under negative pressure with a rotary vacuum evaporator in a Büchi Rotavapor® (R-300, Büchi Labortechnik AG, Flawil, CH) and resuspended in phosphate-buffered saline (PBS) for in vitro and in vivo treatments.
4.4. Cell Culture
The murine macrophage line J774A.1 (MOs; TIB-67 ATCC®, Rockville, United States) was generously provided by Dr. Patricia Talamás-Rohana (Centro de Investigación y de Estudios Avanzados, Mexico City, MX). The cells were seeded at a density of 3x10⁶ cells/mL in Dulbecco’s modified Eagle’s medium (DMEM) (Gibco™; Thermo Fisher Scientific, Inc., Waltham, MA, US) supplemented with 10% (v/v) fetal bovine serum (FBS, Gibco™), 1% penicillin‒streptomycin (10 mg/mL, Sigma®) and gentamycin (10 μg/mL, Sigma®). The cells were incubated at 37°C with 5% CO2 (95% humidity) and harvested by scraping.
4.5. Evaluation of the Cytotoxicity of Rhus trilobata to LPS-Induced MOs
The cytotoxic effects of RtAE and its fractions on cell viability were evaluated using MTT assays in 96-well plates according to Montes-Fonseca et al., 2012 [46]. For this assay, 105 cells were harvested in high-glucose DMEM. The cells were stimulated with 5 μg/mL LPS (type 0111: B4 from Escherichia coli; Sigma‒Aldrich©, St. Louis, MO, USA); RtAE and fractions at 15 and 20 µg/mL were added to cultures and incubated for 24 h at 37°C in a humidified atmosphere at 5% CO2. Cultures not LPS-stimulated were included as a negative control; cultures of LPS-stimulated MOs treated with 10 μM dexamethasone (DXM; Sigma®, St. Louis, MO, USA) or 5% dimethyl sulfoxide (DMSO; Sigma Chemical Co., St. Louis, MO) or left untreated were used as the anti-inflammatory positive control, death control, and anti-inflammatory negative control, respectively. After 20 h of incubation, MTT was added (0.5 mg/mL) to each well, and at term, the cells were lysed with acidified isopropanol, and absorbances at λ= 590 nm were obtained using a Varioskan® Flash microplate reader (Thermo Scientific®, Inc. Waltham, MA, USA). Cell viability was calculated using the following formula: % viability= (absorbance of treatment/absorbance of negative control) × 100.
4.6. In Vitro Evaluation of the Anti-Inflammatory Activity of Rhus trilobata in LPS-Induced MOs
3x10⁶ J774A.1 MOs were seeded in a 6-well plate in supplemented high-glucose DMEM (Gibco™; Thermo Fisher Scientific, Inc., Waltham, MA, US) and stimulated with 5 μg/mL LPS (type 0111: B4 from Escherichia coli; Sigma‒Aldrich©, St. Louis, MO, USA). The cells were incubated with RtAE or its fractions at 15 µg/mL; cultures supplemented with DXM (10 µM) or left untreated were used as positive and negative anti-inflammatory controls, respectively. Cultures were incubated for 24 h, and at term, supernatants were collected and stored at -20°C for further analysis. The MOs were detached, pelleted, and lysed for total RNA extraction.
Total RNA was isolated using TRIzol (Invitrogen, CA, US) according to the manufacturer’s protocol and quantified, and reverse transcription (RT)-quantitative polymerase chain reaction (qPCR) for IL-1β, IL-6, TNF-α, and COX-2 was performed using the primer sets listed in Table 1. The reference gene was glyceraldehyde-3-phosphate dehydrogenase (GAPDH) [47]. cDNA was synthesized from 1 µg of total RNA using the SensiFAST™ cDNA Synthesis Kit (Bioline, Memphis, TN, USA). For each gene, 3 µL of individual cDNA was subjected to qPCR with Thermo Scientific™ Maxima SYBR Green/ROX qPCR Master Mix (Thermo Scientific®, Inc., Waltham, MA, USA). qPCR was performed using a Quant Studio 3 PCR system (Thermo Scientific® Inc., Waltham, MA, USA) with 1 cycle at 94°C for 1 min, followed by 35 cycles of denaturation at 95°C for 5 sec and alignment/extension at 60°C (RPL13a and IL-6), 56°C (TNF-α), 50°C (IL-1β), or 55°C (COX-2) for 30 sec. The real-time fluorescence data were collected during the elongation step of each cycle. Each cDNA sample was tested in duplicate. The relative quantification (RQ) was estimated with the ΔΔCt method (RQ= 2-ΔΔCt) [48]. The anti-inflammatory effect of Rt’s AE and the fractions of inflammatory mediators on RNA expression were analyzed by comparing the expression of LPS-treated and untreated MOs.
To determine the effect of RtAE and its fractions on PGE2 production, PGE2 was isolated from the culture supernatant using ENVI™-C18 cartridges (Supelclean™, Sigma®, St. Louis, MO, US) and a method modified from Sánchez-Ramírez et al. [49]. Briefly, 0.5 mL of water-ethanol (1:4) and 10 µL of glacial acetic acid were added to 3.0 mL of each supernatant. After mixing well, the samples were incubated at room temperature for 3 min and then centrifuged at 12,000 ×g for 2 min. Each supernatant was loaded into an ENVI™-C18 cartridge previously activated with 20 mL of methanol, followed by 20 mL of acidified water (1% acetic acid). PGE2 was eluted with 2 × 0.75 mL of ethyl acetate; then, the samples were evaporated and reconstituted with a mobile phase solution (acetonitrile-methanol-deionized water 30:10:60) for high-performance liquid chromatography (HPLC) analysis.
HPLC analysis was performed with a Supelco Discovery C18 HPLC column (5 μm particle size, L × I.D. 15 cm × 4.6 mm). The HPLC instrument (Dionex, Sunnyvale, CA, USA) was equipped with a Dionex LPG-3400-D quaternary analytical pump, Dionex UltiMate 3000 diode array detector (DAD), Dionex solvent degasser, and Chromeleon CM-PCS-1 Software. An isocratic mode was used with a mobile phase of 0.01% acidified with a trifluoroacetic acid:acetonitrile:methanol (60:30:10) mixture. The UV detector wavelength was set to 210 nm, the flow rate was 0.8 mL/min, and the column and sampler rack compartment temperatures were 30 and 4°C, respectively. The calibration curve was determined by using the chromatographic peak areas corresponding to 0.625, 1.25, 2.5, 5, 10, and 20 mg/L PGE2 standard solutions using a mobile phase mixture as a standard dilution solvent. The samples were filtered through a 0.2 µm nylon syringe filter and injected into the HPLC instrument. The PGE2 concentration was determined through the peak area on the chromatograms.
4.7. Anti-Inflammatory Activity of Rhus trilobata in the LPS-Induced Paw Edema Model
Male Wistar rats aged 6-8 weeks (n= 42) were obtained from the vivarium of the Facultad de Ciencias Químicas from UACH. The rats were housed at 24 ± 2°C and 40 to 70% relative humidity under a 12 h dark/light cycle and were supplied with food and water ad libitum. This study was carried out following NOM-062-ZOO-1999 [Secretaría de Agricultura, Ganadería, Desarrollo Rural, Pesca y Alimentación, 2001] [54] and approved by the Institutional Animal Care and Use Committee.
The animals (n=42) were randomly divided into 8 groups of 3 rats each as follows: edema-positive control (C+), LPS-induced edema with no treatment; anti-inflammatory negative control (C-), LPS-induced edema treated with 50 μL of DXM (10 mg/mL); and six groups of LPS-induced edema treated with 500 µg of RtAE (50 μL of 10 mg/mL) and fractions F2, F3, F4, F5, or F6. In a second experiment, six additional groups of rats with LPS-induced edema were treated with 750 µg or 1,000 µg of RtAE and fractions F3 or F6. At 0 h, the right hind paw of each rat was measured with a digital Vernier caliper (Truper®), and 100 µg of LPS (type 0111: B4 from Escherichia coli; Sigma‒Aldrich©, St. Louis, MO, USA) was immediately inoculated intradermally (i.d.) into the footpad. The treatments were applied 12 h after LPS induction. The anti-inflammatory effect (%) was determined by determining the increase in paw size at 12 h and 24 h, and % swelling was calculated using the following formula:
The % anti-inflammatory effect was calculated by subtracting the % swelling of the different treatments from 100% (C+).
At 24 h, after the last measurement, the rats were euthanized with an overdose of sodium pentobarbital Sedalpharma® (Pets Pharma, Edo. de Mex., México), right hind paws were dissected and fixed in 4% buffered paraformaldehyde solution (Sigma‒Aldrich, St. Louis, MO, USA). Paraffin-embedded sections (4 μm thick) were prepared in an RM2125 RTS microtome (Leica, Buffalo Grove, IL, US) and stained with hematoxylin and eosin (H&E) to assess histological damage using a BX41 Olympus microscope (Olympus Optical Co., Ltd., Mexico) equipped with a Pixera-CCD camera.
The effect of RtAE and its fractions on the expression of IL-1β and COX-2 was evaluated by immunohistochemical (IHC) analysis according to González-García et al. [32]. After blocking with 10% nonfat milk in PBS (pH 7.4), the slides were incubated separately for 1 h at 37°C with a 1:100 dilution of rabbit anti-IL-1β or anti-COX-2 monoclonal antibodies (Santa Cruz Biotechnology, Dallas, TX, USA) in 1% nonfat milk in PBS. After two washes, the slides were incubated with a biotinylated anti-rabbit IgG secondary antibody for 1 h at room temperature. The signal was detected using avidin-peroxidase and diaminobenzidine substrate. The samples were counterstained with 1:10 hematoxylin and then dehydrated on permanent coverslips with Entellan resin. All the samples were processed on the same day to prevent variability. Controls with nonrelevant antiserum or without primary antibodies were used as nonspecific controls.
The expression of IL-1β and COX-2 was estimated by optical density (O.D.) as measured and analyzed with IMAGE Pro plus 4.1 software (Media Cybernetics, Silver Spring, Maryland, USA) [32]. Five representative microphotographs from each footpad at 60x were taken. After software calibration (individual pixel resolution of 175 gray levels), five measurements were made using a 50-pixel bar (n= 25). All the determinations were performed on the same day to reduce calibration or lighting errors. The samples used for image analysis were not counterstained to avoid background signals from hematoxylin.
4.8. Statistical Analysis
The data are presented as the mean ± standard deviation (SD). Where appropriate, comparisons between groups and controls were performed using ANOVA and Tukey’s test. Student’s t tests were used for comparisons with the reference control. Differences were considered significant when p ≤0.05. Statistical analysis was performed using Minitab software (State College, PA, USA).
5. Conclusions
The results presented here demonstrated that RtAE and fractions F3 and F6 inhibited the inflammatory response by reducing the mRNA expression of IL-1β, IL-6, TNF-α, and COX-2 in LPS-induced MOs, as in a rat model of LPS-induced footpad edema.
Treatment with RtAE inhibited the inflammatory response by reducing the expression of IL-1β, TNF-α, and IL-6 in LPS-induced MOs in vitro and inhibiting acute LPS-induced inflammation in Wistar rats by suppressing COX-2 and IL-1β in inflamed mice. We suggest that RtEA possesses significant anti-inflammatory activity and could be a potential source of naturally occurring anti-inflammatory agents.
Author Contributions
ARC performed most of the experiments and drafted the manuscript; IPP and ECH participated in performing the in vivo assays; SGCh participated in funding (reagents/materials/analytical tools) and drafting/revising the manuscript; CPT participated in funding and revising the manuscript; DChF participated in the quantification and analysis of PGE2 and drafting/revising the manuscript; MCDG and RIR participated in the revision of the article; and BESR was responsible for funding (reagents/materials/analytical tools) and drafting and revising the manuscript. All the authors read and approved the final manuscript.
Funding
This work was partially supported by FOMIX-Chihuahua-CONACyT (CHIH-2010-C01-143572) to B. Sánchez-Ramírez.
Data Availability Statement
All the data generated or analyzed during this study are included in this published article (as well as supplementary information files). The raw data are available upon request from the corresponding author.
Acknowledgments
The authors thank Patricia Talamas-Rohana for donating the cell lines. AJRC was a recipient of a Ph.D. scholarship from CONAHCyT (Reg. 369164).
Conflicts of Interest
The authors have no other relevant affiliations or financial involvement with any other organization or any organization or entity with interests or financial conflicts with the subject matter or materials addressed in the manuscript other than those disclosed.
References
- Non Communicable Diseases. Available online: https://www.who.int/news-room/fact-sheets/detail/noncommunicable-diseases (accessed on 23 April 2023).
- Demaio, A.; Jamieson, J.; Horn, R.; de Courten, M.; Tellier, S. Non-Communicable Diseases in Emergencies: A Call to Action. PLoS Curr 2013. [Google Scholar] [CrossRef]
- Straub, R.H.; Schradin, C. Chronic Inflammatory Systemic Diseases – an Evolutionary Trade-off between Acutely Beneficial but Chronically Harmful Programs. EMPH 2016, eow001. [Google Scholar] [CrossRef]
- Chen, L.; Deng, H.; Cui, H.; Fang, J.; Zuo, Z.; Deng, J.; Li, Y.; Wang, X.; Zhao, L. Inflammatory Responses and Inflammation-Associated Diseases in Organs. Oncotarget 2018, 9, 7204–7218. [Google Scholar] [CrossRef]
- Brock, T.G.; McNish, R.W.; Peters-Golden, M. Arachidonic Acid Is Preferentially Metabolized by Cyclooxygenase-2 to Prostacyclin and Prostaglandin E2. J. Biol. Chem. 1999, 274, 11660–11666. [Google Scholar] [CrossRef]
- Kany, S.; Vollrath, J.T.; Relja, B. Cytokines in Inflammatory Disease. IJMS 2019, 20, 6008. [Google Scholar] [CrossRef]
- Oishi, Y.; Manabe, I. Macrophages in Inflammation, Repair and Regeneration. Int. Immunol. 2018, 30, 511–528. [Google Scholar] [CrossRef]
- Farzaneh, Z.; Kalantar, K.; Iraji, A.; Amirghofran, Z. Inhibition of LPS-Induced Inflammatory Responses by Satureja Hortensis Extracts in J774.1 Macrophages. J. Immunoass. Immunochem. 2018, 39, 274–291. [Google Scholar] [CrossRef] [PubMed]
- Gensel, J.C.; Zhang, B. Macrophage Activation and Its Role in Repair and Pathology after Spinal Cord Injury. Brain Res. 2015, 1619, 1–11. [Google Scholar] [CrossRef] [PubMed]
- Tanaka, T.; Narazaki, M.; Kishimoto, T. IL-6 in Inflammation, Immunity, and Disease. Cold Spring Harb. Perspect. Biol. 2014, 6, a016295–a016295. [Google Scholar] [CrossRef]
- Wauters, L.; Billiet, T.; Papamichael, K.; Ballet, V.; Joniau, S.; Verschueren, P.; Silversmit, G.; Van Assche, G.; Vermeire, S.; Ferrante, M. Incidence of Renal Cell Carcinoma in Inflammatory Bowel Disease Patients with and without Anti-TNF Treatment: Eur. J. Gastroenterol. Hepatol. 2017, 29, 84–90. [Google Scholar] [CrossRef]
- Nathan, C.; Ding, A. Nonresolving Inflammation. Cell 2010, 140, 871–882. [Google Scholar] [CrossRef] [PubMed]
- Owona, B.A.; Abia, W.A.; Moundipa, P.F. Natural Compounds Flavonoids as Modulators of Inflammasomes in Chronic Diseases. Int. Immunopharmacol. 2020, 84, 106498. [Google Scholar] [CrossRef]
- Atanasov, A.G.; Zotchev, S.B.; Dirsch, V.M.; Supuran, C.T. Natural Products in Drug Discovery: Advances and Opportunities. Nat Rev Drug Discov 2021, 20, 200–216. [Google Scholar] [CrossRef]
- Sánchez-Escalate, J.J.; Gilbert, E.E. Red de Herbarios del Noroeste de México - Rhus trilobata. Available online: https://herbanwmex.net/portal/taxa/index.php?taxauthid=1&taxon=13960&clid=3811 (accessed on 23 April 2023).
- Anderson, M.K. Rhus Trilobata Nutt. Var. Simplicifolia (Greene) Barkl. SKUNKBUSH. Plant Symbol = RHTRS. Plant Guide 2002.
- Varela-Rodríguez, L.; Sánchez-Ramírez, B.; Saenz-Pardo-Reyes, E.; Ordaz-Ortiz, J.J.; Castellanos-Mijangos, R.D.; Hernández-Ramírez, V.I.; Cerda-García-Rojas, C.M.; González-Horta, C.; Talamás-Rohana, P. Antineoplastic Activity of Rhus Trilobata Nutt. (Anacardiaceae) against Ovarian Cancer and Identification of Active Metabolites in This Pathology. Plants 2021, 10, 2074. [Google Scholar] [CrossRef]
- Varela-Rodríguez, L.; Sánchez-Ramírez, B.; Rodríguez-Reyna, I.S.; Ordaz-Ortiz, J.J.; Chávez-Flores, D.; Salas-Muñoz, E.; Osorio-Trujillo, J.C.; Ramos-Martínez, E.; Talamás-Rohana, P. Biological and Toxicological Evaluation of Rhus Trilobata Nutt. (Anacardiaceae) Used Traditionally in Mexico against Cancer. BMC Complement Altern Med 2019, 19, 153. [Google Scholar] [CrossRef]
- Correa, L.B.; Seito, L.N.; Manchope, M.F.; Verri, W.A.; Cunha, T.M.; Henriques, M.G.; Rosas, E.C. Methyl Gallate Attenuates Inflammation Induced by Toll-like Receptor Ligands by Inhibiting MAPK and NF-Κb Signaling Pathways. Inflamm. Res. 2020, 69, 1257–1270. [Google Scholar] [CrossRef] [PubMed]
- Suryanti, V.; Wibowo, F.R.; Khotijah, S.; Andalucki, N. Antioxidant Activities of Cinnamaldehyde Derivatives. IOP Conf. Ser.: Mater. Sci. Eng. 2018, 333, 012077. [Google Scholar] [CrossRef]
- Hada, Y.; Uchida, H.A.; Wada, J. Fisetin Attenuates Lipopolysaccharide-Induced Inflammatory Responses in Macrophage. Biomed Res Int 2021, 2021, 5570885. [Google Scholar] [CrossRef]
- Li, K.K.; Shen, S.S.; Deng, X.; Shiu, H.T.; Siu, W.S.; Leung, P.C.; Ko, C.H.; Cheng, B.H. Dihydrofisetin Exerts Its Anti-Inflammatory Effects Associated with Suppressing ERK/P38 MAPK and Heme Oxygenase-1 Activation in Lipopolysaccharide-Stimulated RAW 264.7 Macrophages and Carrageenan-Induced Mice Paw Edema. Int. Immunopharmacol. 2018, 54, 366–374. [Google Scholar] [CrossRef]
- Vajja, B.N.L.; Juluri, S.; Kumari, M.; Kole, L.; Chakrabarti, R.; Joshi, V.D. Lipopolysaccharide-Induced Paw Edema Model for Detection of Cytokine Modulating Anti-Inflammatory Agents. Int. Immunopharmacol. 2004, 4, 901–909. [Google Scholar] [CrossRef]
- Sibi, G.; Rabina, S. Inhibition of Pro-Inflammatory Mediators and Cytokines by Chlorella Vulgaris Extracts. Phcog Res 2016, 8, 118. [Google Scholar] [CrossRef]
- Zhang, J.-M.; An, J. Cytokines, Inflammation, and Pain. Int. Anesthesiol. Clin. 2007, 45, 27–37. [Google Scholar] [CrossRef] [PubMed]
- Cheng, S.-C.; Huang, W.-C.; S. Pang, J.-H.; Wu, Y.-H.; Cheng, C.-Y. Quercetin Inhibits the Production of IL-1β-Induced Inflammatory Cytokines and Chemokines in ARPE-19 Cells via the MAPK and NF-κB Signaling Pathways. IJMS 2019, 20, 2957. [Google Scholar] [CrossRef]
- Lee, D.-S.; Jeong, G.-S. Butein Provides Neuroprotective and Anti-Neuroinflammatory Effects through Nrf2/ARE-Dependent Haem Oxygenase 1 Expression by Activating the PI3K/Akt Pathway. Br. J. Pharmacol. 2016, 173, 2894–2909. [Google Scholar] [CrossRef] [PubMed]
- Liu, Y.; Fu, Y.; Zhang, Y.; Liu, F.; Rose, G.M.; He, X.; Yi, X.; Ren, R.; Li, Y.; Zhang, Y.; et al. Butein Attenuates the Cytotoxic Effects of LPS-Stimulated Microglia on the SH-SY5Y Neuronal Cell Line. Eur. J. Pharmacol. 2020, 868, 172858. [Google Scholar] [CrossRef] [PubMed]
- Chen, J.-H.; Chen, W.-L.; Liu, Y.-C. Amentoflavone Induces Anti-Angiogenic and Anti-Metastatic Effects Through Suppression of NF-κB Activation in MCF-7 Cells. Anticancer Res. 2015, 35, 6685–6693. [Google Scholar]
- Okoye, F.; Osadebe, P.; Proksch, P.; Edrada-Ebel, R.; Nworu, C.; Esimone, C. Anti-Inflammatory and Membrane-Stabilizing Stigmastane Steroids from Alchornea Floribunda Leaves. Planta Med 2010, 76, 172–177. [Google Scholar] [CrossRef] [PubMed]
- Hada, Y.; Uchida, H.A.; Wada, J. Fisetin Attenuates Lipopolysaccharide-Induced Inflammatory Responses in Macrophage. Biomed Res Int 2021, 2021, 5570885. [Google Scholar] [CrossRef]
- Shahidullah, A.; Lee, J.-Y.; Kim, Y.-J.; Halimi, S.M.A.; Rauf, A.; Kim, H.-J.; Kim, B.-Y.; Park, W. Anti-Inflammatory Effects of Diospyrin on Lipopolysaccharide-Induced Inflammation Using RAW 264.7 Mouse Macrophages. Biomedicines 2020, 8, 11. [Google Scholar] [CrossRef]
- Roh, K.; Lee, J.; Kang, H.; Park, K.W.; Song, Y.; Lee, S.; Ku, J.-M. Synthesis and Evaluation of Butein Derivatives for in Vitro and in Vivo Inflammatory Response Suppression in Lymphedema. Eur. J. Med. Chem. 2020, 197, 112280. [Google Scholar] [CrossRef]
- Khalil, M.; Bazzi, A.; Zeineddine, D.; Jomaa, W.; Daher, A.; Awada, R. Repressive Effect of Rhus Coriaria L. Fruit Extracts on Microglial Cells-Mediated Inflammatory and Oxidative Stress Responses. J. Ethnopharmacol. 2021, 269, 113748. [Google Scholar] [CrossRef] [PubMed]
- Zheng, W.; Zhang, H.; Jin, Y.; Wang, Q.; Chen, L.; Feng, Z.; Chen, H.; Wu, Y. Butein Inhibits IL-1β-Induced Inflammatory Response in Human Osteoarthritis Chondrocytes and Slows the Progression of Osteoarthritis in Mice. Int. Immunopharmacol. 2017, 42, 1–10. [Google Scholar] [CrossRef]
- Li, K.K.; Shen, S.S.; Deng, X.; Shiu, H.T.; Siu, W.S.; Leung, P.C.; Ko, C.H.; Cheng, B.H. Dihydrofisetin Exerts Its Anti-Inflammatory Effects Associated with Suppressing ERK/P38 MAPK and Heme Oxygenase-1 Activation in Lipopolysaccharide-Stimulated RAW 264.7 Macrophages and Carrageenan-Induced Mice Paw Edema. Int. Immunopharmacol. 2018, 54, 366–374. [Google Scholar] [CrossRef]
- Mendonca, P.; Taka, E.; Bauer, D.; Cobourne-Duval, M.; Soliman, K.F.A. The Attenuating Effects of 1,2,3,4,6 Penta-O-Galloyl-β- d -Glucose on Inflammatory Cytokines Release from Activated BV-2 Microglial Cells. J. Neuroimmunol. 2017, 305, 9–15. [Google Scholar] [CrossRef] [PubMed]
- Yu, T.; Li, Z.; Xu, L.; Yang, M.; Zhou, X. Anti-Inflammation Effect of Qingchang Suppository in Ulcerative Colitis through JAK2/STAT3 Signaling Pathway in Vitro and in Vivo. J. Ethnopharmacol. 2021, 266, 113442. [Google Scholar] [CrossRef]
- Patil, K.R.; Mahajan, U.B.; Unger, B.S.; Goyal, S.N.; Belemkar, S.; Surana, S.J.; Ojha, S.; Patil, C.R. Animal Models of Inflammation for Screening of Anti-Inflammatory Drugs: Implications for the Discovery and Development of Phytopharmaceuticals. Int J Mol Sci 2019, 20, 4367. [Google Scholar] [CrossRef] [PubMed]
- Llorens, O.; Perez, J.J.; Palomer, A.; Mauleon, D. Differential Binding Mode of Diverse Cyclooxygenase Inhibitors. J Mol Graph Model 2002, 20, 359–371. [Google Scholar] [CrossRef]
- D’Mello, P.; Gadhwal, M.; Joshi, U.; Shetgiri, P.; Pharmacy, P. Modeling of COX-2 Inhibotory Activity of Flavonoids. Int. J. Pharm. Pharm. Sci. 2011, 3, 33–40. [Google Scholar]
- Kiraly, A.J.; Soliman, E.; Jenkins, A.; Van Dross, R.T. Apigenin Inhibits COX-2, PGE2, and EP1 and Also Initiates Terminal Differentiation in the Epidermis of Tumor Bearing Mice. Prostaglandins Leukot. Essent. Fat. Acids 2016, 104, 44–53. [Google Scholar] [CrossRef]
- Bindu, S.; Mazumder, S.; Bandyopadhyay, U. Non-Steroidal Anti-Inflammatory Drugs (NSAIDs) and Organ Damage: A Current Perspective. Biochem Pharmacol 2020, 180, 114147. [Google Scholar] [CrossRef]
- Kim, B.-G.; Song, Y.; Lee, M.-G.; Ku, J.-M.; Jin, S.-J.; Hong, J.-W.; Lee, S.; Kang, H. Macrophages from Mice Administered Rhus Verniciflua Stokes Extract Show Selective Anti-Inflammatory Activity. Nutrients 2018, 10, 1926. [Google Scholar] [CrossRef] [PubMed]
- Wu, Z.; Ma, Y.; Gong, X.; Zhang, Y.; Zhao, L.; Cheng, G.; Cai, S. Rhus Chinensis Mill. Fruits Prevent High-Fat/Ethanol Diet-Induced Alcoholic Fatty Liver in Rats via AMPK/SREBP-1/FAS Signaling Pathway. J. Funct. Foods 2019, 61, 103498. [Google Scholar] [CrossRef]
- Montes-Fonseca, S.L.; Orrantia-Borunda, E.; Aguilar-Elguezabal, A.; González Horta, C.; Talamás-Rohana, P.; Sánchez-Ramírez, B. Cytotoxicity of Functionalized Carbon Nanotubes in J774A Macrophages. Nanomed. : Nanotechnol. Biol. Med. 2012, 8, 853–859. [Google Scholar] [CrossRef] [PubMed]
- Quiñonez-Flores, C.M.; López-Loeza, S.M.; Pacheco-Tena, C.; Muñoz-Morales, P.M.; Acosta-Jiménez, S.; González-Chávez, S.A. Stability of Housekeeping Genes in Inflamed Joints of Spontaneous and Collagen-Induced Arthritis in DBA/1 Mice. Inflamm. Res. 2021, 70, 619–632. [Google Scholar] [CrossRef] [PubMed]
- Rao, X.; Huang, X.; Zhou, Z.; Lin, X. An Improvement of the 2ˆ(-Delta Delta CT) Method for Quantitative Real-Time Polymerase Chain Reaction Data Analysis. Biostat Bioinforma Biomath 2013, 3, 71–85. [Google Scholar]
- Sánchez-Ramírez, B.; Escalante, B.; Rosales-Encina, J.L.; Talamás-Rohana, P. Role of Prostaglandin E2 on Amoebic Liver Abscess Formation in Hamsters. Prostaglandins 1997, 53, 411–421. [Google Scholar] [CrossRef]
- González-Chávez, S.A.; López-Loeza, S.M.; Acosta-Jiménez, S.; Cuevas-Martínez, R.; Pacheco-Silva, C.; Chaparro-Barrera, E.; Pacheco-Tena, C. Low-Intensity Physical Exercise Decreases Inflammation and Joint Damage in the Preclinical Phase of a Rheumatoid Arthritis Murine Model. Biomolecules 2023, 13, 488. [Google Scholar] [CrossRef]
- Sand, J.; Haertel, E.; Biedermann, T.; Contassot, E.; Reichmann, E.; French, L.E.; Werner, S.; Beer, H.-D. Expression of Inflammasome Proteins and Inflammasome Activation Occurs in Human, but Not in Murine Keratinocytes. Cell Death Dis 2018, 9, 24. [Google Scholar] [CrossRef]
- Cai, Q.; Li, Y.; Pei, G. Polysaccharides from Ganoderma Lucidum Attenuate Microglia-Mediated Neuroinflammation and Modulate Microglial Phagocytosis and Behavioural Response. J Neuroinflammation 2017, 14, 63. [Google Scholar] [CrossRef]
- Moser, V.A.; Uchoa, M.F.; Pike, C.J. TLR4 Inhibitor TAK-242 Attenuates the Adverse Neural Effects of Diet-Induced Obesity. J Neuroinflammation 2018, 15, 306. [Google Scholar] [CrossRef]
- Diario Oficial de La Federación. Available online: https://www.dof.gob.mx/nota_detalle.php?codigo=762506&fecha=22/08/2001#gsc.tab=0 (accessed on 23 April 2023).
Figure 1.
Effect of RtAE and fractions on the viability of LPS-treated MOs. The J774.1 MOs were stimulated for 24 h with 5 μg/mL LPS and treated for 24 h with each RtAE or fraction at 15 µg/mL (A) or 20 µg/mL (B). Cell viability was determined as described in the Materials and Methods section. MOs-free or untreated samples were used as negative controls. LPS-stimulated MOs treated with 10 μM DXM or 5% DMSO or left untreated were used as positive, dead, and negative anti-inflammatory controls, respectively. The bars show the mean ± SD of three biological replicates (n = 3, in triplicate). ANOVA and Tukey’s test (95% confidence) were used to determine group differences. Bars that do not share a letter differ significantly (p < 0.05). AE, aqueous extract; DXM, dexamethasone; DMSO, dimethyl sulfoxide; F, fraction; LPS, lipopolysaccharides; Tx, treatment.
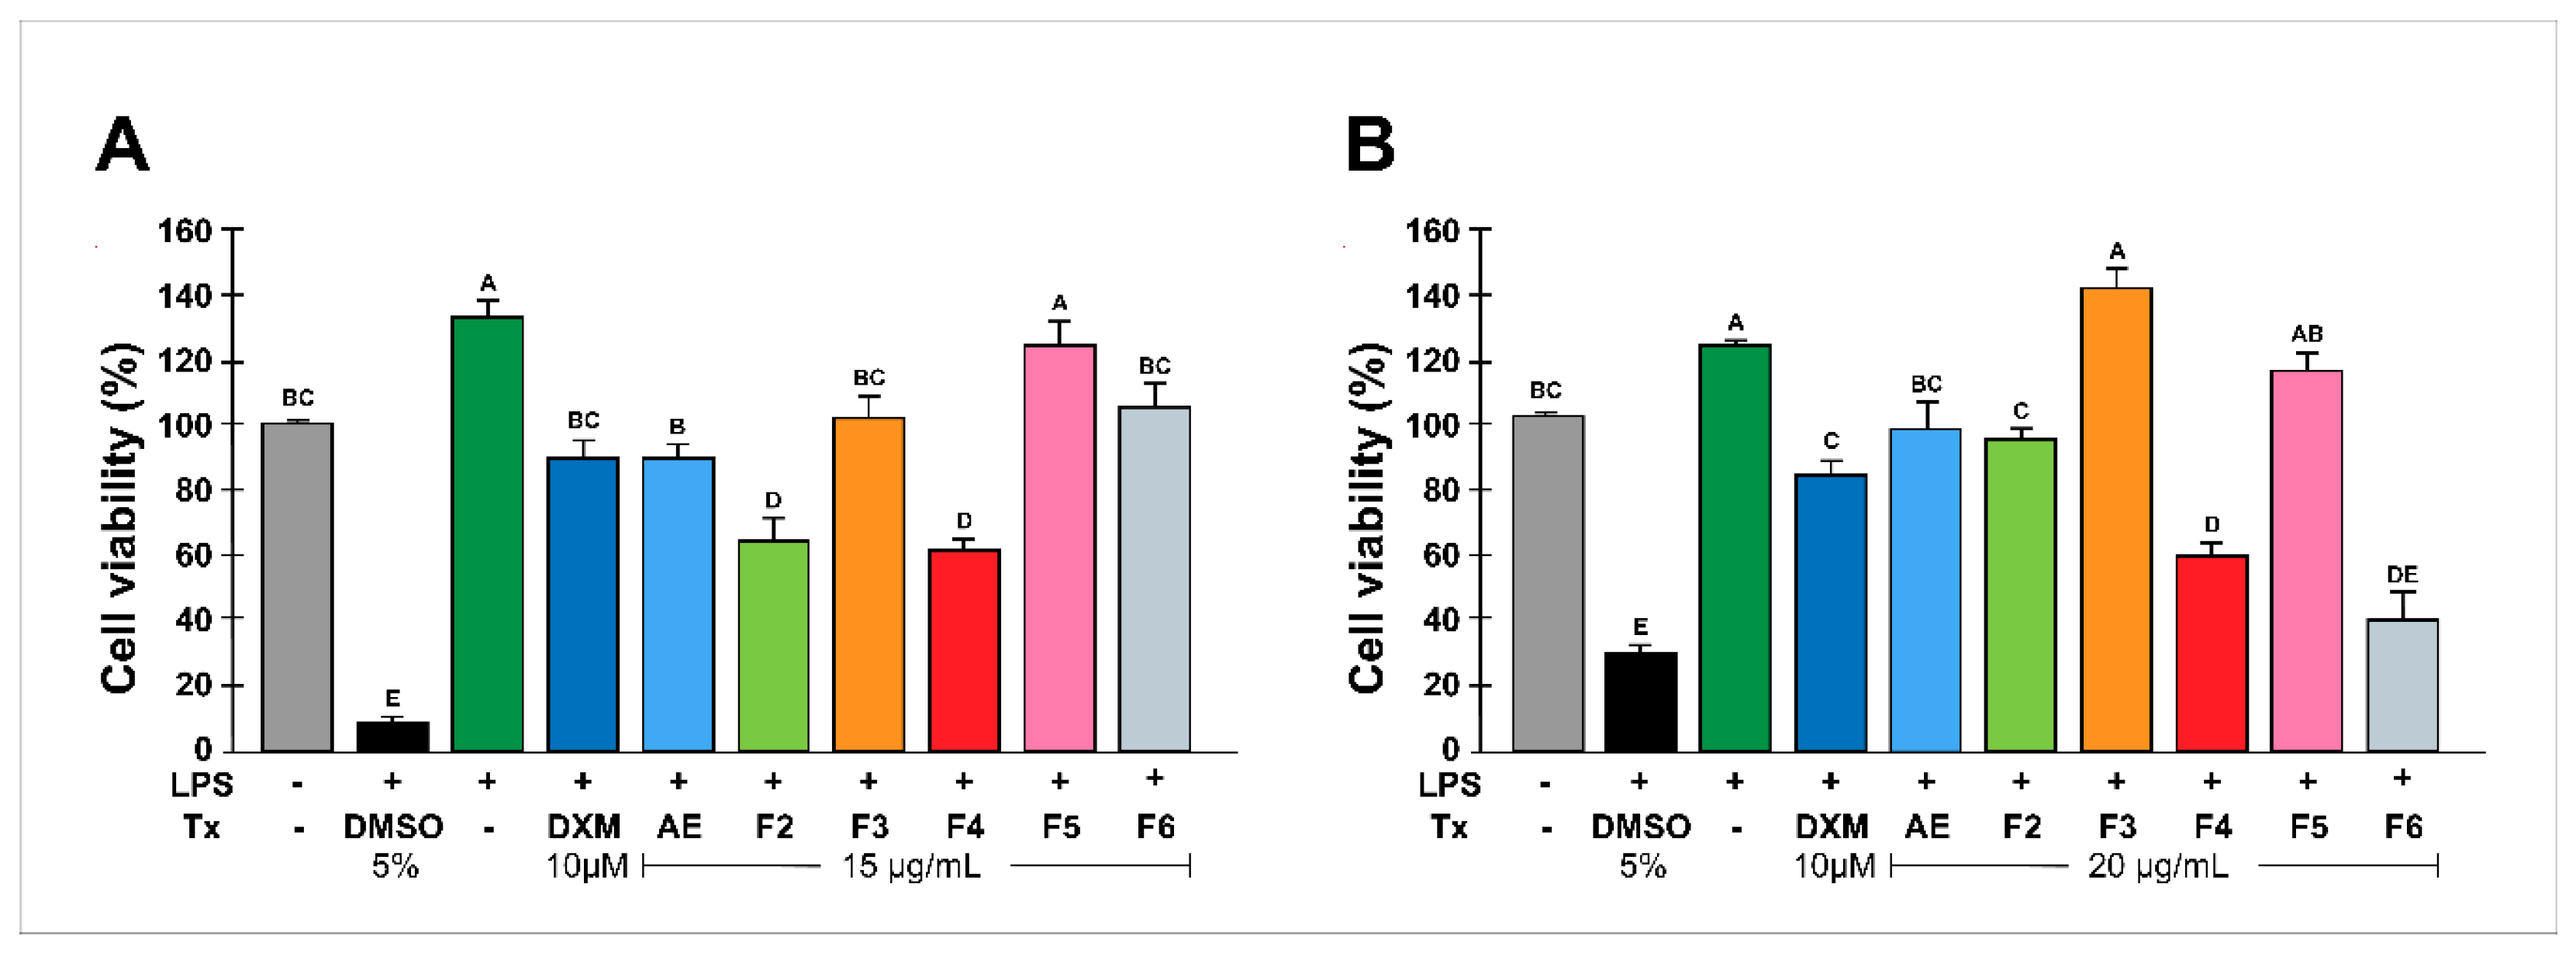
Figure 2.
Effect of RtAE and its fractions on inflammatory mediators in LPS-induced MOs. The J774.1 MOs were stimulated for 24 h with 5 μg/mL LPS and treated for 24 h with each RtAE or fraction at 15 µg/mL. The relative RNA expression of IL-1β (A), IL-6 (B), TNF-α (C), and COX-2 (D) was evaluated via RT‒qPCR using the DDCt method. The bars show the mean ± SD of the relative quantification of cDNA from two independent experiments performed in duplicate. LPS-stimulated MOs treated with 10 μM DXM were included as a positive anti-inflammatory control. A t test was used to determine differences compared with the nontreated group. * p £0.05; ** p £0.01. LPS, lipopolysaccharide; (-), LPS-induced edema without treatment; DXM, dexamethasone; Tx, treatment; AE, aqueous extract; F, fraction.
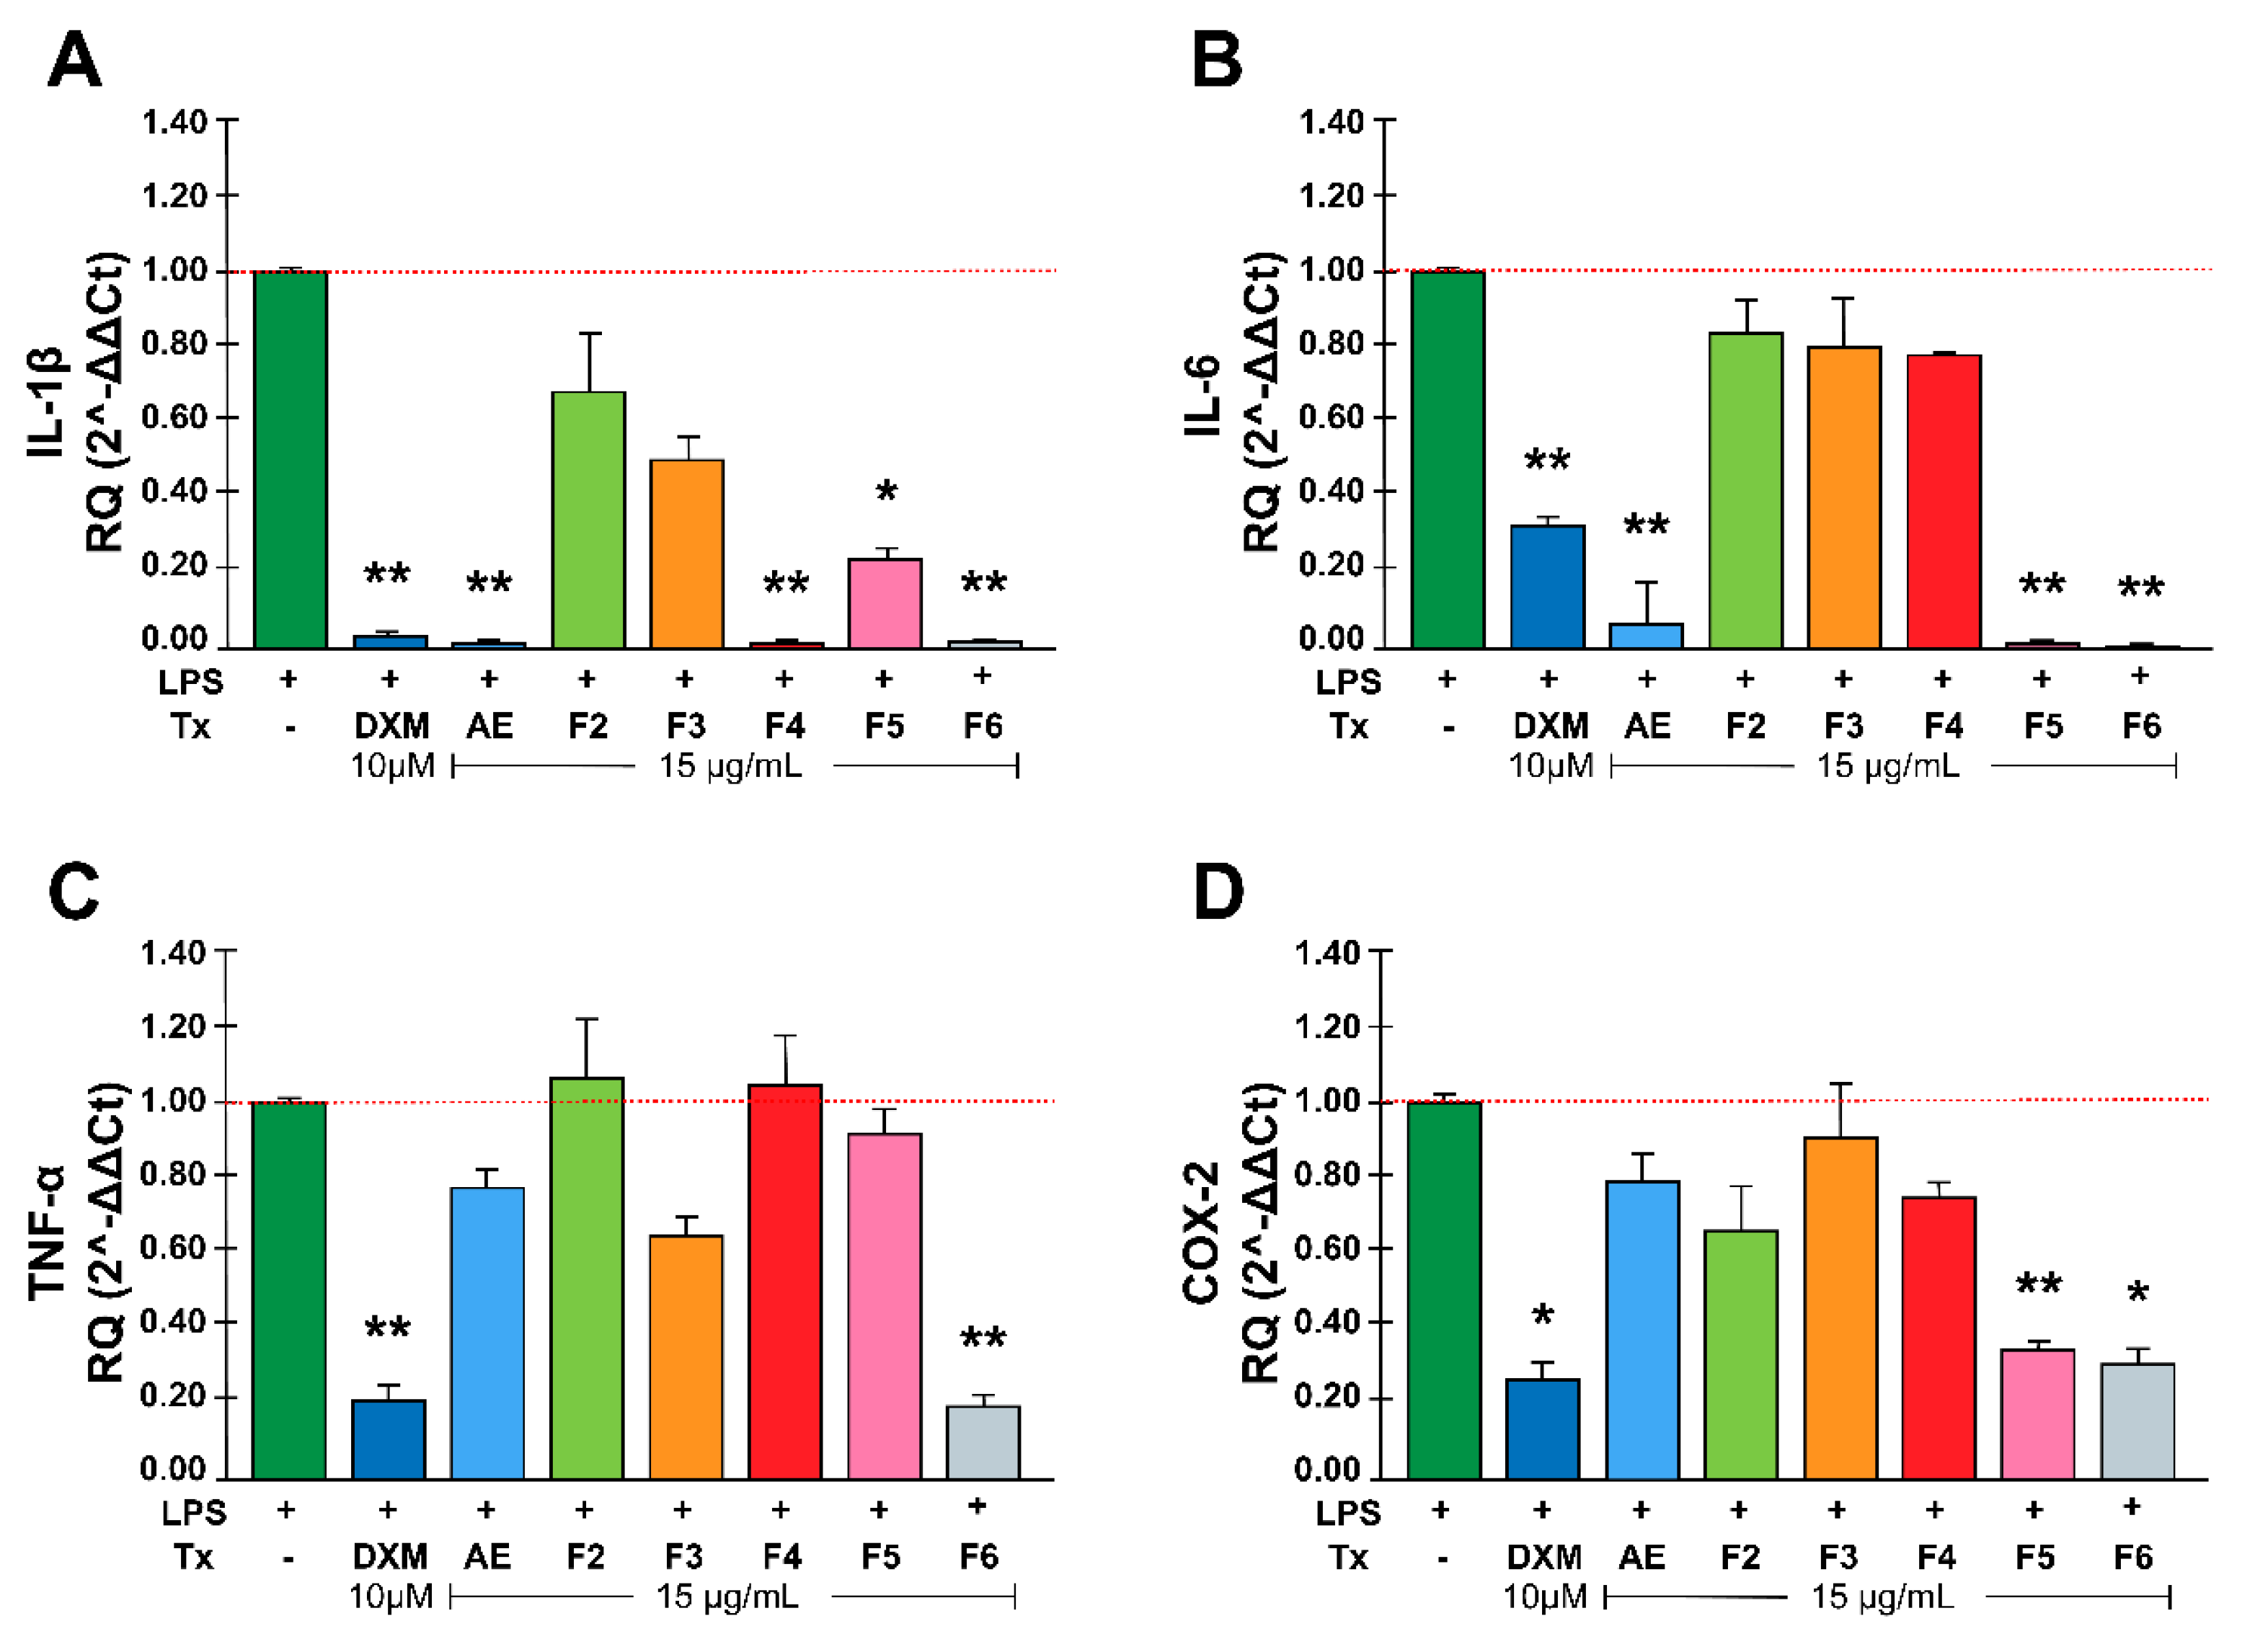
Figure 3.
Effect of RtAE and its fractions on PGE2 release by LPS-induced MOs. The J774.1 MOs were stimulated for 24 h with 5 μg/mL LPS and treated for 24 h with each RtAE or the fractions at 15 µg/mL. PGE2 released in culture supernatants was quantified via HPLC using a PGE2 standard curve. Cultures of nonstimulated MOs or without treatment were included as negative controls. LPS-stimulated MOs treated with or without 10 μM DXM were used as positive and negative anti-inflammatory controls, respectively. The bars show the mean ± SD of the PGE2 quantification of three independent experiments. ANOVA and Tukey’s test (95% confidence) were used to determine group differences. LPS, lipopolysaccharides; (-), LPS-stimulated without treatment; DXM, dexamethasone; Tx, treatment; AE, aqueous extract; F, fraction.
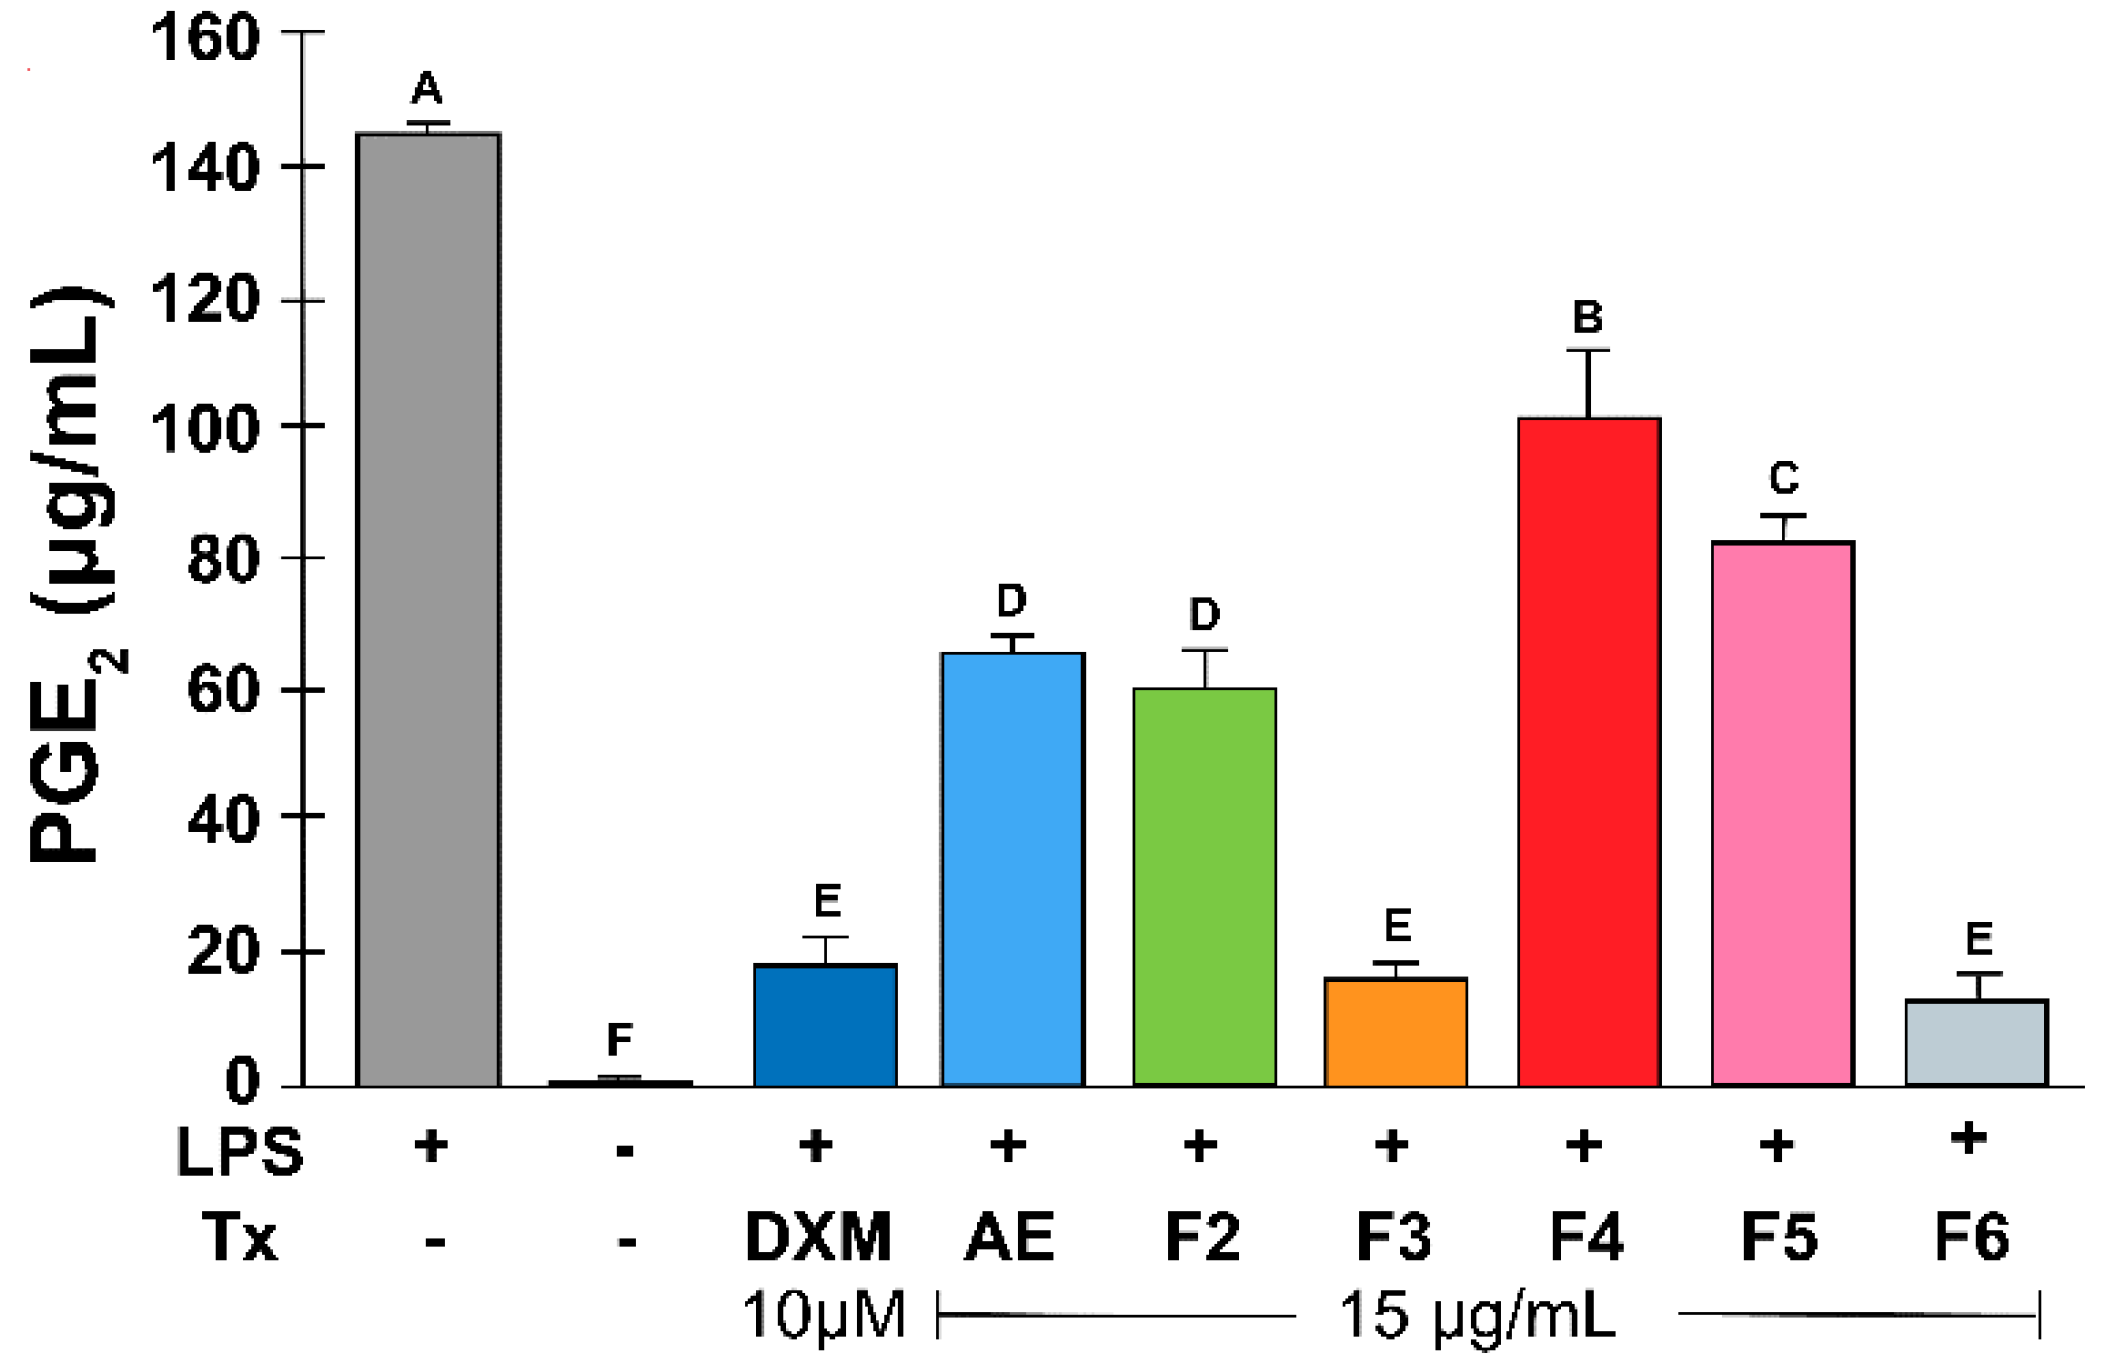
Figure 4.
Anti-inflammatory effects of the RtAE, F3, and F6 fractions on IL-1β and COX-2 expression. An LPS-induced paw edema model was generated in Wistar rats, and treatments with RtAE, F3, or F6 were evaluated. The morphological alterations of the footpads were evaluated by H&E staining (A, line 1). The expression of IL-1β (A, line 2) and COX-2 (A, line 3) was evaluated via IHC. The means and SDs of the O.D.s were determined for each study group and are shown for IL-1β (B) and COX-2 (C). Mice with LPS-induced paw edema treated with 500 μg DXM or left untreated were included as anti-inflammatory positive and negative controls, respectively. ANOVA and Tukey’s test (95% confidence) were used to determine group differences. Bars that do not share a letter differ significantly (p < 0.05). LPS, lipopolysaccharides; (-), LPS-induced edema without treatment; DXM, dexamethasone; Tx, treatment; AE, aqueous extract; F, fraction.
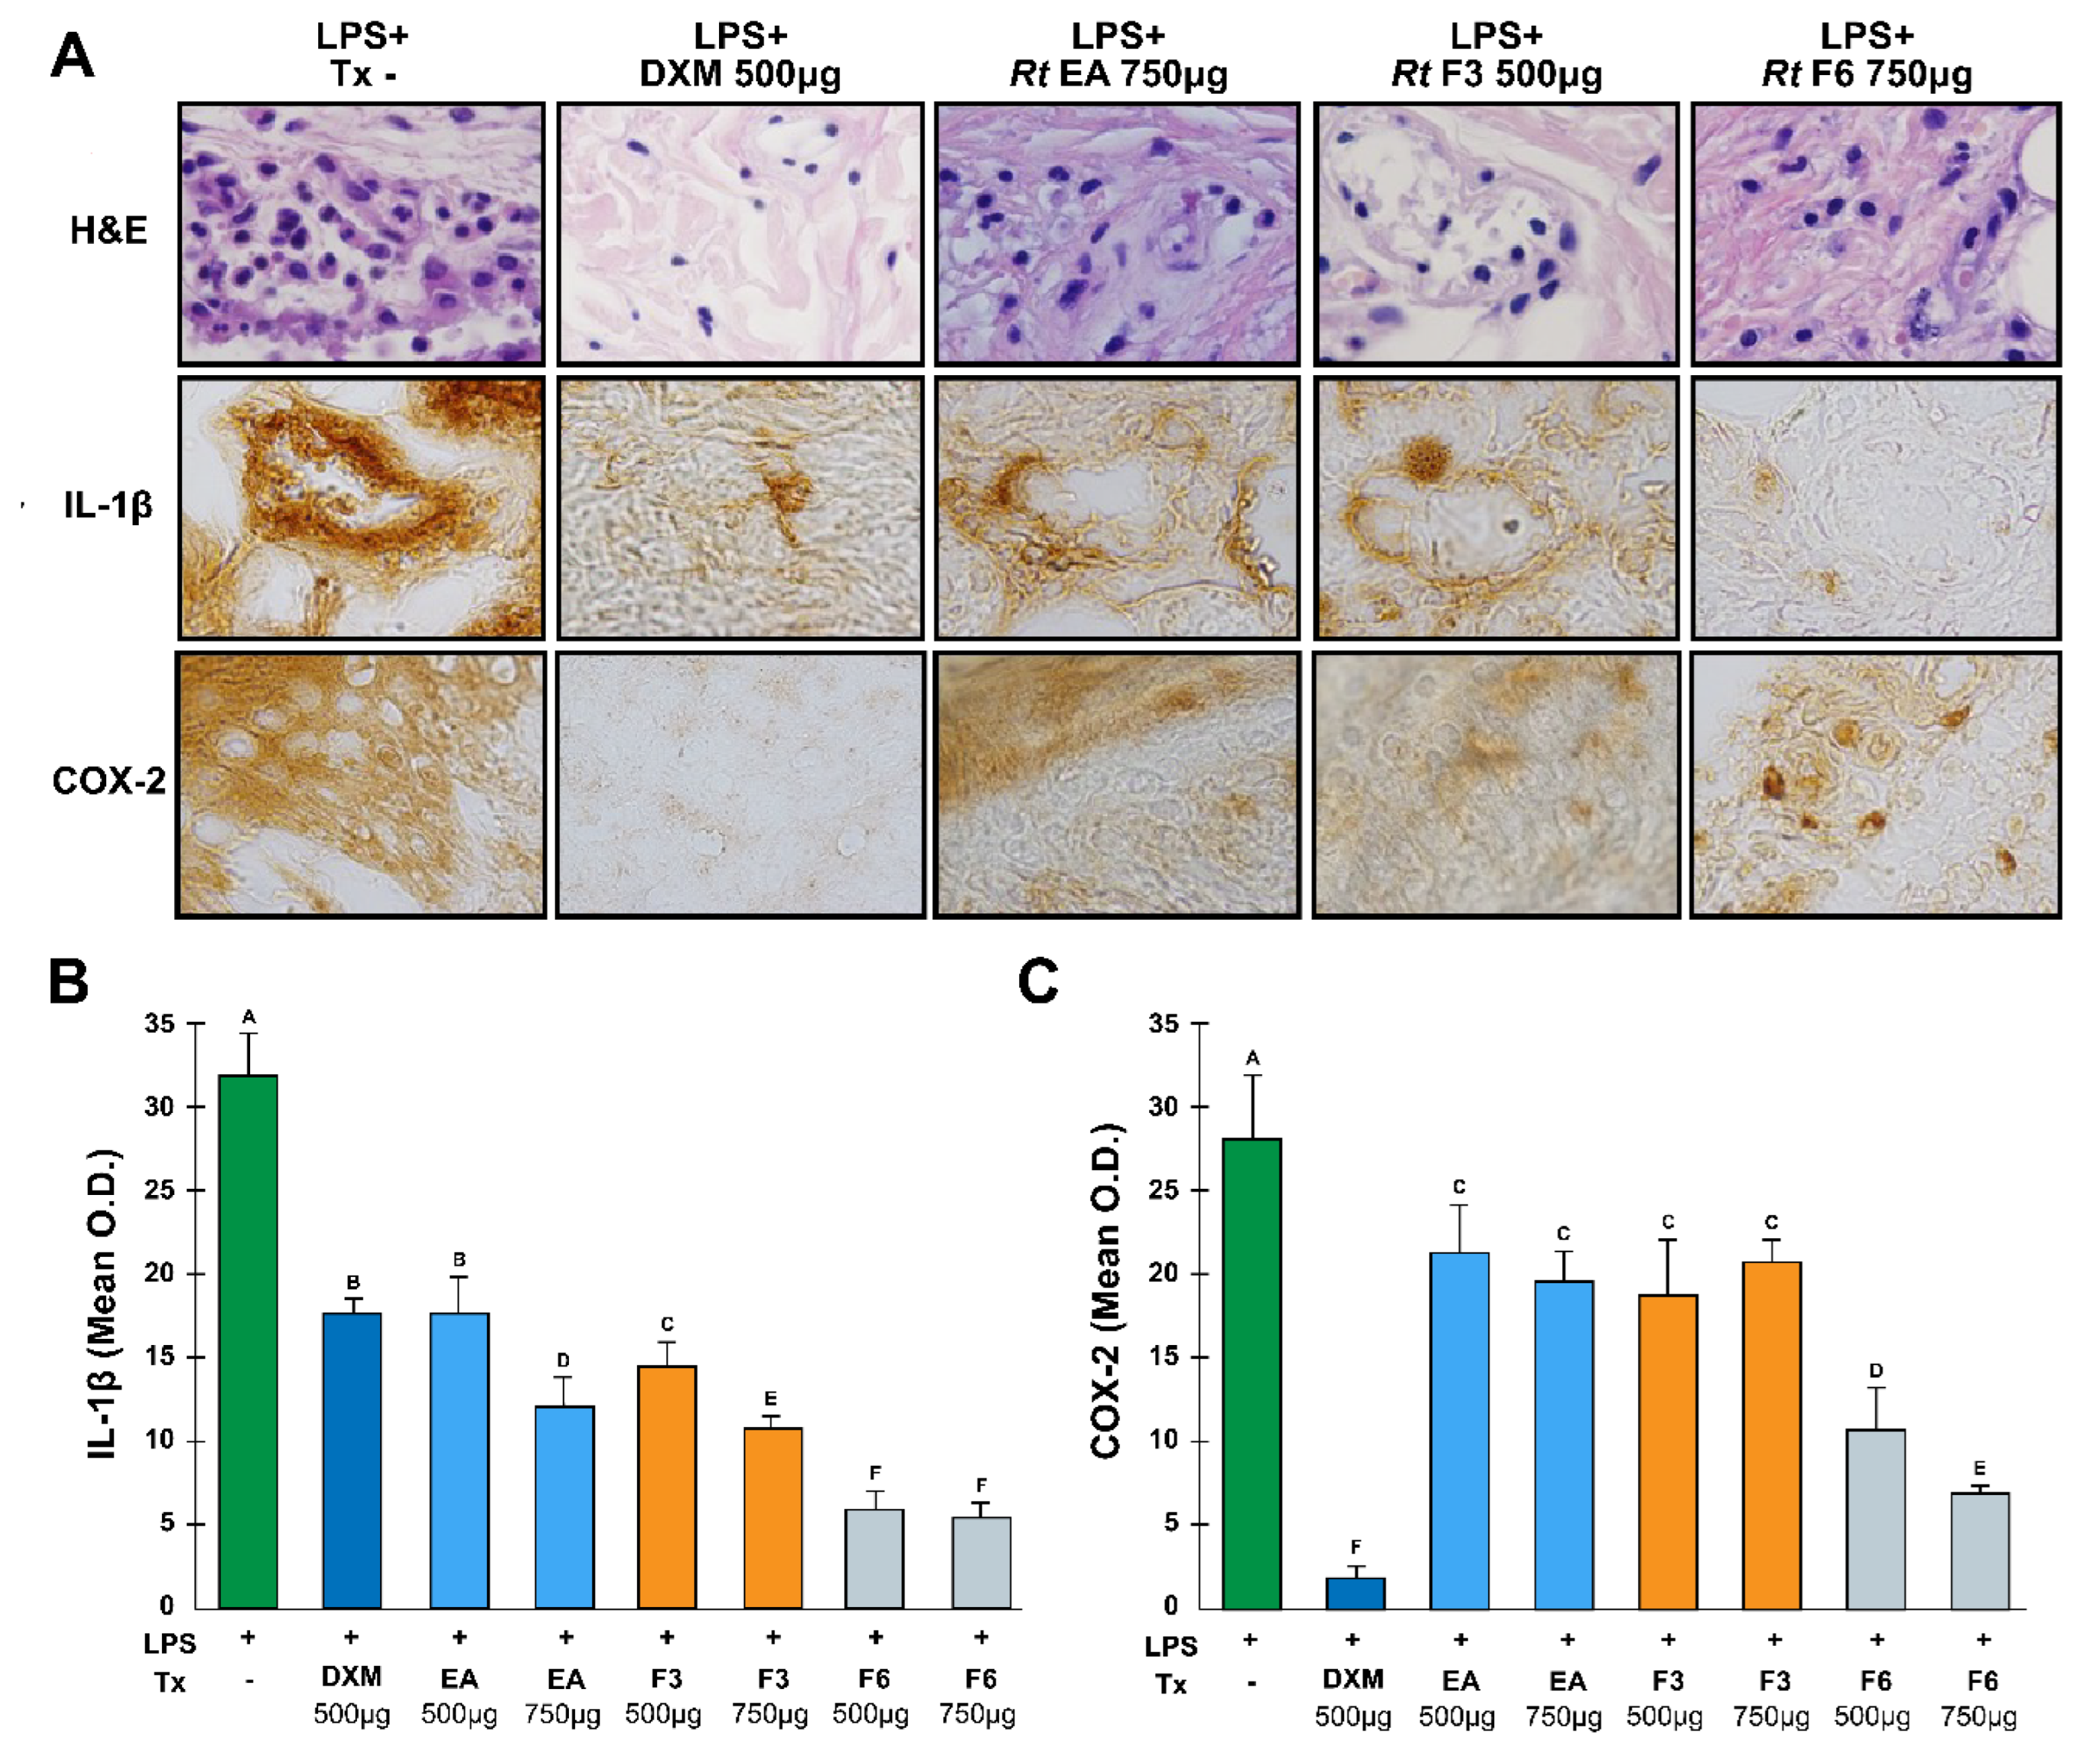

Table 2.
Percentage decrease in PGE2 production in LPS-induced MOs by RtAE and fractions.
| Sample | Concentration PGE2 (µg/mL) | PGE2 decrease (%) |
|---|---|---|
| LPS-stimulated MOs (-) | 6.30 | - |
| Nonstimulated MOs (+) | 0.00 | 100 |
| + DXM (10μM) | 0.78 | 90.7 |
| + AE (15 µg/mL) | 2.87 | 53.68 |
| + F2 (15 µg/mL) | 2.64 | 54.72 |
| + F3 (15 µg/mL) | 0.68 | 88.91 |
| + F4 (15 µg/mL) | 4.43 | 24.02 |
| + F5 (15 µg/mL) | 3.60 | 45.78 |
| + F6 (15 µg/mL) | 0.55 | 90.12 |
LPS, lipopolysaccharide; (-), LPS-stimulated MOs without treatment; DXM, dexamethasone; Tx, treatment; AE, aqueous extract; F, fraction.
Table 3.
Anti-inflammatory effect of RtAE and its fractions on LPS-induced paw edema in Wistar rats.
Table 3.
Anti-inflammatory effect of RtAE and its fractions on LPS-induced paw edema in Wistar rats.
| Treatment | Anti-inflammatory effect % (Range) |
p value |
|---|---|---|
| DXM | 93 (58 to 127) | 0.005 |
| AE | 41 (19 to 62) | 0.050 |
| F2 | 23 (-20 to 66) | 0.230 |
| F3 | 59 (21 to 98) | 0.028 |
| F4 | 19.6 (-19 to 58) | 0.250 |
| F5 | 27 (-17 to 22) | 0.200 |
| F6 | 68.7 (10 to 127) | 0.050 |
n=3. Treatments with 500 µg of RtAE or the corresponding fraction. Differences were estimated using t tests by comparing each treated group with the nontreated group. A p value of £ 0.05 was considered to indicate statistical significance. LPS, lipopolysaccharides; DXM, dexamethasone; AE, aqueous extract; F, fraction.
Table 4.
Anti-inflammatory effects of different doses of RtAE, F3, and F6 on LPS-induced paw edema in Wistar rats.
Table 4.
Anti-inflammatory effects of different doses of RtAE, F3, and F6 on LPS-induced paw edema in Wistar rats.
| Treatment | Concentration (μg) |
Anti-inflammatory effect % (Range) |
p value |
|---|---|---|---|
| DXM | 500 | 93 (58.1 to 127.1) | 0.005 |
| AE | 750 | 80 (9 to 151.8) | 0.061 |
| 1000 | -27 (-85.1 to 30.7) | 0.769 | |
| F3 | 750 | 36 (22.7 to 49.1) | 0.005 |
| 1000 | 37 (28.04 to 46.26) | 0.001 | |
| F6 | 750 | 64 (17 to 111.8) | 0.039 |
| 1000 | 24 (-10.6 to 59.4) | 0.147 |
n=3. Differences were estimated using t tests by comparing each treated group with respect to the nontreated group. A p value of £ 0.05 was considered to indicate statistical significance. LPS, lipopolysaccharides; DXM, dexamethasone; AE, aqueous extract; F, fraction.
Table 1.
Primer sequences for quantitative PCR.
| Gene | Primer sequence |
|---|---|
| GAPDH [50] | F: 5′-TGAAGGTCGGTGTGAACGG-3´ R: 5′-GTGAGTGGAGTCATACTGGAA-3´ |
| IL-1β [51] | F: 5′-GCAACTGTTCCTGAACTCAACT-3´ R: 5′-TCAACTGCCTGGGGTTTTCTA-3´ |
| IL-6 [52] | F: 5′-TAGTCCTTCCTACCCCAATTTCC-3’ R: 5′-CTTCCTCACCGATTCCTGGTT-3’ |
| TNF-α [53] | F: 5′-CCCTCACACTCAGATCATCTTCT-3´ R: 5´-GACATCGGGTGCAGCATCG-3’ |
| COX-2 [46] | F: 5´- CTGTATCCCGCCCTGCTGGTG -3’ R: 5´-TTCTGTCGGTGGTAGTTGCGTTCA-3´ |
F, R; forward and reverse sequences.
Disclaimer/Publisher’s Note: The statements, opinions and data contained in all publications are solely those of the individual author(s) and contributor(s) and not of MDPI and/or the editor(s). MDPI and/or the editor(s) disclaim responsibility for any injury to people or property resulting from any ideas, methods, instructions or products referred to in the content. |
© 2024 by the authors. Licensee MDPI, Basel, Switzerland. This article is an open access article distributed under the terms and conditions of the Creative Commons Attribution (CC BY) license (http://creativecommons.org/licenses/by/4.0/).
Copyright: This open access article is published under a Creative Commons CC BY 4.0 license, which permit the free download, distribution, and reuse, provided that the author and preprint are cited in any reuse.


