Submitted:
25 July 2024
Posted:
25 July 2024
You are already at the latest version
Abstract
The economic development of the Yangtze River Delta region is in a stage of rapid growth. As a unique intersection of urban and rural functions, contradictions are prominent. The production, life, and ecological functions of suburban rural landscapes are forming a new trade-off and synergistic relationship. The planning policy of the Yangtze River Delta from 2021 to 2035 aims to achieve the coordinated development of ecology, economy, and people's lives in the suburban areas of the Yangtze River Delta. To evaluate the current status of the “production-living-ecological” functions of suburban rural areas in the Yangtze River Delta region and provide data support for future planning decisions in the Yangtze River Delta region, this study selected the suburban rural landscape of Jiashan as the research object and used temporal rank correlation analysis and spatial bivariate autocorrelation analysis to explore the evolution characteristics of the suburban rural landscape of Jiashan from 2000 to 2020. The results show that (1) the linear increase of the production function and life function of Jiashan rural areas has led to a decline in ecological functions, especially a decline in life functions. (2) There is a trade-off and synergistic relationship between the different functions of the suburban rural landscape of Jiashan, showing a temporal change pattern dominated by trade-offs. (3) The multifunctional trade-off and synergistic relationship of the suburban rural landscape in Jiashan County exhibited obvious spatial pattern variability, which was manifested as the evolution from street-centered areas to compatibility-trade-trade-off and from town-centered areas to compatibility-synergy-trade-off. The relevant policies for the construction of ecological green comprehensive demonstration areas affect the economic, social, and ecological development of the Yangtze River Delta region, resulting in substantial differences in the types and trends of the spatiotemporal evolution of the functional trade-off and synergistic relationship of suburban rural landscape. Targeted measures should be taken according to local conditions to guide the coordinated development of landscape functions.
Keywords:
suburban rural landscape
; production-living-ecological functions
; trade-off and synergy
; spatial-temporal evolution
1. Introduction
The rural landscape is a multifunctional integrated development ecosystem with diverse social, economic, and ecological functions [1]. With the rapid socio-economic development and urbanization in China, there is an increasing demand for diversified landscape functions. The pursuit of multiple goals within limited natural ecosystems has increased the complexity of the landscape functions and relationships [2], demonstrating a state of mutual trade-off and synergy [3]. Trade-off refers to the fact that the reduction or growth of one function leads to enhancement or weakening of other functions, while synergy means that two or more functions weaken or strengthen together [4]. The suburban countryside serves as a transition area between urban and rural areas, plays a crucial role in rural urbanization, and serves as the frontier for urban function diffusion. It integrates material and intangible cultural elements from both the urban and rural areas, making it an area where conflicting urban-rural functions are most intense [5]. The suburban countryside has comprehensive functions such as agricultural production, social life, ecological regulation, leisure, and entertainment [6,7,8]. Unprecedented changes have occurred in suburban rural landscapes not only in terms of material aspects such as land use and architectural forms but also in functional positioning and mutual relationships. This has led to increasingly complex trade-off and synergistic relationships among the landscape functions [9]. Scholars have mainly studied the relationships between landscape functions from perspectives such as land use changes [10], agricultural landscape functions [12], and ecosystem service functions [13] in order to explore their connotations [14], values, and types [15]. Various models have been used to conduct special evaluations of different types of rural landscapes such as terraced landscapes [17], plateau hilly areas [18], arid areas [19], cultivated landscapes [20], and agricultural areas [21,22]. However, temporal correlation analysis has often been used in relevant studies, which ignores the interactions with the functional space. As a result, the comprehensiveness of the research results on landscape functional relationship changes needs to be improved. In addition, many studies have focused on the differentiation of a single type of landscape function, and the universality of the resulting research results is worthy of discussion. However, few studies have been conducted on the landscape functions of suburban countryside in the context of complex urban and rural problems and particularly prominent contradictions. Few studies have specifically focused on the landscape functions of the suburban countryside in the context of regional integrated development of the Yangtze River Delta region. In view of this, this study evaluates the performance of the suburban villages in Jiashan County, Zhejiang Province, within the Yangtze River Delta eco-green integrated development demonstration zone by using ecological trade-off and synergistic research methods. We analyzed the relationships between suburban and rural landscape functions using Spearman rank correlation coefficient and bivariate spatial autocorrelation analyses. The spatiotemporal evolution characteristics of the rural landscape function trade-offs and synergies were explored at three time nodes within 2000–2020 [23]. The results are not only helpful for understanding the evolution of rural landscape functions in suburban areas but also for understanding the evolution of rural landscape functions. The results also have important academic value for exploring how to coordinate the relationships between the functions of this type of rural landscape.
2. Materials and Methods
2.1. Study Area
The Yangtze River Delta region is one of the regions with the most active economic development, the fastest process of urban-rural integration, the earliest rural reform, and the most complete agricultural industry system in China. It has an important strategic position in the overall construction of agricultural and rural modernization. The Outline of the Regional Integrated Development Plan for the Yangtze River Delta [24], Three-year Action Plan for the Integrated Development of the Yangtze River Delta (2018–2020) [25], and Master Plan for the Yangtze River Delta Eco-Green Integrated Development Demonstration Zone (2021–2035) [26] describe the specific paths such as shaping the characteristics of Jiangnan water towns based on regional resource endowments and realizing ecological priority and green development strategies [27]. The planning period of the Yangtze River Delta Ecological Green Integrated Development Demonstration Zone is 2021–2035. The Chinese government has proposed several key goals and strategic directions to ensure sustainable integrated development of the region, for example, the permanent farmland basic protection plan, the construction plan for the west extension of Metro Line 17, the high-tech industry and innovation promotion plan, the green economic development plan, and the policy governance plan of the Ministry of Natural Resources. These plans will promote the coordinated development of the economy and ecology of the Yangtze River Delta Demonstration Zone. The eco-green integrated development demonstration zone, as an innovative experimental field for the integrated development strategy of the Yangtze River Delta region, covers an area of about 2,413 square kilometers, mainly including the Qingpu District in Shanghai and the Wujiang District in Suzhou City in Jiangsu Province and Jiashan County in Jiaxing City in Zhejiang Province. Jiashan County is located in the northeastern part of Jiaxing City and is less than an hour’s drive from the center of the city. It is a typical suburban village with a total area of 506.59 square kilometers. The terrain is flat, with an average elevation of 3.67 meters and a ground elevation difference of less than 2 meters. Jiashan County has jurisdiction over six towns (Xitang Town, Yaozhuang Town, Taozhuang Town, Tianning Town, Dayun Town, and Ganyao Town) and three streets (Luoxing Street, Weitang Street, and Huimin Street) (Figure 1). With the recent promotion of the construction of the Yangtze River Delta eco-green integrated development demonstration zone, Jiashan’s gross domestic product (GDP) growth rate has ranked second in the province and first in the city, leading the integration demonstration zone. In 2018 and 2022, Jiashan was selected for the national comprehensive rural reform pilot twice, and has become the vanguard of promotion of the construction of Chinese-style modern rural areas. The recent development direction, focuses, and measures have undergone major adjustments. In terms of infrastructure construction, the transportation network is expanded, and the Jiashan government promotes the interconnection of roads, railways, and water transport. In terms of urban–rural integration, the balanced allocation of urban and rural resources is promoted to narrow the economic gap between urban and rural areas. In terms of agricultural development, agricultural science and technology innovation is promoted to improve agricultural production efficiency and added value of agricultural products. In terms of high-tech development, the focus is on the development of high-tech industries, such as information technology, biotechnology, and new materials. In terms of the ecological environment, strict environmental protection measures are implemented to reduce pollutant emissions. The use of green buildings and green energy is promoted to improve energy efficiency. The functions of the rural landscape have also changed greatly. Therefore, clarifying the evolution characteristics of the balance and synergistic relationship between suburban and rural landscape functions represented by Jiashan will help to reveal the real benefits and existing problems of suburban and rural landscape functions under high-speed economic growth in the context of the integrated development of the Yangtze River Delta region [28,29]. The results support the development of targeted measures for promoting the development of such rural ecological protection and economic development towards a win-win situation.
2.2. Basis of Classification of Suburban Rural Landscape Functions
With the development of the concept of green, low-carbon, and sustainable development, at the end of the 20th century, European rural studies began to pay attention to the functions of the agricultural natural environment, production and economic development, and they gradually began to pay attention to the quality of the rural natural ecological environment and human environment, as well as the protection of local characteristics [30]. As the joint result of natural ecological elements, peoples’ living behavior, and social production activities, rural landscapes are a carrier of the integration and development of ecological, cultural, economic, and social functions. Therefore, stimulating the efficiency of the rural landscape enhances the multiple functions of rural production, living, and ecological space [31]. Based on the causes of rural landscape functions and the relationship between these functions [32], in this study, we took Jiashan as a representative area to build the target layer of suburban rural landscape production, life, and ecological function evaluation, and we selected the criterion layer and important indicators closely related to it.
2.2.1. Rural Landscape Production Function
The rural landscape production function mainly focuses on production activities in rural areas and the economic value provided by rural landscapes, mainly covering agricultural production and economic development functions. The production function of rural landscapes involves the production income of grain, fruits and vegetables, food, raw materials, medicine, and other agricultural products related to agriculture, forestry, fishing, and animal husbandry. The function of economic development goes beyond traditional agricultural production and covers the economic activities of primary and tertiary industries such as tourism, handicrafts, township enterprises, rural construction, and development, reflecting the value of rural landscapes in local economic development [32] and the importance of rural areas to regional and national economic development.
2.2.2. Rural Landscape Life Function
The rural landscape plays an important role in maintaining and improving peoples’ quality of life, including spatial, cultural, and aesthetic dimensions, such as the spatial bearing function and landscape aesthetic function. Among them, the spatial bearing function focuses on how the rural landscape provides residents with living, communication, and activity space and how to develop a rational layout to meet the needs of the community. The landscape aesthetic function focuses on reflecting the connectivity and diversity of the rural landscape, providing sensory pleasure, community comfort, and local sense for villagers.
2.2.3. Ecological Function of Rural Landscape
The ecological function of the rural landscape highlights the role of the rural landscape in maintaining and enhancing the stability of the ecosystem, emphasizing the harmonious coexistence of the landscape and nature, and it can be divided into the ecological balance function and environmental maintenance function. The ecological balance function mainly reflects the coverage of the rural landscape and the uniformity of the various landscapes, which is the key to the ecological functions of the rural landscape [33]. The environmental sustainability function pays more attention to protecting and improving the environmental quality of the rural landscape, such as the air quality, degree of fragmentation of the ecological environment, and degree of destruction of biological habitats. In addition, EF builds a regional ecological barrier to ensure the long-term stability and sustainable development of the rural ecological environment.
2.3. Design of Rural Landscape Function Evaluation Index
In this study, we used the entropy method to set the weight of each index. The higher the entropy is, the more mixed the data are, the less effective the information carried is, the smaller the utility value is, and the smaller the corresponding weight is. This method can determine the multi-index weights of time series. We input the index values for 2000, 2010, and 2020 into the SPSS AU software and carried out forward processing of the forward indicators and reverse processing of the reverse indicators based on the variable generation function in SPSS AU. Then, we used the entropy method to carry out weight analysis of the processed indicators. The specific rural landscape function evaluation indicators and their weights are presented in Table 1.
2.4. Research Methods
2.4.1. Single Function Evaluation Of Landscape
The value of the landscape single function index is used to reflect the importance of a certain function of the suburban rural landscape, and the weighted summation model is mainly used to conduct the calculations. The equation is as follows:
where f_i is the value of a single function, x_i is item indicator i, w_i is the weight of item indicator i, and n is the number of indicators of item single function i. Using this equation, a single indicator is combined to provide a comprehensive evaluation value for each function.
2.4.2. Quantification of The Landscape Production-Living-Ecological Functions Trade-Offs And Synergistic Relationship
In particular, when there is a potential conflict or complementary relationship between a pair of functions [34], the rank correlation coefficient can quantify the synergistic relationship between the two functions in the rural landscape. The equation is as follows:
where d_i is represented as interpolation, and the Spearman’s correlation coefficient ranges from −1 to 1, indicating a positive or negative correlation between the functions. A value close to 1 indicates a positive correlation, while a value close to −1 indicates a negative correlation.
2.4.3. Spatial trade-off and synergistic relationship of the landscape production-living-ecological functions
To spatially reveal the synergies between functions, the Moran index is used.
where I is the Moran index, n is the number of sample points, W is the sum of the elements of the weight matrix, x_i and x_j are the observations at sample points i and JTH, respectively, x ̅ is the mean of the observations, and w_ij is the weight between sample points i and j.
2.5 Research Data
The sources of the experimental data are presented in Table 2. The data processing process is as follows: (1) raster data and relevant indicators of the text statistics are used in ArcGIS pro. (2) The panel data are exported for Spearman correlation coefficient analysis in SPSS AU. (3) The shapefile data for bivariate Moran index (global and local) analysis to GeoDA.
3. Results
3.1. Rural Landscape Function Evaluation Results
Based on weighted comprehensive evaluation of 12 evaluation indicators, the average values of the target layer production-living-ecological functions and the landscape functions of the six criterion layers of nine townships in Jiashan County at three points in time were calculated, and the comprehensive evaluation results of the rural landscape production-living-ecological functions in Jiashan County were obtained (Table 3).
(1) The “production-living-ecological functions” of the rural landscape in Jiashan County changed regularly over time. From 2000 to 2020, the production-living-ecological functions of the target layer in Jiashan County exhibited regular changes, and the production function (PF; contains agricultural productivity per capita, agricultural output value per land, industrial contribution rate, and township urbanization level) and life function (LF; contains per capita living area, population density, landscape connectivity, and landscape diversity) exhibited linearly increasing trends. The ecological function (EF; contains NDVI, ecological synergy degree, PM2.5, and landscape fragmentation) rapidly decreased to 0.087 from 2000 to 2010 and then rebounded to 0.102 from 2010 to 2020. However, it was still 67% lower than the initial value of 0.310, which reflects the decline of the overall ecological function of the landscape under the influence of the gradual urbanization of the rural suburbs in Jiashan County to some extent.
(2) The single function of the rural landscape in Jiashan County changed regularly over time. From 2000 to 2020, the agricultural production function (APF), economic development function (EDF), space carrying function (SCF), and landscape aesthetic function (LAF) all exhibited linearly increasing trends, while the ecological regulation function (ERF) rapidly decreased to 0.039 from 2000 to 2010 and basically remained stable from 2010 to 2020. The environmental maintenance function (EMF) decreased slightly from 0.068 to 0.048 from 2000 to 2010. From 2010 to 2020, it increased slightly to 0.064, and there was basically no change during the total period, indicating that the single functions of the production function and living function in the rural landscape in Jiashan County steadily increased over time, while the single function of the ecological function fluctuated greatly under the influence of rural urbanization. Specifically, the decrease in ecological regulation function (ERF) will lead to a decrease in the ability of landscapes to filter air pollutants, causing loss and fragmentation of biological habitats. In turn this could lead to a decrease in species diversity. In addition, the degradation of ecological functional monomers may also lead to a decline in urban soil quality and an increase in surface runoff, increasing the threat of flooding.
In summary, the linear increases in the rural landscape production function and living function affected the decline of the ecological function. Each single function of the ecological function gradually degraded, and the living function was dominant. The main reason for this is that in the process of rural urbanization construction, Jiashan County mainly took into account the development needs for production and life, and less attention was paid to the maintenance of ecological functions.
3.2. Temporal Evolution of The Function Trade-Off And Synergistic Relationship Of The Production-Living-Ecological Functions Of The Landscape
Spearman rank correlation analysis was used to obtain the temporal evolution pattern of the trade-off and synergy relationship between the production-living-ecological functions in the rural landscape using Equation (2). In Figure 2, the absolute value of each function is taken, and then, the change is taken. The corresponding values are shown in Table 4. It can be seen from the chart that the rural landscape functions in Jiashan County mainly exhibited a trade-off relationship, in which there were 11 groups of trade-off relationships. There were nine groups of synergistic relationships and 34 groups of compatible relationships, and these relationships changed in different directions over time. The trade-off relationship was significantly negative, the synergy relationship was significantly positive, and the compatibility relationship was not significant, that is, there was neither synergistic development nor trade-off confrontation and the two sides remained neutral and compatible.
3.2.1. Temporal Pattern of Rural Landscape Synergy in Jiashan County
The rural landscape agricultural production function-landscape aesthetic function (APF-LAF) in Jiashan County is maintaining a synergistic relationship. It increased from 0.071 to 0.720 from 2000 to 2010 and slightly decreased by 0.003 from 2010 to 2020, exhibiting a steadily increasing trend overall. This indicates that the agricultural production function and aesthetic function achieved good integration during the study period, and the maintenance of this synergistic relationship was conducive to promoting stable development of the rural landscape, improving the overall image and attractiveness of the rural areas and promoting a benign interaction between agricultural production and landscape aesthetics. These results provide important support for sustainable development of local villages.
3.2.2. Temporal Pattern of Rural Landscape Trade-Off in Jiashan County
In the rural landscape in Jiashan County, the landscape aesthetic function-environmental sustainable function (LAF-EMF) and the ecological trade-off function-environmental sustainable function (ERF-EMF) remained in a trade-off relationship, and the landscape aesthetic function-environmental sustainable function changed from −0.786 in 2000 to −0.717 in 2010. Finally, it stabilized at −0.783, that is, the trade-off between the landscape aesthetic function and environmental sustainable function was in a stable state during the past 20 years. The ecological trade-off function-environmental sustainability function varied from −0.952 to −0.915 to −0.867, exhibiting a slowly decreasing trend, but it was relatively stable overall. This indicates that there was irrationality in the environmental sustainability function of the rural landscape in Jiashan County. In general, the increases in the landscape aesthetic function and ecological trade-off function were often accompanied by improvement of the environmental sustainability function. The improvements of the landscape connectivity, diversity, normalized vegetation index (NDVI), and ecological synergy did not effectively improve the local environmental sustainability function. This indicates that in order to achieve better environmental sustainability, Jiashan County should further enhance the integration of the rural landscape aesthetic function and ecological function so as to achieve the dual goals of environmental sustainability and rural development.
3.2.3. Temporal Pattern of the Transformation Of The Rural Landscape Trade-Off And Synergistic Relationship in Jiashan County
In 2000, the agricultural production-ecological balance function in Jiashan County exhibited a trade-off relationship (−0.31*), which transformed into a synergistic relationship (0.851**) in 2010. A synergistic relationship (0.733*) occurred in 2020, that is, the temporal evolution of the relationship of the APF-ERF rural landscape was a trade-off–synergy relationship. This indicates that the synergy and interactions between the agricultural production functions and ecological balance functions was strengthened, and the correlation and support between them improved.
3.2.4. Temporal Pattern of the Rural Landscape Compatibility in Jiashan County
In the rural landscape in Jiashan County, the production-living function (PF-LF), production-ecological function (PF-EF), and living-ecological function (LF-EF) were all compatible at the three time nodes (failed the significance test). The positive and negative changes in the three groups of functions were analyzed. It was found that the production function and life function exhibited a trade-off and synergy trend, the production function and ecological function exhibited a synergy development relationship, and the life function and ecological function exhibited a trade-off development relationship, indicating that the basic production-living-ecological function of the rural landscape in Jiashan County needs to gradually improve the synergistic development capability so that compatibility can be transformed into a synergy relationship.
In summary, the main problems existing in the analysis of the function trade-off and synergistic relationship of the production-living-ecological functions of the rural landscape in suburban Jiashan County are as follows
(1) The landscape aesthetic function and ecological balance function cannot develop in concert with the environmental sustainable function, which indicates that the landscape aesthetic and ecological adjustment design cannot solve the problem with the local environmental sustainability function.
(2) The production-living-ecological functions of the rural landscape in Jiashan County were compatible, that is, there was no obvious synergistic relationship, indicating that the production-ecology-life functions of the rural landscape in Jiashan County could not increase synergistically.
3.3. Analysis of the spatial evolution of the tradeoff and synergistic relationship between the landscape production-living-ecological functions
3.3.1. Spatial Pattern of the Trade-Off And Synergistic Relationship Of The Production-Living-Ecological Functions In The Rural Landscape
Through bivariate global spatial autocorrelation analysis, the global Moreland index values of the rural landscape function in Jiashan County during 2000–2020 were obtained (Table 5). Among them, eight groups were compatible (did not pass the α=0.05 level test), one group was synergistic (positive statistic), and no group exhibited trade-off (negative statistic). Among the six sub-functions, 33 groups were compatible, seven groups exhibited trade-off, and five groups were synergistic. This indicates that the suburban rural landscape functions in Jiashan County from 2000 to 2020 generally exhibited a trade-off relationship, and there was significant spatial difference between the trade-off and synergistic degrees of the landscape functions.
(1) There were significant differences in the trade-offs and synergies at the spatial scale. The landscape’s aesthetic function-environmental sustainability functions always exhibited trade-off relationship, which is consistent with the results of the temporal evolution analysis, indicating that the design of the aesthetic function of the rural landscape in Jiashan County was irrational. The landscape aesthetics function and of ecological trade-off (LAF-ERF) function were always in a synergistic relationship. The spatial evolution of the agricultural production function-landscape aesthetic function manifested as trade-offs and synergies.
(2) The spatial heterogeneity of the trade-off in the degree of synergy increased steadily over time. The trade-off between the landscape aesthetic function and environmental sustainable function increased year by year. The synergistic relationship between the landscape aesthetic function and ecological balance function increased year by year.
In summary, through bivariate global spatial autocorrelation analysis, it was found that the rural landscape functions in Jiashan County from 2000 to 2020 were dominated by a trade-off relationship. The landscape aesthetic function and ecological balance function maintained a synergistic relationship, and the landscape aesthetic function and environmental sustainability function were always in a trade-off relationship. The relationship between the agricultural production function and landscape aesthetic function exhibits alternating changes of trade-offs and synergies over time. In addition, the spatial difference in the trade-offs and synergies was significant, and the degree of trade-offs and synergies continued to increase over time, among which the trade-off of landscape aesthetic function-environmental sustainable function and the synergies of the landscape aesthetic function-ecological balance function increased year by year. This indicates that in the rural landscape of the suburban area in Jiashan County, the trade-off and synergy between the functions constantly changed on the spatial scale, reflecting the complex interactions and spatial heterogeneity among the functions of the rural landscape. Moreover, the spatial trade-off between the landscape aesthetic function and environmental sustainability function revealed that the design of the aesthetic function of the rural landscape in Jiashan County did not play a synergistic role in the enhancement of the local environmental sustainability function, that is, the improvement of the appreciation of the local landscape did not drive the improvement of the functionality. While beautifying the appearance, attention should be paid to the improvement of the internal air quality and continuity of the landscape.
3.3.2. Spatiotemporal Evolution of the Trade-Off And Synergy Between The Production, Life, And Ecological Functions
Based on GeoDA’s bivariate local Moran index analysis of the trade-off and synergistic relationship between the production, life, and ecological functions, Figure 3 was obtained. Table 6 describes the specific significance of each section of the legend, from which the spatiotemporal evolution of the functional trade-off and synergistic relationship of the production-living-ecological functions in Jiashan County was obtained.
(1) The production-life functions in the study area were dominated by a trade-off relationship (i.e., most of the research units exhibited trade-off), but in Xitang Town and Ganyao Town, the synergistic relationship occurred in 2010, the trade-off relationship transformed into a trade-off relationship in 2020, and the trade-off relationship transformed into a synergistic relationship in Luoxing Street from 2010 to 2020.
(2) There was obvious spatial heterogeneity in the relationship of the production-ecological functions in the study area, among which the evolution relationship in Xitang Town from 2000 to 2020 was synergy-compatibility-trade-off, that in Weitang Street and Dayun town was synergy-compatibility-compatibility, and that on Huimin street was trade-off compatibility-trade-off.
(3) The life function-ecological function in the study area was dominated by a trade-off relationship, but the evolution relationship in Xitang Town was trade-off-compatibility-trade-off. In Dayun Town, it changed from synergy to compatibility in 2010, and Huimin Street and Luoxing Street exhibited a trade-off-compatibility-trade-off based evolution model.
In summary, it was found that the production-living-ecological functions on Huimin street were in a balanced relationship in all of the time periods, while the other towns and streets exhibited a certain evolution relationship, which indicates that the production-living-ecological functions on Huimin street, as a relatively central area in Jiashan County, could not achieve synergistic development, indicating that compared with the other streets and towns, the relationship between the production-living-ecological functions should be improved on Huimin street.
3.3.3. Trade-Offs Between Sub-Functions -Spatiotemporal Evolution of Synergistic Relationships
Based on the GeoDA, bivariate local Moran index analysis of the trade-off and synergy between the sub-functions was performed to obtain Figure 4, from which the spatiotemporal law of the trade-off and synergy between the sub-functions in Jiashan County were obtained.
(1) In 2000, the single-function trade-offs and synergies of the suburban rural landscape in Jiashan County mostly manifested as compatible relationships. In 2010, the single-function trade-offs and synergies of the suburban rural landscape in each township began to appear and mainly manifested as synergies. In 2020, the trade-offs and synergies began to change into trade-offs.
(2) Agricultural production function-economic development function (APF-EDF): The spatial pattern of synergy in the and trade-off in the south in 2000 changed synergy in the north in 2010, and it stabilized as trade-off in the north in 2020.
(3) Agricultural production function-spatial carrying function (APF-SCF): the relationship was compatible between 2000 and 2020.
(4) Agricultural production function-landscape aesthetic function: In 2000, it manifested as a trade-off relationship between Taozhuang Town and Xitang Town. In 2010, it manifested as a trade-off relationship between Xitang Town and Huimin Street and Luoxing Street. In 2020, it is manifested as a trade-off relationship between Xitang Town, Huimin Street, and Luoxing Street.
(5) Agricultural production function-ecological balance function: the compatible relationship in 2000 evolved into a trade-off relationship between Taozhuang Town, Huimin Street, and Luoxing Street in 2010. there was a synergistic relationship between Xitang Town and a trade-off relationship between Taozhuang Town, Xitang Town, Huimin Street, and Luoxing Street in 2020.
(6) Agricultural production function-environmental sustainability function (APF-EMF): in 2000, there was a compatible relationship. In 2010, the relationship evolved into a trade-off relationship between Taozhuang Town, Huimin Street, and Luoxing Street and a synergistic relationship between Xitang Town. In 2020, there was a trade-off relationship between Taozhuang Town, Xitang Town, Huimin Street, and Luoxing Street.
(7) Economic development function-spatial carrying function (EDF-SCF): All of the towns and streets were compatible in the three periods.
(8) Economic development function-landscape aesthetic function (EDF-LAF): In 2000, the pattern of trade-off in the north between Taozhuang Town and Xitang Town changed to a compatible relationship in Taozhuang Town, a synergistic relationship between Luoxing Street and Xitang Town, and a trade-off relationship on Huimin Street in 2010. there was a synergistic relationship on Luoxing Street, a trade-off relationship on Huimin Street, and a compatible relationship in Taozhuang Town in 2020.
(9) Economic development function-ecological balance function (EDF-ERF): In 2000, the entirety of Jiashan exhibited a compatible relationship, which evolved into a trade-off relationship between Taozhuang Town and Huimin Street in 2010, a synergistic relationship between Xitang Town and Luoxing Street in 2020 and a stable synergistic relationship on Luoxing Street.
(10) Economic development function-environmental sustainability function (EDF-EMF): In 2000, the entirety of Jiashan exhibited a compatible relationship, which evolved into a trade-off relationship between Taozhuang Town and Huimin Street in 2010, a synergistic relationship between Xitang Town and Luoxing Street in 2020 and a stable synergistic relationship on Luoxing Street.
(11) Space carrying function-landscape aesthetic function: In 2000, it manifested as a trade-off relationship between Taozhuang Town and Xitang Town, which evolved into a synergistic relationship between Xitang Town, Luoxing Street, and Huimin Street in 2010, and a synergistic relationship was maintained between these areas in 2020.
(12) Spatial carrying function-ecological balance function: The compatibility relationship of the entire study area in 2000 evolved into a synergistic relationship between Xitang Town, Luoxing Street, and Huimin Street in 2010 and 2020 and a trade-off relationship in Taozhuang Town.
(13) Space bearing function-environmental sustainable function (SCF-EMF): In 2000, the relationship was compatible, and in 2010 and 2020, it evolved into a collaborative relationship between Xitang Town, Luoxing Street, and Huimin Street and a trade-off relationship in Taozhuang Town.
(14) Landscape aesthetic function-ecological balance function: In 2000, the relationship was compatible, and in 2010 and 2020, it evolved into a synergistic relationship between Xitang Town and Taozhuang Town and a trade-off relationship between Huimin Street and Luoxing Street.
(15) Landscape aesthetic function-environmental sustainable function: In 2000, it was a compatible relationship, and in 2010 and 2020, it evolved into a collaborative relationship between Xitang Town and Taozhuang Town and a trade-off relationship between Huimin Street and Luoxing Street.
(16) Ecological trade-off function-environmental sustainable function: In 2000, it was a compatible relationship, and in 2010 and 2020, it evolved into a collaborative relationship between Xitang Town and Taozhuang Town and a trade-off relationship between Huimin Street and Luoxing Street.
In summary, from the perspective of space, the spatiotemporal law of the trade-offs and synergies among the sub-functions in Jiashan County mainly manifested as compatible-trade-off on the streets and compatible synergy trade-off in the towns. From the perspective of time, synergies and trade-offs among the functions of various streets and towns gradually appeared. The number of towns and streets with synergistic or trade-off functions increased rapidly from 2000 to 2010 and was stable from 2010 to 2020. This also demonstrates that the development of the urban and rural economy from 2000 to 2010 led to a sharp change in the functional relationship between these three and life. After the economic development became stable in 2010, although there the number of production-living-ecological sub-functional relationships in the suburban rural areas no longer increased, most of them transformed from synergy to trade-off, indicating that the development of production-living-ecological functions was not synergistic under the economic development and that the regional development was not synergistic. It should be noted that among the 15 single-function relationships, only the spatial carrying function-landscape aesthetic function in Jiashan County evolved from being mainly weighted to being mainly collaborative, and this relationship was remained stable from 2010 to 2020, indicating that the spatial carrying capacity of the residents in Jiashan County was complementary to the local landscape aesthetics, reflecting the synergistic development of the living space and living environment of the residents in Jiashan County. The Yangtze River Delta Ecological Green Integrated Development Demonstration Zone indicates that production, life, and ecological functions should develop in a coordinated manner. Relevant governments can consider promoting the coordinated development of production, life, and ecological functions through specific measures, such as planning and zoning, developing sustainable agriculture and industry, and strengthening environmental protection and restoration.
4. Discussion
Taking nine towns and streets in Jiashan County, Jiaxing City, as examples, this section discusses the evolution characteristics and rules of the suburban rural landscape functions in the Yangtze River Delta eco-green integrated development demonstration zone. the results help to more comprehensively determine the sustainable development direction of the suburban rural landscape functions in the context of rapid economic development in the Yangtze River Delta region and provide a scientific basis for relevant decision-making. Based on the above research conclusions and problems and the relevant policies and plans for the construction of the eco-green integrated development demonstration zone in the Yangtze River Delta region, we make suggestions for achieving improvement of the rural landscape in Jiashan County:
(1) The linear increase in the overall production function and living function led to decline of the ecological function. This suggests that the production function and living function should be maintained under the premise of protecting the ecological function, and the behavior of sacrificing the ecological environment to improve the production and living functions should be controlled at the county scale, with the Taipu river-Changbaitang water conservation area as the core. The spatial layout of the water, forest, and field land use types should be optimized, and the ecological garden of the new southern part of Jiangnan should be designed through the integration of rivers, lakes, forests, and farmland. For example, we suggest that the following measures be taken: vigorously carry out comprehensive remediation actions of unappropriated cultivated land, requisitioning of cultivated land, and/or development of forest land for urban construction and economic activities, carrying out land remediation actions on non-grain and non-agricultural cultivated land, and curbing the occurrence of farmland abandonment.
(2) In view of the trade-off conflict between the landscape aesthetic function and environmental sustainable function in the rural landscape, it is suggested that in rural planning and management involving landscape aesthetics, not only should the artistic appreciation of the landscape be considered, but more attention should be paid to the contiguous design and construction of the local ecological environment. Strengthening the relationship between Xitang and Jinze and Dianshan Lake in the Hongqitang Clean Water Corridor and the Jiaxing Wusong River Historical and Cultural Belt would not only help to shape the new Jiangnan water town into a style with Jiangnan charm, small town flavor, and modern style but would also improve the ecological and environmental functions of the entire demonstration area and would promote the development of landscape aesthetics and environmental sustainability functions.
(3) In view of the unbalanced development between the towns and streets, Jiashan County should maintain the basic compatibility relationship between the production-living-ecological functions and should eliminate the differences between the production-living-ecological functions in the towns and streets as much as possible. It should transform the development from compatibility to synergy and divide the identified H-H areas into corresponding functional advantage areas. The L-L areas should be divided into the corresponding function improvement area, the H-L areas should be divided into the corresponding function protection advantage area, and the L-H areas should be divided into the corresponding function key improvement area. In addition, with the Jiaxing Xiangfuang Innovation Center planned in the Yangtze River Delta Ecological and Green Integrated Development Demonstration Zone Territorial Space Master Plan (2021–2035) as the core, a green science and innovation corridor should be created, administrative barriers and institutional barriers in the demonstration zone should be removed. A new mechanism for regional integration and synergistic development that integrates ecological standards, the sharing of living and production resources, and the integration of management and law enforcement should be established. In addition, in view of the prominent trade-off between the production-living-ecological functions on Huimin Street, it is proposed that Dianshan Lake and Yuandang be taken as ecological green centers, and on the basis of centralized continuous protection and stability of high-quality cultivated land, part of the cultivated land and/or laid down cultivated land should be converted into forest land. The lakeside plants should be enriched, the greening rate of the community should be improved, and the integrity and connectivity of the blue and green spaces should be ensured. Appropriate introduction of tourism, leisure, horticultural expos, and other services should be conducted to enhance the production-living-ecological functions of the synergistic development relationship.
5. Conclusions
With the rapid development of urban construction and the urban and rural economy, the expectation of rural residents regarding the quality of life and environment has been significantly improved, and the rural landscape has also been developed in the direction of production-living-ecological functions. The implementation of an integrated development strategy in the Yangtze River Delta region has accelerated the urbanization process in the three provinces and one city in the Yangtze River Delta region, strengthened the connection between the countryside and the city, and provided new opportunities and challenges for the collaborative evolution of rural landscape functions. The development and changes of ecological environment, economy, and society in Jiashan County have had profound impacts on the rural landscape functions. The related evolution is driven by various factors such as relevant policies for the Yangtze River Delta eco-green integrated development demonstration zone, modernization, and globalization development, resulting in a non-linear change in the trade-off and synergistic evolution of the landscape production-living-ecological functions. The complex trade-offs and conflicts between ecological, economic, and social functions are reflected by the speed and direction of evolution at the time level, in the differentiation and volatility at the spatial level, by the constant changes in the value of the rural landscape at the edge of the city, and by the rapid changes in the living environment and lifestyle of rural community residents. Although the three functions have not fully achieved coordinated development in general, they are moving in that direction. Based on this study the following three conclusions were drawn.
(1) The linear growth of the production function and living function led to a decline in the ecological function, and the individual functions of the ecological function were also gradually degraded. This was mainly due to the excessive emphasis on the improvement of production and the living function during the recent rapid urbanization of rural areas in Jiashan County. By ignoring the maintenance and sustainable development of ecological functions, this emphasis led to deterioration of the ecological environment, which not only affected the quality of life of the residents but also posed a threat to the long-term development of the region. Healthy urban development should combine ecological protection with economic growth and urbanization efforts. Based on the current analysis of Jiashan County, its planning does not meet this demand. In subsequent development, ecological protection policies should be prioritized, and the economy should be developed only after a stable ecology.
(2) The functional relationships of the rural landscape in Jiashan County exhibited significant temporal and spatial changes. The agricultural production function and landscape aesthetic function consistently maintained a synergistic relationship, whereas the spatial carrying function and landscape aesthetic function shifted from a trade-off to synergy, promoting industrial adjustment and ecological optimization. However, persistent trade-offs were observed between the landscape aesthetic function and environmental sustainability function, as well as the ecological trade-off function and environmental sustainability function. This indicates that short-term aesthetic improvements have not resulted in long-term environmental benefits, highlighting the challenge of balancing aesthetic and sustainability functions for overall regional development.
(3) The spatial synergistic relationships of the rural landscape in Jiashan County exhibited significant geographic differentiation, influenced by geographic location, economic development, and ecological factors. On Huimin Street, the basic production-living-ecological functions displayed a trade-off relationship, unlike other towns and streets, which exhibited major changes. In Weitang, Luoxing, and Huimin Streets, the focus on production and living functions overshadowed ecological considerations, particularly in Jiashan County’s old city where landscape function conflicts remained unresolved. The recent Yangtze River Delta integration strategy and the development of demonstration zones caused the evolution pattern in Xitang and Yaozhuang Towns to shift from synergy to trade-off relationships, reflecting the challenges of balancing rapid development with ecological sustainability.
6. Limitations
There are still some shortcomings in the interpretation of the temporal and spatial changes at the township scale in this study. (1) In this study, we mainly analyzed the functional values of the three static time nodes in a differentiated manner. Although this method is objectively representative, it can easily cause discontinuity and imprecision of the analysis results [29]. The continuity of the research nodes will be added in future relevant studies. (2) The accuracy of the indicators is a prerequisite for accurate presentation of the results [38]. The evaluation of the landscape function involves a wide range of aspects. In this study, we screened out the functional dimensions and several representative indicators corresponding to the rural production-living-ecological space, but the rural landscape is the result of both multi-function and multi-factor effects [39]. Our research did not involve cultural inheritance, social support, ideology, emotional level, and other issues, and the representation integrity of the index combination was insufficient. The various indicators will be further refined in order to obtain more comprehensive characterization results. (3) The subjective needs of multiple levels and the diversity of human beings are difficult to represent using quantitative indicators [40]. In this study, we did not fully consider the differences in the wishes and preferences of groups and individuals, and we quantitatively assessed the landscape aesthetics from the perspective of ecological connectivity and diversity [41], and did not consider factors such as the visual perception and local characteristics of the aesthetics. The quantitative input of the peoples’ needs, and difference indicators will be increased in future relevant studies to improve the accuracy and comprehensiveness of the data and results.
Author Contributions
Methodology, J.P.; supervision, Z.L.; writing—original draft, S.G;writing—review and editing, S.G. All of the authors have read and agreed to the published version of the manuscript.
Funding
This work was supported by a grant from the 2023 Shanghai philosophy and social science planning project (Grant No. 2023BCK011).
Data Availability Statement
The data that support the findings of this study are available from the corresponding author upon reasonable request.
Conflicts of Interest
The authors declare that they have no conflicts of interest.
References
- Willemen, L.; Hein, L.; Vanmensvoort, E.F.; Verburg, P.H. Space for people, plants, and livestock? Quantifying interactions among multiple landscape functions in a Dutch rural region. Ecol. Indic.2010, 10, 62-73. [CrossRef]
- Fischer, J.; Lindenmayer, D.B. Landscape modification and habitat fragmentation: A synthesis. Glob. Ecol. Biogeogr. 2007, 16, 265-280. [CrossRef]
- Yang, G.; Ge, Y.; Xue, H.; Yang, W.; Shi, Y. Using ecosystem service bundles to detect trade-offs and synergies across urban-rural complexes. Landsc. Urban Plan. 2015, 136, 110-121. [CrossRef]
- Qiu, J.X.; Turner, M.G. Spatial interactions among ecosystem services in an urbanizing agricultural watershed. Proc. Natl. Acad. Sci. USA 2013, 110, 12149-12154. [CrossRef]
- Chen, X.; Ning, Y. A study on rural urbanization in the suburbs of big cities: A case study of Shanghai. Urban Probl. 1997, 3, 27-31.
- Yin, W. Theoretical and Practical Exploration of metropolitan suburb development. Master’s Thesis, East China Normal University, Shanghai, China, 2007.
- Zheng, J.; Na, L.; Liu, B.; Zou, Y. An ecological service system based study on suburban rural landscape multifunction. Land 2021, 10, 232. [CrossRef]
- Jiang, J. Research on the organic rural renewal strategy of super-city suburbs under the urban-rural integration pattern: A case study of Shanghai’s suburbs and exurbs. Shanghai Urban Plan. Rev. 2023, 4, 62-69.
- Peng, J.; Liu, Z.; Liu, Y.; Hu, Y.; Wang, Y. Multifunctionality assessment of urban agriculture in Beijing City, China. Sci. Total Environ. 2015, 537, 343-351. [CrossRef]
- Lautenbach, S.; Kugel, C.; Lausch, A.; Seppelt, R. Analysis of historic changes in regional ecosystem service provisioning using land use data. Ecol. Indic. 2011, 11, 676-687. [CrossRef]
- Skalos, J.; Berchova, K.; Pokorny, J.; Vozenilek, V. Landscape water potential as a new indicator for monitoring macrostructural landscape changes. Ecol. Indic. 2015, 36, 80-93. [CrossRef]
- Costanza, R.; Diarge, R. The value of the world’s ecosystem services and natural capital. Nature 1997, 387, 253-260. [CrossRef]
- Zhu, Q.; Hu, W.; Zhao, Z. Dynamic analysis of trade-off and synergistic spatio-temporal pattern of cultivated land "three crops" function: A case study of Hubei Province. Econ. Geogr. 2018, 38, 143-153.
- De Groot, R.S.; Wilson, M.A.; Boumans, R.M.J. A typology for the classification, description and valuation of ecosystem function, goods and services. Ecol. Econ. 2010, 41, 393-408. [CrossRef]
- Cai, Y. Rural transformation and farmland protection mechanism in China. Sci. Geogr. Sin. 2001, 21, 1-6.
- Gonzalez-Redin, J.; Luque, S.; Poggio, L.; Smith, R.; Gimona, A. Spatial Bayesian belief networks as a planning decision tool for mapping ecosystem services trade-offs on forested landscapes. Environ. Res. 2016, 144, 15-26. [CrossRef]
- Deng, R. Research on landscape planning and design of terrace based on the integration of agriculture and tourism -- A case study of Huayan Terrace in Youyang. Master’s Thesis, Southwest University, Chongqing, China, 2008.
- Zou, H. Assessment of ecosystem service value of shrub grass in hilly and gully region of the Loess Plateau in Longzhong. Master’s Thesis, Lanzhou University, Lanzhou, China, 2021.
- Zhang, D.; Li, K.; Sun, Q.; Wang, Y. Analysis of site community characteristics and landscape function in semi-arid area of Loess Plateau. Chin. Urban For. 2017, 15, 11-15.
- Luo, S.; Lai, Q.; Wang, X.; Chen, X. Cultivated land zoning control in Fujian Province based on the function evaluation and trade-off synergy relationship of "production-living-ecology". Trans. Chin. Soc. Agric. Eng. 2019, 39, 271-280.
- Zhuo, Z.; Xing, A.; Sun, Z.; Gao, L. Analysis of synergistic development and trade-off of agro-ecosystems in Northeast China. Chin. J. Eco-Agric. 2018, 26, 892-902.
- Feng, Z.; Wu, J.; Gao, Y.; Yuan, S. Landscape function classification based on SOFM network: A case study of Beijing and its surrounding areas. J. Geoinf. Sci. 2012, 14, 800-806.
- Ren, G.; Liu, L.; Li, H.; Zhang, X.; Yang, L. Evolution of function trade-off and synergistic relationship of rural landscape in urban suburbs. Trans. Chin. Soc. Agric. Eng. 2019, 35, 273-285.
- The CPC Central Committee, The State Council. CPC Central Committee. The State Council issued the Yangtze river delta regional integration development plan outline. Available online: http://www.gov.cn/zhengce/zhengceku/2023-02/21/content_5742406.htm (accessed on 4 February 2023).
- Shanghai Municipal Government Synergy and Exchange Office. Shanghai what do together into neighboring event. Available online: http://www.gov.cn/zhengce/zhengceku/2023-02/21/content_5742406.htm (accessed on 10 February 2021).
- Under the State Council. The overall plan for the Yangtze River Delta eco-green integrated development demonstration zone (2021-2035). Available online: http://www.gov.cn/zhengce/zhengceku/2023-02/21/content_5742406.htm (accessed on 4 February 2023).
- Ji, S.; Duan, J.; Xue, S.; Zhang, J. Exploration of urban design methods based on spatial gene inheritance: A case study of the living room of Shui Township in Yangtze River Delta integrated Demonstration Zone. City Plan. Rev. 2019, 47, 4-12+48.
- Wang, C.; Peng, Q.; Tang, N.; Li, J.; Wang, X. Spatial and temporal evolution, synergy and tradeoff of cultivated land "production-living-ecological" function from 2005 to 2015: A case study of Shapingba District, Chongqing. Sci. Geogr. Sin. 2018, 38, 590-599.
- Pan, J.; Li, Z. Spatial trade-off and synergistic effect of ecosystem services in arid inland river basin. Trans. Chin. Soc. Agric. Eng. 2017, 33, 280-289.
- Fan, J. Plan of main function zoning in China. Acta Geogr. Sin. 2015, 70, 186-201.
- Millennium E.A. Ecosystems and Human Well-being Synthesis. Washington DC: Island Press, 2005; pp. 559-567.
- Cheng, Z.; Zhang, Y.; Wang, L.; Song, L. Study on the spatial evolution characteristics and driving forces of "production-living-ecology" in western Jilin Province. Areal Res. Dev. 2023, 42, 33-39.
- Wei, W.; Yin, L. Evolution and driving mechanism of "three-region spatial pattern" in Northeast China. Sci. Geogr. Sin. 2023, 43, 324-336.
- Li, W.; Wang, F.; Ma, X.; Xiao, L.; Lin, Y. Spatial and temporal evolution mechanism of land use in ecotype urban tourism complex: A case study of Xixi Wetland. Tour. Trib. 2019, 38, 133-148.
- Xu, X.; Liu, J.; Zhang, S.; Ouyang, Z.; Zheng, D. China Multi-Period Land Use and Land Cover Remote Sensing Monitoring Data Set (CNLUCC). Available online: http://www.resdc.cn (accessed on 23 February 2024).
- Van Donkelaar, A.; Hammer, M.S.; Bindle, L.; Brauer, M.; Martin, R.V. Monthly Global Estimates of Fine Particulate Matter and Their Uncertainty. Environ. Sci. Technol. 2021, 55, 15287-15300. [CrossRef]
- WORLDPOP; Bondarenko, M. Individual Countries 1km UN Adjusted Population Density (2000-2020). Available online: https://hub.world pop.org/project/categories?id=18 (accessed on 6 February 2024).
- Li, G.; Fang, C. Quantitative identification and analysis of urban ecology-Production-living spatial function. Acta Geogr. Sin. 2016, 71, 49-65.
- Mina, M.; Bugmann, H.; Cordonnier, T.; Irauschek, F.; Klopcic, M.; Cailleret, M. Future ecosystem services from European mountain forests under climate change. J. Appl. Ecol. 2017, 54, 389-401. [CrossRef]
- Peng, J.; Lu, H.; Liu, Y.; Hu, Y.; Li, W.; Wu, J. Research progress and prospect of "production-living-ecological" functional landscape at home and abroad. Adv. Earth Sci. 2015, 30, 465-476.
- Green, R.E.; Cornell, S.J.; Scharlemann, J.P.W.; Balmford, A. Farming and the fate of wild nature. Science 2005, 307, 550-555. [CrossRef]
Figure 1.
Location of the study area.
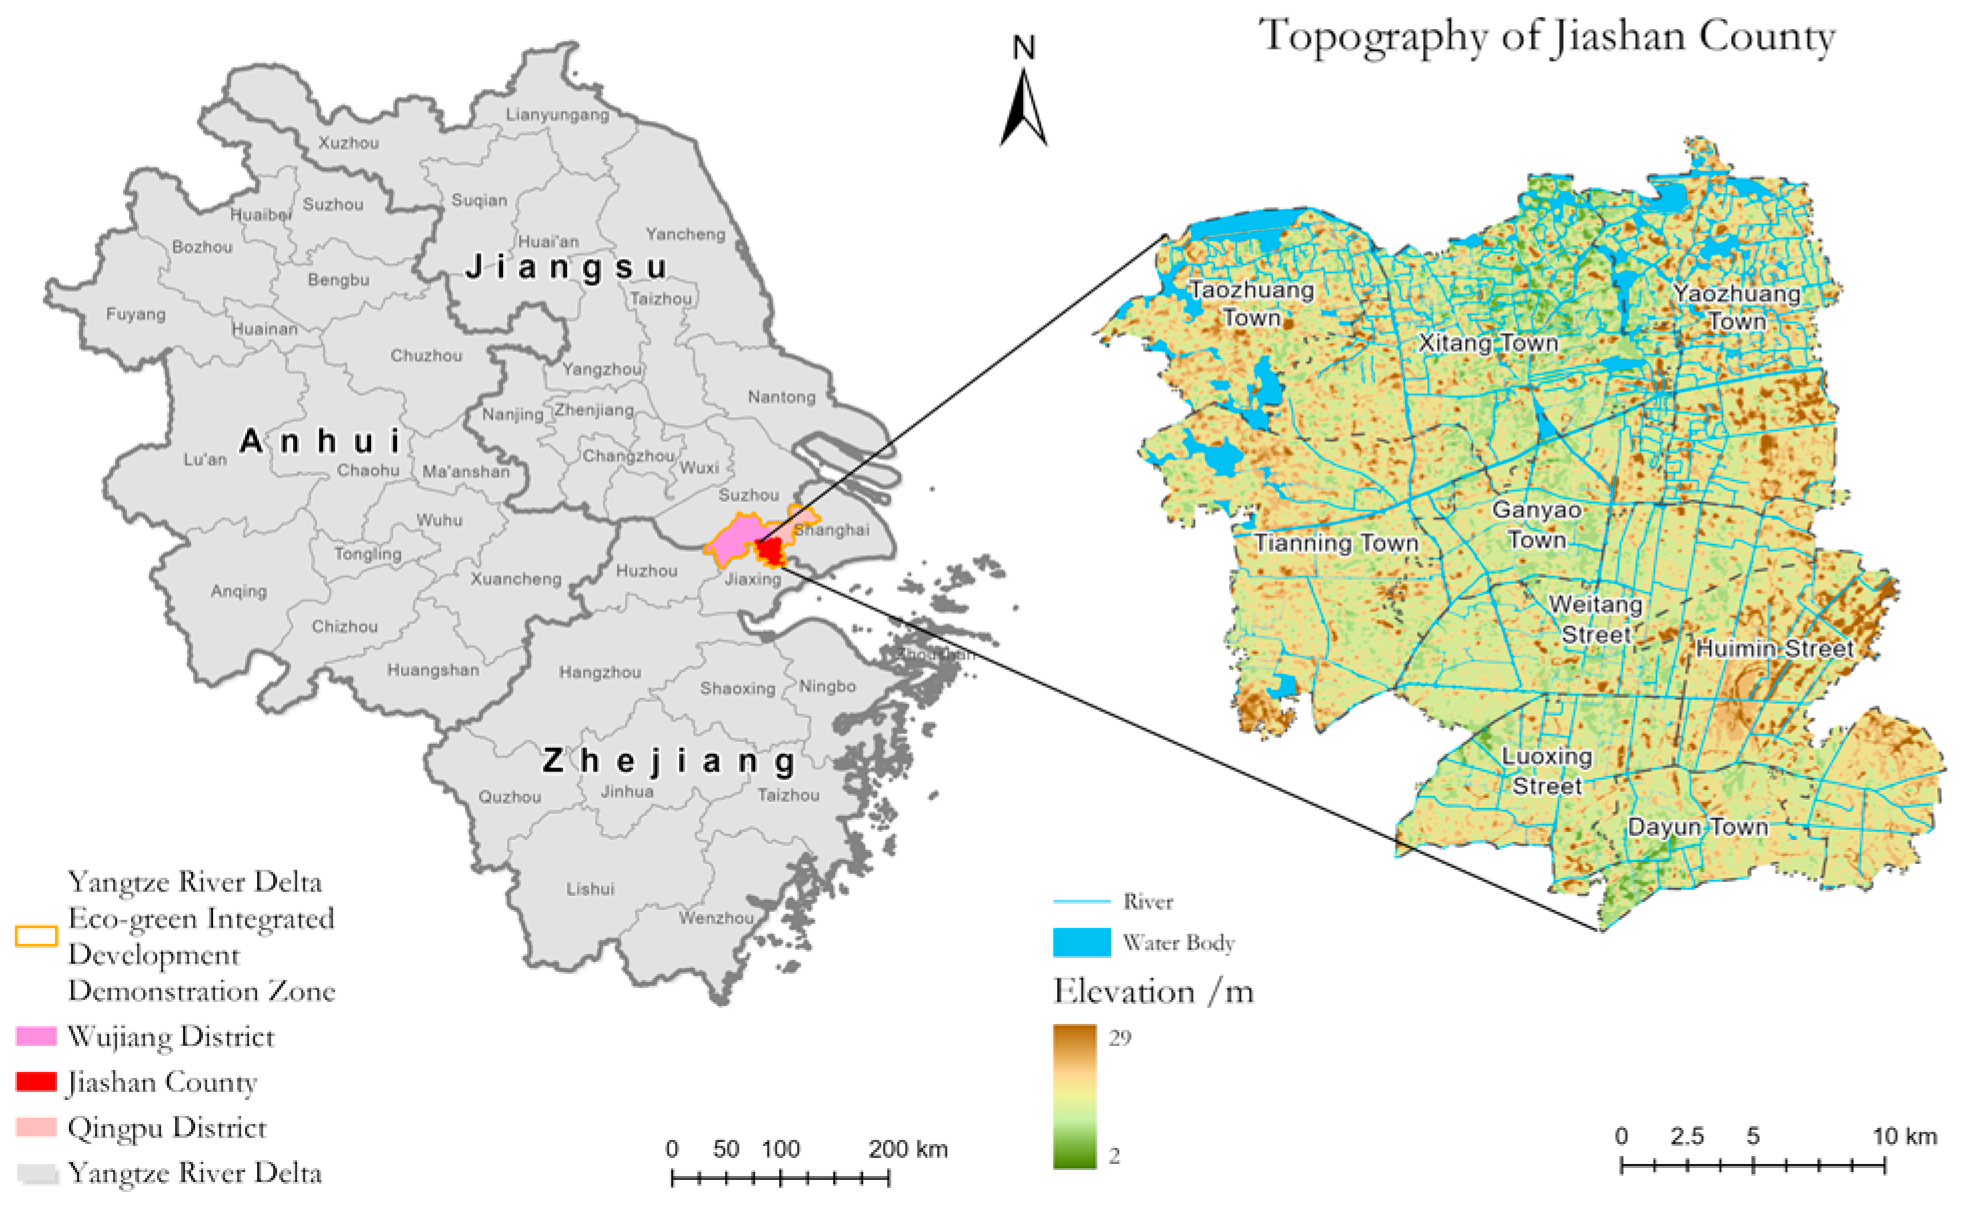
Figure 2.
Temporal evolution of the functional trade-off and synergistic relationship of the rural landscape in Jiashan County.
Figure 2.
Temporal evolution of the functional trade-off and synergistic relationship of the rural landscape in Jiashan County.
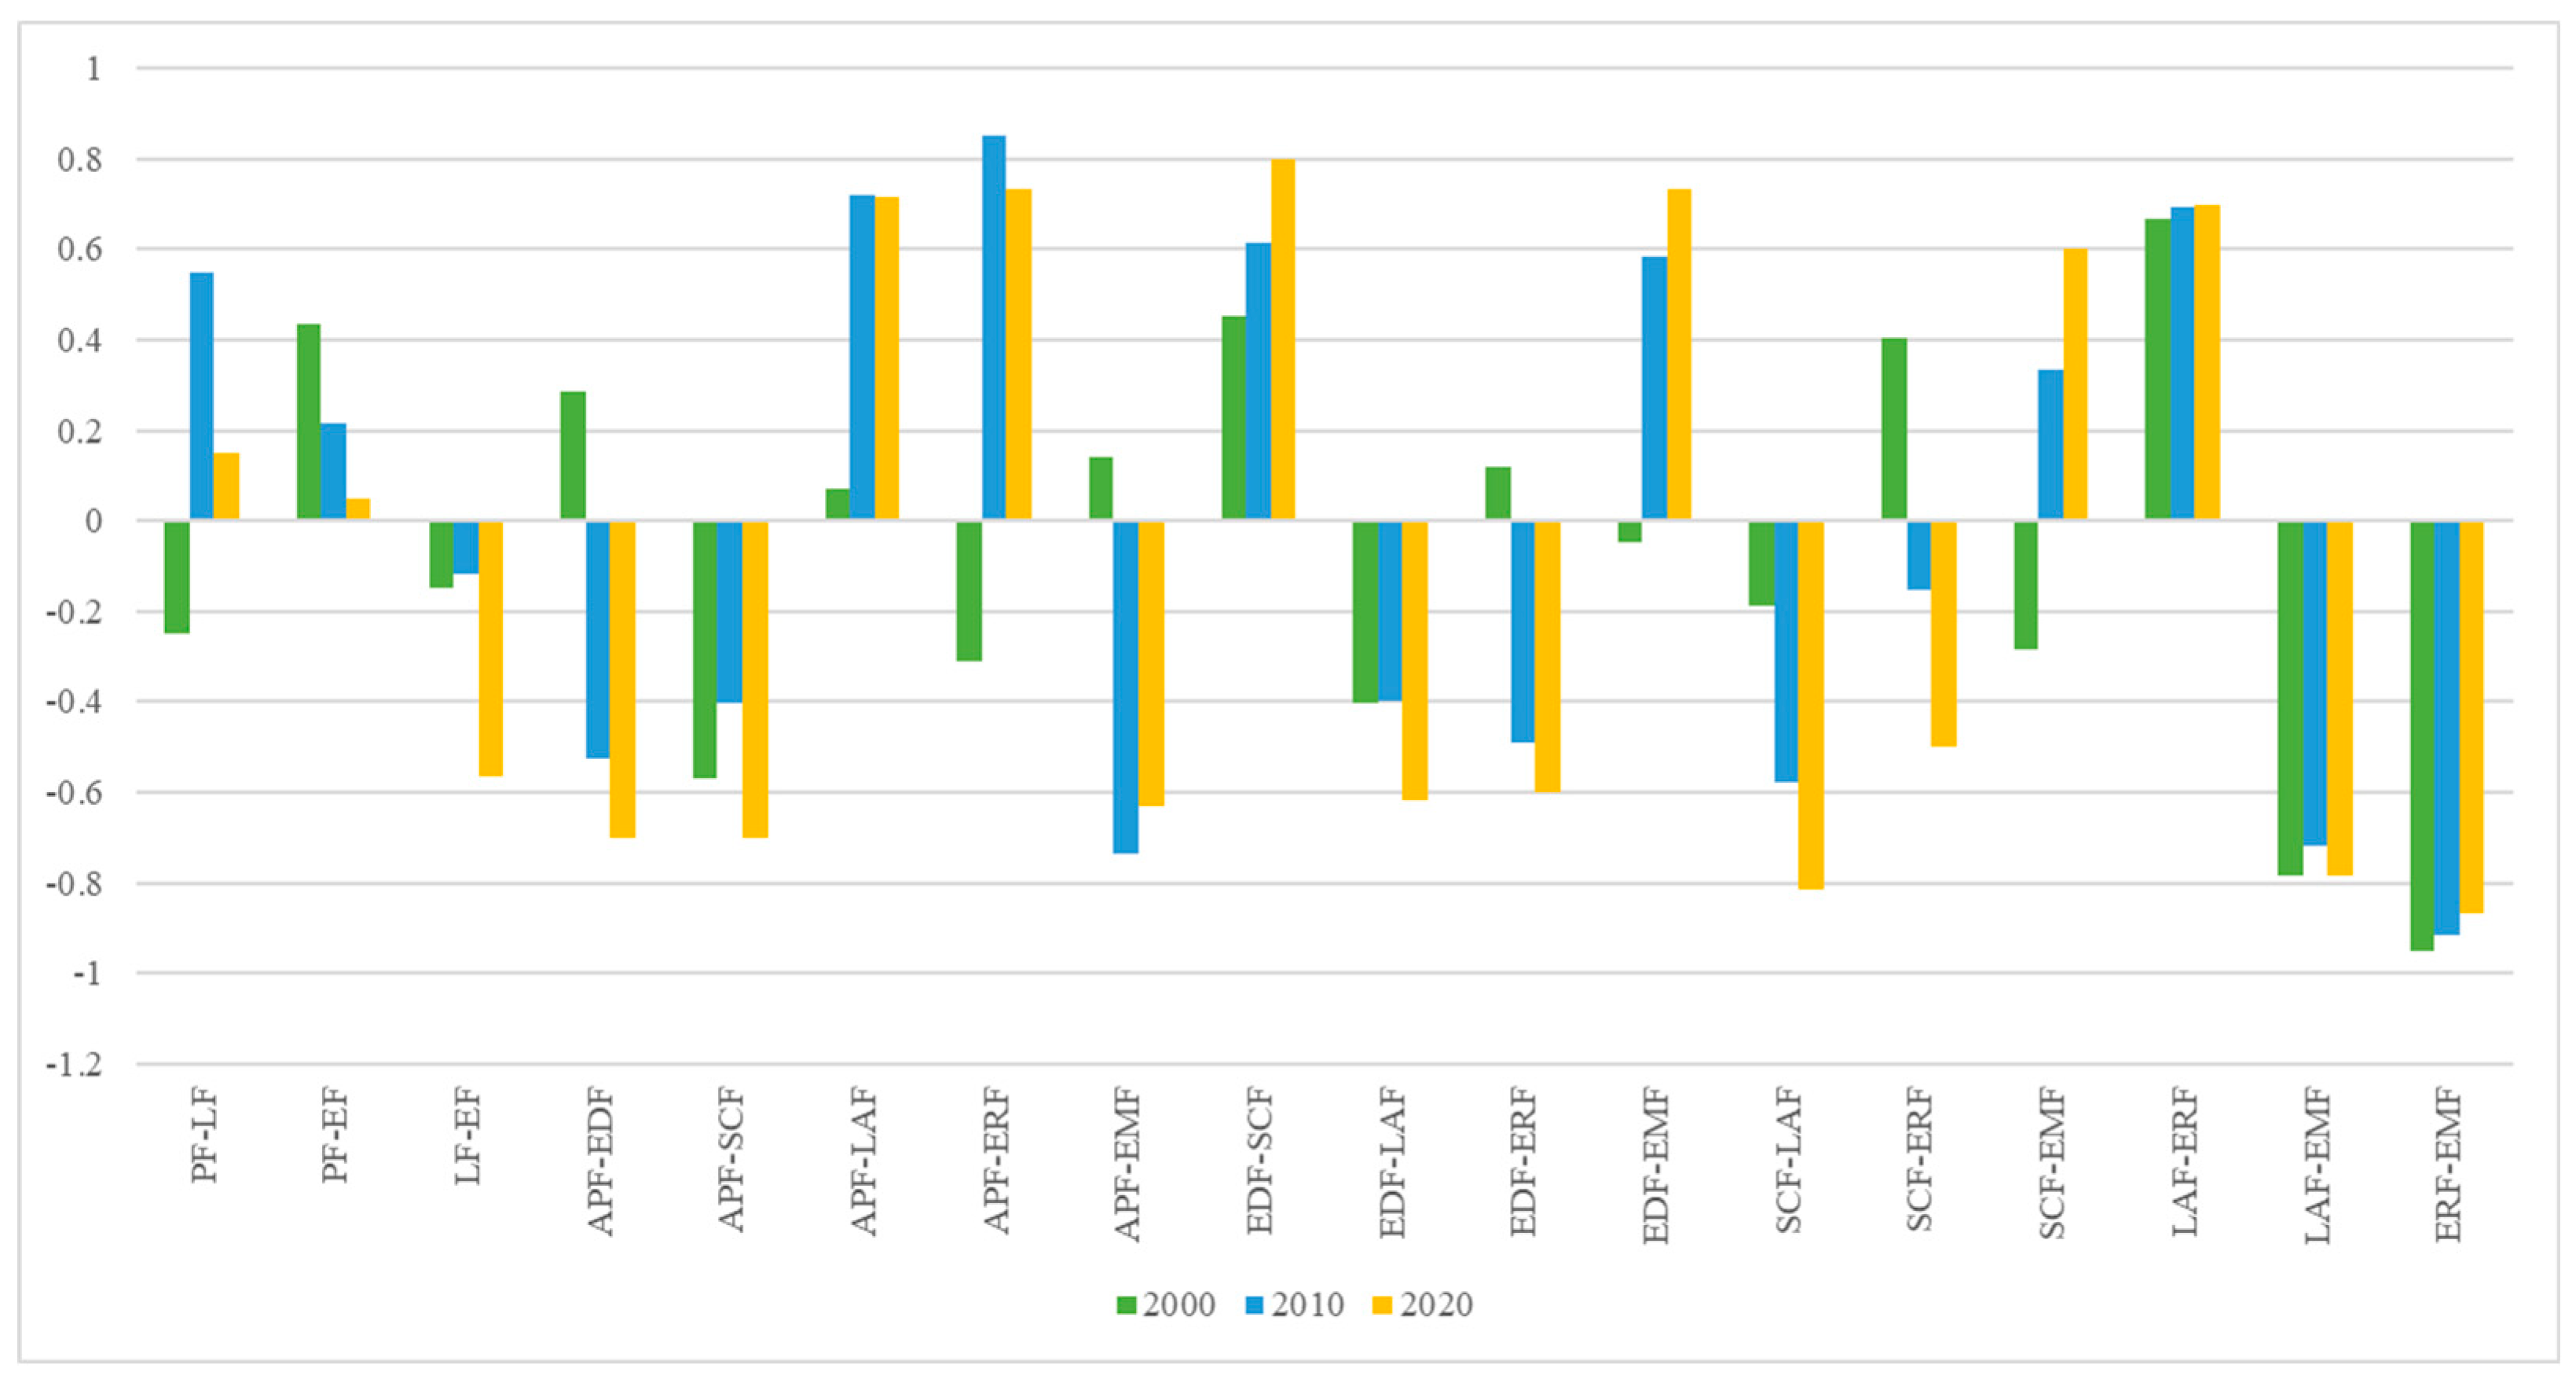
Figure 3.
Local indicators of spatial association (LISA) diagram of trade-offs and synergies between the production-living-ecological functions.
Figure 3.
Local indicators of spatial association (LISA) diagram of trade-offs and synergies between the production-living-ecological functions.
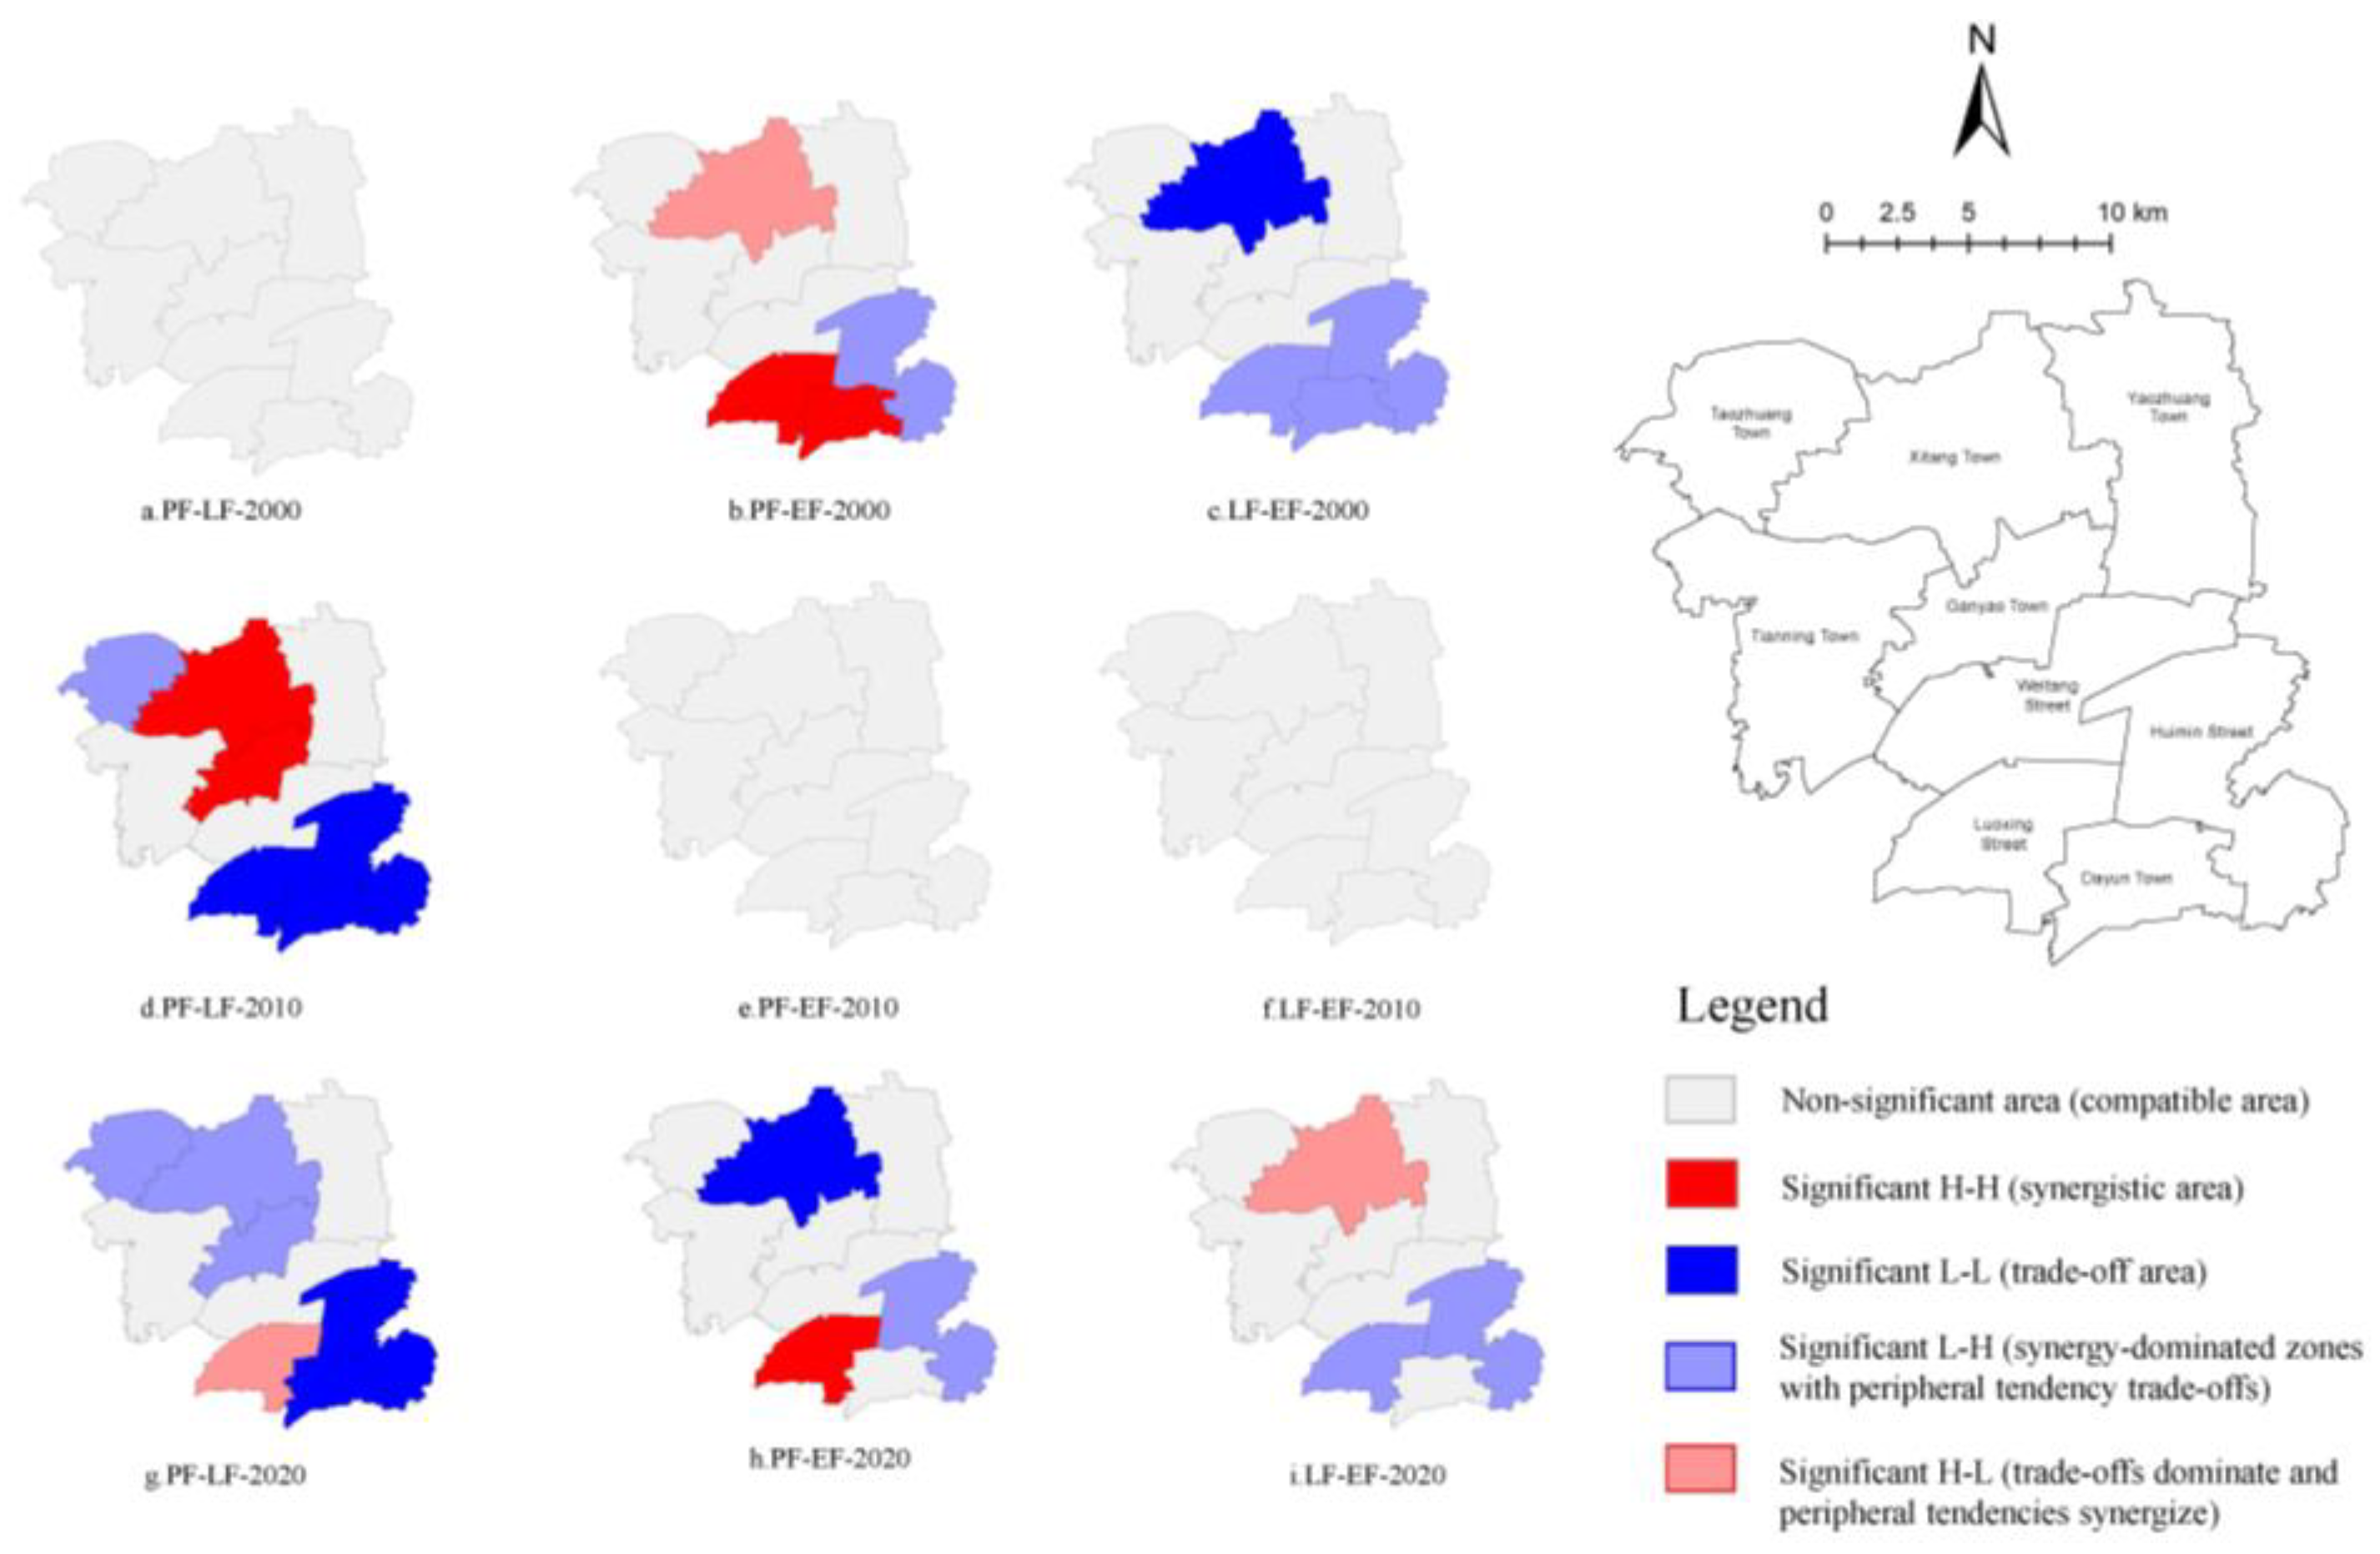
Figure 4.
Figure 4. Spatial and temporal evolution of the trade-off between the sub-functions and LISA diagram for 2000, 2010, and 2020 from top to bottom.
Figure 4.
Figure 4. Spatial and temporal evolution of the trade-off between the sub-functions and LISA diagram for 2000, 2010, and 2020 from top to bottom.
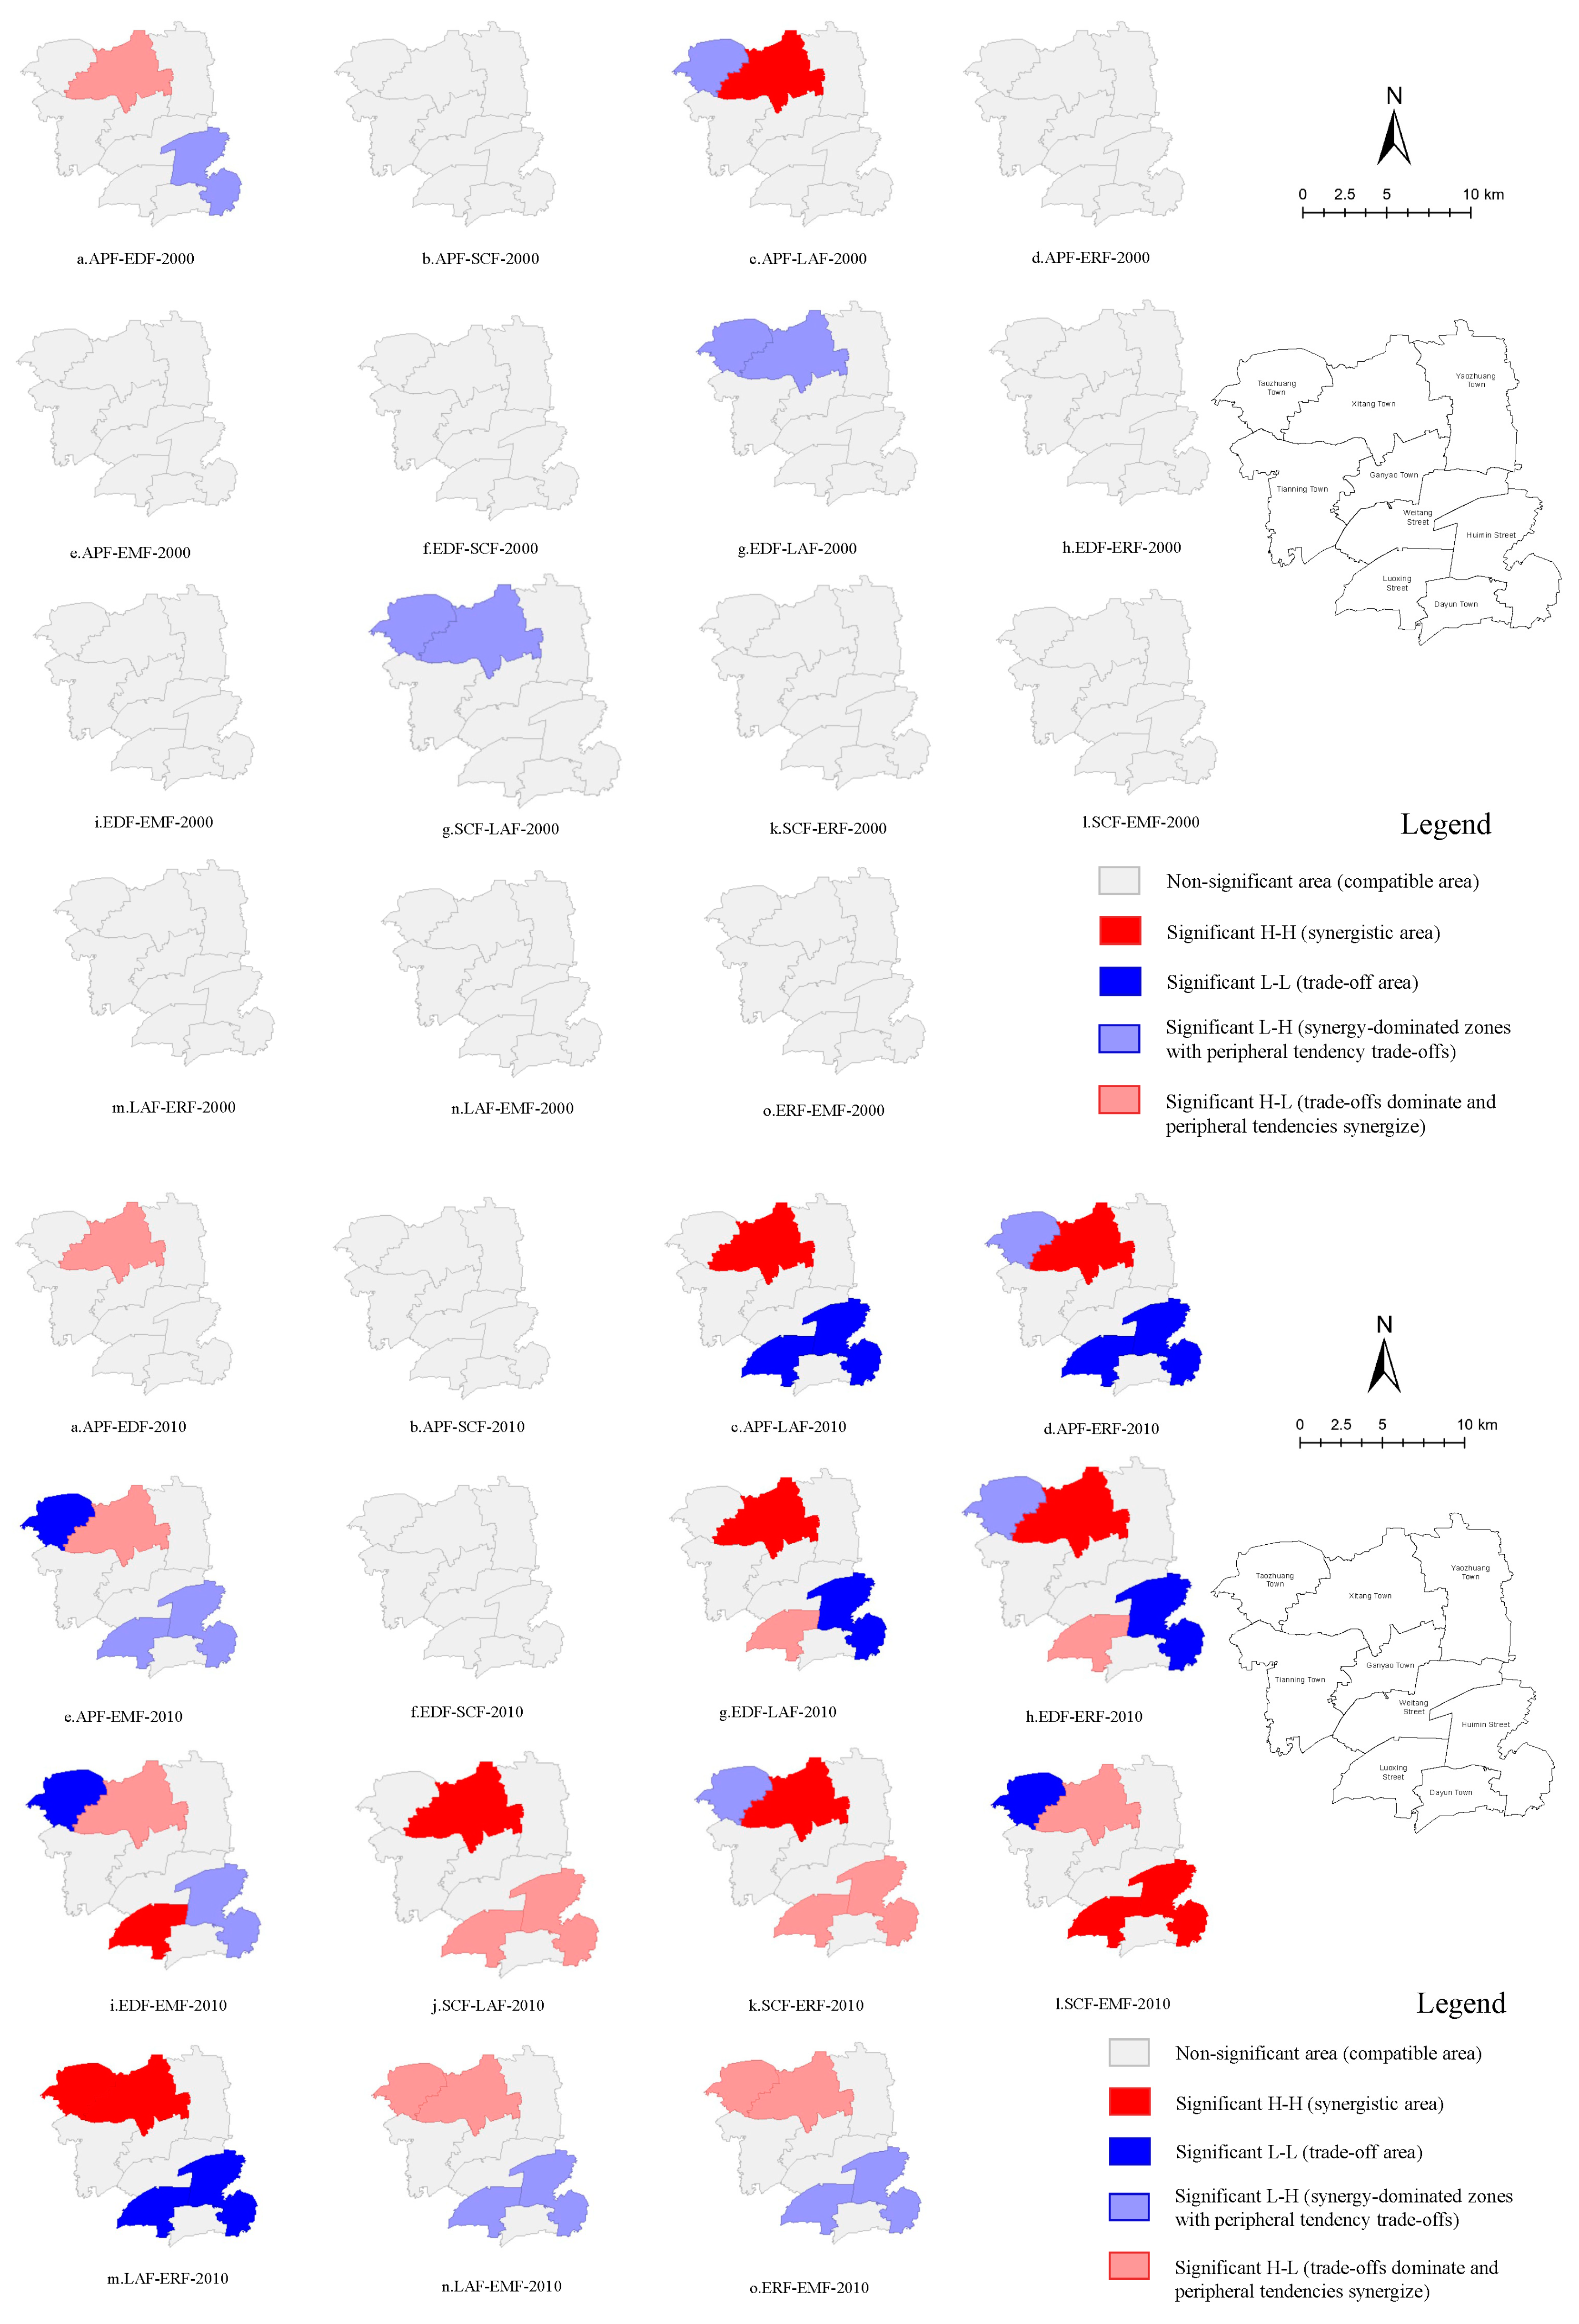
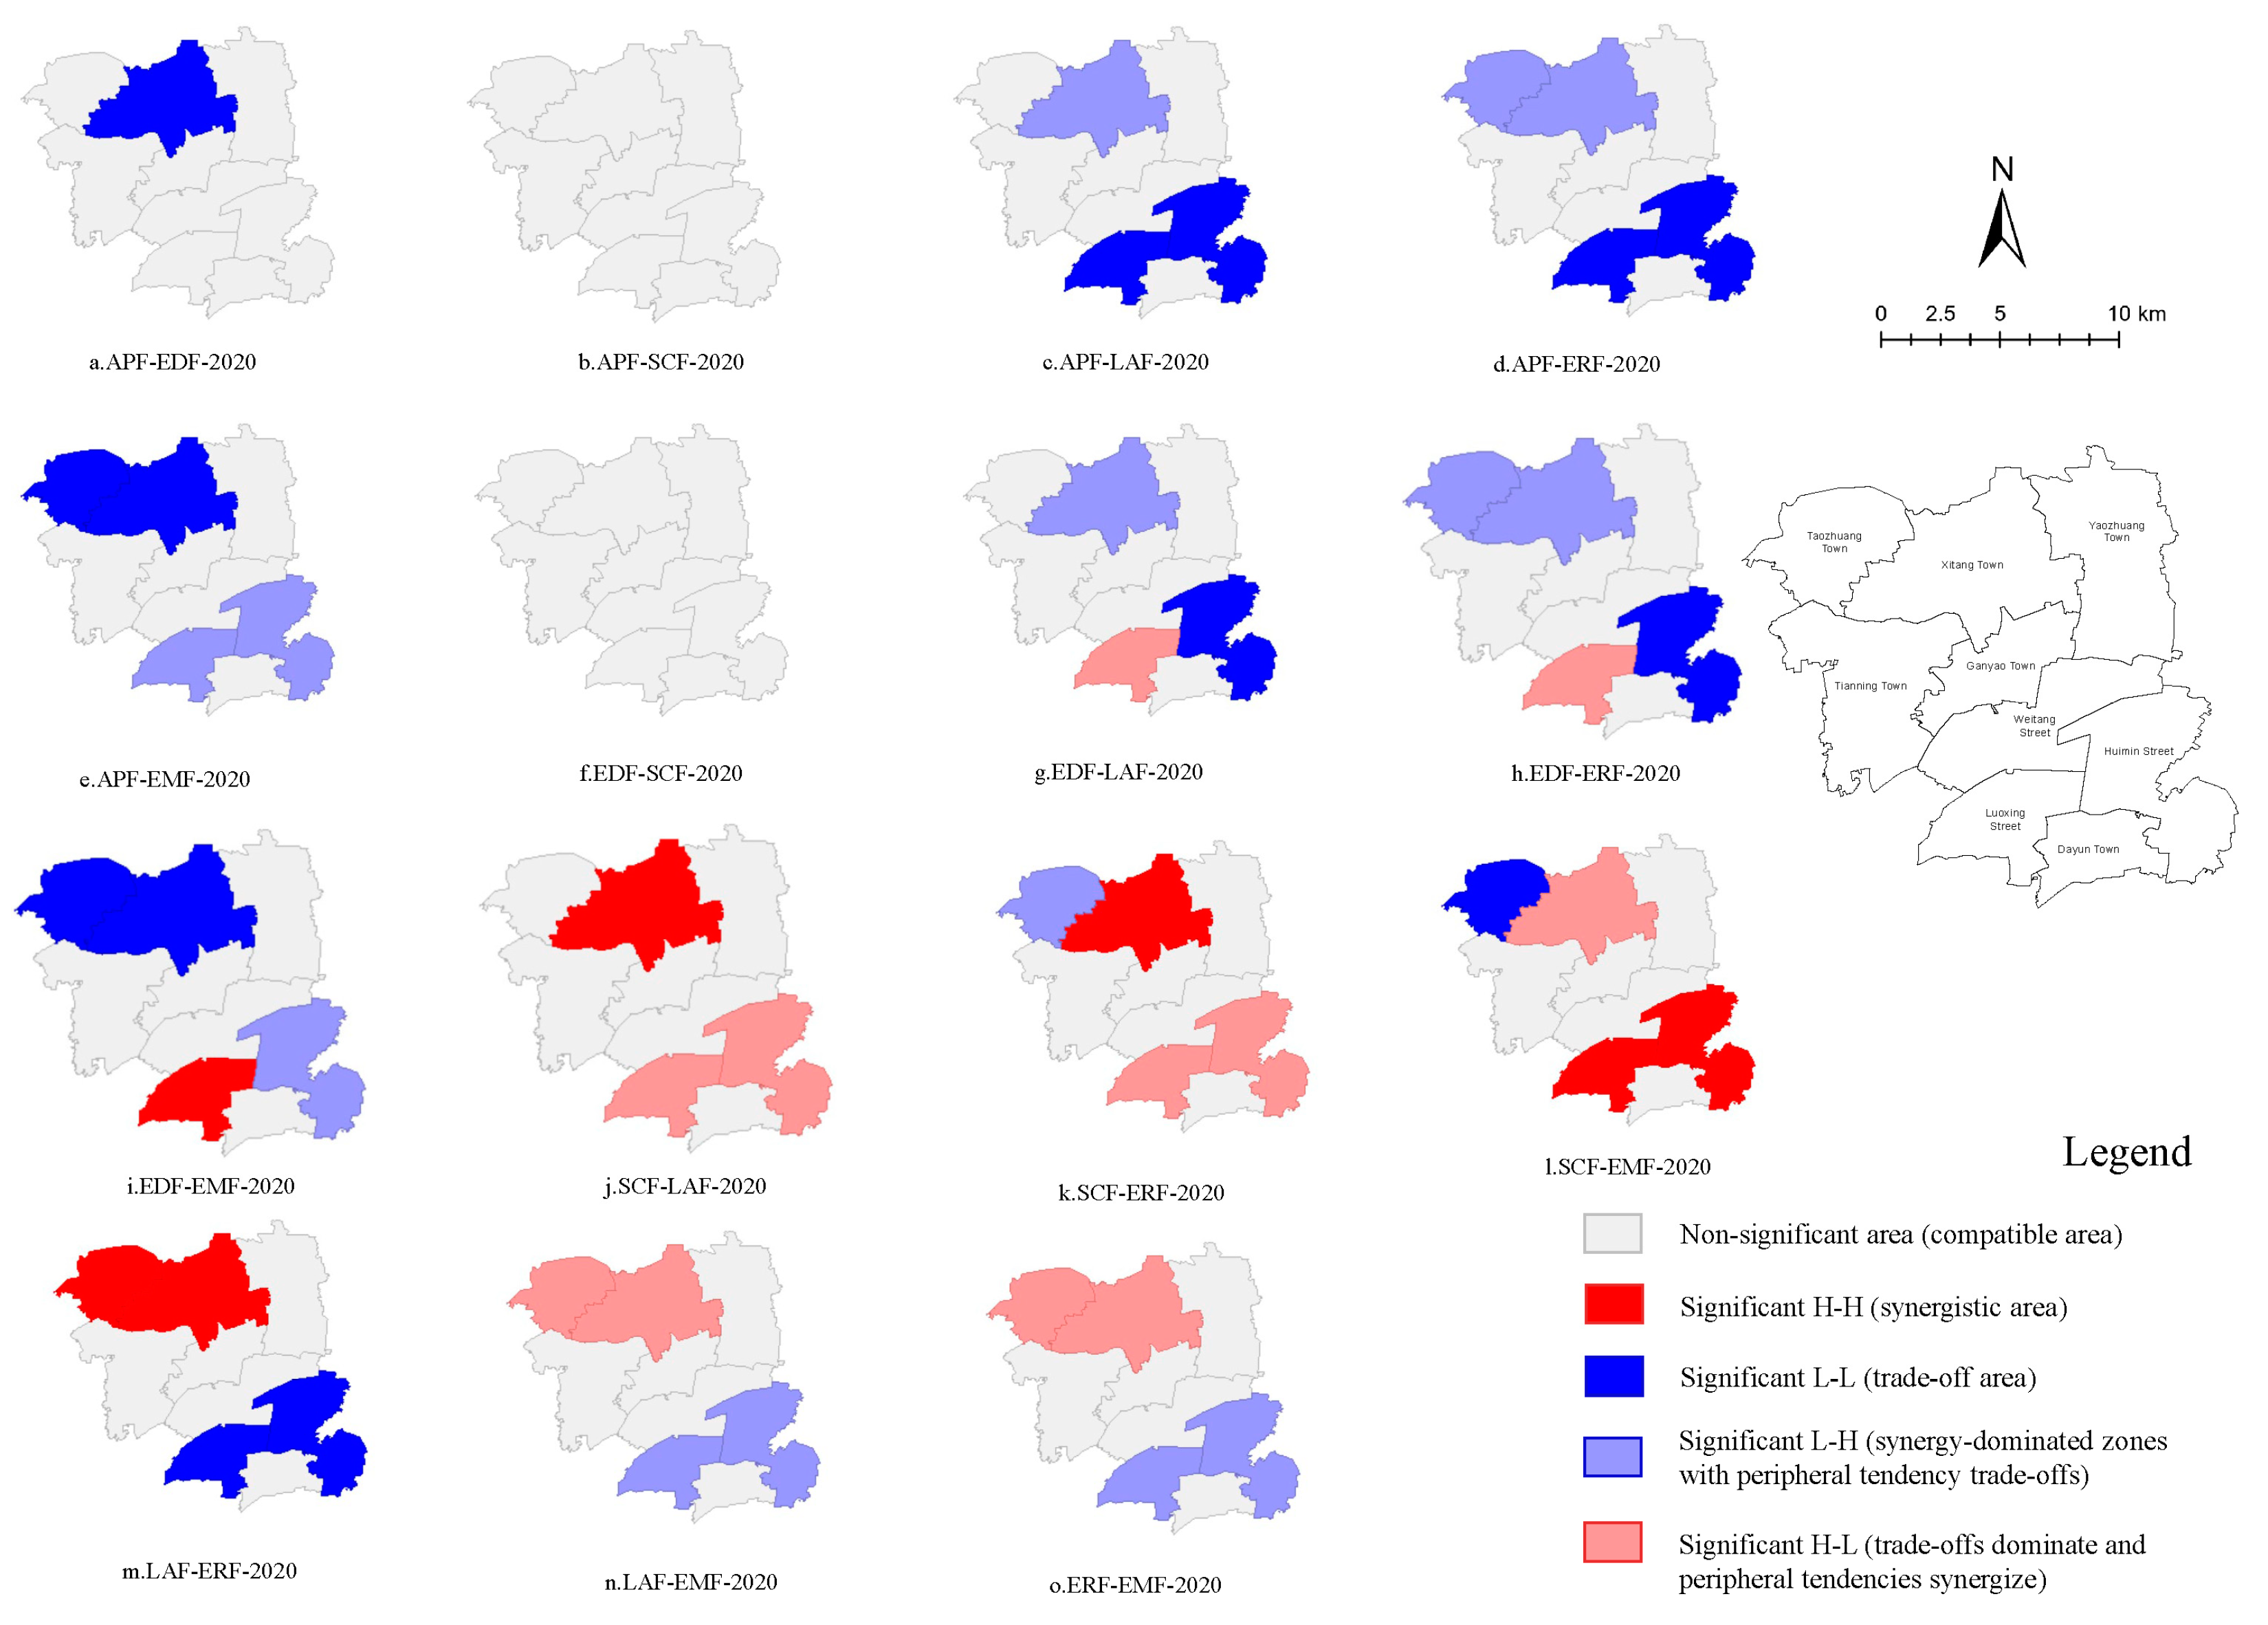

Table 1.
Rural landscape function evaluation index system.
| Target Layer | Criterion Layer | Index Layer | Calculation Method or Index Significance | Index Relationship | Index Weight |
|---|---|---|---|---|---|
| Production function (PF) | Agricultural production function (APF) |
Agricultural productivity per capita | Gross value of primary industry/total township population (10,000 yuan/person). | Forward direction | 6.02% |
| Agricultural output value per land | Agricultural output value/cultivated land area (Yuan/square meter). | Forward direction | 4.53% | ||
| Economic development function (EDF) |
Industrial contribution rate | (Output value of primary industry + output value of tertiary industry)/township GDP. | Forward direction | 10.94% | |
| Township urbanization level | Township construction land/total area of township. | Forward direction | 5.39% | ||
| Living function (LF) |
Space carrying function (SCF) | Per capita living area | Township construction land area/total population (km2). | Forward direction | 7.25% |
| Population density | Reflects the population carrying capacity of the township. | Forward direction | 12.27% | ||
| Landscape aesthetic function (LAF) | Landscape connectivity | CONTAG (0, 100%] - The degree of agglomeration or spread of different patch types in the landscape. The greater the value is, the better the patch connectivity is. | Forward direction | 6.44% | |
| Landscape diversity | SHDI [0, +∞) - The larger the value is, the more abundant the patch types and distributions in the landscape. | Forward direction | 5.60% | ||
| Ecological function (EF) |
Ecological regulation function (ERF) | NDVI | Reflect the vegetation state of the township. | Forward direction | 23.91% |
| Ecological synergy degree | SHEI [0, 1) - A smaller value indicates that the landscape is more dominated by a few dominant types, and a larger value indicates that the distribution of all of the landscape types is more uniform. | Forward direction | 5.80% | ||
| Environmental maintenance function (EMF) | PM2.5 | Reflects the degree of air pollution in towns and villages. | Reverse direction | 4.32% | |
| Landscape fragmentation | The landscape division Index is one of the indicators used to evaluate landscape fragmentation, and it mainly measures the degree of fragmentation of views. | Reverse direction | 7.54% |
Table 2.
Data sources and descriptions.
| Data | Data Source | Application Indicators |
|---|---|---|
| Multi-period land use/land cover remote sensing monitoring data for China [35] | The multi-period land use/land cover remote sensing monitoring Chinese National Land Use and Cover Change (CNLUCC) database from the Chinese Academy of Sciences has a resolution of 30 m. | Landscape connectivity, landscape diversity index, and landscape fragmentation |
| Satellite-derived PM2.5 [36] | The global and regional PM2.5 concentrations are estimated using information from satellite, modelling, and monitoring sources. The aerosol optical depth and simulation [Goddard Earth Observing System with Chemistry (GEOS-Chem)] from multiple satellites (MODIS, VIIRS, MISR, and SeaWiFS) and their respective retrievals (Dark Target, Deep Blue, and MAIAC) are combined to determine the relative uncertainties based on observations using ground-based solar photometers [Aerosol Robotic Network (AERONET)] to produce geophysical estimates. This explains most of the differences in ground-level PM2.5 measurements. Additional information from PM2.5 measurements is then tallied at a resolution of 0.01°. | PM2.5 |
| GDP | The China km grid GDP spatial distribution dataset from the Resources and Environmental Sciences Data Registration and Publication System, Chinese Academy of Sciences (http://www.resdc.cn/DOI). | GDP |
| Population density [37] | China’s 1 km population density dataset was downloaded from WorldPop (https://hub.worldpop.org/). | Population density |
| Normalized Difference Vegetation Index (NDVI) | Landsat 7 and Landsat 8 images with a resolution of 30 m were downloaded from NASA, and the NDVI index was calculated in ArcGIS Pro (https://www.jiashan.gov.cn/). | NDVI |
| Administrative boundary data | The base map is from the standard map service system of the Ministry of Natural Resources, and the review number is GS(2023)2767. | \ |
| Jiashan County Yearbook for 2001, 2011, and 2021 | Jiashan County Statistics Bureau for (https://www.jiashan.gov.cn/). | Agricultural earnings, industrial output, and commercial activity |
Table 3.
Results of comprehensive evaluation of production-living-ecological functions of the rural land-scape in Jiashan County.
Table 3.
Results of comprehensive evaluation of production-living-ecological functions of the rural land-scape in Jiashan County.
| Category | Feature | 2000 | 2010 | 2020 |
|---|---|---|---|---|
| Target layer | PF | 0.043 | 0.091 | 0.108 |
| LF | 0.070 | 0.143 | 0.152 | |
| EF | 0.310 | 0.087 | 0.102 | |
| Criterion layer | APF | 0.020 | 0.050 | 0.052 |
| EDF | 0.023 | 0.041 | 0.056 | |
| SCF | 0.039 | 0.064 | 0.075 | |
| LAF | 0.031 | 0.077 | 0.079 | |
| ERF | 0.242 | 0.039 | 0.039 |
Table 4.
The temporal pattern of the functional trade-off and synergistic relationship of the rural landscape in Jiashan.
Table 4.
The temporal pattern of the functional trade-off and synergistic relationship of the rural landscape in Jiashan.
| Rural Landscape Function Synergy Type | 2000 | 2010 | 2020 | |||
|---|---|---|---|---|---|---|
| Correlation Coefficient | P-Value | Correlation Coefficient | P-Value | Correlation Coefficient | P-Value | |
| PF-LF | −0.25 | 0.516 | 0.55 | 0.125 | 0.15 | 0.7 |
| PF-EF | 0.433 | 0.244 | 0.217 | 0.576 | 0.05 | 0.898 |
| LF-EF | −0.15 | 0.7 | −0.117 | 0.765 | −0.567 | 0.112 |
| APF-EDF | 0.286 | 0.493 | −0.527 | 0.145 | −0.700* | 0.036 |
| APF-SCF | −0.571 | 0.139 | −0.405 | 0.279 | −0.700* | 0.036 |
| APF-LAF | 0.071* | 0.008 | 0.720* | 0.029 | 0.717* | 0.03 |
| APF-ERF | −0.31* | 0.04 | 0.851** | 0.004 | 0.733* | 0.025 |
| APF-EMF | 0.143 | 0.736 | −0.736* | 0.024 | −0.633 | 0.067 |
| EDF-SCF | 0.452 | 0.26 | 0.613 | 0.079 | 0.800** | 0.01 |
| EDF-LAF | −0.405 | 0.32 | −0.4 | 0.286 | −0.617 | 0.077 |
| EDF-ERF | 0.119 | 0.779 | −0.492 | 0.179 | −0.6 | 0.088 |
| EDF-EMF | −0.048 | 0.911 | 0.583 | 0.099 | 0.733* | 0.025 |
| SCF-LAF | −0.19 | 0.651 | −0.58 | 0.102 | −0.817** | 0.007 |
| SCF-ERF | 0.405 | 0.32 | −0.154 | 0.693 | −0.5 | 0.17 |
| SCF-EMF | −0.286 | 0.493 | 0.336 | 0.376 | 0.6 | 0.088 |
| LAF-ERF | 0.667 | 0.071 | 0.695* | 0.038 | 0.700* | 0.036 |
| LAF-EMF | −0.786* | 0.021 | −0.717* | 0.03 | −0.783* | 0.013 |
| ERF-EMF | −0.952** | 0 | −0.915** | 0.001 | −0.867** | 0.002 |
P>0.05 denotes not significant; P<=0.05 denotes significant *, P<=0.denotes very significant **.
Table 5.
Bivariate global spatial autocorrelation index of the rural landscape functions in Jiashan County.
Table 5.
Bivariate global spatial autocorrelation index of the rural landscape functions in Jiashan County.
| Rural Landscape Function Synergy Type | 2000 | 2010 | 2020 | |||
|---|---|---|---|---|---|---|
| Moran’s I | Z-Value | Moran’s I | Z-Value | Moran’s I | Z-Value | |
| PF-LF | −0.0863 | −1.0237 | 0.3171 | 2.2568 | −0.1111 | −0.6131 |
| PF-EF | 0.1299 | 1.1015 | −0.0957 | −0.3133 | 0.111 | 0.6636 |
| LF-EF | −0.2152 | −1.5692 | 0.0288 | −0.0399 | −0.3997 | −2.7636 |
| APF-EDF | −0.1333 | −0.424 | 0.1815 | 0.7392 | 0.0323 | −0.2552 |
| APF-SCF | 0.0059 | −0.3166 | 0.0097 | −0.2245 | 0.0652 | 0.0348 |
| APF-LAF | −0.0398 | −1.6717 | 0.2665 | 1.8745 | 0.2243 | 1.6523 |
| APF-ERF | 0.0104 | −0.3515 | 0.2062 | 1.5868 | 0.1796 | 1.3963 |
| APF-EMF | −0.0047 | 0.3975 | −0.141 | −1.2271 | −0.179 | −1.397 |
| EDF-SCF | −0.0227 | 0.0049 | −0.1681 | −0.5528 | −0.0477 | 0.2823 |
| EDF-LAF | −0.1692 | −1.3248 | 0.1249 | 0.4548 | −0.1605 | −1.4015 |
| EDF-ERF | −0.134 | −1.0232 | 0.159 | 0.6713 | −0.158 | −1.4562 |
| EDF-EMF | 0.156 | 1.1781 | −0.194 | −0.8462 | 0.169 | 1.4948 |
| SCF-LAF | 0.044 | 0.3829 | −0.052 | −0.6616 | −0.094 | −0.9531 |
| SCF-ERF | −0.0092 | 0.261 | −0.1226 | −1.0871 | −0.1343 | −1.206 |
| SCF-EMF | −0.0126 | −0.3724 | 0.1017 | 0.9138 | 0.1243 | 1.1151 |
| LAF-ERF | 0.178 | 1.6897 | 0.4774 | 2.7977 | 0.4597 | 2.7344 |
| LAF-EMF | −0.1937 | −1.6544 | −0.3953 | −2.4541 | −0.463 | −2.7251 |
| ERF-EMF | −0.0638 | −0.984 | −0.241 | −1.781 | −0.3482 | −2.2479 |
Table 6.
GeoDA bivariate autocorrelation legend corresponding to the functional relationship description.
Table 6.
GeoDA bivariate autocorrelation legend corresponding to the functional relationship description.
| Legend | Significance |
|---|---|
| Non-significant area (Compatible) | P > 0.05 indicates a non-significant region, that is, the function of the region is compatible. |
| Significant H-H region (Synergy) | P < 0.05 indicated a significant region, and there was synergy among the regional functions, as well as synergy in the surrounding areas, so the spatial heterogeneity was small and the relationship was stable. |
| Significant L-L region (Trade-off) | There were trade-offs between the regional functions, and the surrounding areas were also trade-offs, so the spatial heterogeneity was small and the relationship was stable. |
| Significant L-H region (Trade-off - peripheral region is synergistic) | The regional functions were trade-offs, but the surrounding areas were synergistic, so the spatial heterogeneity was large and the relationship was unstable. |
| Significant H-L region (Synergy-peripheral region as trade-off) | There was synergy among the regional functions, but the surrounding areas were trade-offs, so the spatial heterogeneity was large and the relationship was unstable. |
Note: When describing the entire study area, if most of the sub-regions were a certain type, then the relationship that dominates the time node in the study area is indicated.
Disclaimer/Publisher’s Note: The statements, opinions and data contained in all publications are solely those of the individual author(s) and contributor(s) and not of MDPI and/or the editor(s). MDPI and/or the editor(s) disclaim responsibility for any injury to people or property resulting from any ideas, methods, instructions or products referred to in the content. |
© 2024 by the authors. Licensee MDPI, Basel, Switzerland. This article is an open access article distributed under the terms and conditions of the Creative Commons Attribution (CC BY) license (http://creativecommons.org/licenses/by/4.0/).
Copyright: This open access article is published under a Creative Commons CC BY 4.0 license, which permit the free download, distribution, and reuse, provided that the author and preprint are cited in any reuse.


