Submitted:
03 January 2024
Posted:
16 January 2024
You are already at the latest version
Abstract
The Sei Dareh Bridge is a cable-stayed bridge located in West Sumatra Province, Indonesia. The bridge, which crosses the Batanghari River, has a main span of 123 meters long and 9 meters wide. Traffic load is transmitted through 24 prestressed cables to a 42.4-meter-high pylon made of concrete. The bridge deck and traffic loads are directly supported by steel box girders as main beams that are reinforced laterally with cross beams IWF 800.300.16.24 and stringers IWF 350.350.12.19. This paper discusses static and dynamic testing on the bridge which aims to assess its feasibility before it is opened to the public. Based on the test, it was concluded that a static load of 73% could not be achieved because the deflection that occurred was beyond the allowable deflection. This is exacerbated by a loud clanging sound on the ST2-X1 prestressed cable when loading to 240 tons or 58% of the targeted load. In addition, this bridge is included in the "lazy bridge" category because it takes 24 hours to return to an undeformed condition after loading. As a recommendation for this bridge, it is necessary to carry out a structural health monitoring system (SHMS) regularly on bridge slabs and cables.
Keywords:
Structural health monitoring
; bridge load testing
; dynamic testing
; operational modal analysis
; experimental modal analysis
1. Introduction
A cable-stayed bridge is one type of long-span bridge where prestressed cable elements act as the main element in bearing the load of the girder and floor deck. The use of this system will certainly reduce the weight of the bridge structure significantly. This type of bridge began to be widely used after the construction of the Stromsung Bridge in Sweden in 1955 with a main span of 182.6 meters [1]. In Indonesia, it began to be widely used after the Barelang Bridge at Batam Island, which began construction in 1992, was completed in 1998, and it has a main span of 245 meters. Historical records show that the top three longest cable-stayed bridges are Russky Bridge (main span of 1104 m), Sutong Bridge (main span of 1088 m), and Stonecutters Bridge (main span of 1018 m) [2]. The longer span of the bridge and the more varied bridge geometry, the more complicated bridge behavior, thus requiring a special study. [3]
Many studies discuss cable-stayed bridges. However, previous research related to loading test of cable-stayed bridges will only be mentioned here. Therefore, load test in the field can be a method to determine bridge behavior. The test can be carried out either statically or dynamically according to the required data. Dynamic load tests are carried out to measure e.g., the acceleration and natural frequency of the structure, while static load tests are performed to measure bridge displacement during loading. The measurement of bridge displacement must be performed by accurate instrument. Salamak et al., [4] compared the traditional and modern techniques to measure the displacement. The experiment showed that in the case of large bridges, like tested cable-stayed structures, the best method is non-contact measurement like interferometric radar which is the least sensitive to distance from the target.
In the early 1990s, a full-scale ambient vibration test was carried out to calculate the dynamic response of the Quincy Bayview cable-stayed bridge in Illinois [5]. From the test, it is obtained 25 modal frequencies and associated mode shapes. The results of the ambient vibration survey were compared to modal frequencies and mode shapes computed using a three-dimensional finite element analysis of the bridge. A dynamic test research also was carried out on the Alamillo cable-stayed bridge [6]. The objective of the test is to validate the mathematical modeling and the wind tunnel models used in the dynamic analysis of the bridge in front of traffic and wind forces. The test results are natural frequencies, damping ratio, and the real forces in the cables. Similar research was carried out on the Garigliano cable-stayed bridge [7], the Qingzhou cable-stayed bridge [8], the Vasco da Gama cable-stayed bridge (Italy) [9], and the Nissibi cable-stayed Bridge (Turkey) [3]. Meanwhile, Fang, et al [10] only carried out a static load test of the Kao-Ping-Hsi (China) bridge before it was opened to traffic. There were 40 loading schemes carried out, including the effect of bending and torsion and the effect of temperature changes on the main girder deflection. Load tests of a railway cable-stayed bridge with a main span of 250 m that connects the riversides separating the Caijia Jialing River were discussed in [11]. The authors discussed a static loading test, which involves measuring the initial state of the completed structure, and an appraisal loading test to determine its design loading capacity. The results of the research indicate that the strength and stiffness indicators of each control section of the bridge meet the design requirements.
Several studies have compared the dynamic response characteristics of the numerical modeling and the result of field testing. This comparison was carried out to verify the numerical model because some outputs cannot be obtained from field testing due to the high cost and method considerations. Therefore, the numerical model is performed to simulate things that cannot be done in the field. The method to verify the numerical model can be done by the Bayesian method as discussed in [12], which carried out dynamic testing of the Sutong Bridge (China). The Bayesian method is a logic of probability that provides a rigorous framework for identifying and calculating model uncertainty. Another method to verify is sensitivity-based parameter updating [13], [14], and [15]. Model updating is the initial numerical model calibration process based on the results of the vibration test and static loading. The effective and most popular local methods for model updating are generally based on sensitivity analysis.
A series of dynamic tests sometimes were carried out for Structural Health Monitoring System (SHMS) data. SHMS is regarded as an in situ field experimental method to conceive the performance and characteristics of a real bridge in the field under ambient conditions and real loadings to further assure the safety, serviceability, durability, and sustainability of bridges [16]. Ge et al., [17] have conducted monitoring of Sutong Bridge in normal conditions based on wind field data, weather data, and vehicle data to explore types of cable vibration. With a similar bridge, [18] discussed a modal identification of the bridge during Typhoon Haikui using the wavelet transform method. Even, thermal response can be used for monitoring data as discussed by [19] to Shanghai Yangtze River bridge with 730 meters long, with a steel box girder and twin tower.
In addition to SHMS, the static and dynamic load test was performed before the bridge was opened for traffic because this is related to road function-worthy requirements as stated in the Minister of Public Works Regulation concerning Procedures and Requirements for Road Function-Worthy. Santoso [20] once assessed the Kalikuto Bridge's condition with a curved steel arc structure for eligibility requirements with a vibration test. Likewise, it has been done by Setiati et al [21] on the Sinapeul Bridge with an integral bridge. This paper will discuss the static and dynamic load test on the Sei Dareh cable-stayed bridge in West Sumatra Province carried out in 2019, then compare it with the numerical modeling results of the bridge to verify the accuracy of the model.
2. The Sei Dareh Cable Stayed Bridge
2.1. Tested Bridge
The Sei Dareh Cable Stayed Bridge is a new bridge built next to the existing bridge which is intended to unravel the congestion of road traffic. The location of the bridge is in West Sumatera Province, Indonesia. Figure 1 shows a map of the bridge location and an aerial photo. Figure 2 (a) shows an aerial photo of the Sei Dareh Bridge, while Figure 2 (b) shows the structural deck of the bridge. The bridge that connects two riversides of Batang Hari River is 123 meters long and 9 meters wide, and the pylon height is 42,4 meters as shown in Figure 3 and cross section in Figure 4 (a). The main girder on the deck structure of the bridge uses a steel box section, while the transverse and longitudinal girder uses IWF steel sections with a minimum yield and breaking stress of 490 MPa and 610 MPa, respectively on cross section of the deck structure as shown in Figure 4 (b). The grade of the concrete used in the pylon is 30 MPa. In addition, the prestressed cables have a modulus of elasticity of 195000 MPa, and A416-270 material is used (normal relaxation strand). Detail of material property and force for each cable is attached respectively in Table 1 and Table 2. Then, the bridge was performed by static and dynamic tests which have different objectives and methods that will be explained in the next section.
In general, the load test on this bridge begins with a visual inspection which aims to ensure that the structural components are properly installed and ready to be loaded, such as bolts between joints, stay cable, etc. Then the static and dynamic load testing was carried out and ended with a final visual inspection. Based on the visual inspection that was carried out before the test, it was found that the general conditions of the structural elements were in fair condition with unfilled concrete about 10 mm on the pylon as shown in Figure 5. However, this had been repaired before the test.
2.2. Finite Element Model of Bridge
Sei Dareh Bridge needs to be modeled in 3D with a finite element model. This modeling is intended to compare the theoretical and real bridge behavior test results. In addition, this 3D modeling is also the basis for an inspector to estimate the placement of the measuring instrument during field testing because usually, the inspector will place the instrument on the bridge elements that experience the largest internal forces. The model was carried out in the “Midas Civil-2011 v.2.1” program as shown in Figure 6.
Based on Figure 6, the scope of the 3D model is just on the upper structure and pile cap while the bored pile is not modeled. The upper structure components consist of the deck structure, pylons, cables, and slabs. The deck structure consists of steel box elements, cross girders, and stringers that are modeled in the software as “Beam” elements so that these elements can experience bending, shear, and axial forces, likewise on the pylon model. Meanwhile, the cable component is modeled as a “Tension only” element so that the element can only encounter axial tension and the initial tension force of the cable can be adjusted. The slabs were modeled as “thin-shell” without auto-meshing. Therefore, the model has 2773 nodes, 4290 beam elements, 24 tension-only elements, and 1800 shell elements. The boundary condition of the model consists of support (nodes 1, 2, 3, and 4) and link (nodes 7 and 8). Each node of support and link has its degree of freedom as shown in Table 3. The number 1 indicates that the degree of freedom in this direction is restrained, while the number 0 is released.
2.3. Static Load Test
Static testing was performed to measure the deflection of the structure of the considered bridge. Indonesian Code SNI: T-03-2005 regarding the design of steel structures for bridges requires that the maximum allowable deflection of bridges is L / 800 span. Bridge static testing refers to SNI: 1725-2016 regarding bridge loading. The code discusses the load for lane "D" which has a uniform distributed load (UDL) depending on the total bridge length (L), which is as follows:
If L ≤ 30 m: q = 9.0 kN/m2
If L > 30 m: q = 9.0 (0.5 + 15/L) kN/m2
The following was the calculation of the static load that applied to the bridge:
- The length of span L = 2 (61.5 m) = 123 meters and the vehicle floor width is 7.0 meters which results in a vehicle floor area of (61.5 m) (7 m) = 430.5 m2.
- sup>∙ Since L > 30 meters then the UDL, q = 9.0 (0.5 + 15 / L) = 6.70 kN/m2 ≈ 0,683 ton/m2
- Loading test should not be less than 70% of UDL, 70% (6.7 kN/m2) = 4.69 kN/m2 ≈ 0.478 ton/m2.
- Sidewalk live load is 5 kN/m2 (or 0.5 ton/m2), and the width of the sidewalk is 2 meters on the left and right, then the total width of the sidewalk is 4 meters,
- The load test on the sidewalk is 4 m (5 kN/m2) = 20 kN/m x 70% = 14 kN/m ≈ 1.4 t/m and the total pedestrian load test on the bridge is 14 kN/m x 61.5 m = 861 kN ≈ 86.1 tons
- Total UDL and pedestrian load test, (430.5 m2) x (4.69 kN/m2) = 2019 kN + 861 kN = 2880 kN ≈ 294 tons.
- Using a truck with a load of 294 kN or 30 tons including the truck's weight, which means that the number of trucks in one span is (294 tons/ 30 tons) ≈ 10 trucks.
- This truckload is 73% of the UDL design load. The total number of trucks needed for span P1-P2-P3 is 20 trucks.
Static testing was carried out by loading the bridge using trucks loaded with aggregates. The dimensions and capacity of the trucks used during the test are shown in Figure 7. There were five static loading schemes carried out on spans P1-P2 and P2-P3 alternately with loading stages of 60, 120, 180, 240, and 300 tons. In addition, five other loading schemes were carried out simultaneously on both spans, namely 120, 240, 360, 480, and 600 tons. The loading scheme for the P1-P2 span in the static test is shown in Figure 8, the same scheme is also applied to the P2-P3 spans, and for other schemes, the simultaneous loading was carried out on the P1-P2 and P2-P3 spans.
The loading was carried out in stages for both loading and unloading schemes and measuring deflection on the bridge beam using waterpass (WP) and total station (TS) measuring devices. The use of the two measuring instruments simultaneously aims to mutually validate the two results. The placement of the measuring instrument during the test is shown in Figure 9. The execution of the load test is shown in Figure 10.
2.4. Dynamic Load Test
The dynamic test was carried out by giving a sudden impact through a truck moving forward from a jumper with a certain dimension. At the same time, the acceleration of the structure was measured using accelerometers placed at several locations. The placement of accelerometers was based on the maximum response value obtained from the 3D model as shown in Table 4, Figure 11, and Figure 12.
3. Results
3.1. Result of Static Load Test
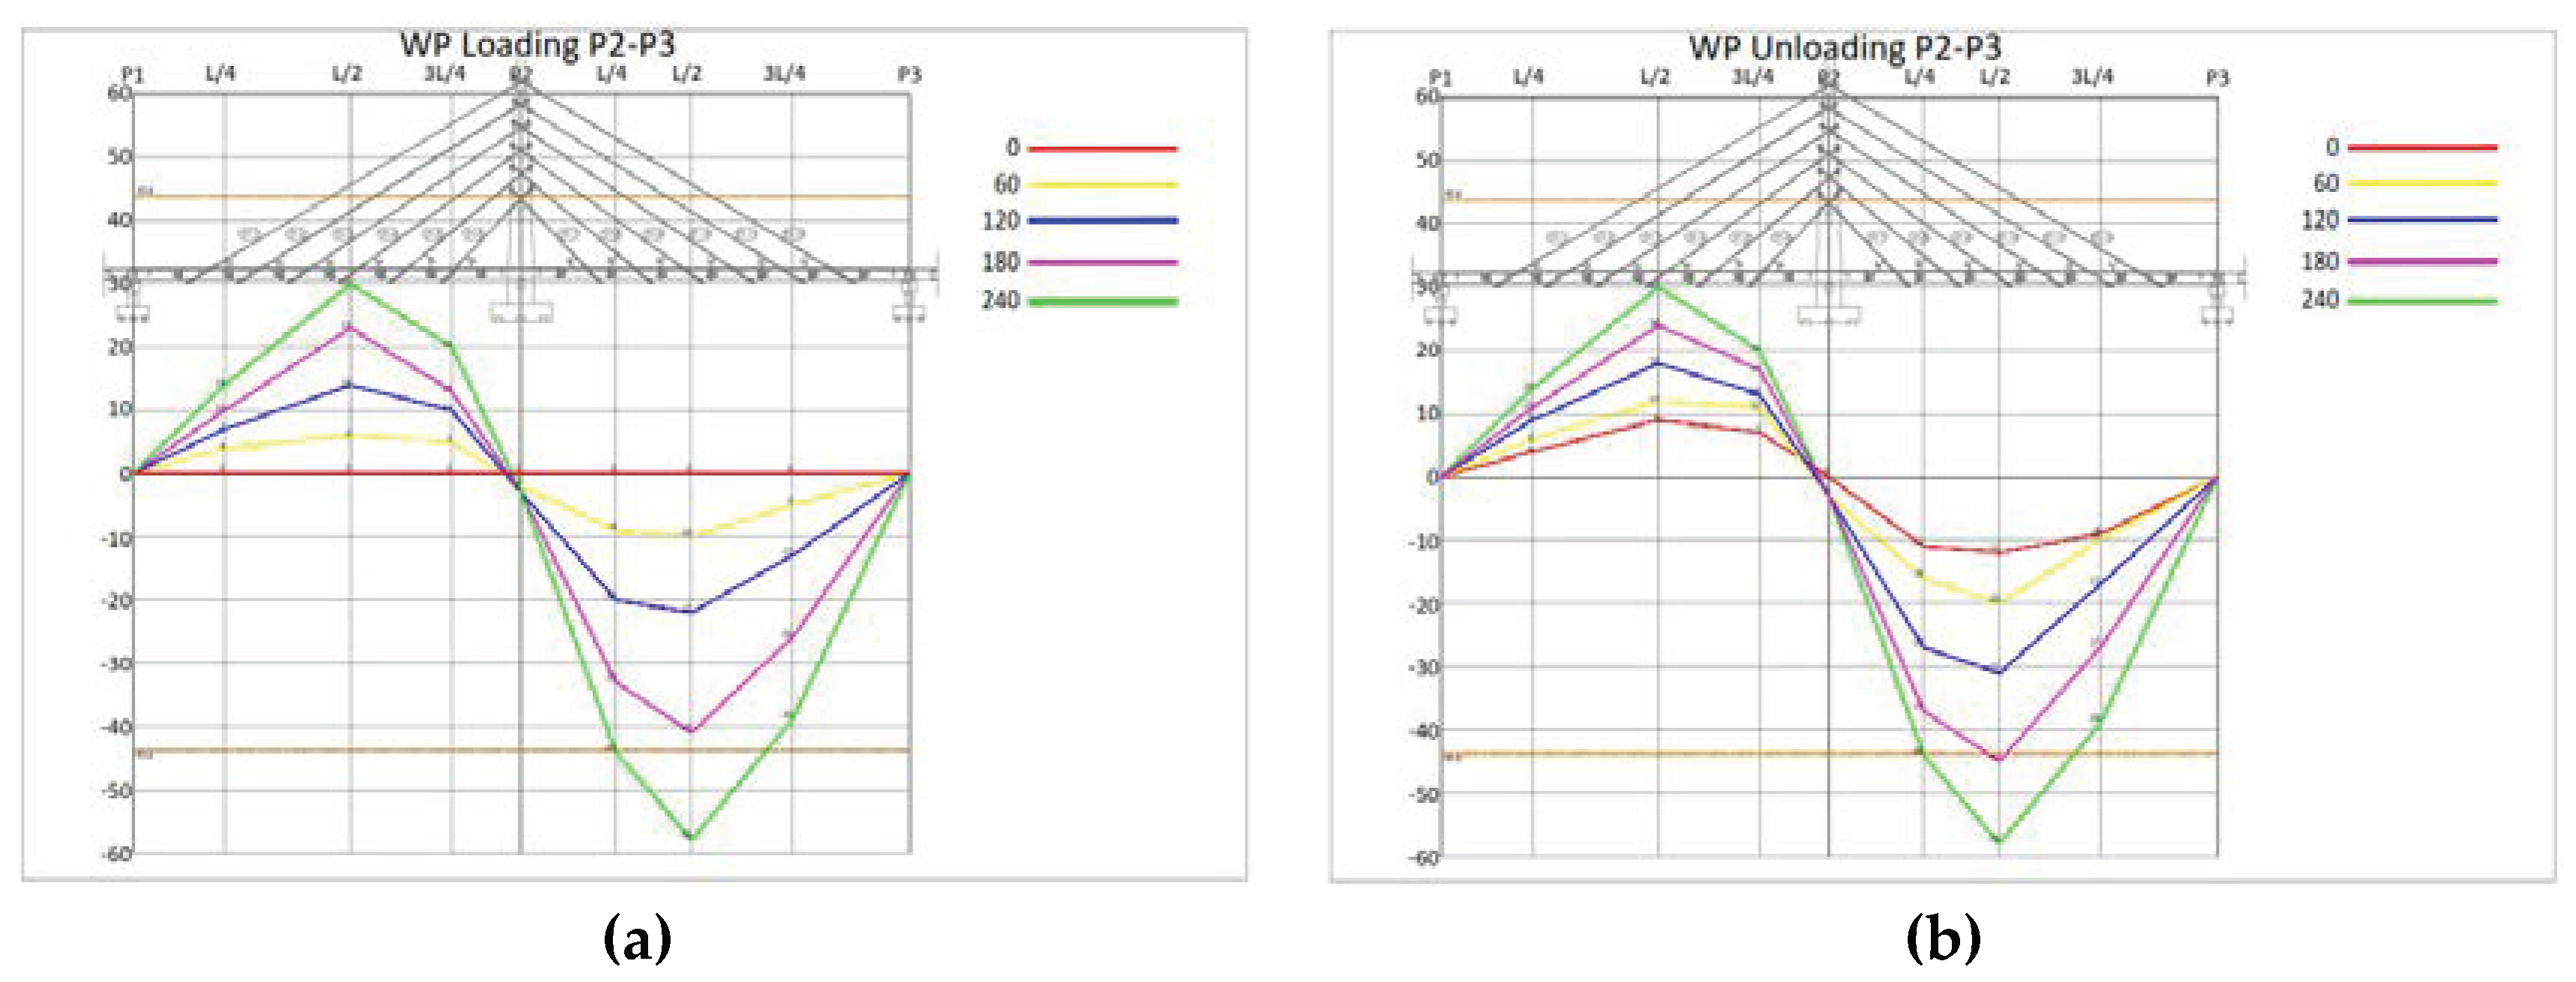
Static loading and unloading at spans P1-P2 and P2-P3 measured the beam deflection by using waterpass and a total station device. Figure 13 to Figure 16 show the deflection that occurs in the P1-P2 and P2-P3 spans due to truck loading on the P1-P2 span. The deflection that occurs in the fifth stage of loading with a load of 240 tons is 55 mm which exceeds the allowable deflection of 44.90 mm. At the same time, there was a loud clanging sound from the ST2-X1 cable and a large vibration of the bridge. This caused the Indonesian Bridge and Road Tunnel Safety Commission to decide not to continue loading up to 300 tons. In addition, the amount of deflection at zero loading and unloading has a different value, meaning that the floor of the bridge did not return to its original position after the unloading stage where all loads had been removed. Based on field observations, the beam returned to its original state after 24 hours.
Figure 13.
Graph of deflection measurement with total station when; a) loading and b) unloading on P1-P2 span.
Figure 13.
Graph of deflection measurement with total station when; a) loading and b) unloading on P1-P2 span.
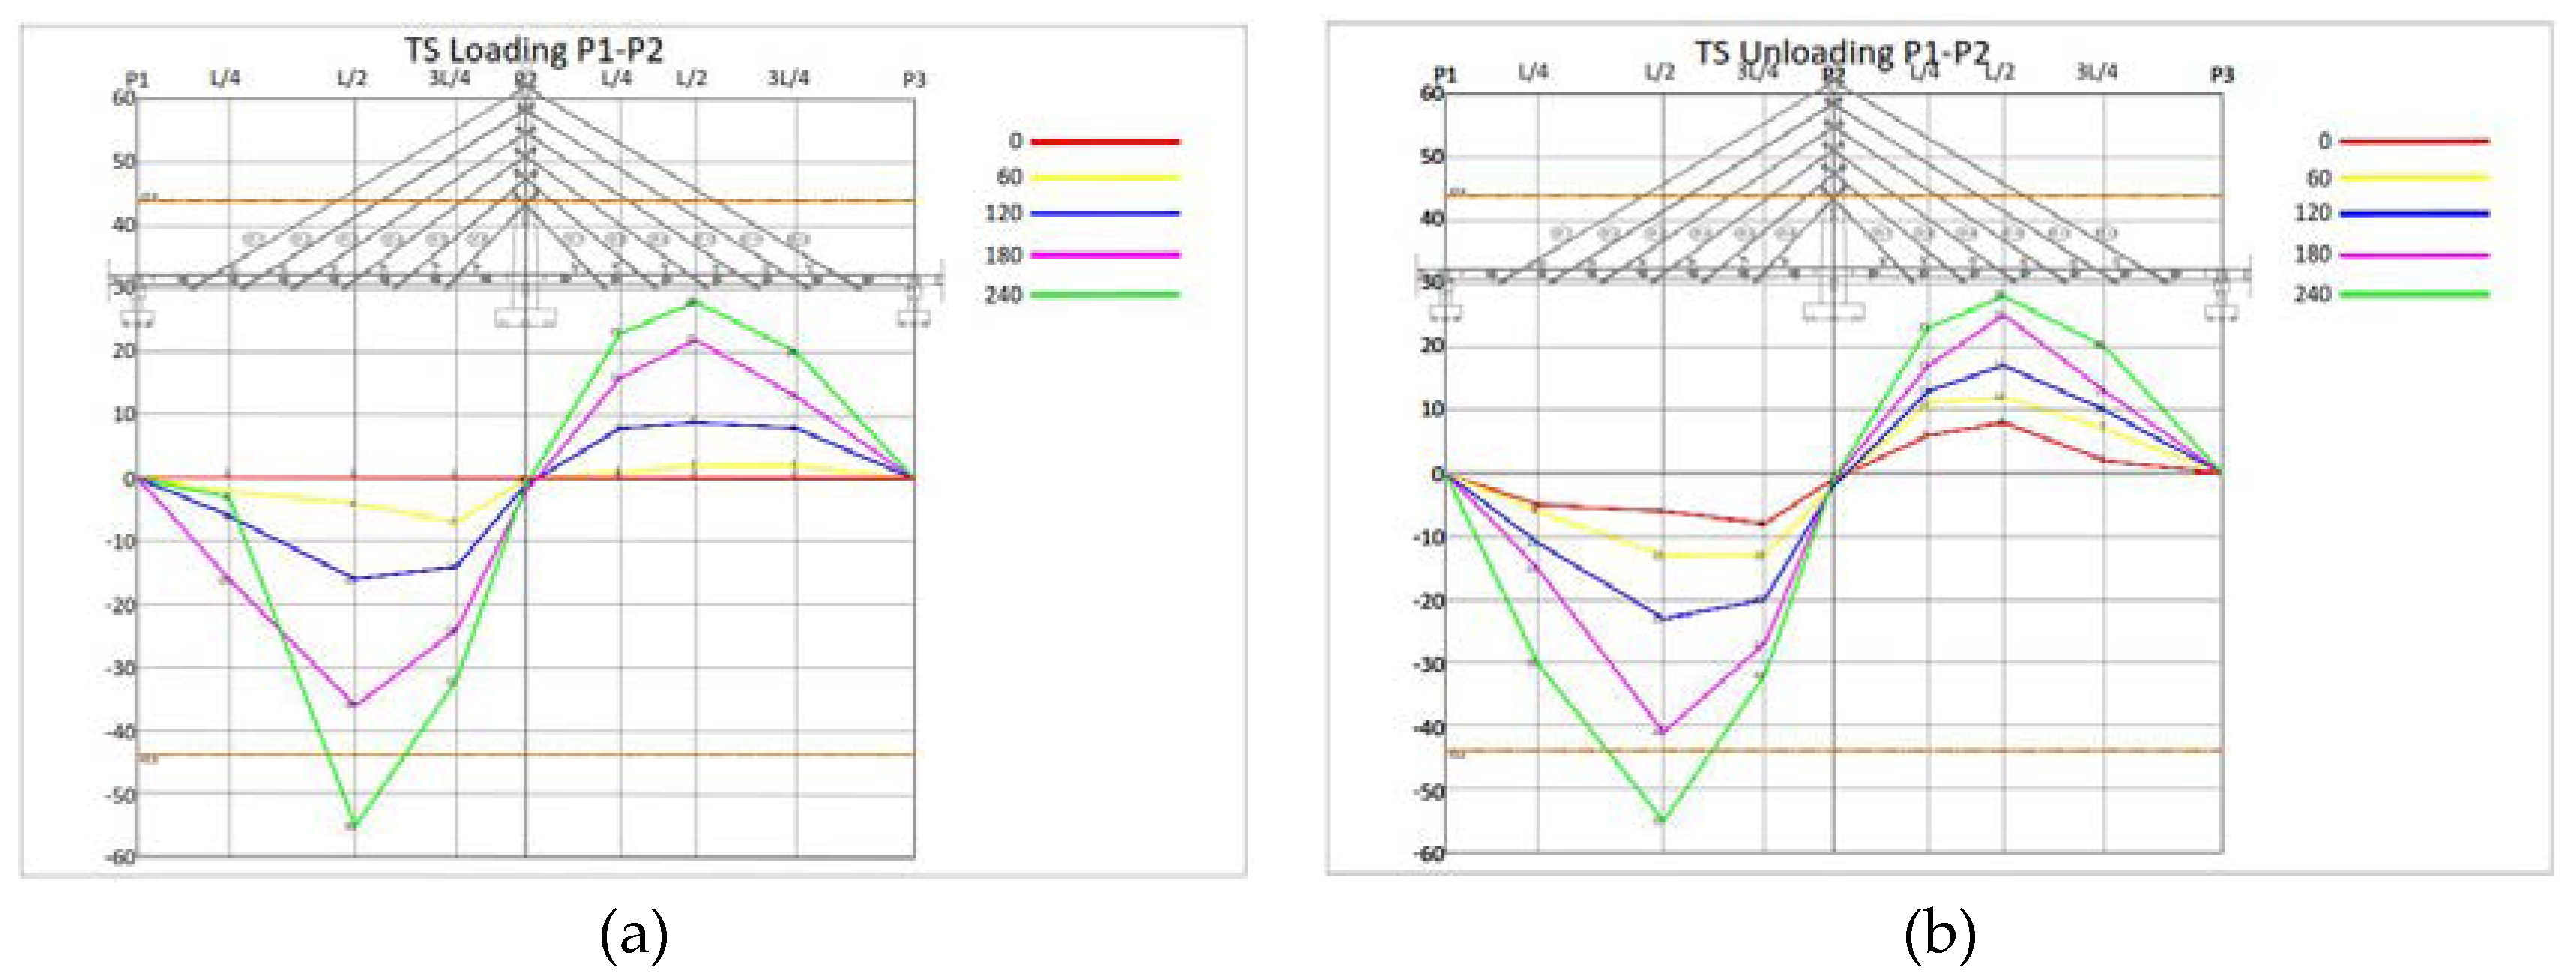
Figure 14.
Graph of deflection measurement with waterpass when; a) loading and b) unloading on P1-P2 span.
Figure 14.
Graph of deflection measurement with waterpass when; a) loading and b) unloading on P1-P2 span.
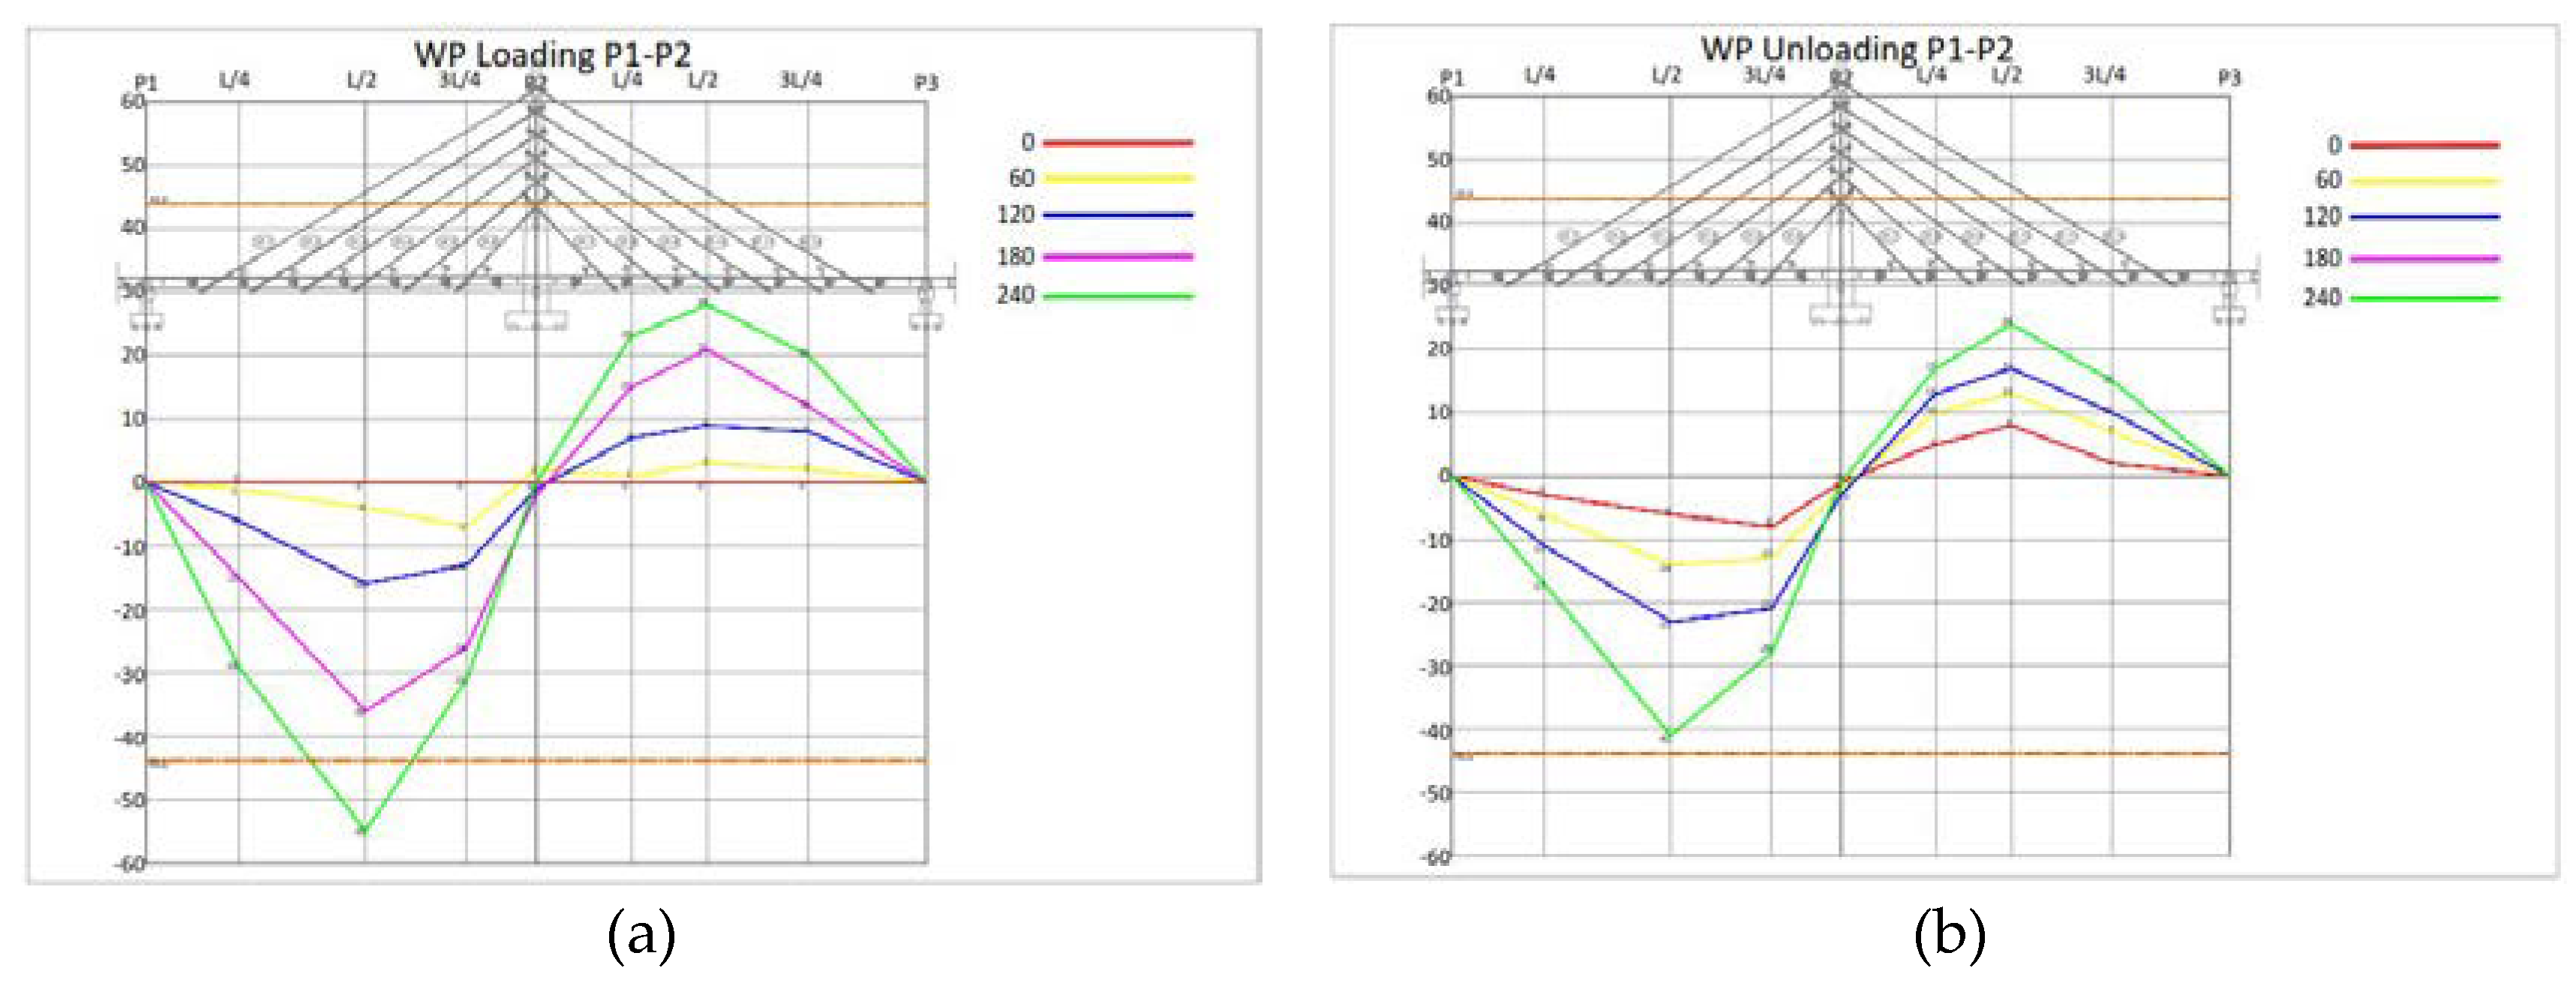
Figure 15.
Graph of deflection measurement with total station when; a) loading and b) unloading on P2-P3 span.
Figure 15.
Graph of deflection measurement with total station when; a) loading and b) unloading on P2-P3 span.
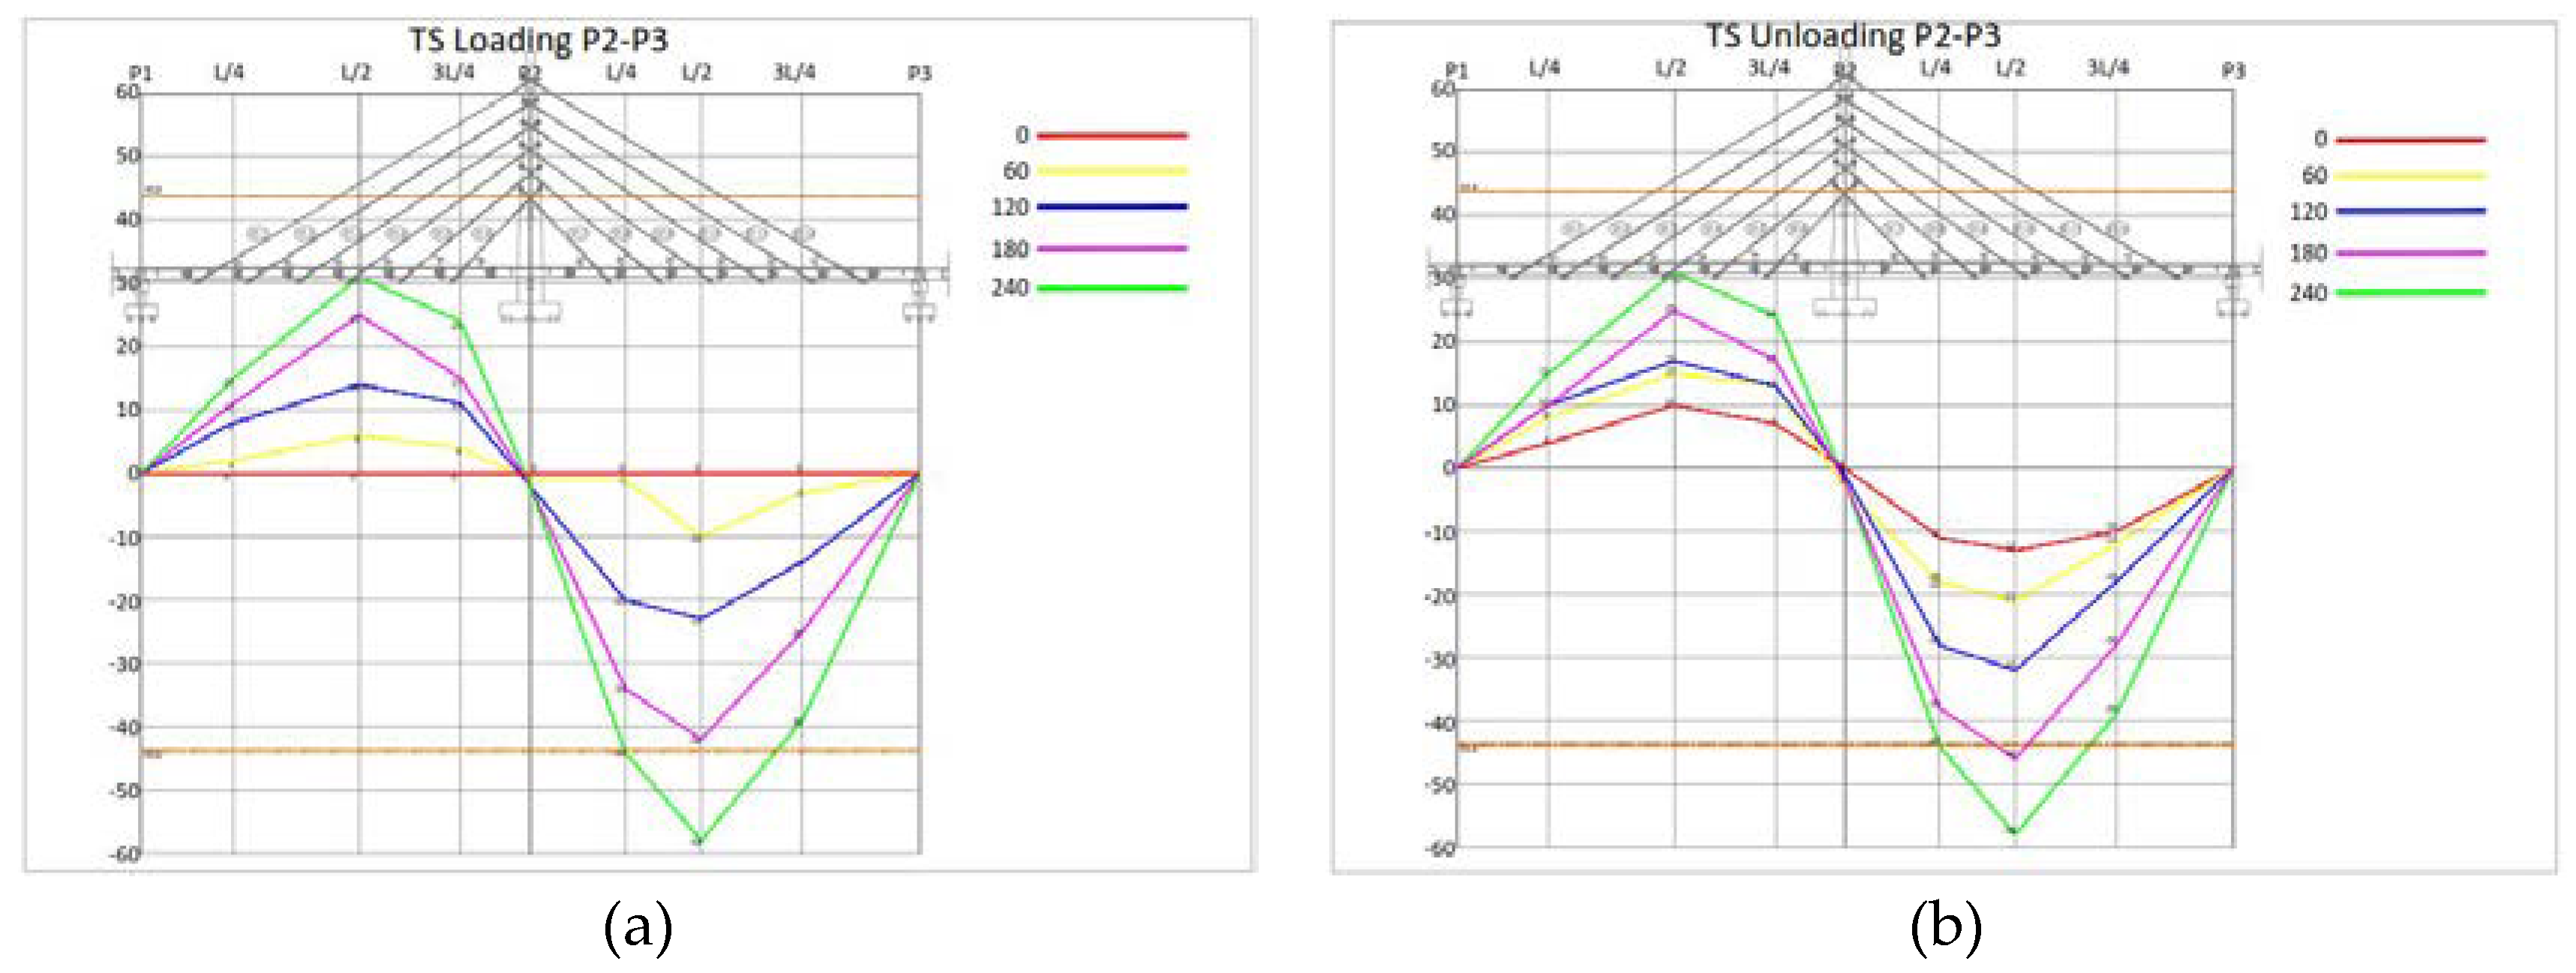
Figure 16.
Graph of deflection measurement with waterpass when; a) loading and b) unloading on P2-P3 span.
Figure 16.
Graph of deflection measurement with waterpass when; a) loading and b) unloading on P2-P3 span.
Generally, there were slight differences in the results of deflection measurements when comparing the waterpass, total station, and 3D FEM, for example when the bridge was loaded with trucks at P1-P2 spans and measured at ¼L, ½L, ¾ L, and L as shown in Figure 17. However, the significant differences are shown in Figure 17 (a). The measurement result with 3D FEM was larger than the waterpass, and the total station was approximately 10mm. It could be caused by differences in the modeling of support boundary in 3D FEM so it affected the behavior of the structure. In addition, this difference can also occur due to a lack of accuracy in determining the 1/4 L span in 3D FEM, because each frame element contained in the model consists of two points with a certain length. Even so, the 3D FEM can still be considered reliable, as all three methods in Figure 17 (b), (c), and (d) produced highly similar results. Meanwhile, the difference in results between the waterpass and the total station is due to the different levels of accuracy. The measurements obtained by the total station are more conservative than the waterpass.
3.2. Result of Dynamic Load Test
Among the results obtained from dynamic testing is a graph of the acceleration versus time (time series) which is converted into the frequency domain with a fast Fourier transform (FFT) as shown in Figure 18. Based on one of these measurement results, it is known that the natural frequency of the structure is 1.18 Hz. Furthermore, the dynamic test results are compared with the theoretical frequency of the 3D modeling results as shown in Figure 19. It can be concluded that the structural model created on Midas Civil aligns with the test results obtained in the field. The natural frequency value in the first mode is determined to be 1.19 Hz.
4. Discussion
4.1. The Cause of a Loud Clanging Sound
As in the previous description, it is known that during the loading of the 240-ton truck, a loud clanging sound was heard. Based on field observations, the sound comes from the stay cable. This sound is caused by an imperfect pulling of the strand during the construction period which causes the cable to stay in the tendon to fold. When the bridge is loaded, the strand is stretched so that what was originally folded straight back. The following is an illustration of this phenomenon as in Figure 20. It should be noted that the condition of the cable is already wrapped, which makes it impossible to measure the extending cable or even the restressing as shown in Figure 21.
4.2. Cable Stay Takes a Long Time to Return to an Undeformed State
Based on the phenomenon that occurs during load testing in the field, it is known that steel beams that deform when loaded require almost 24 hours to return to undeformed conditions. This is possible because of the effect of time dependent shortening on the cable. The creep condition is less likely to occur considering the ambient temperature when testing at normal temperatures [22].
5. Conclusions
The following is the conclusion from the description in the previous section:
- The static test was halted before the planned loads due to excessive deflection. Specifically, the test was stopped at 240 tons instead of 300 tons and 480 tons instead of 600 tons.
- b. Several dynamic tests consistently report a natural frequency of f = 1.18 Hz for the first peak and f = 1.88 Hz for the second peak.
- c. The dynamic tests carried out on the P1-P2 and P2-P3 spans have shown that the two symmetrical spans have the same frequency. The numerical analysis results indicate a natural frequency of f = 1.19 Hz, while the test results show a natural frequency of f = 1.18 Hz. This demonstrates that the Midas structural model aligns with the field measurement results.
- d. There are two options available for opening the bridge to the public: (1) reduce traffic loads up to 70% of the design load by using traffic signs, or (2) carry out continuous monitoring to measure deformation and stress at critical points. The first option was chosen, and as a result, the bridge is currently in good condition.
Author Contributions
This work was led by Sumargo, he analyzed and load-tested the cable-stayed bridge in the field. Afdhal wrote the manuscript for the journal.
Acknowledgments
This work is supported by the Tujuh Pilar Hijau consultant company and organized by the Ministry of Housing and Public Work.
Conflicts of Interest
The authors declare no conflict of interest.
References
- Chen, W.F. & Duan, L. B. Bridge Engineering Handbook, 1st ed.; CRC Press, Washington, 1999; pp. 89-80.
- Wikipedia. Available online: https://en.wikipedia.org/wiki/List_of_longest_cable-stayed_bridge_spans (accessed on 18 May 2021).
- Bayraktar, A., Türker, T., Tadla, J., Kurşun, A., & Erdiş, A. Static and dynamic field load testing of the long span Nissibi cable-stayed bridge. Soil Dynamics and Earthquake Engineering, 2017, 94, 136-157. [CrossRef]
- Salamak, M., Owerko, T., & Lazinski, P. Displacement of cable stayed bridge measured with the use of traditional and modern tecniques. Architecture Civil Engineering Environment, 2016, 4, 89-97. [CrossRef]
- Wilson, J. & Liu, T. Ambient vibration measurement on a cable-stayed bridge. Earthquake Engineering and Structural Dynamics, 1991, 20, 723-747. [CrossRef]
- Casas, J. Full scale dynamic testing of the Alamillo cable-stayed bridge in Sevilla (Spain). Earthquake Engineering and Structural Dynamic, 1995, 24, 35-51. [CrossRef]
- Clemente, P., Marulo, F., Lecce, L., & Bifulco, A. Experimental modal analysis of the Garigliano cable-stayed bridge. Soil Dynamic and Earthquake Engineering, 1998, 485-493. [CrossRef]
- Ren, W. X., Lin, Y. Q, & Peng, X. L. Field load test and numerical analysis of Qingzhou cable-stayed bridge. Journal of Bridge Engineering, 2007, 261-270. [CrossRef]
- Cunha, A., Caetano, E., & Delgado, R. Dynamic tests on large cable-stayed bridge. Journal of Bridge Engineering, 2001, 6(1), 54-62. [CrossRef]
- Fang, I. K., Chen, C. R., & Chang, I. S. Field static load test on Kao-Ping-Hsi cable-stayed bridge. Journal of Bridge Engineering, 2004, 9(6), 531-540. [CrossRef]
- Jian, X.Y., Lei, Z., & Gang, L.X. Static loading test and assessment of cable-stayed bridge which specialized for rail transit. Archives of Current Research International, 2015, 2(2), 59-65. [CrossRef]
- Ni, Y. C., Zhang, Q. W., & Liu, J. F. Dynamic property evaluation of a long-span cable-stayed bridge (Sutong bridge) by a Bayesian method. International Journal of Structural Stability and Dynamics, 2019, 19(01), 1940010. [CrossRef]
- Xiao, X., Xu, Y.L., & Zhu, Q. Multiscale modeling and model updating of a cable-stayed bridge. II : Model updating using modal frequencies and influence lines. Journal of Bridge Engineering, 2015. [CrossRef]
- Ding, Y., & Li, A. Finite element model updating for the Runyang cable-stayed bridge tower using ambient vibration test results. Advance in Structural Engineering, 2008, 11, 323-335. [CrossRef]
- Brownjohn, J. M., & Xia, P. Q. Dynamic assessment of curved cable-stayed bridge by model updating. Journal of structural engineering, 2000, 126(2), 252-260. [CrossRef]
- Li, H., & Ou, J. The state of the art in structural health monitoring of cable-stayed bridge. Journal of Civil Structural Health Monitoring, 2015, 6, 43-67. [CrossRef]
- Ge, C., & Chen, A. Vibration characteristics identification of ultra-long cables of a cable stayed bridge in normal operation based on half-year monitoring data, Structure and Infrastructure Engineering, 2019, 15(12), 1567-1582. [CrossRef]
- Wang, H., Mao, J.X., & Li, A.Q. Modal identification of Sutong Cable-Stayed Bridge during Typhoon Haikui using wavelet transform method, Journal of Performance of Constructed Facilities, 2016, 30(6). [CrossRef]
- Zhou, Y., & Sun, L. A comprehensive study of the thermal response of a long-span cable-stayed bridge : from monitoring phenomena to underlying mechanism, Mechanical Systems and Signal Processing, 2019, 124, 330-348. [CrossRef]
- Santoso, H. T. Penilaian Kondisi Jembatan Untuk Persyaratan Laik Fungsi Dengan Uji Getar. Portal: Jurnal Teknik Sipil, 2020, 12(1), 1-8. [CrossRef]
- Setiati, N. R., & Surviyanto, A. Analisis Uji Beban Kendaraan Terhadap Jembatan Integral Penuh (Loading Test Analysis of Full Integral Bridge). Jurnal Teknik Sipil, 2013, 190-204.
- Kim, S. H., Park, S. Y., & Jeon, S. J. Long-Term Characteristics of Prestressing Force in Post-Tensioned Structures Measured Using Smart Strands. Applied Sciences, 2020 10(12), 4084. [CrossRef]
Figure 1.
(a) Location map of Sei Dareh Cable-Stayed Bridge; (b) Aerial photo of the new bridge and existing bridge of Sei Dareh .
Figure 1.
(a) Location map of Sei Dareh Cable-Stayed Bridge; (b) Aerial photo of the new bridge and existing bridge of Sei Dareh .
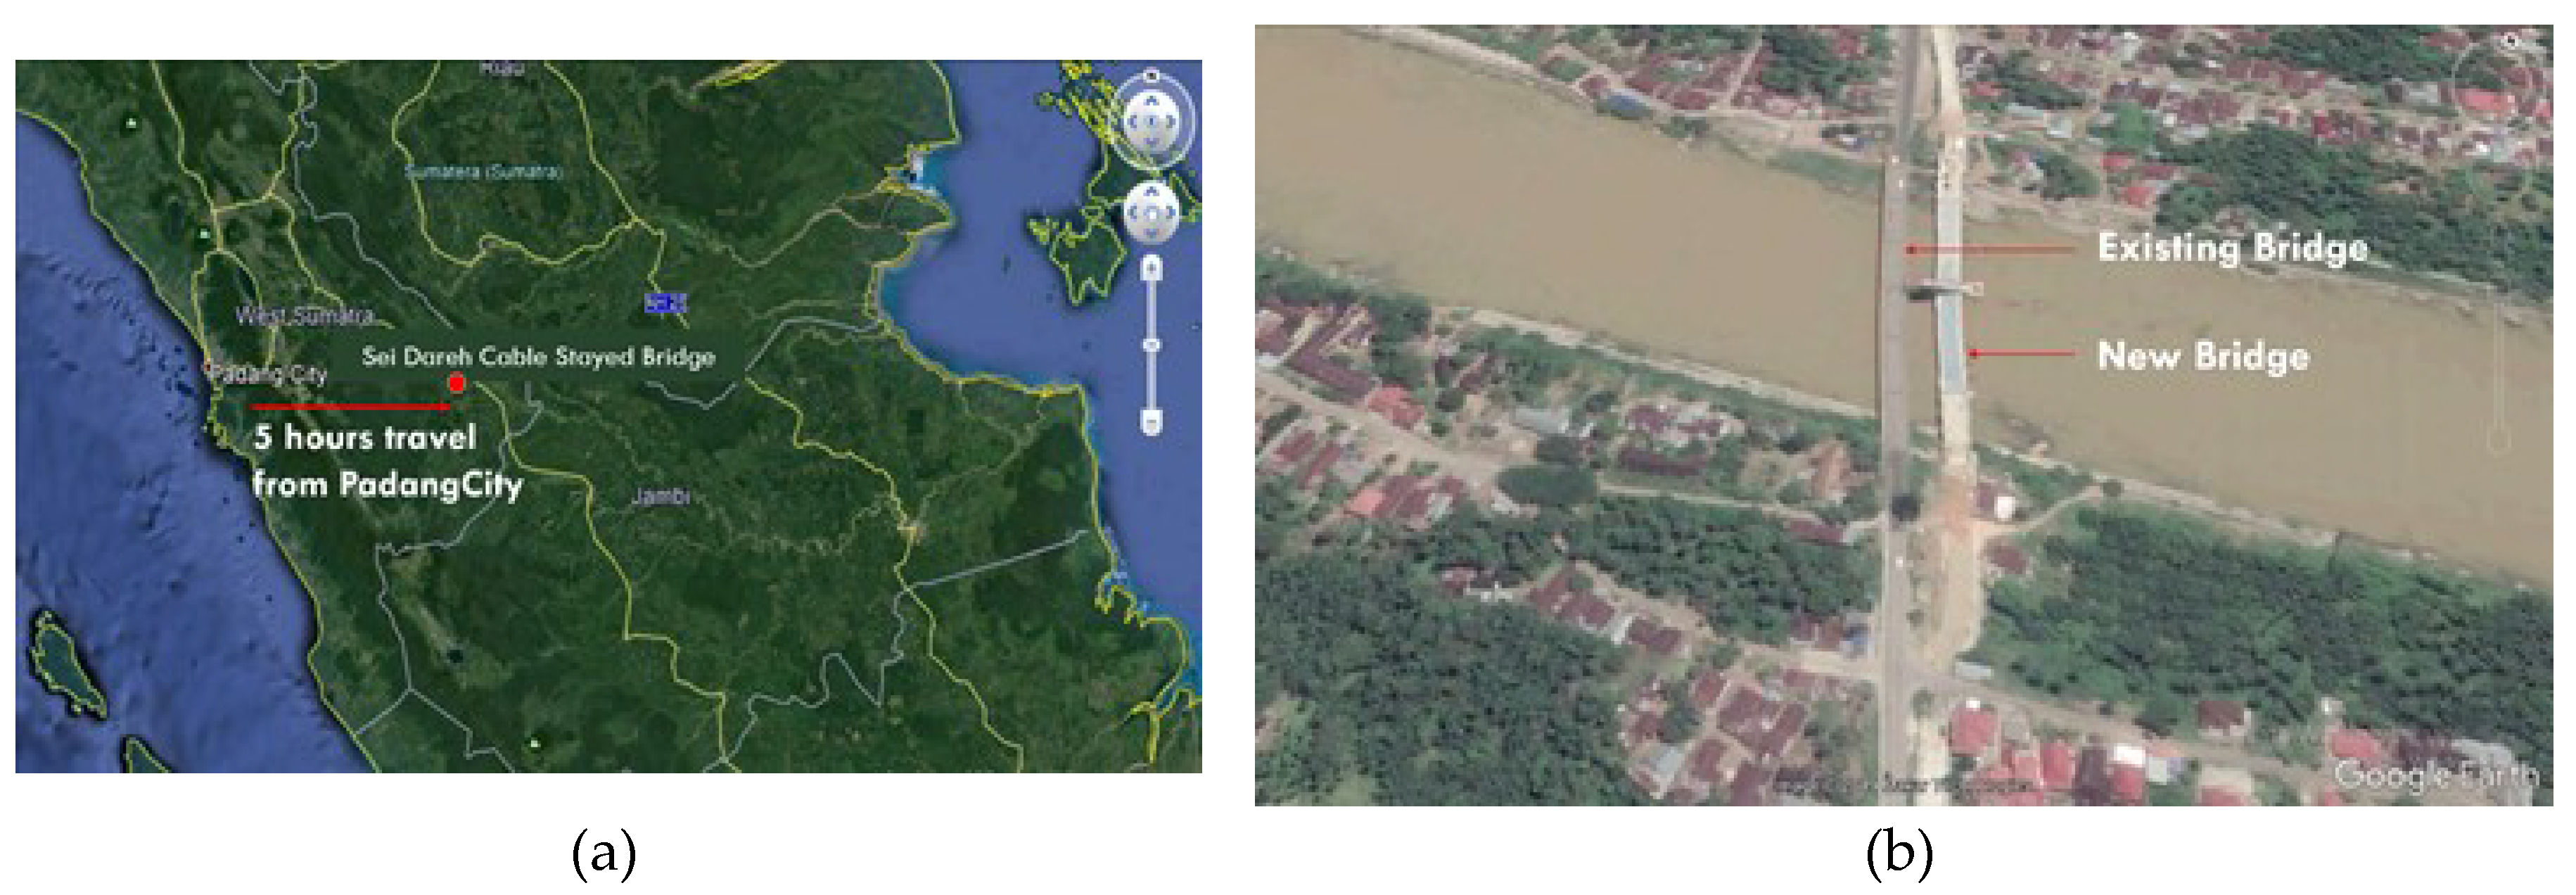
Figure 2.
(a) Aerial photo of Sei Dareh Cable-Stayed Bridge; (b) Structural Deck of the Bridge.
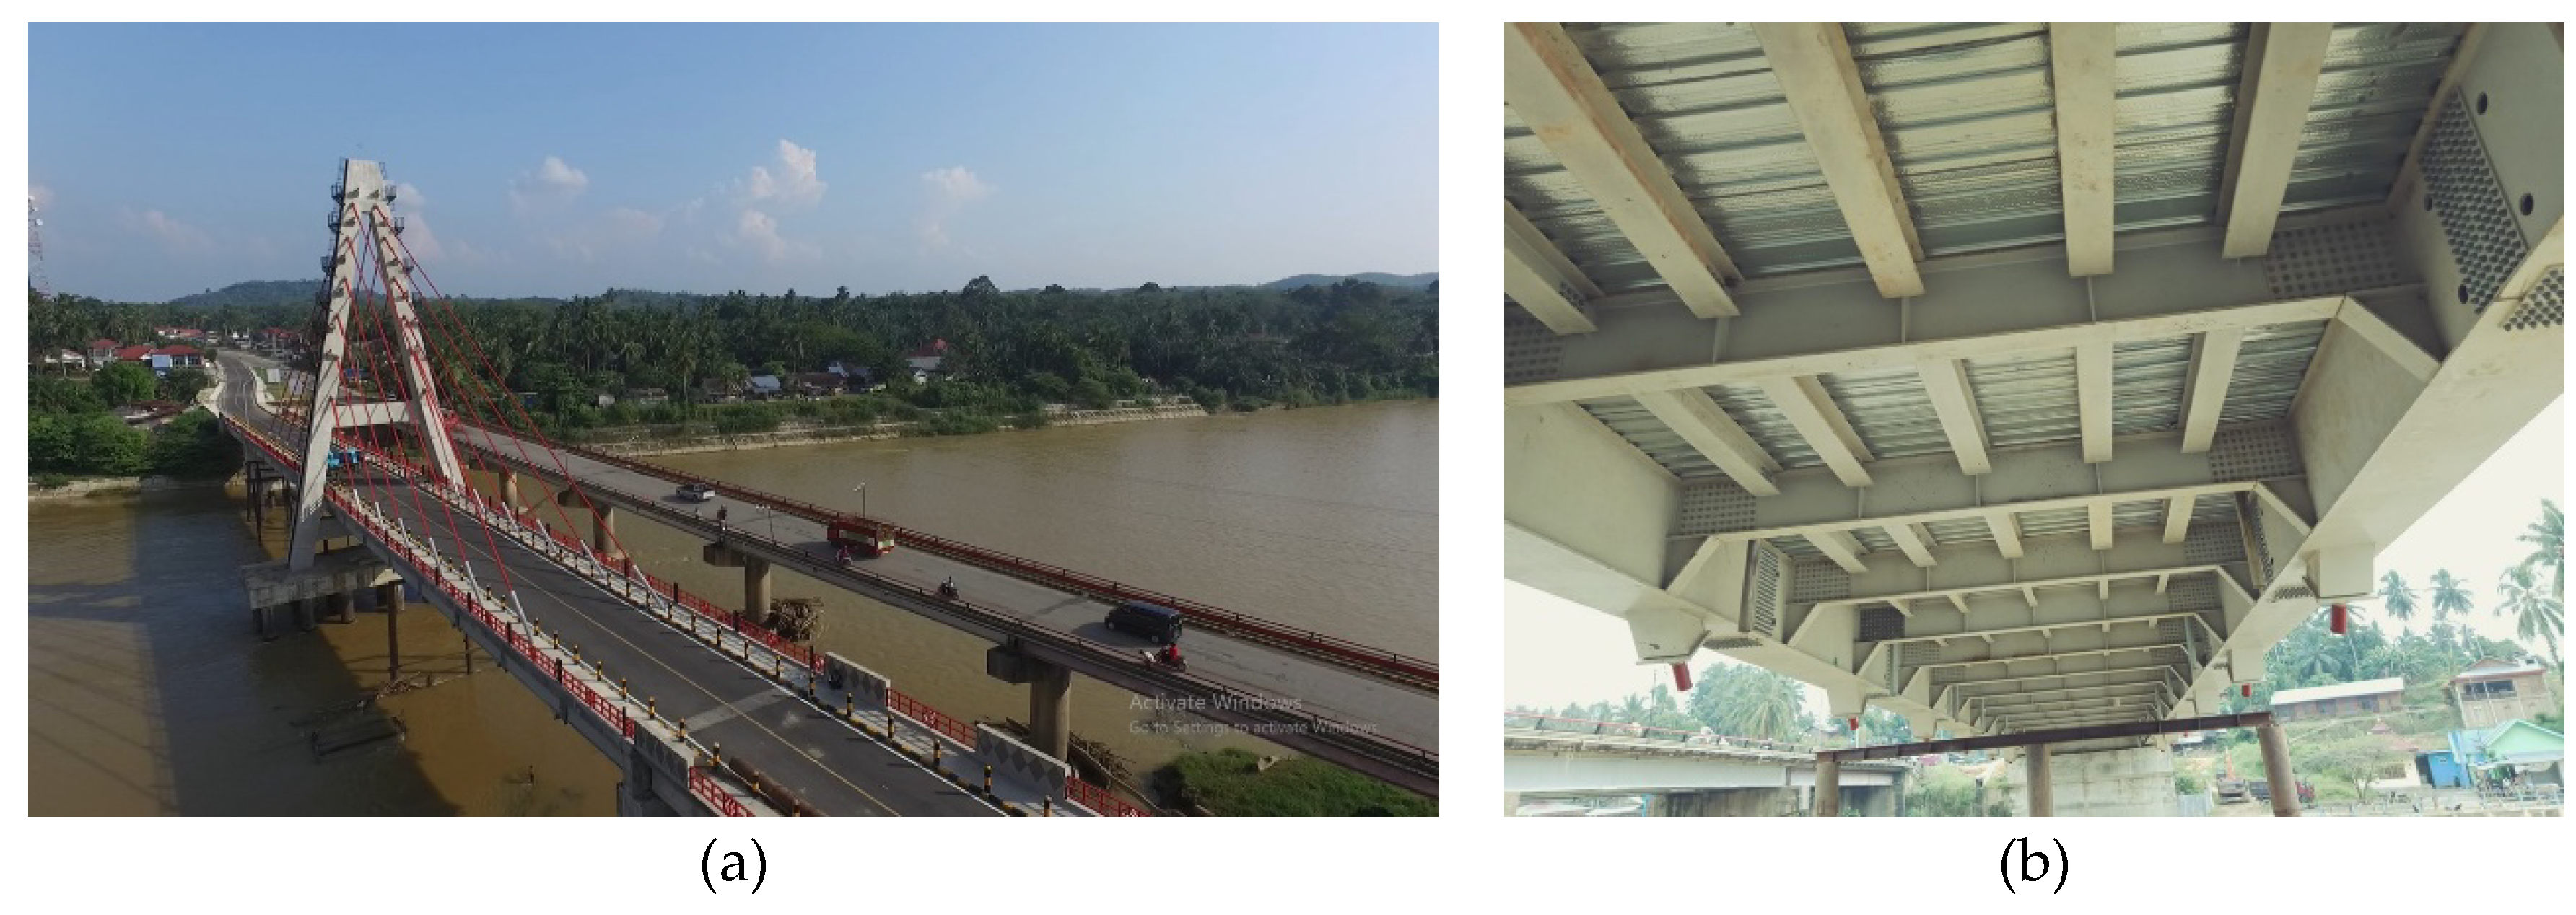
Figure 3.
Side View of Bridge.
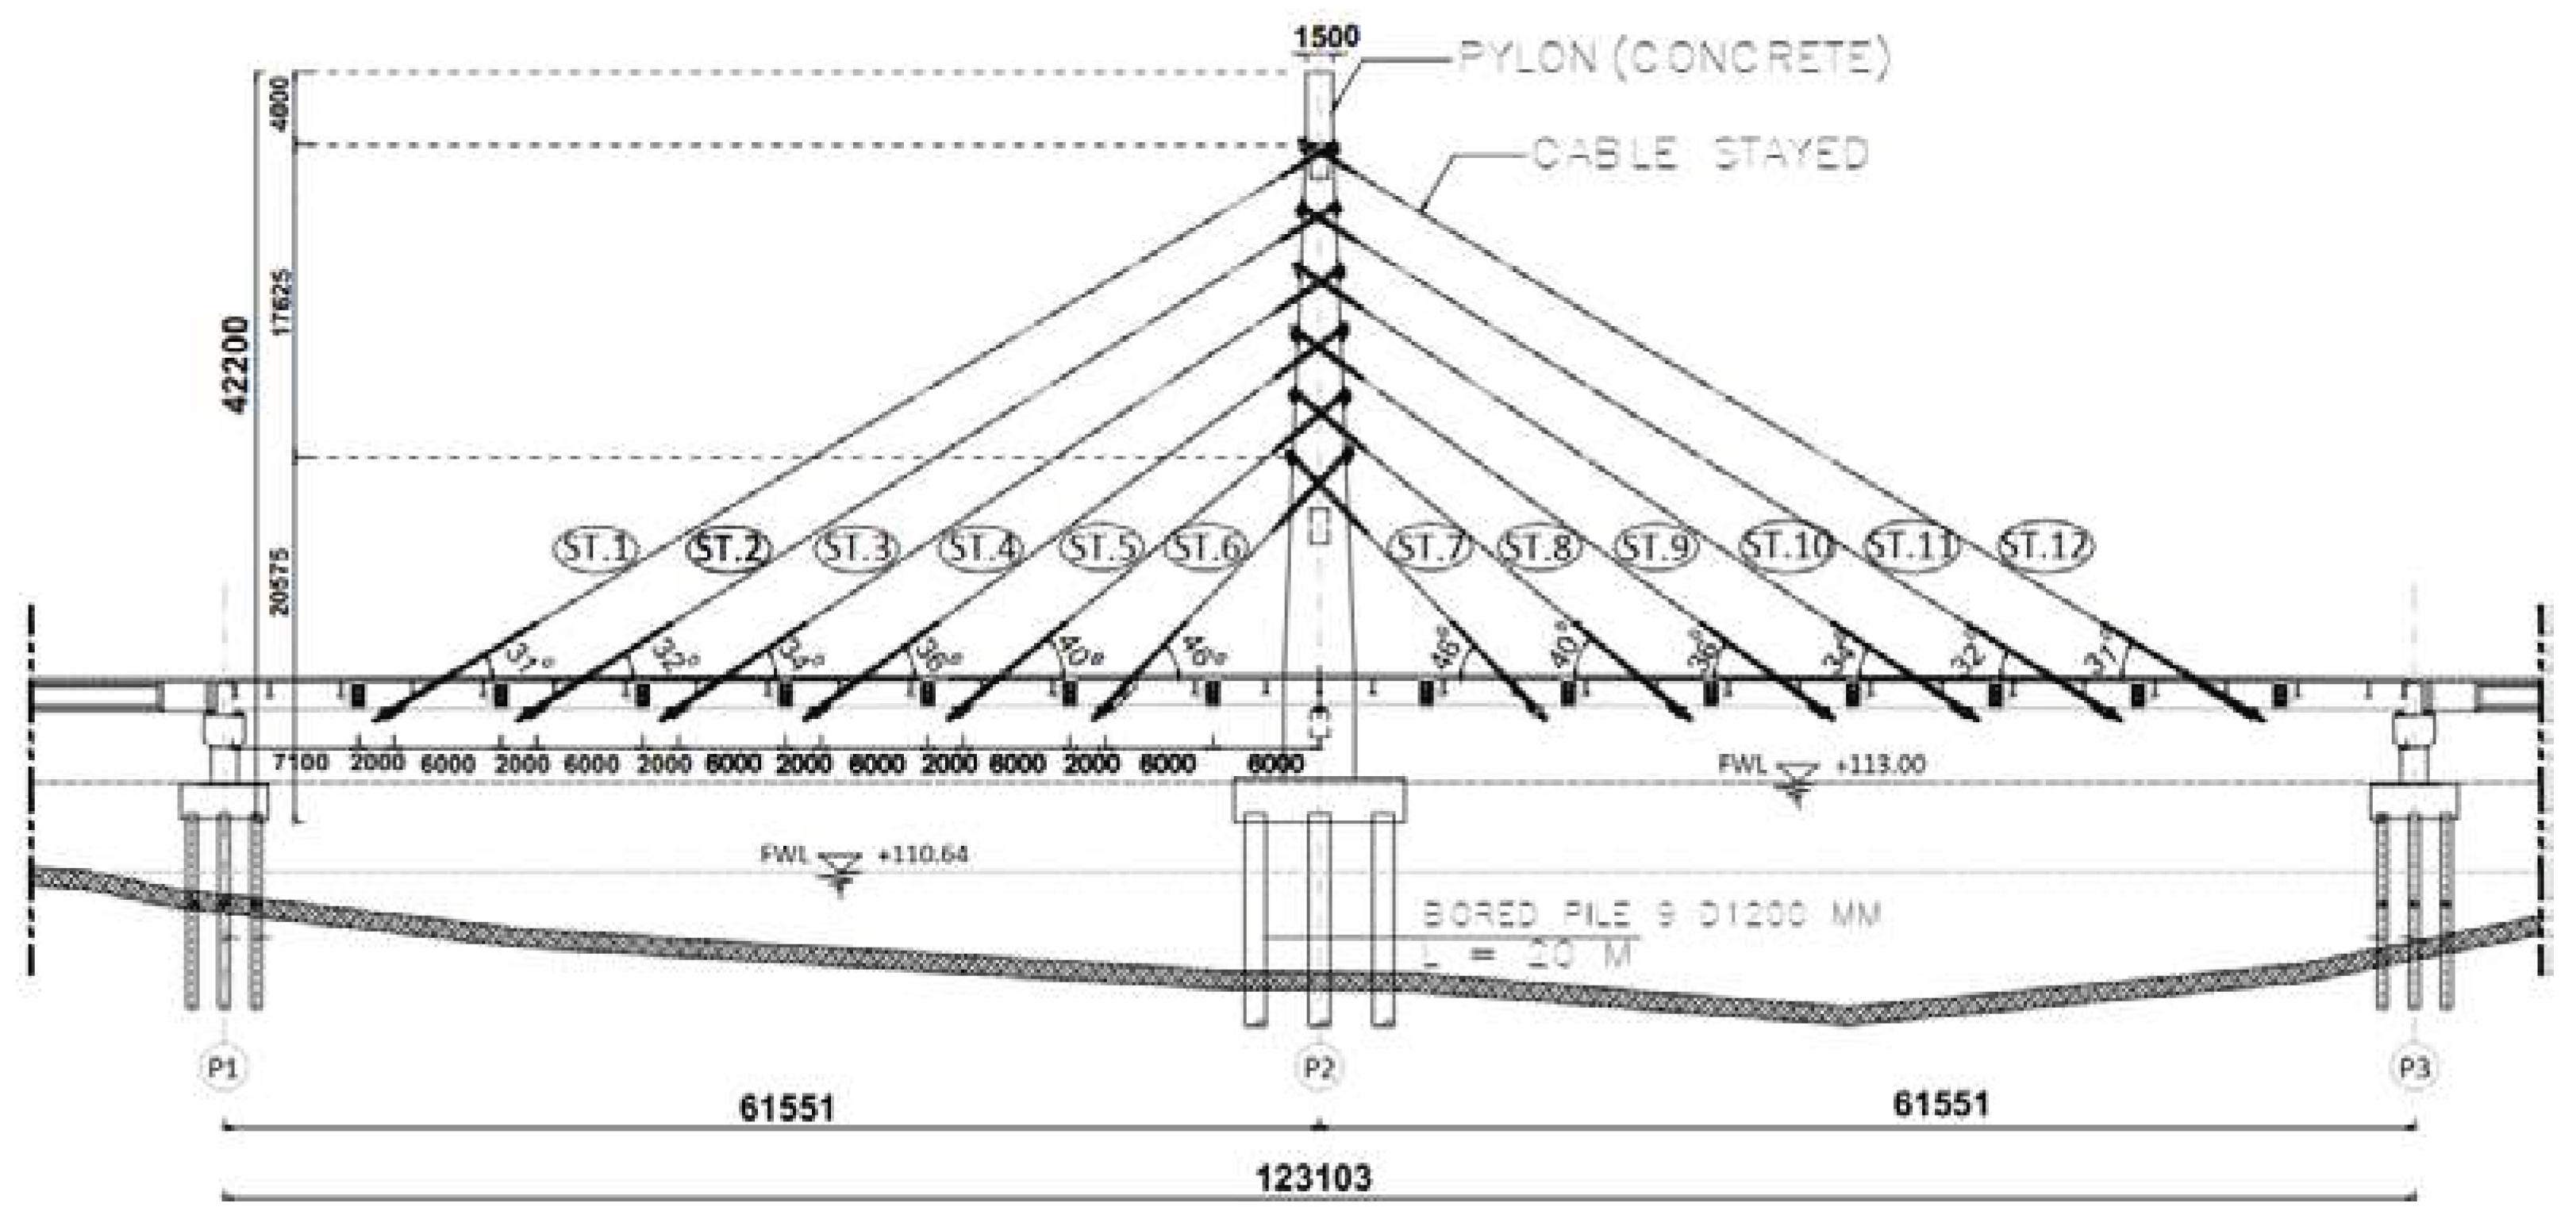
Figure 4.
(a) Cross Section of Pylon; (b) Cross Section of Deck Structure.
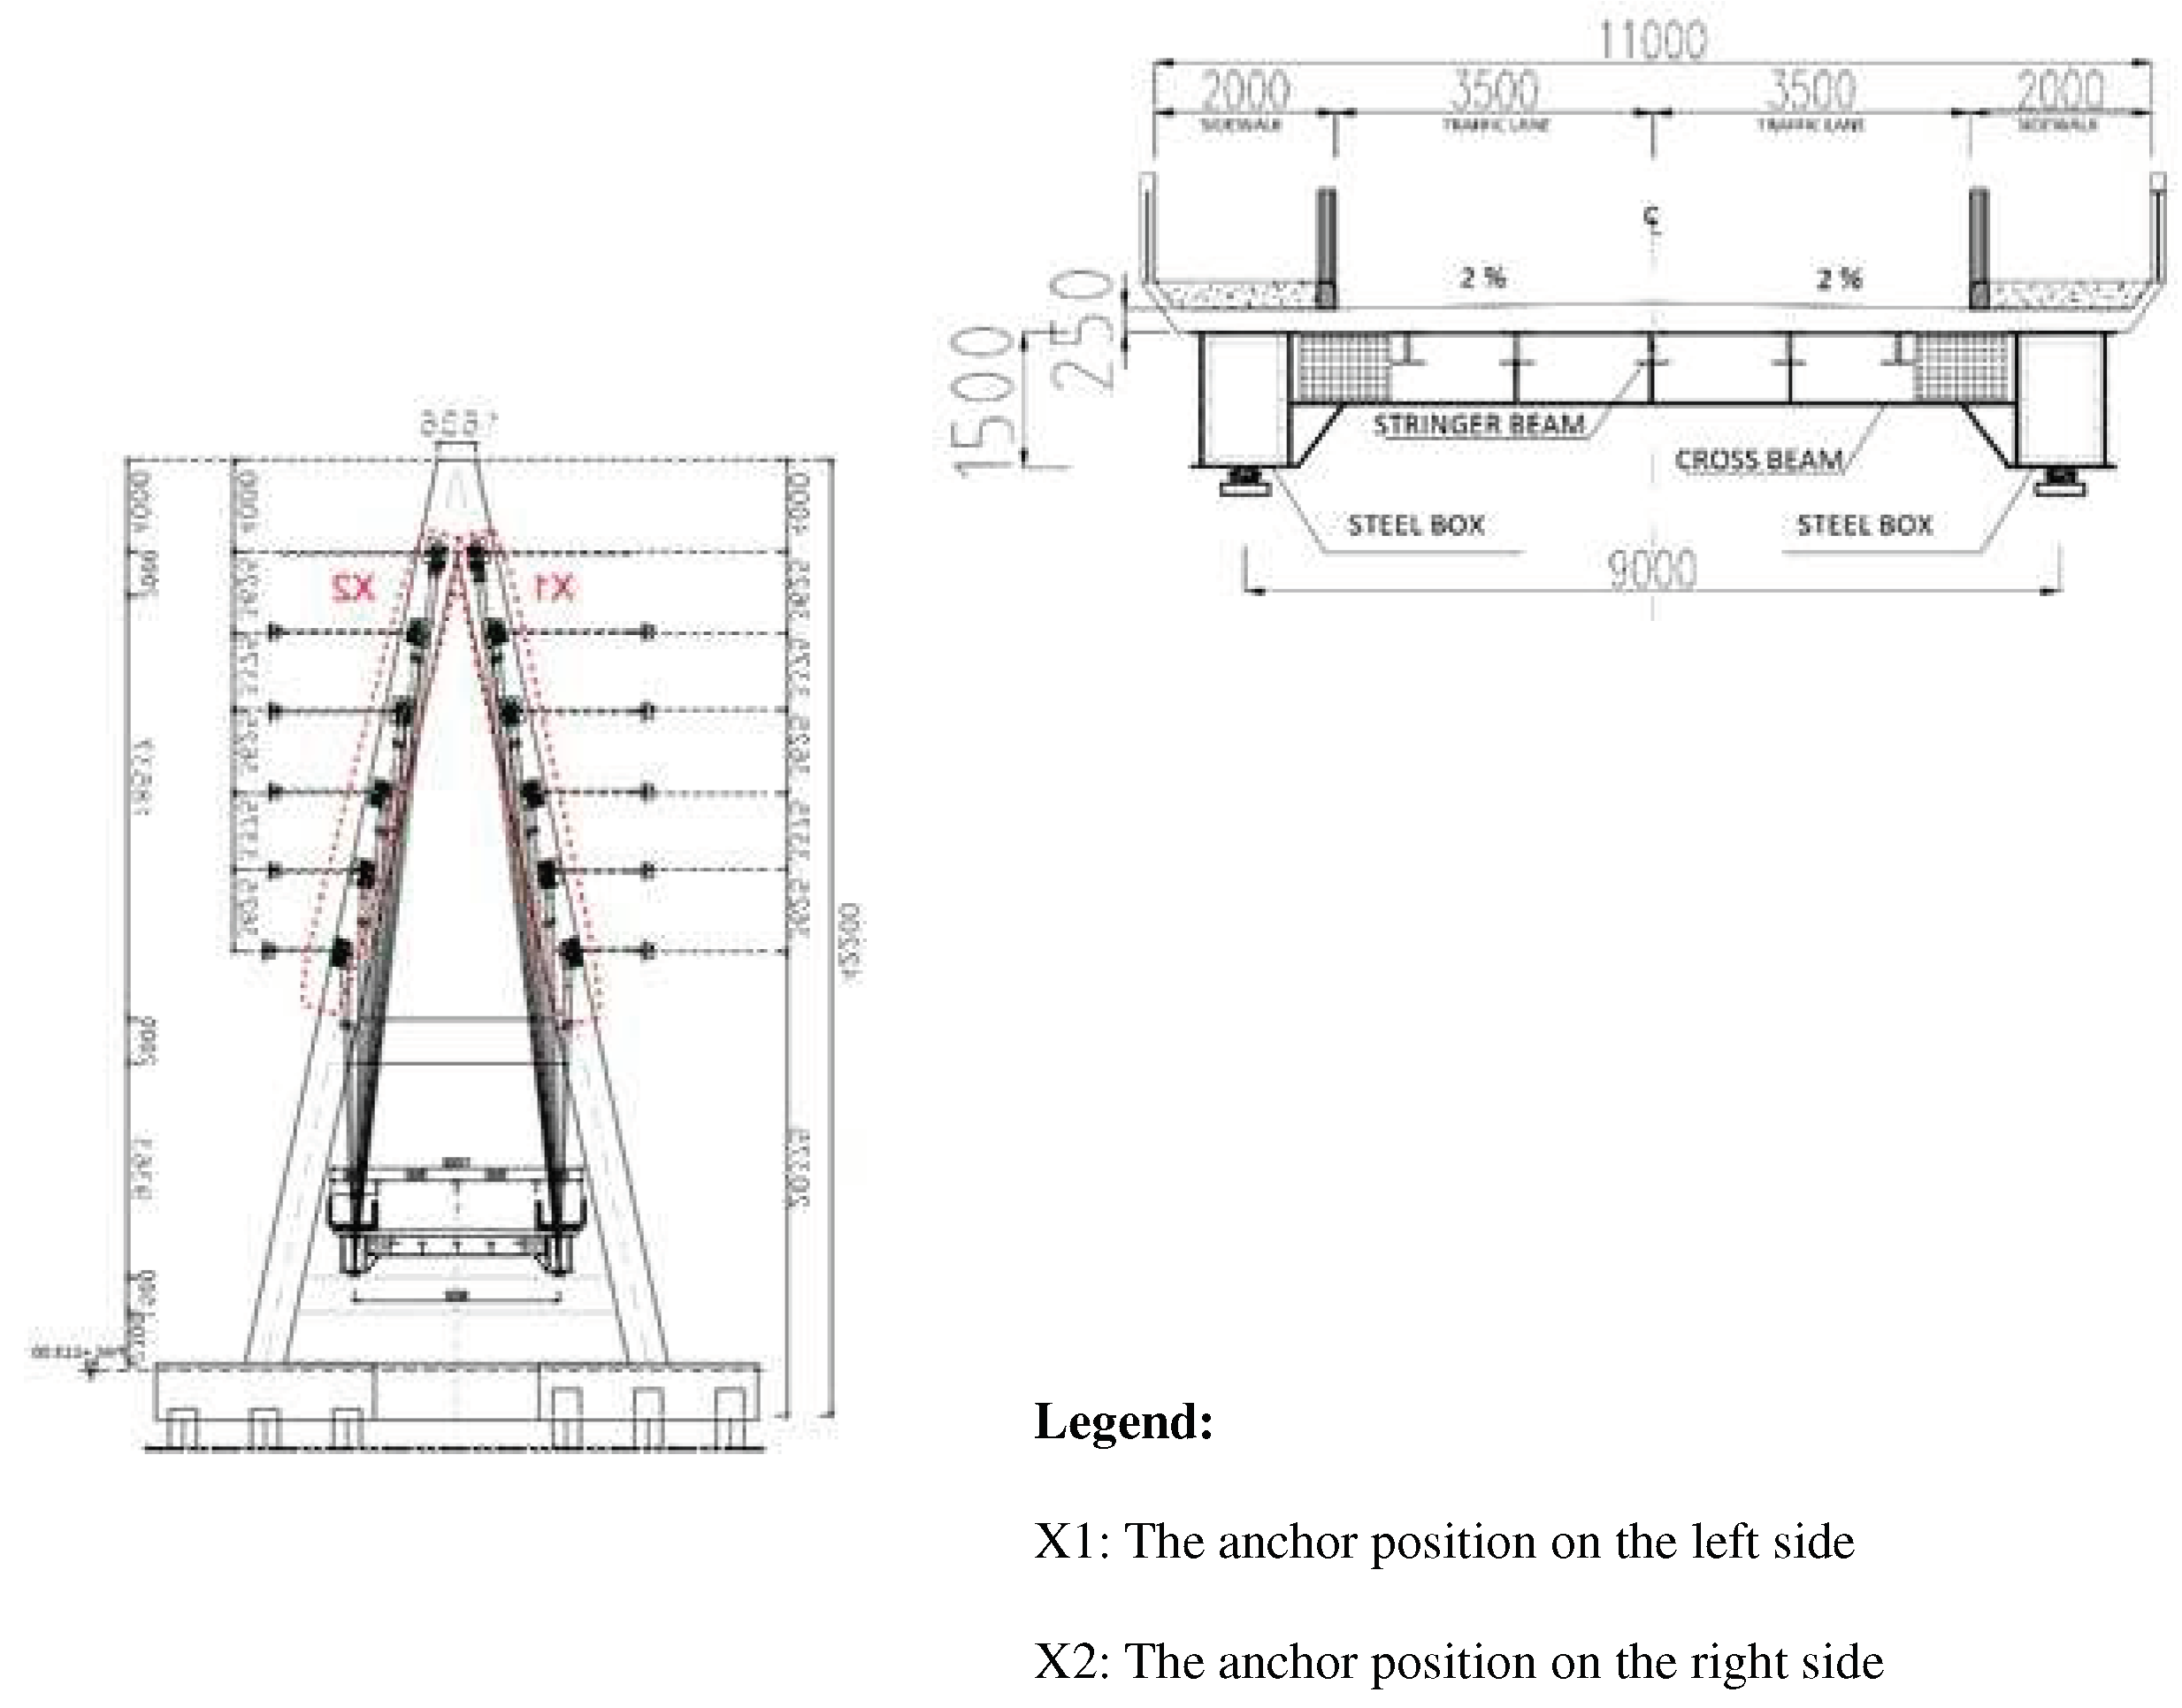
Figure 5.
Part of the pylon with unfilled concrete.
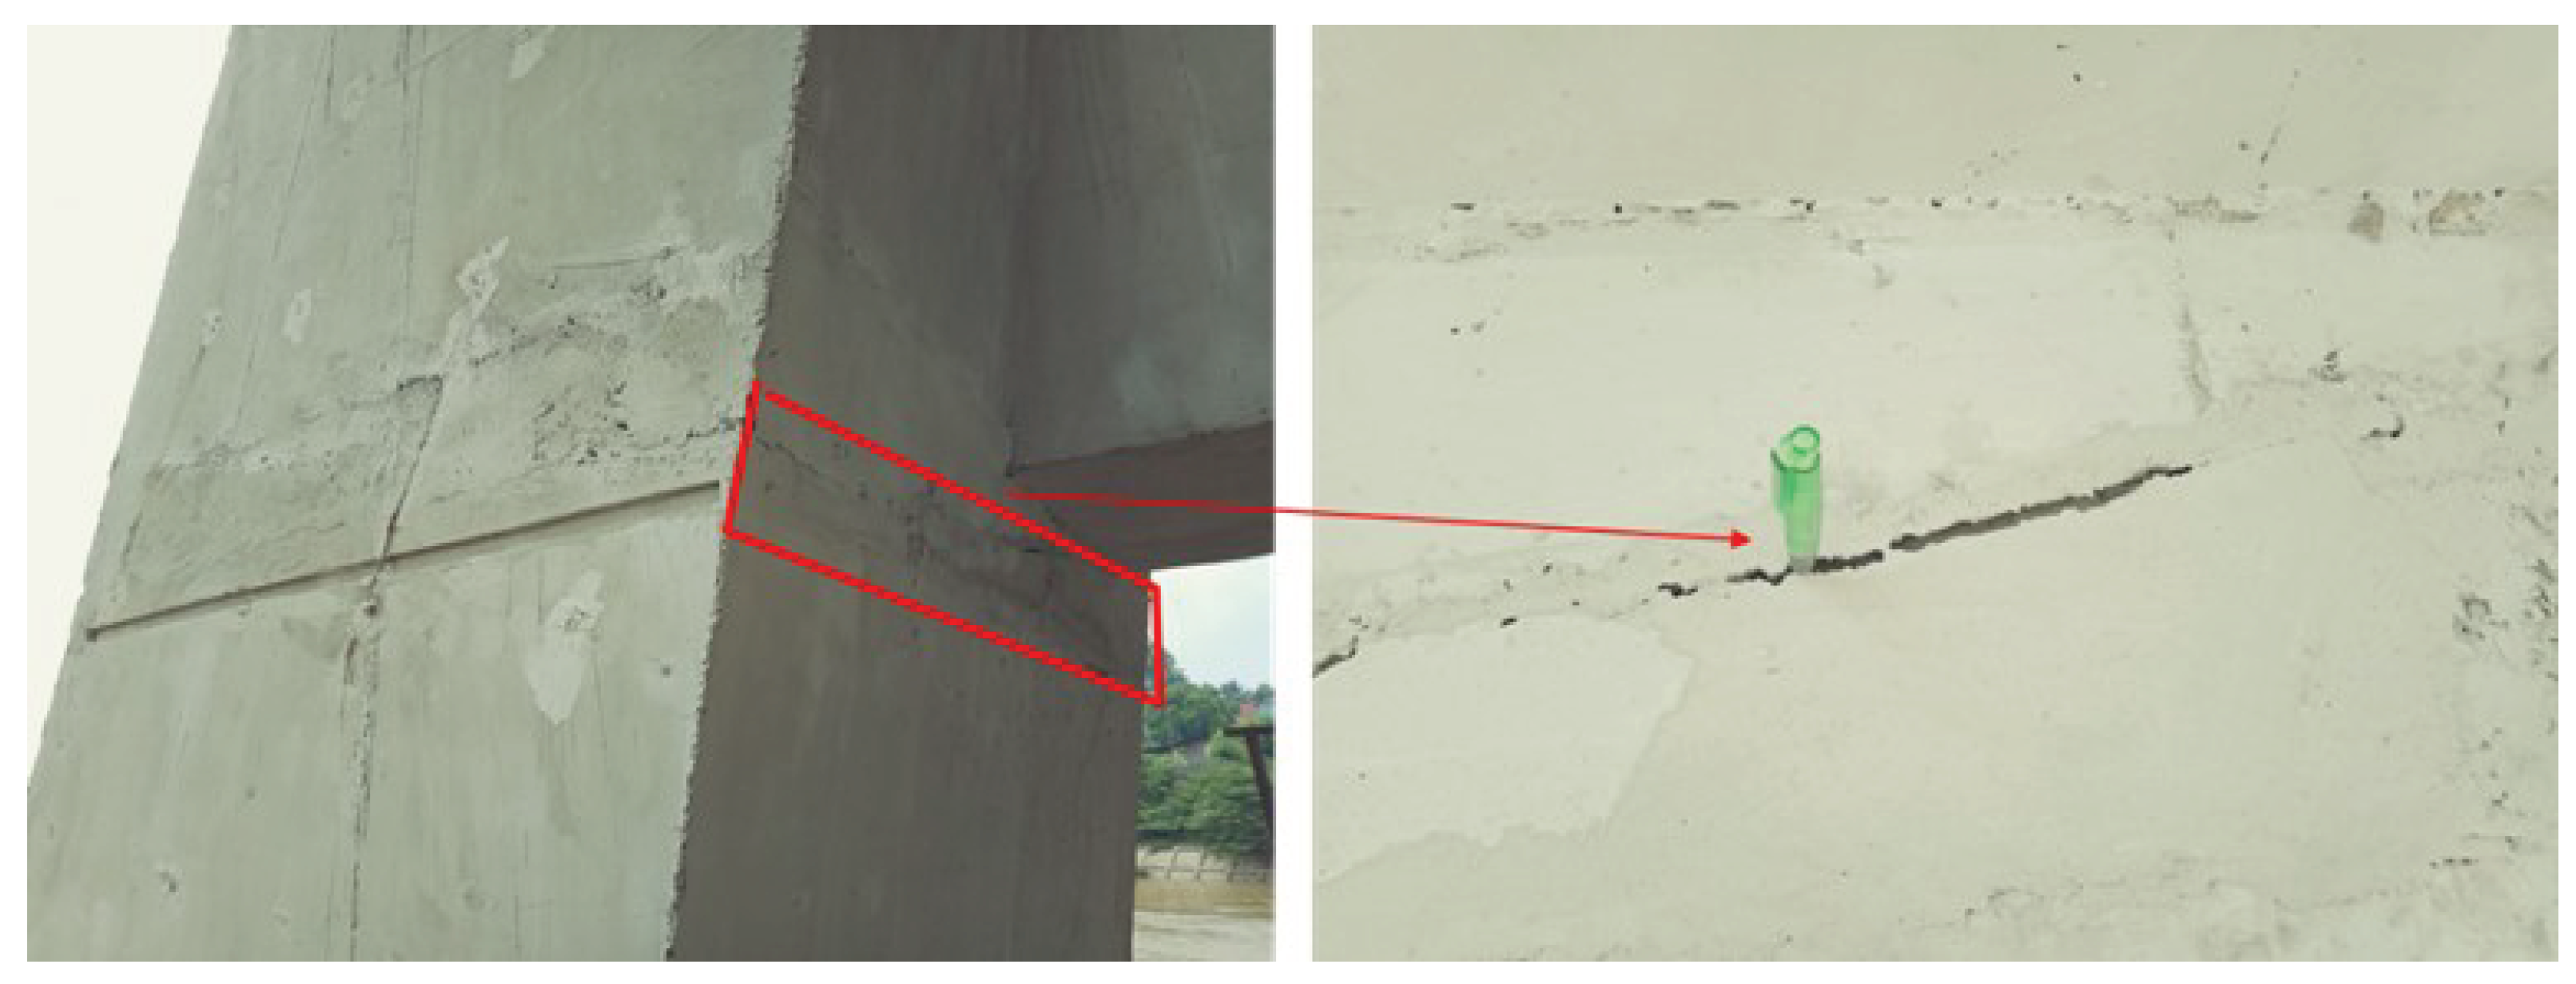
Figure 6.
Finite element model and boundary condition of the Sei Dareh cable-stayed bridge.
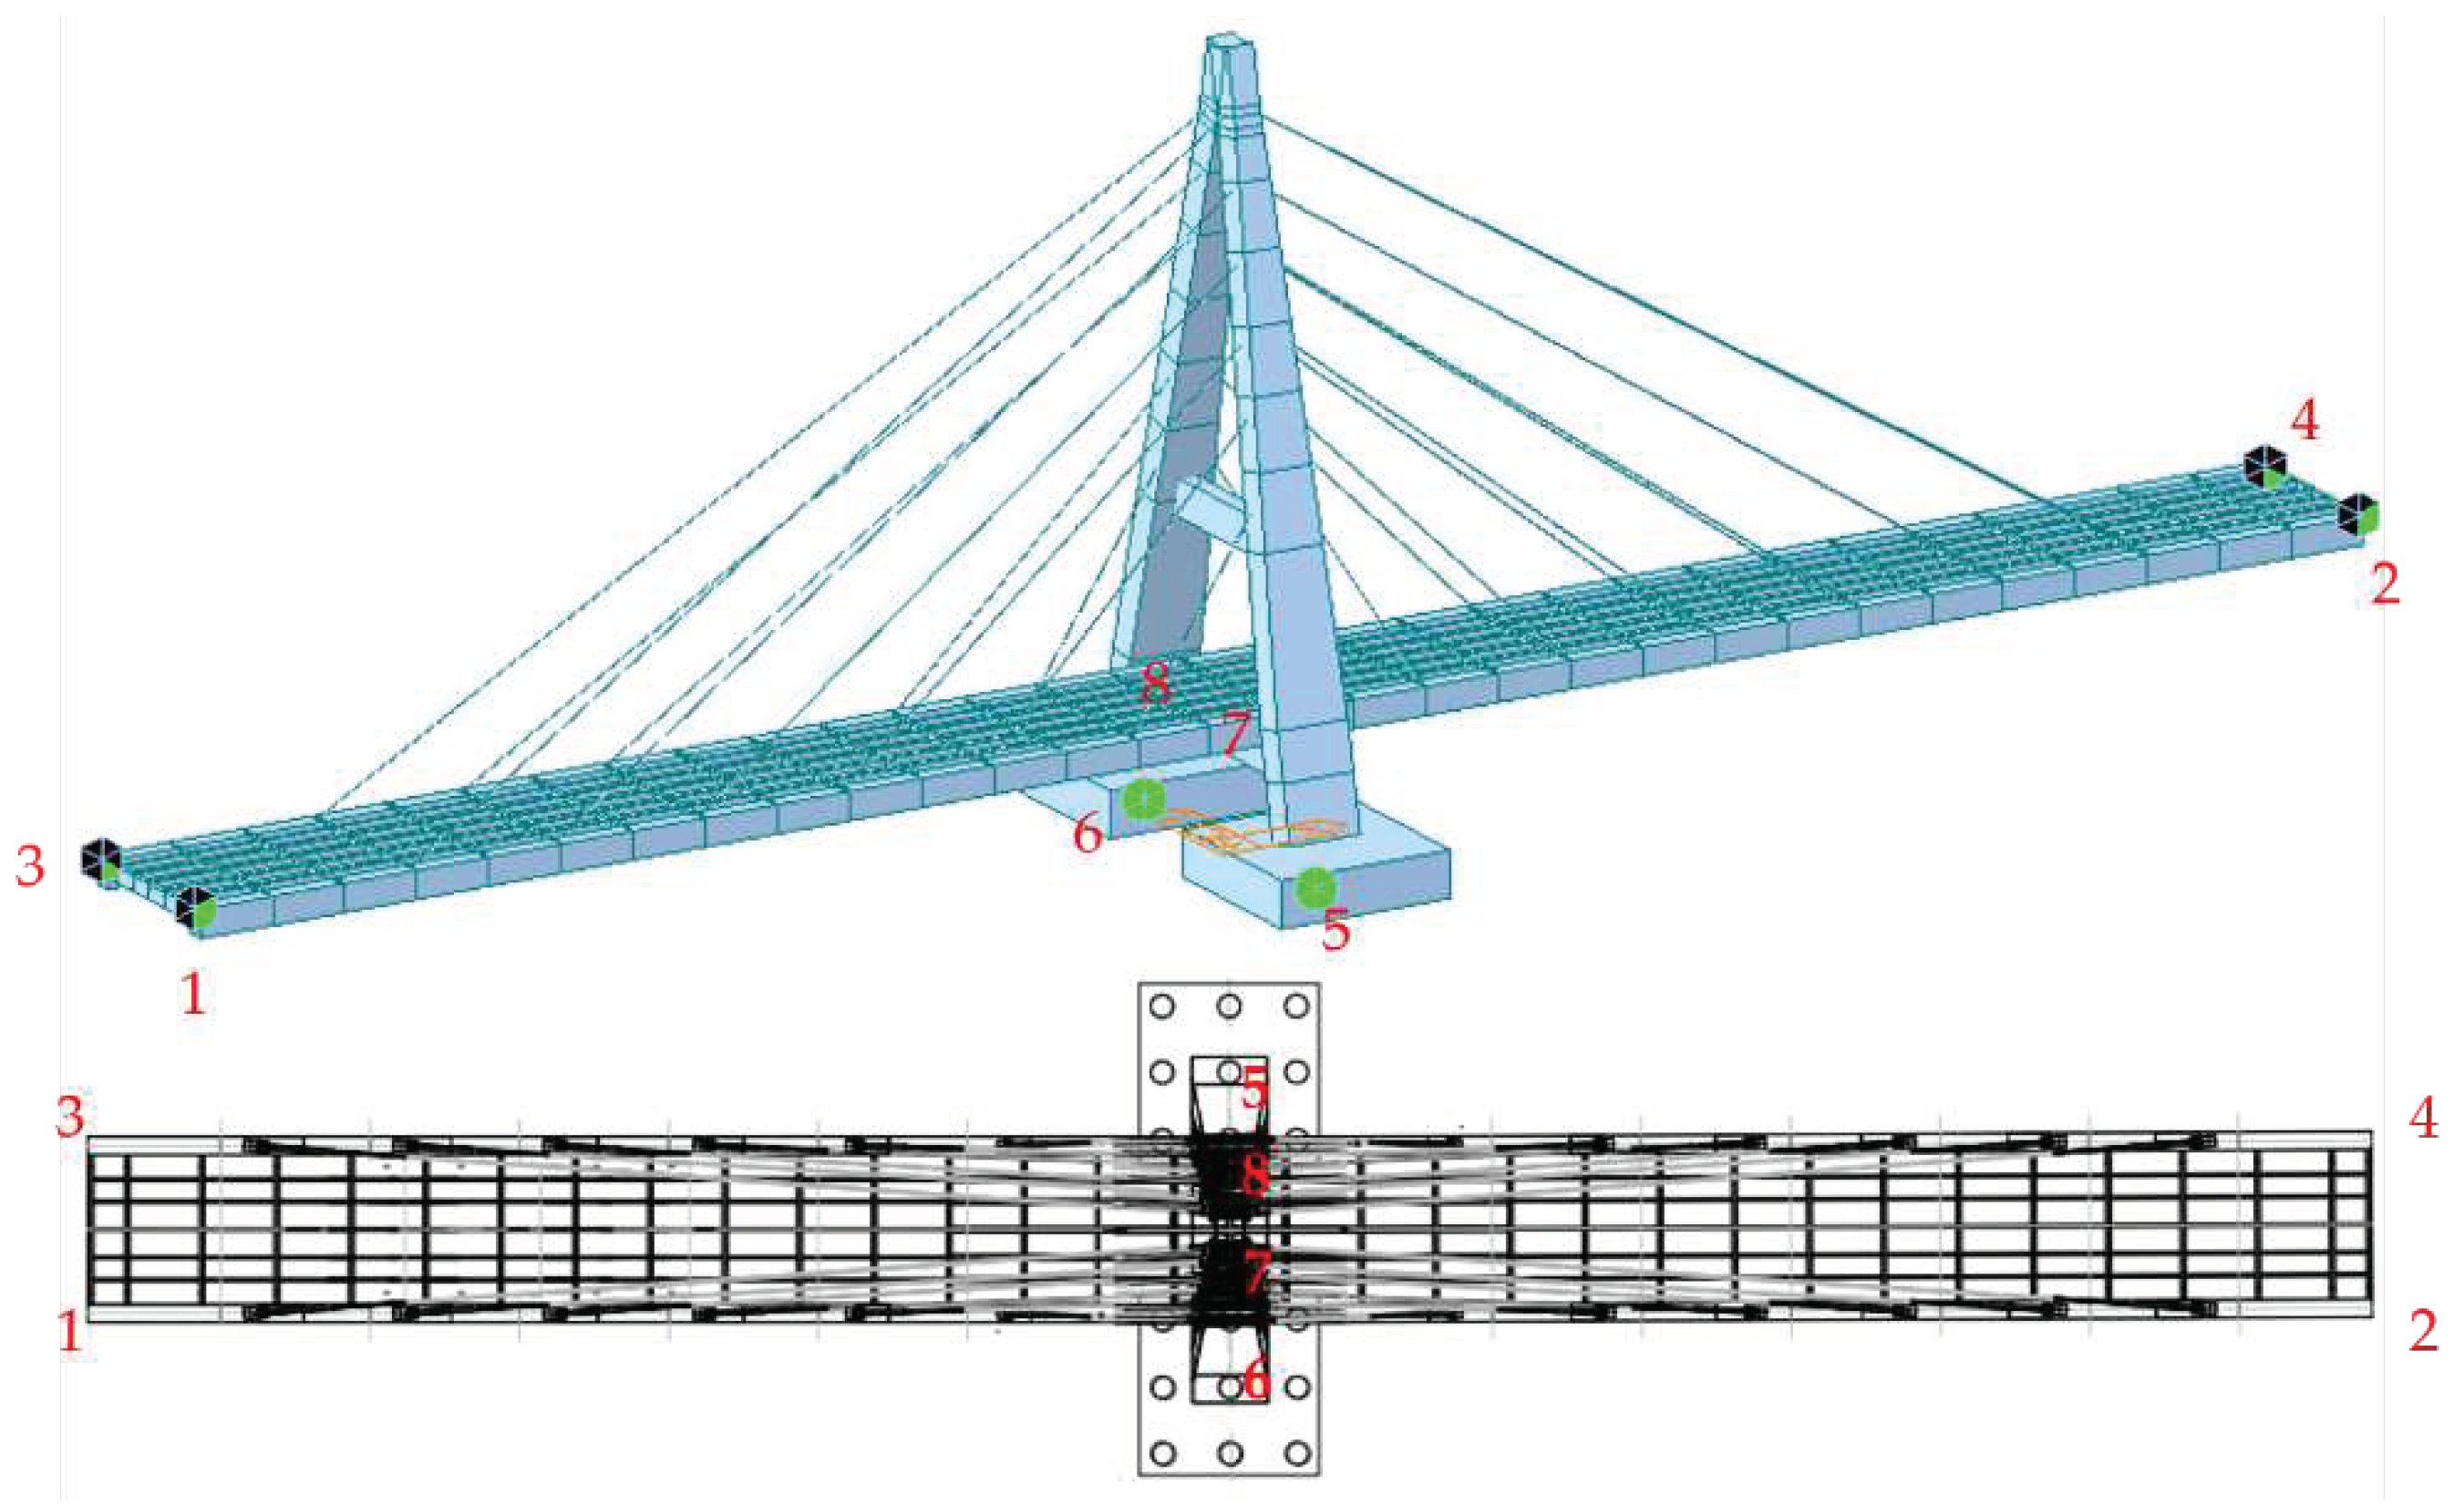
Figure 7.
Dimension of truck loaded by sand.
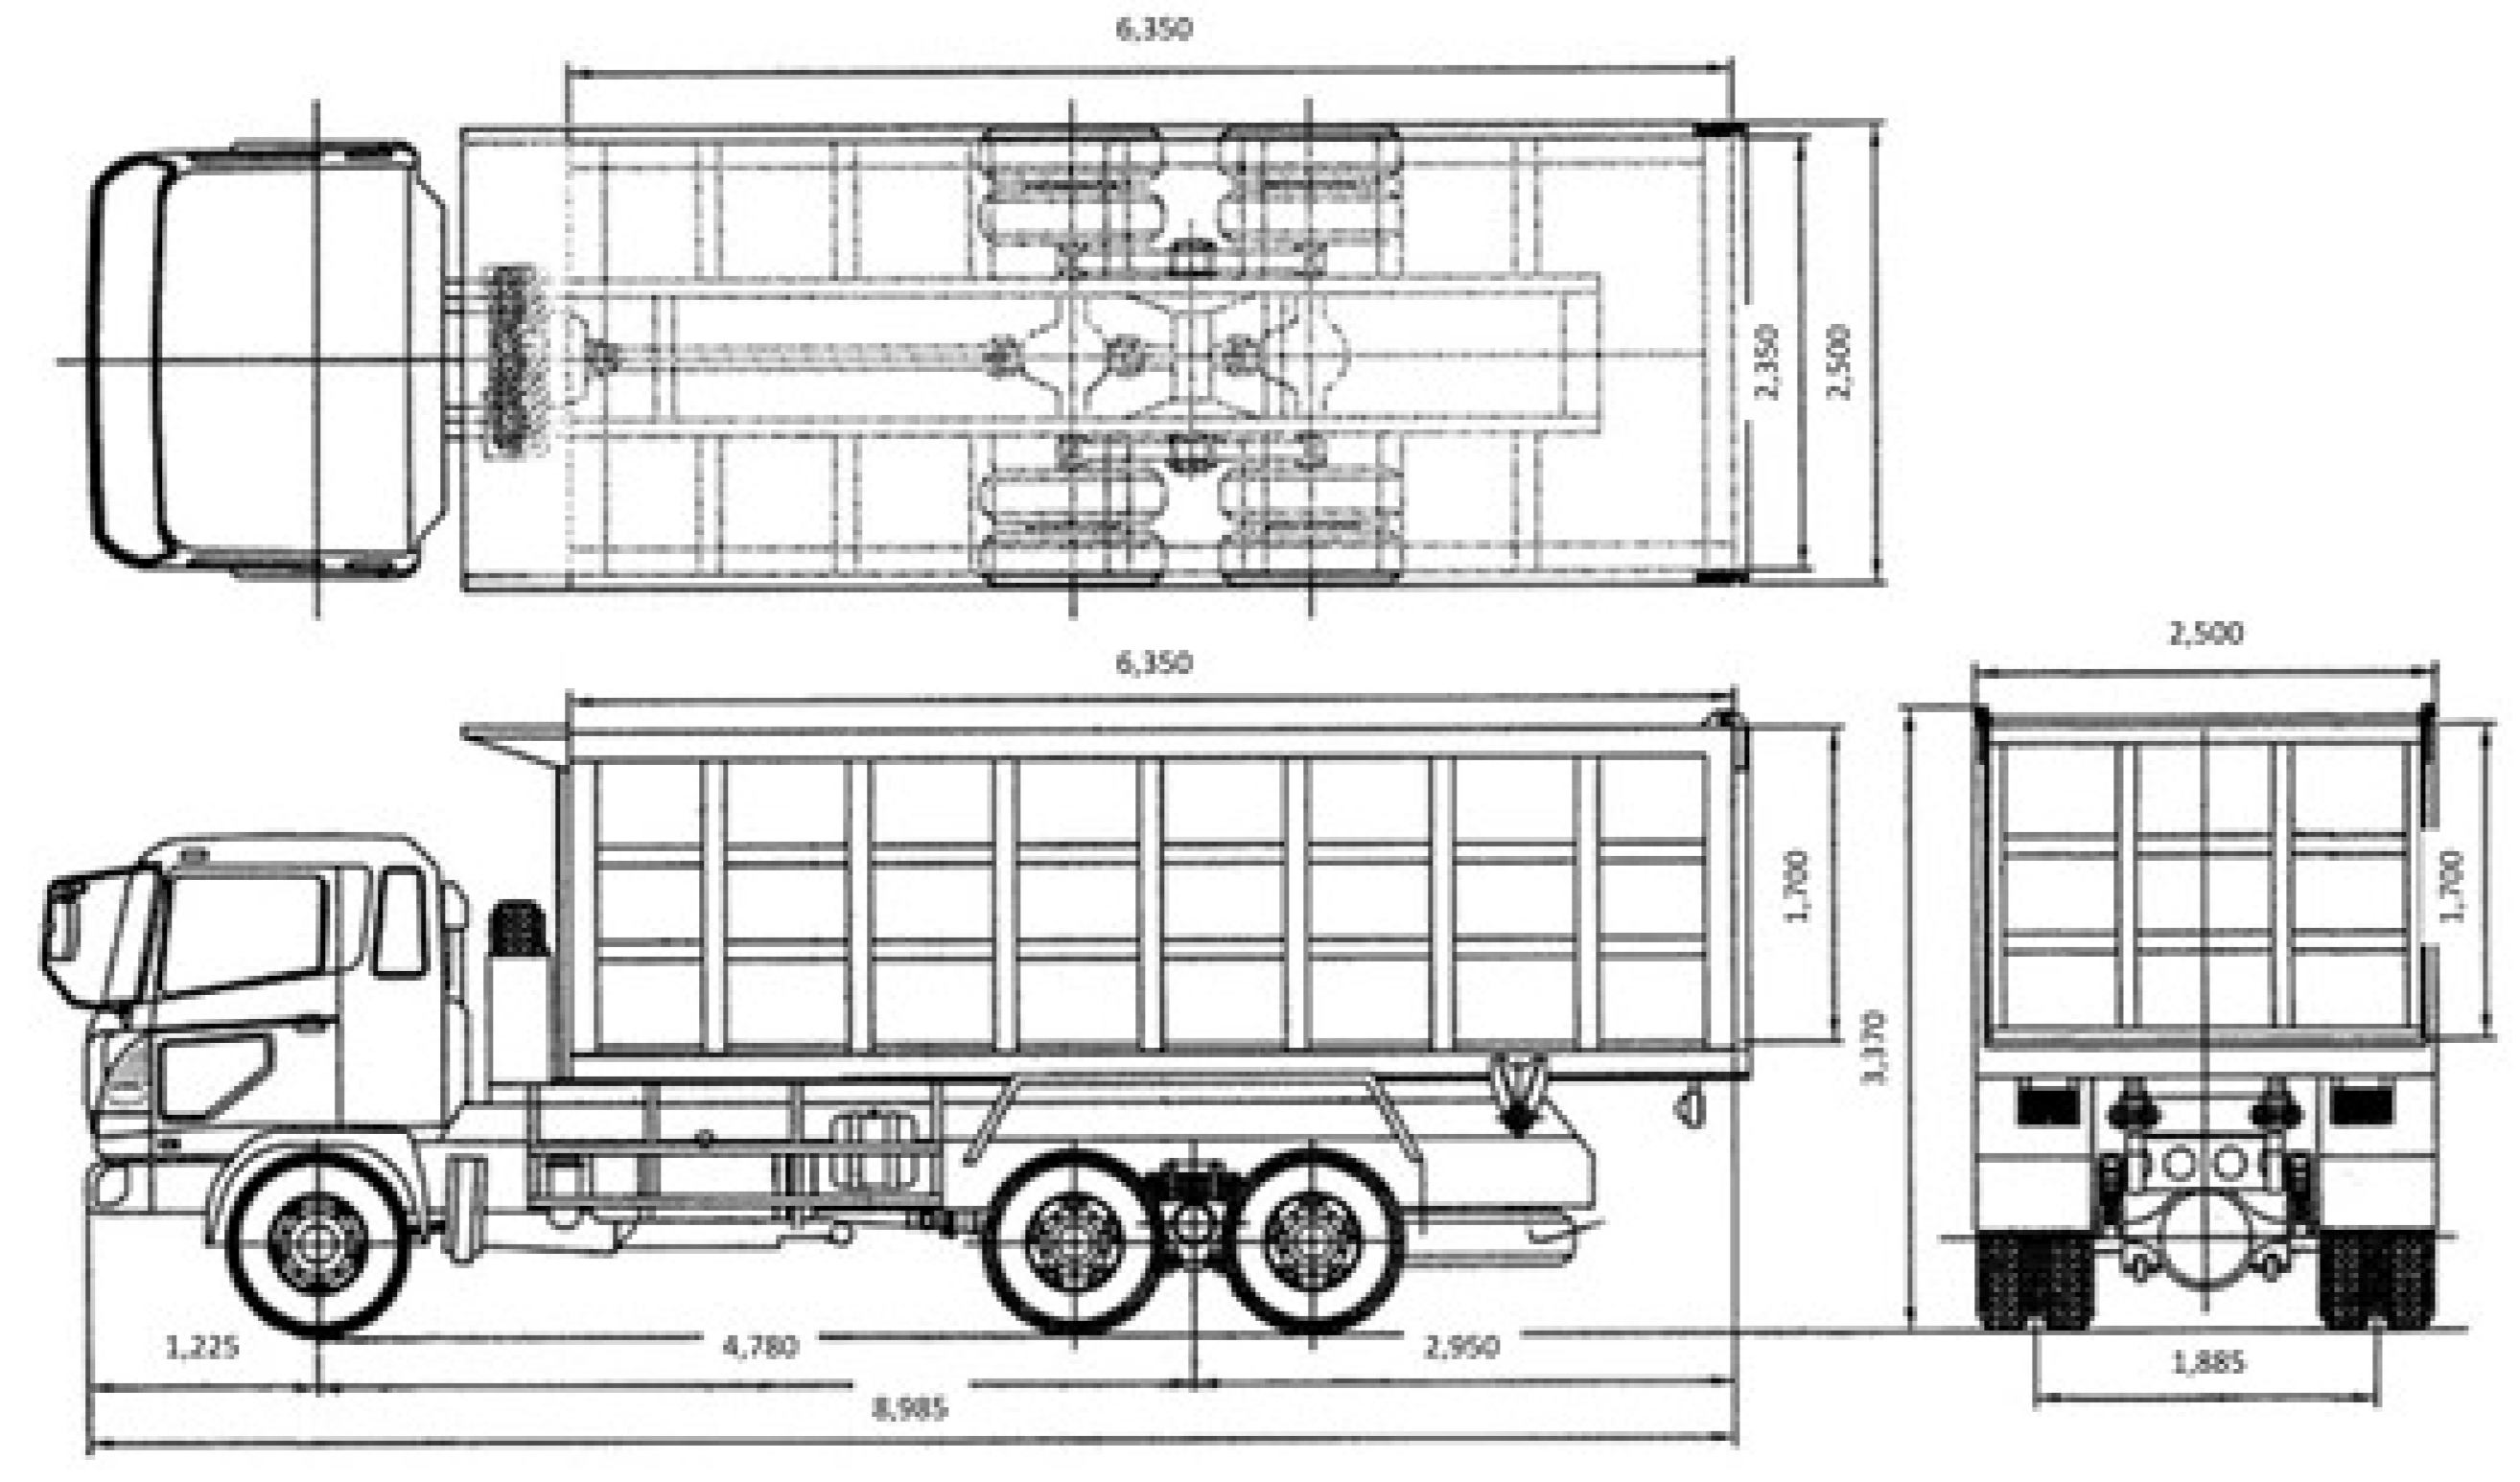
Figure 8.
Load scheme for P1-P2 and also applied at P2-P3, (a) Load 60 tons; (b) Load 120 tons; (c) Load 180 tons; (d) Load 240 tons; (e) Load 600 tons.
Figure 8.
Load scheme for P1-P2 and also applied at P2-P3, (a) Load 60 tons; (b) Load 120 tons; (c) Load 180 tons; (d) Load 240 tons; (e) Load 600 tons.
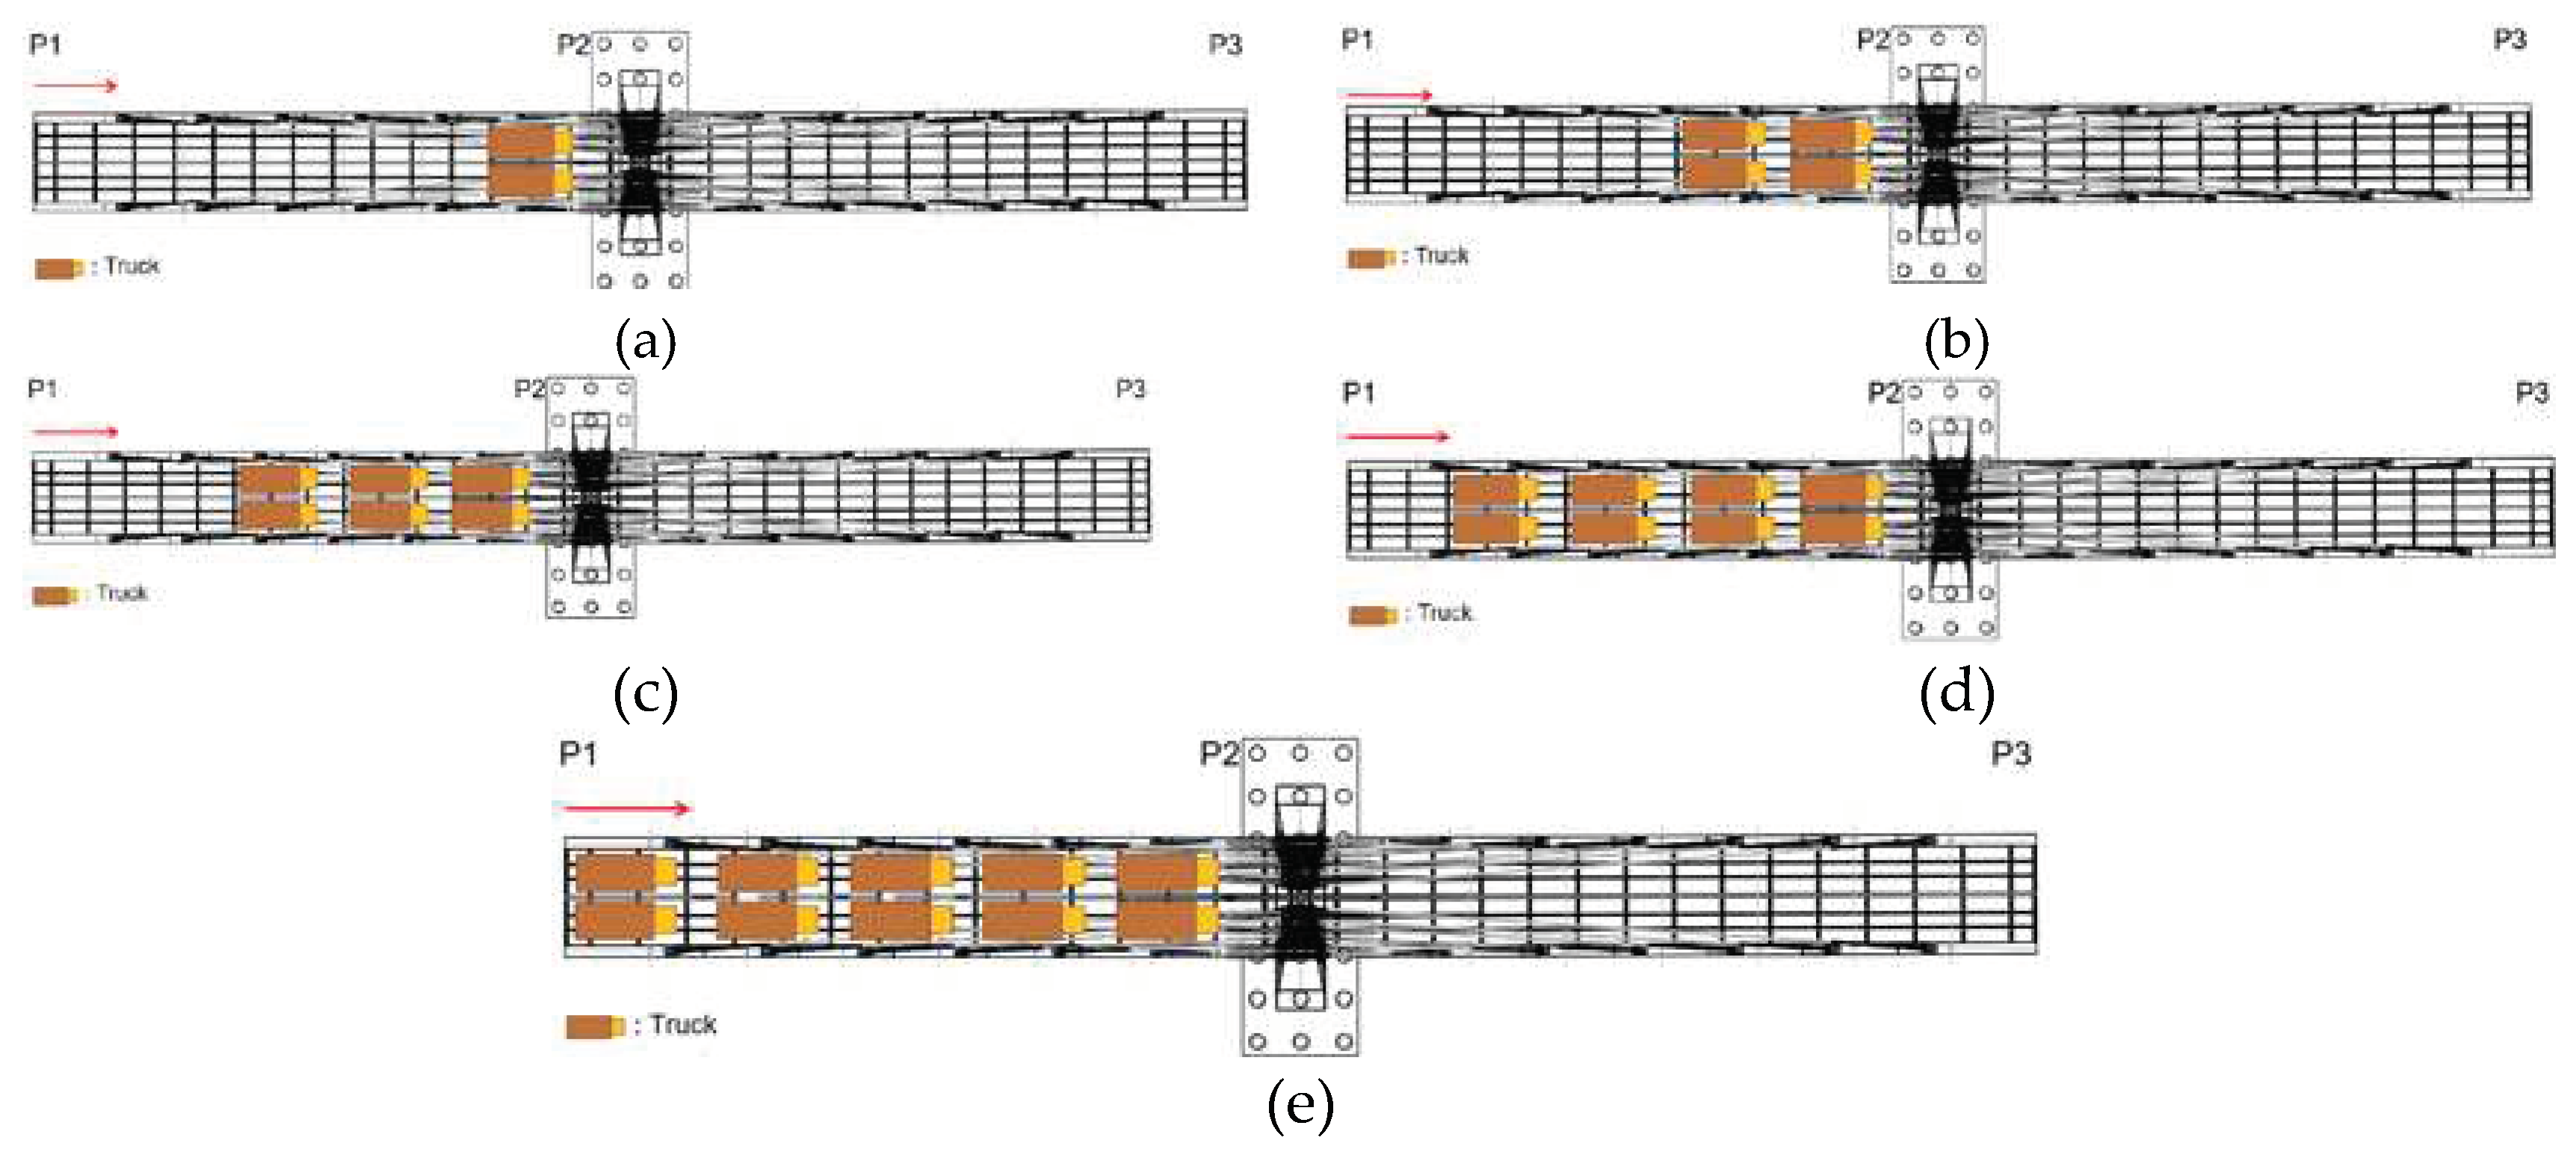
Figure 9.
(a) Placement of inclinometer, waterpass, and (b) total station.
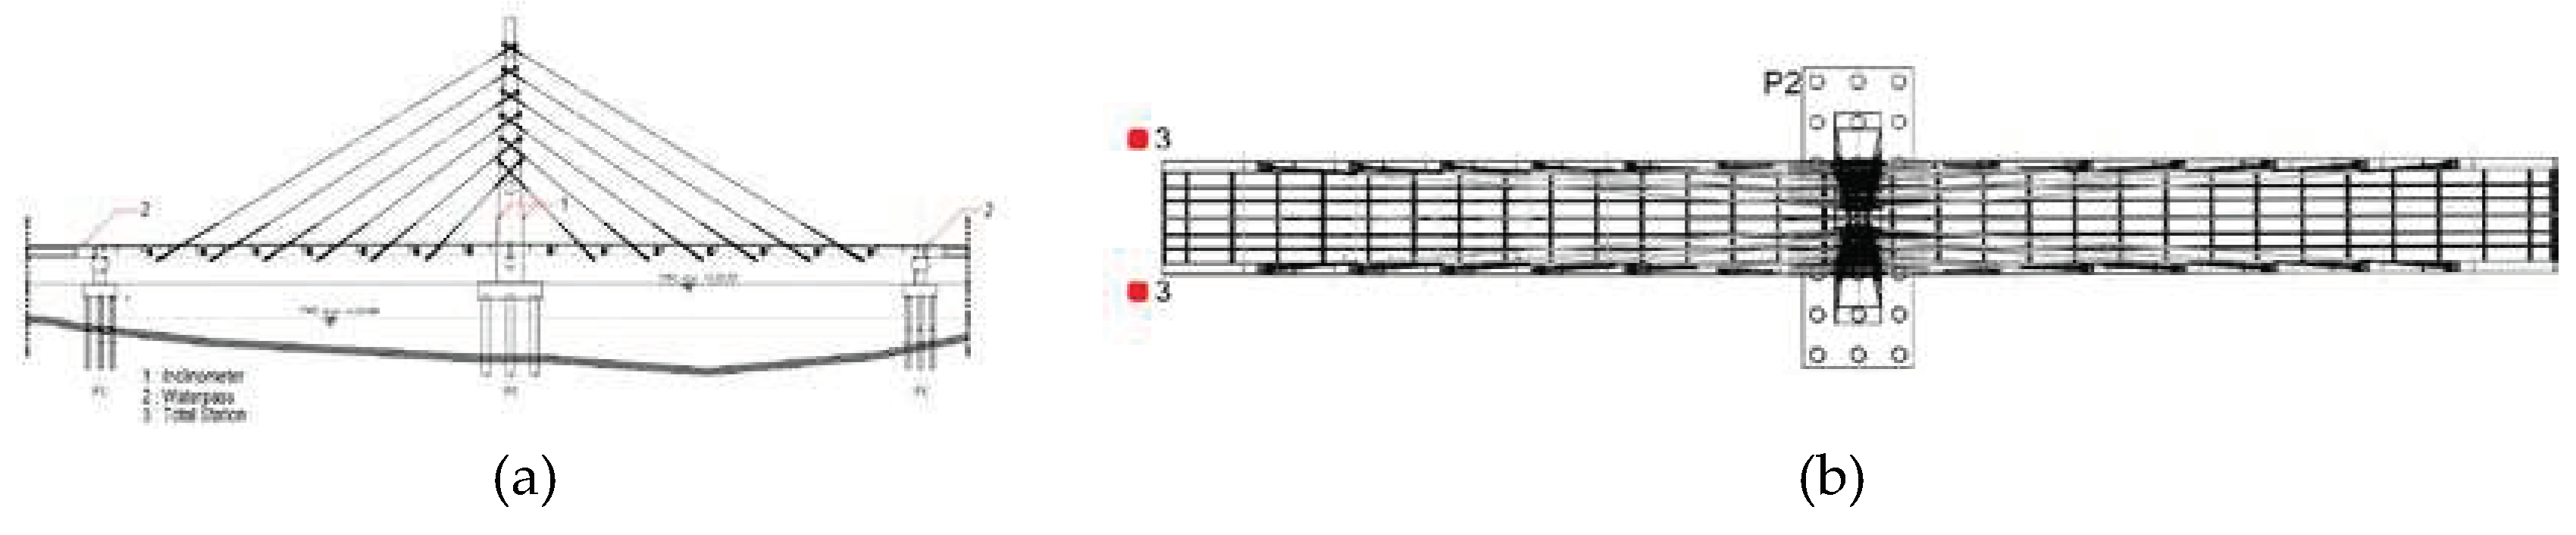
Figure 10.
The execution of static load test.
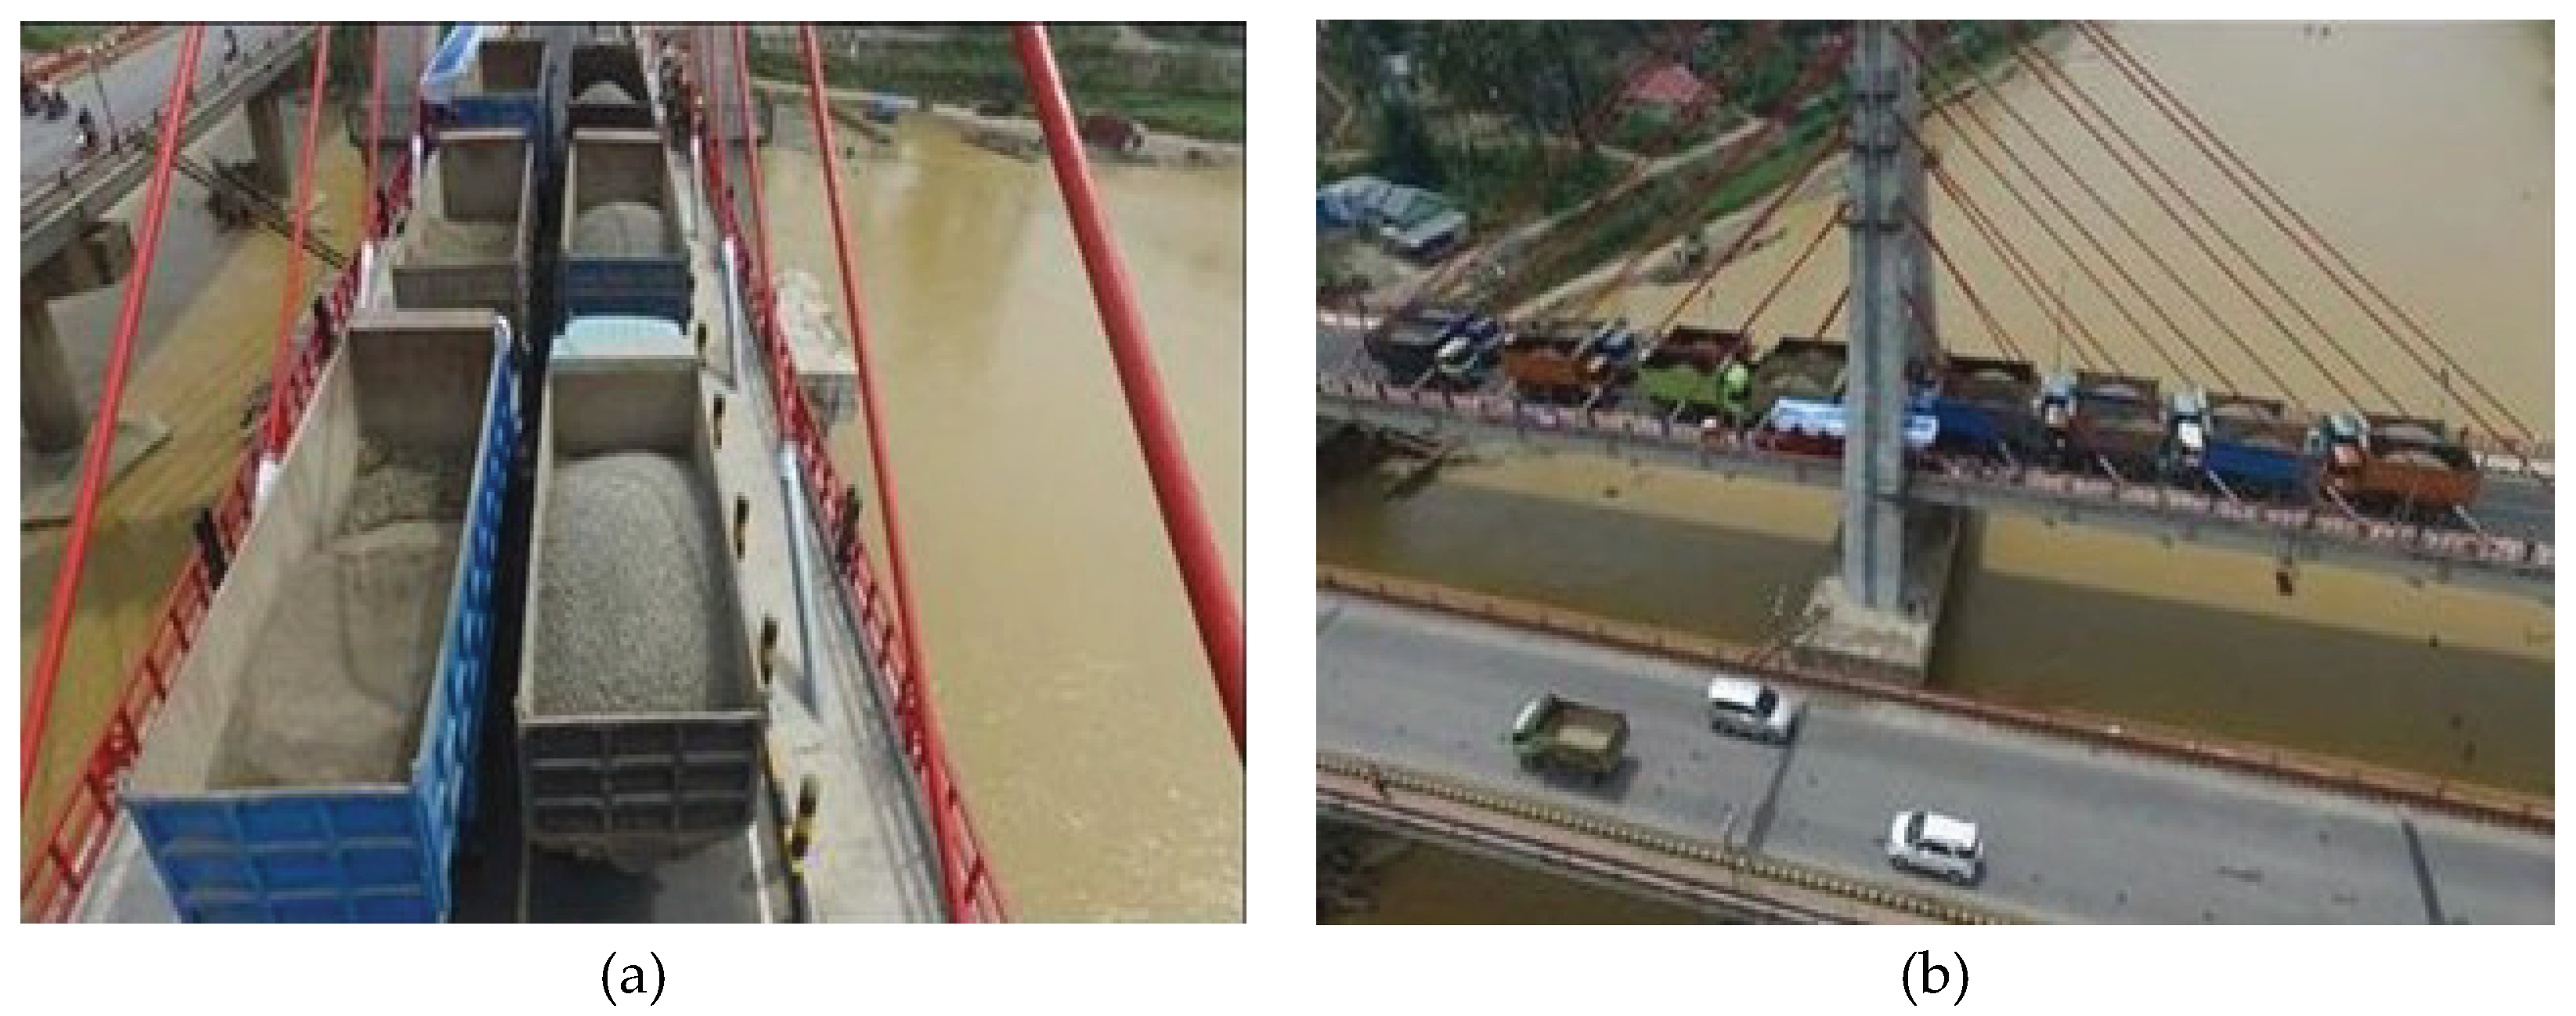
Figure 11.
(a) Schematic type 1; (b) Schematic type 2.
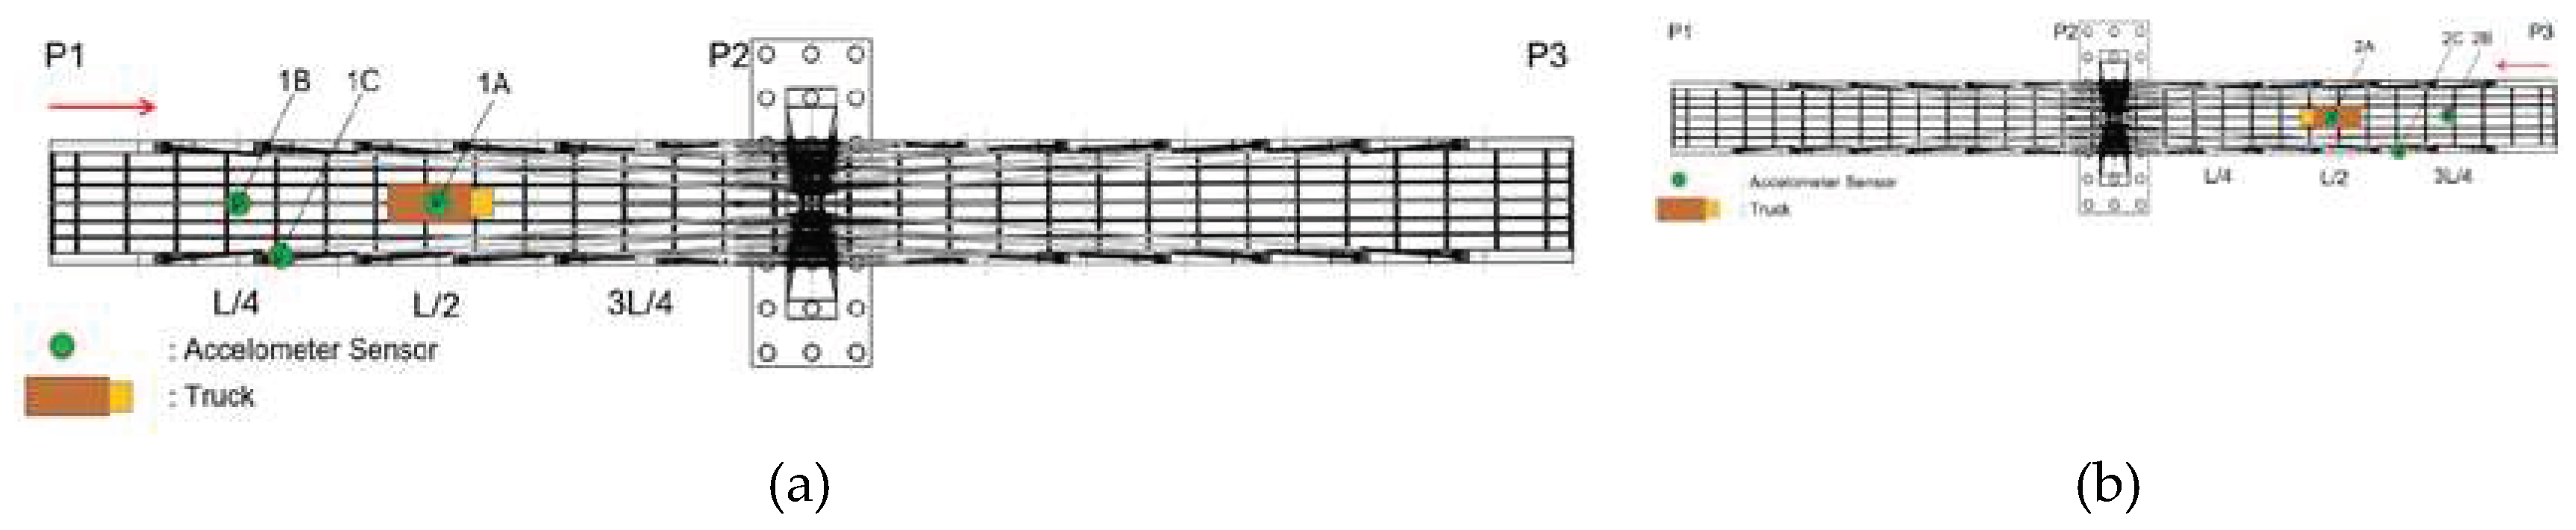
Figure 12.
(a) The execution of dynamic load test; (b) The placement of accelerometer.
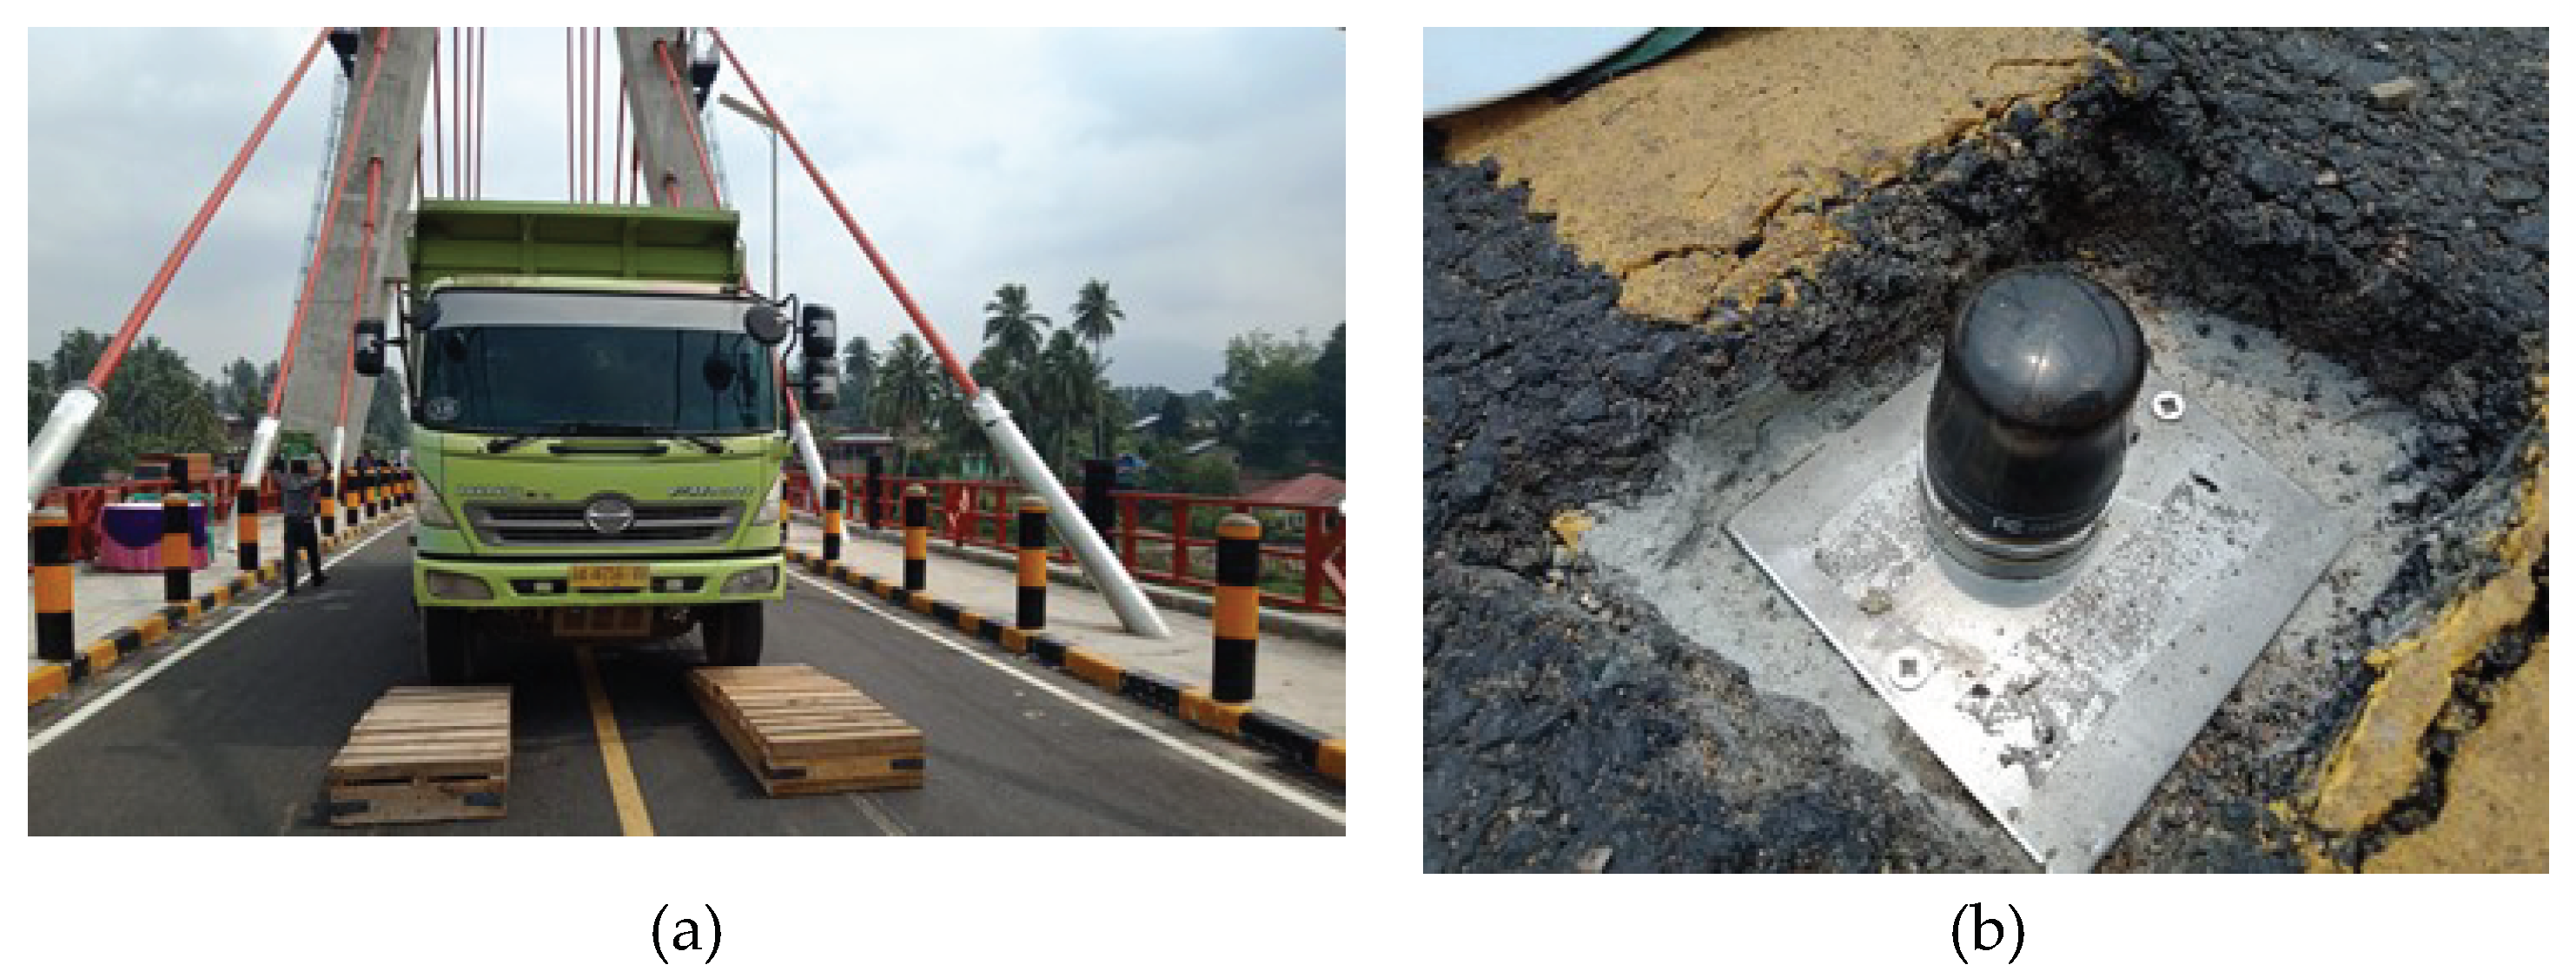
Figure 17.
Comparable deflection at (a) ¼ L; (b) ½ L; (c) ¾ L and (d) L using waterpass, total station, and 3D FEM. due to truckload on P1-P2 spans An inclinometer was installed at a distance of 26 537 mm from the top of the pylon to measure the slope of the pylon in the longitudinal direction under loading in either P1-P2 or P2-P3 spans. The measurement results at a peak load of 240 tons occurred pylon slope of 0.0011o and linear calculations gave the pylon peak deviation value of 0.51 mm.
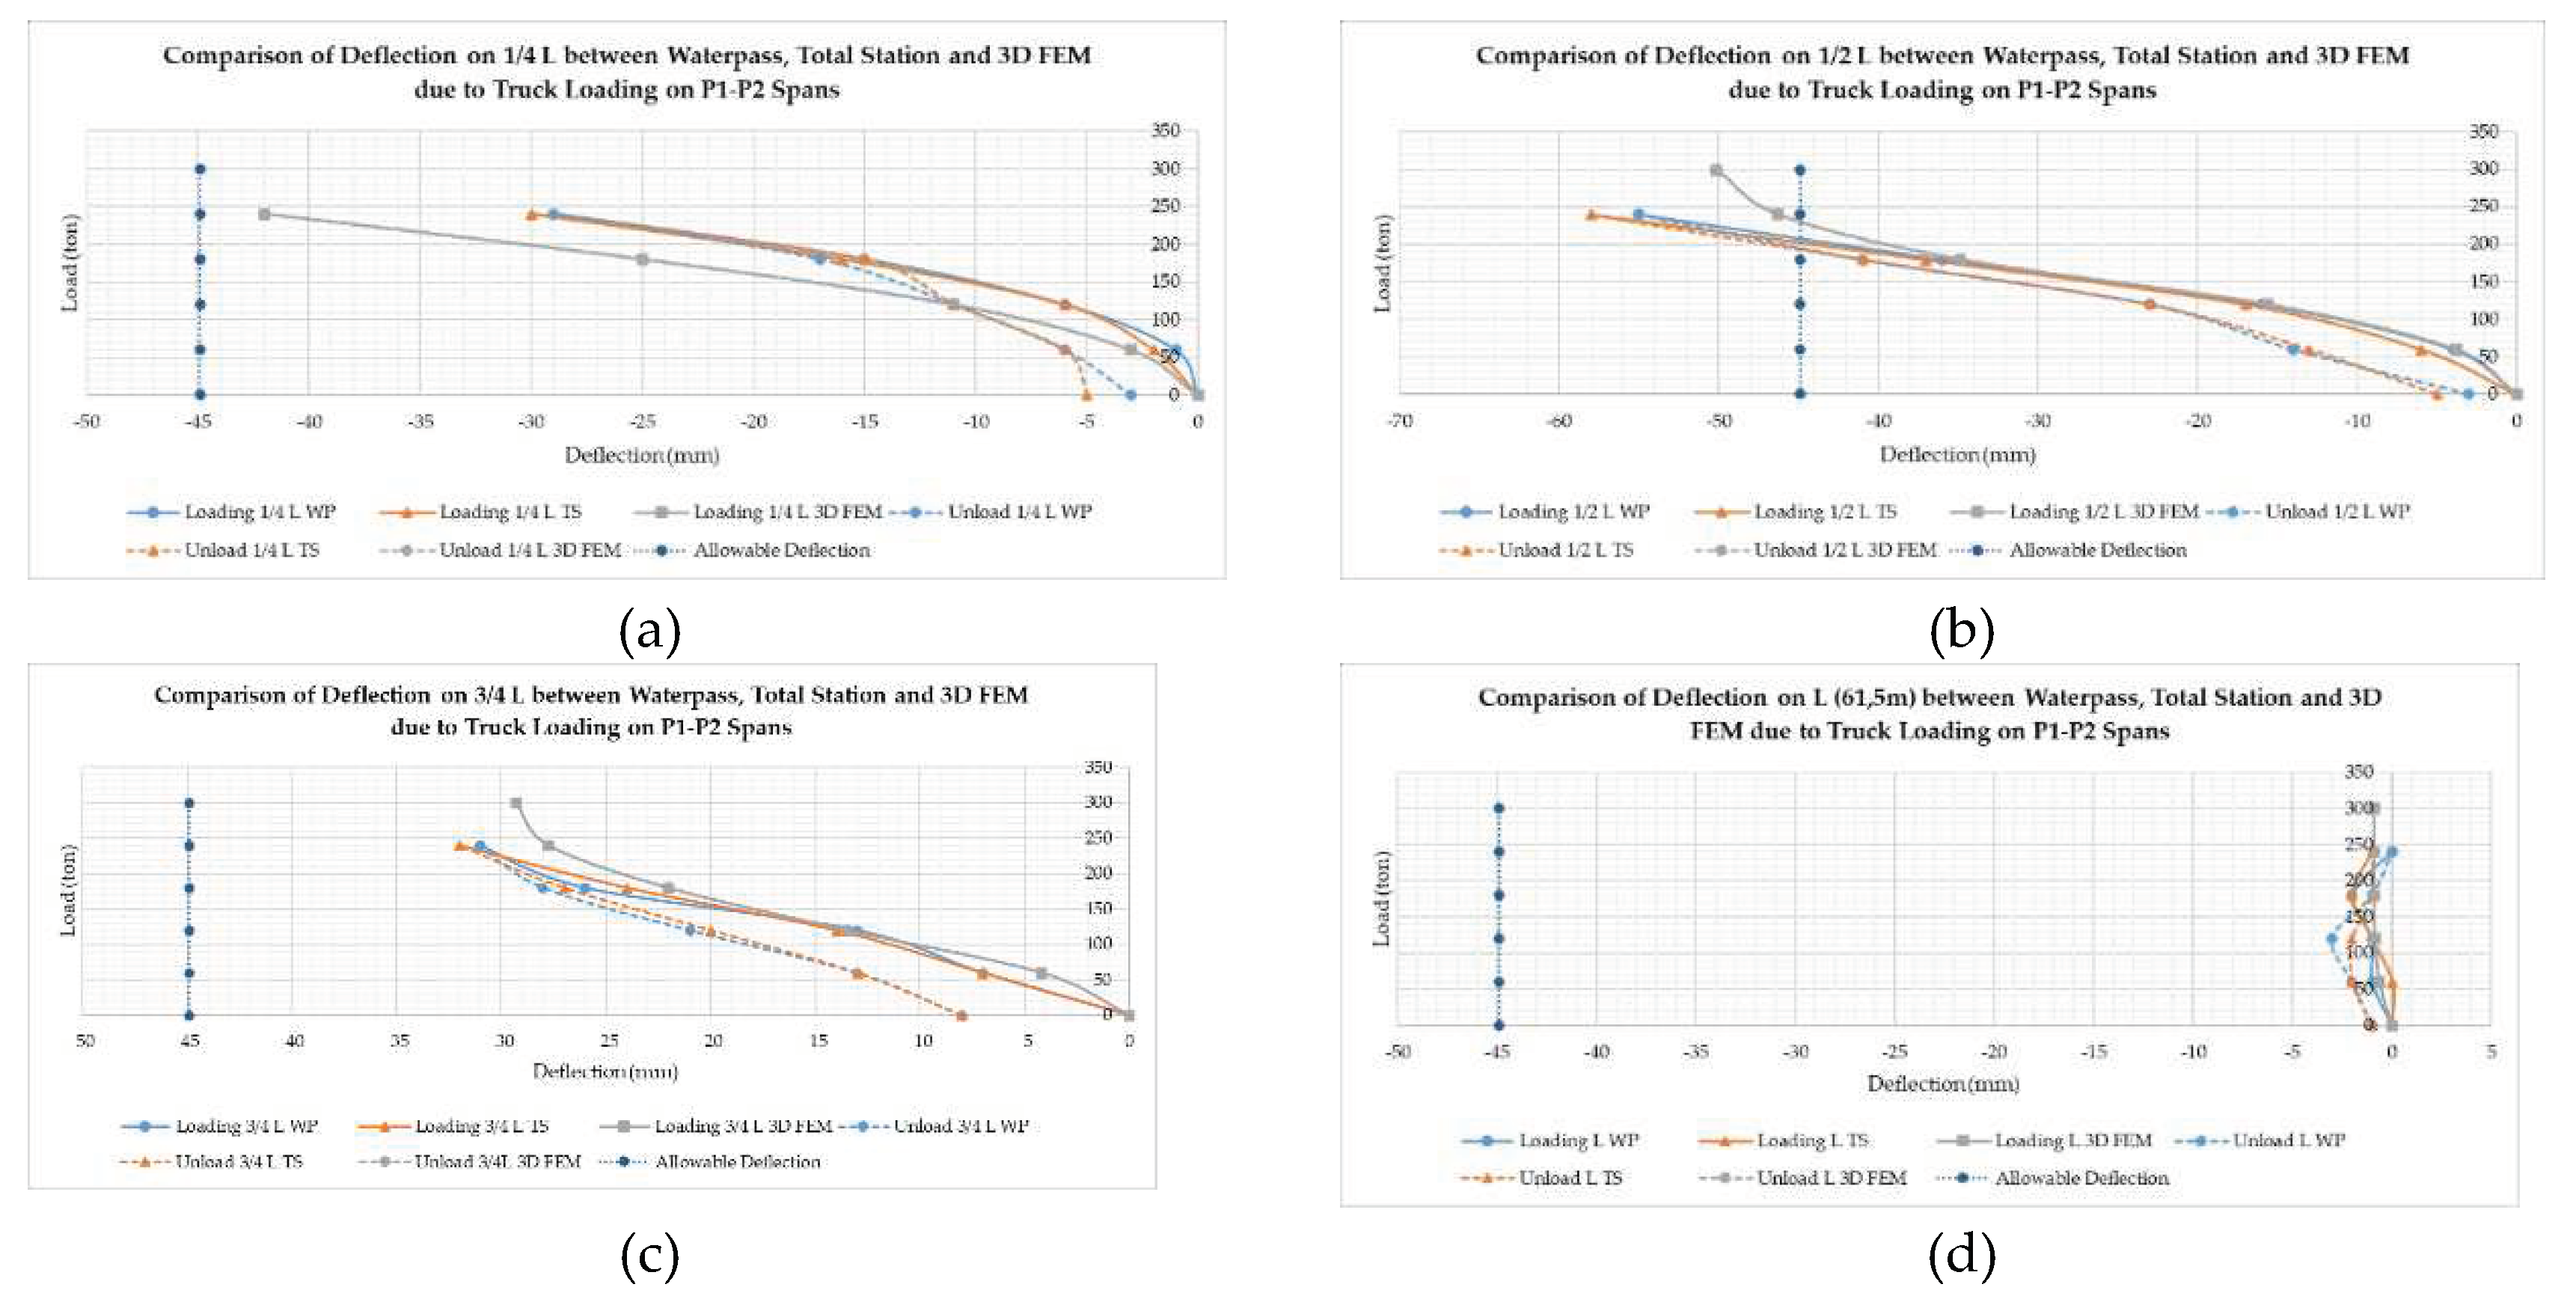
Figure 18.
Graph of Fast Fourier Transform, a) vertical 1A (f=1.18 Hz); b) vertical 1B (f=1.87 Hz); c) vertical 1C (f=1.17 Hz); d) vertical 2A (f=1.88 Hz); e) vertical 2B (f=1.18 Hz); f) vertical 2C (f=1.12 Hz).
Figure 18.
Graph of Fast Fourier Transform, a) vertical 1A (f=1.18 Hz); b) vertical 1B (f=1.87 Hz); c) vertical 1C (f=1.17 Hz); d) vertical 2A (f=1.88 Hz); e) vertical 2B (f=1.18 Hz); f) vertical 2C (f=1.12 Hz).
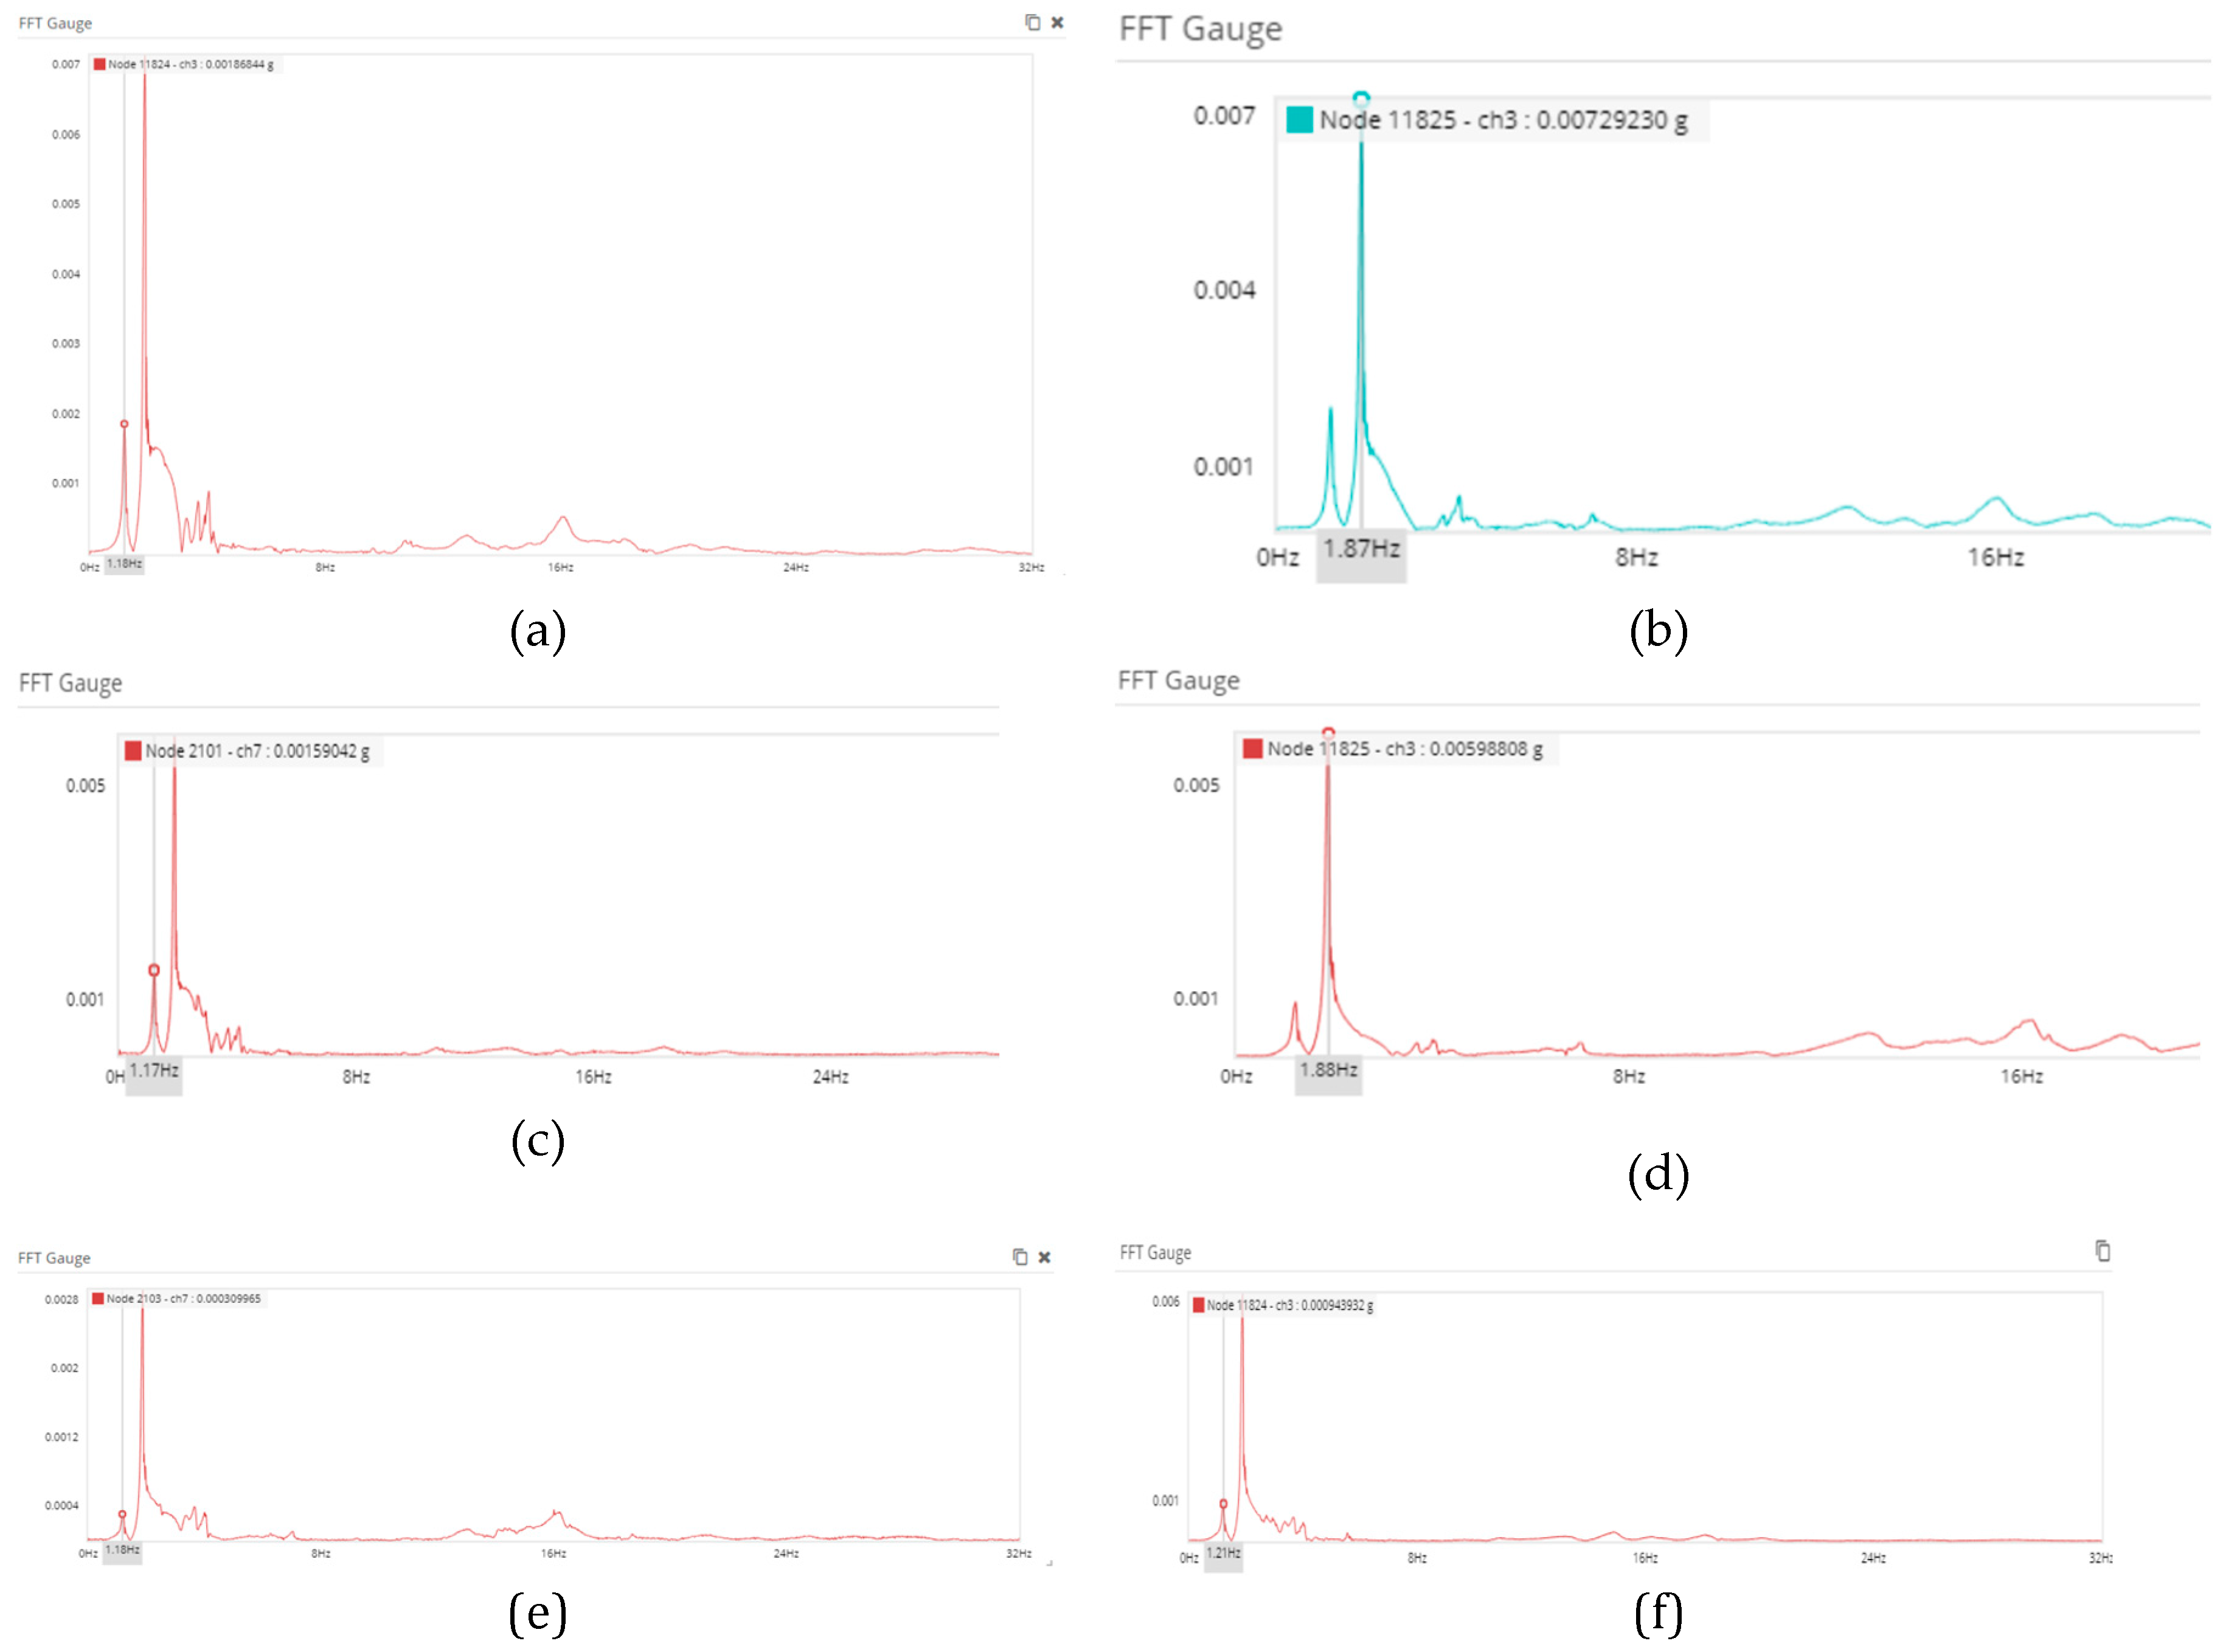
Figure 19.
Mode shape of bridge with, (a) Mode 1 f=1.19 Hz; (b) Mode 2 f=1.95 Hz; (c) Mode 3 f=2.61.
Figure 19.
Mode shape of bridge with, (a) Mode 1 f=1.19 Hz; (b) Mode 2 f=1.95 Hz; (c) Mode 3 f=2.61.
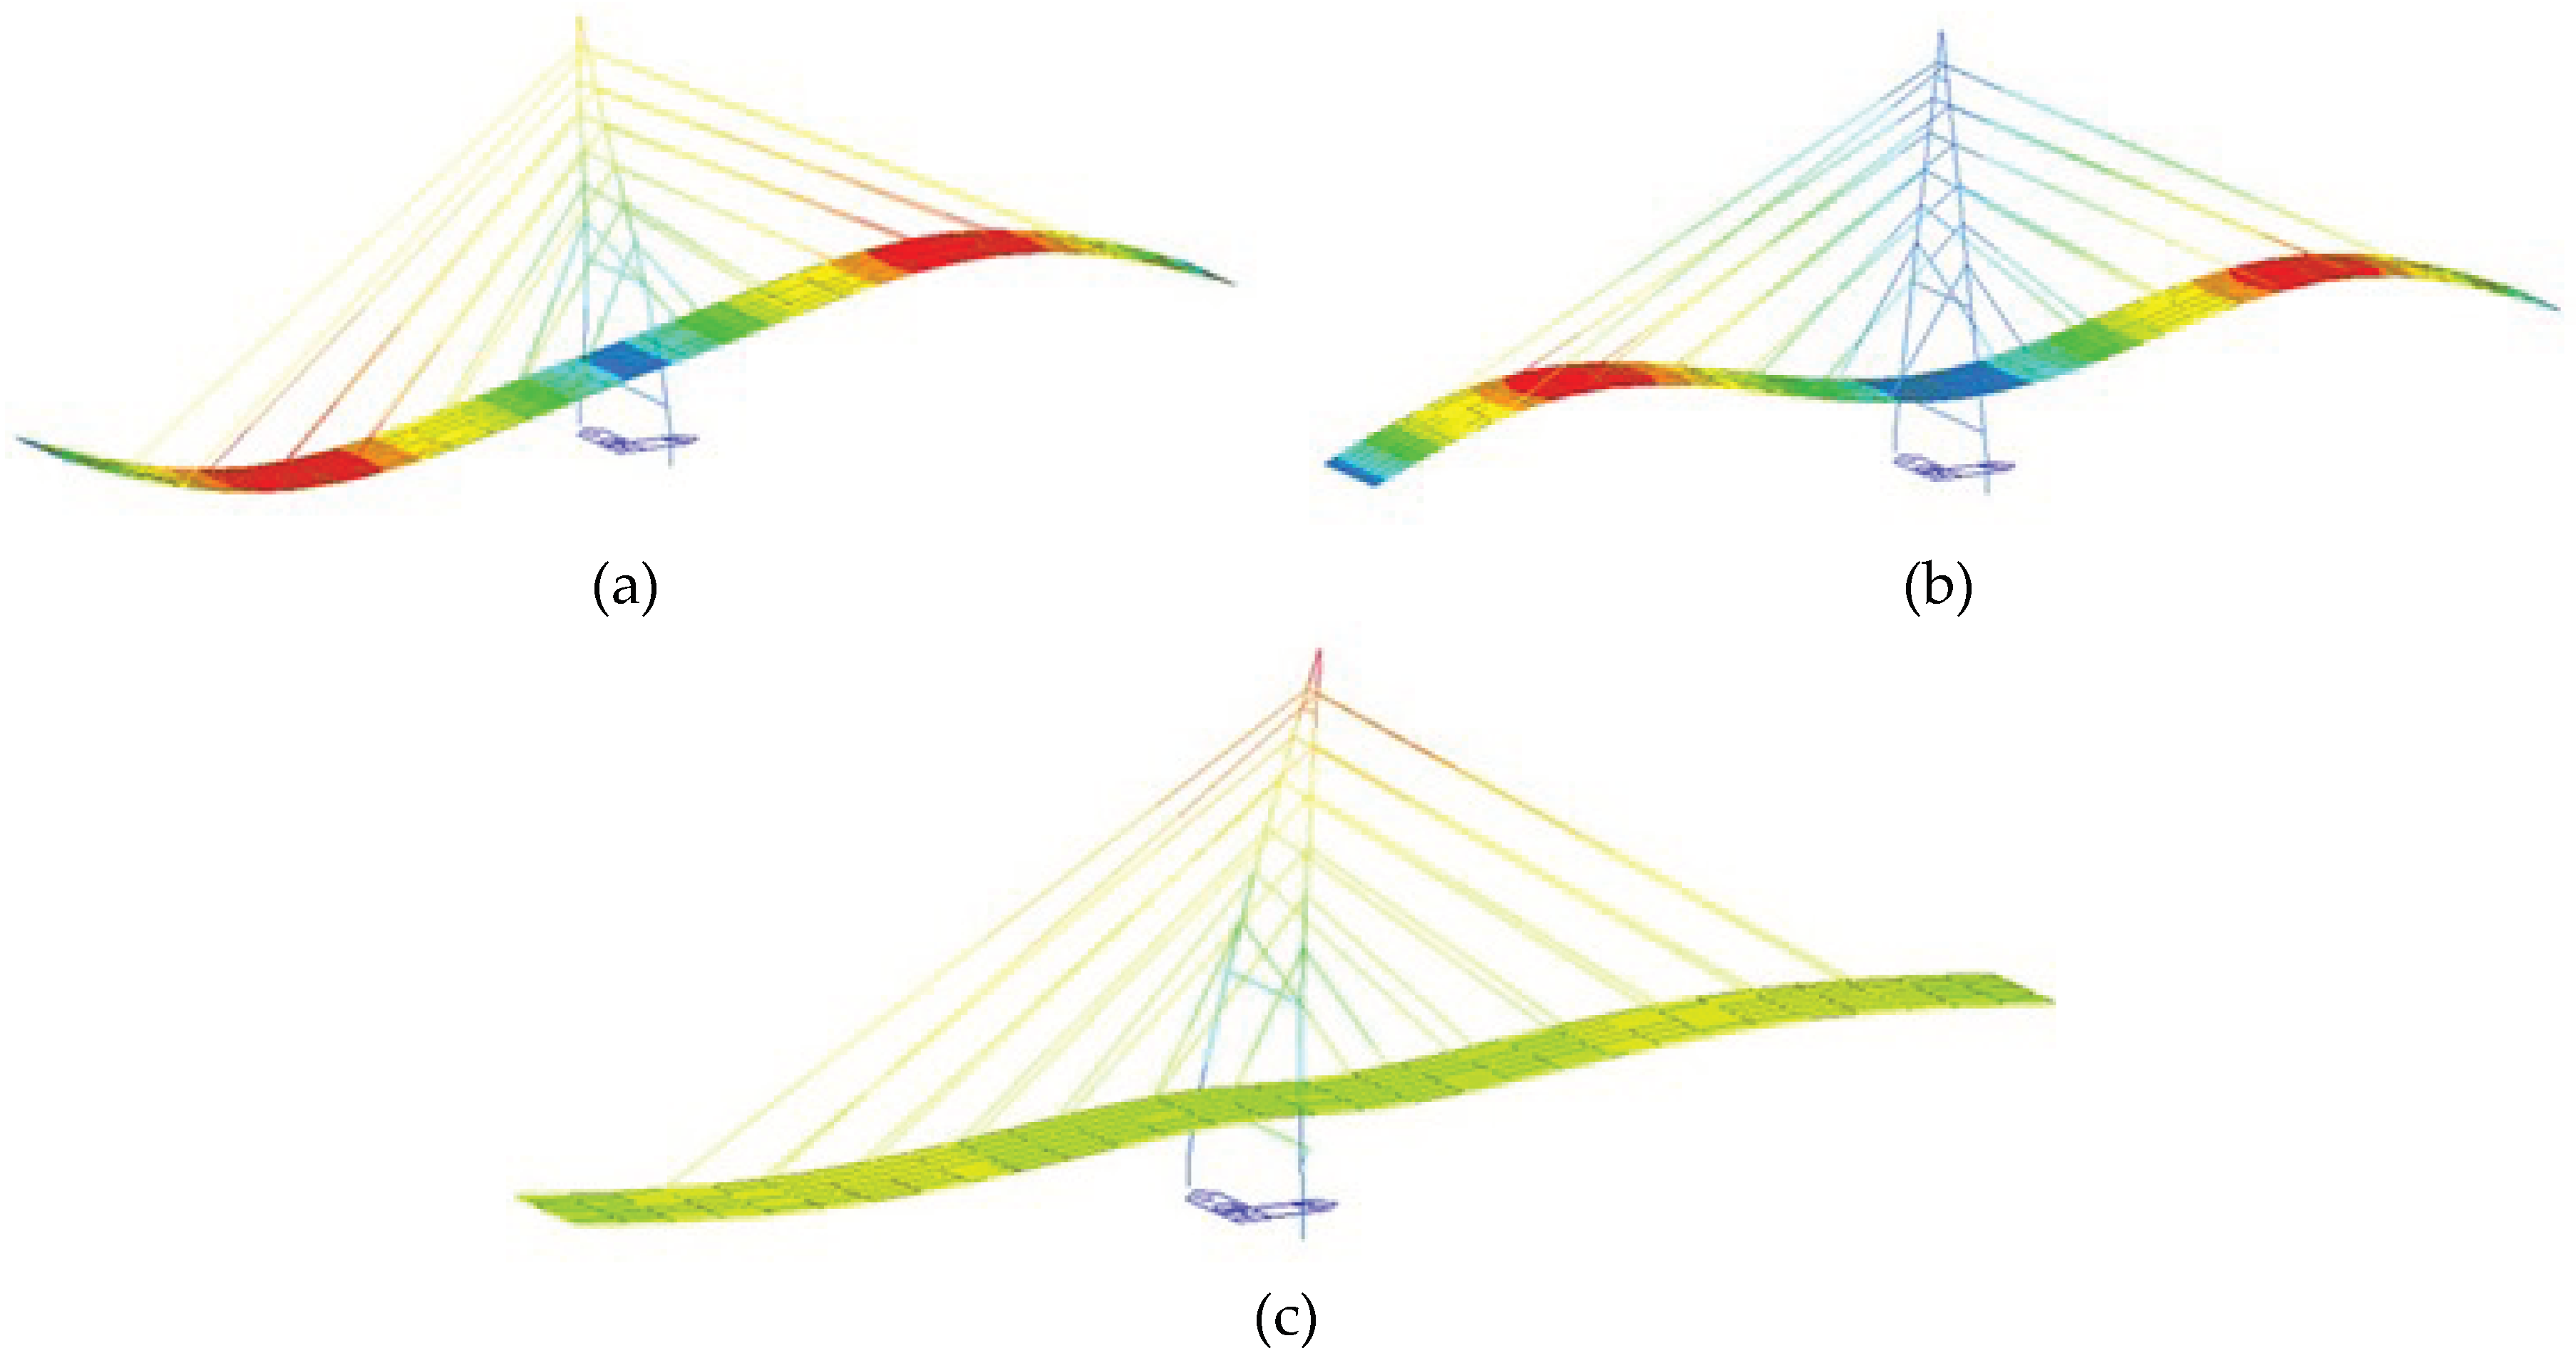
Figure 20.
Condition of the strand before and after being loaded by a 240-ton truck.
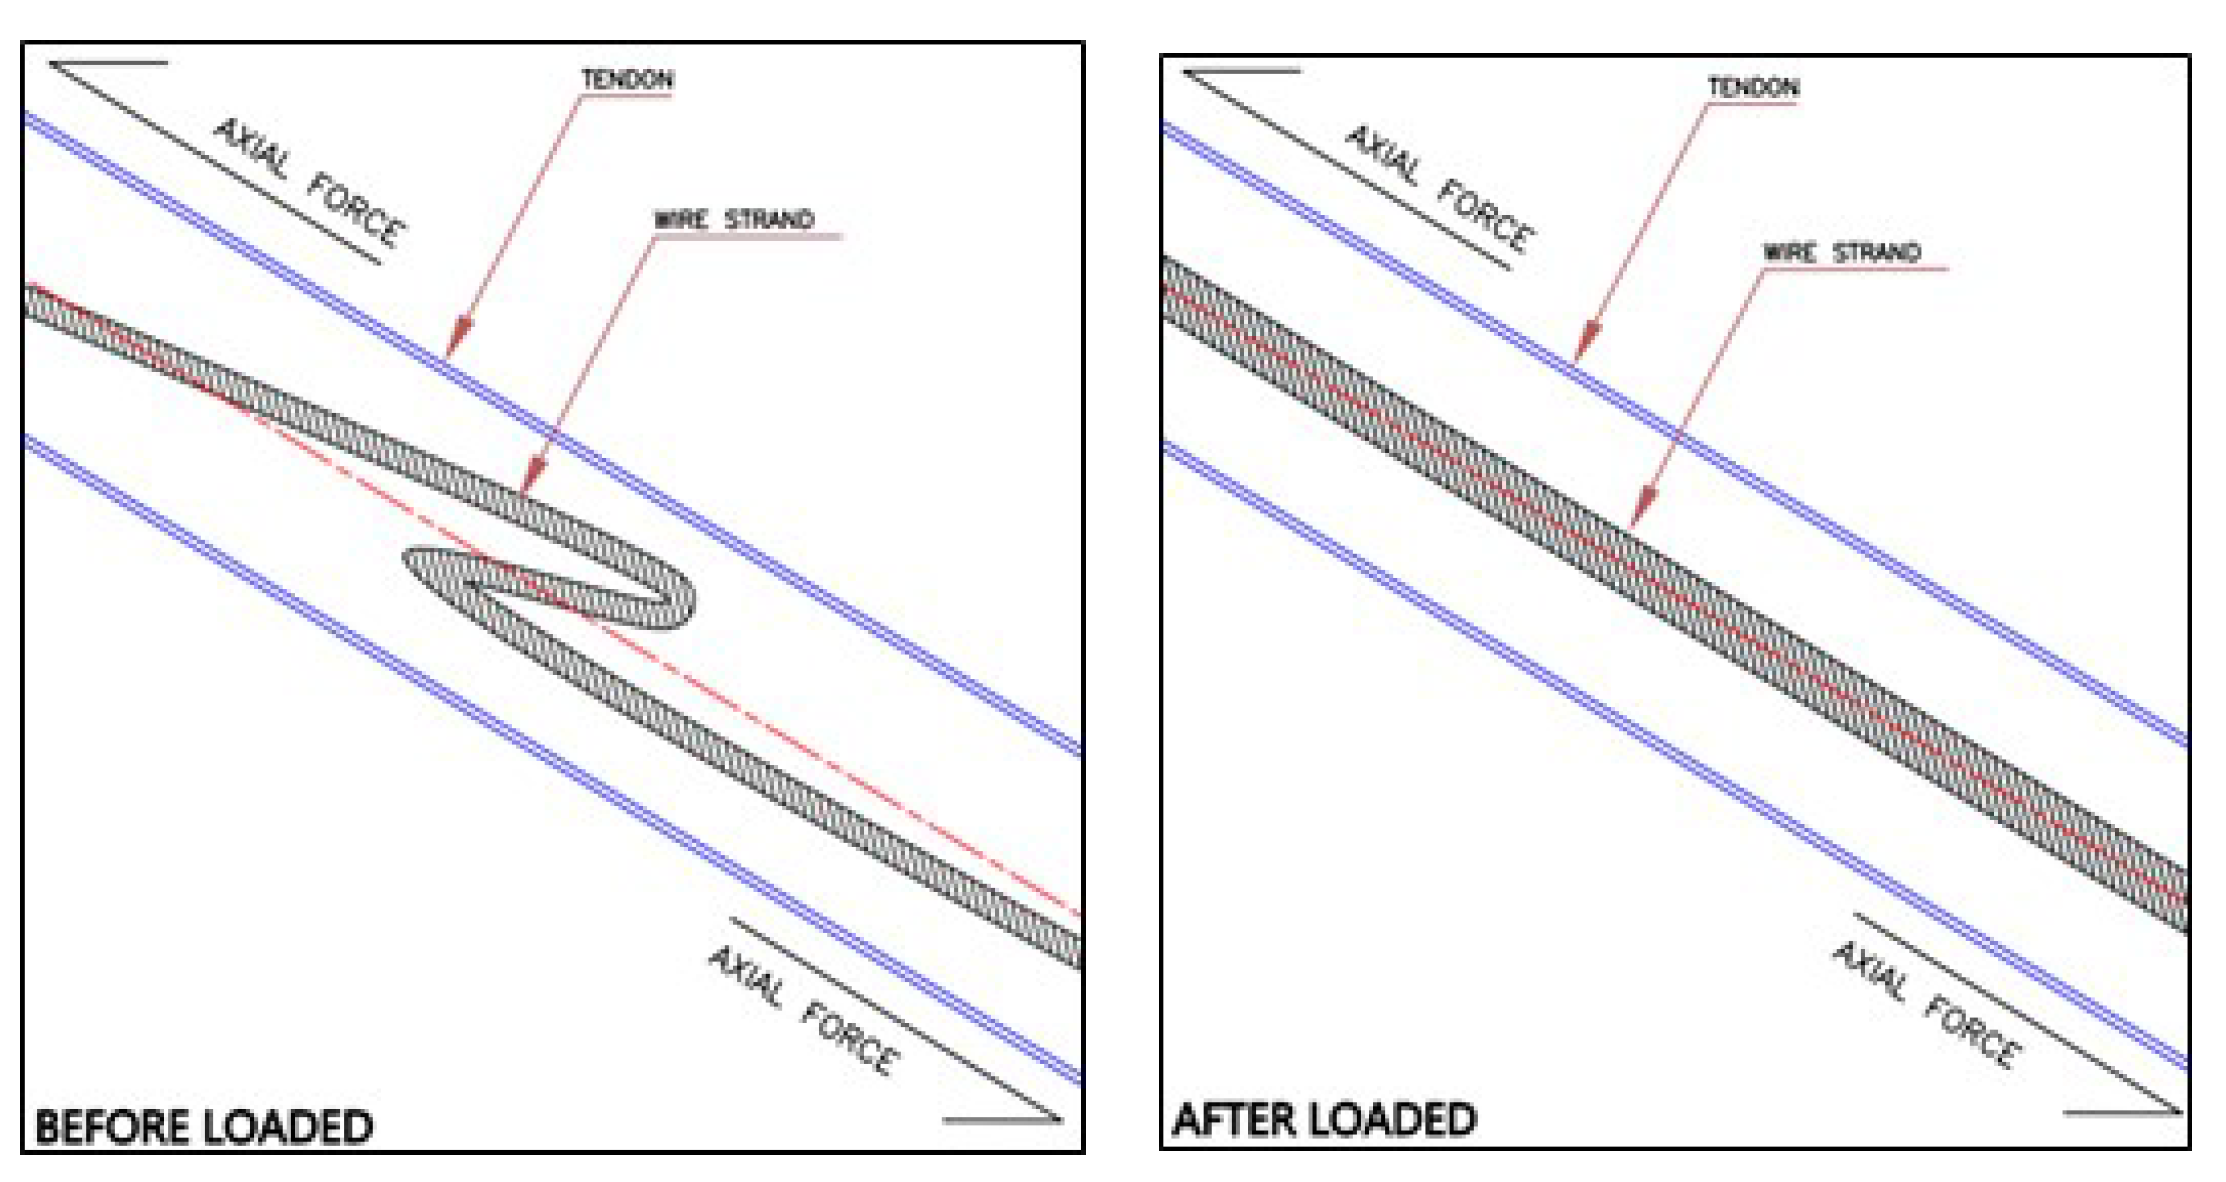
Figure 21.
Condition of end anchor on pylon that has been wrapped.
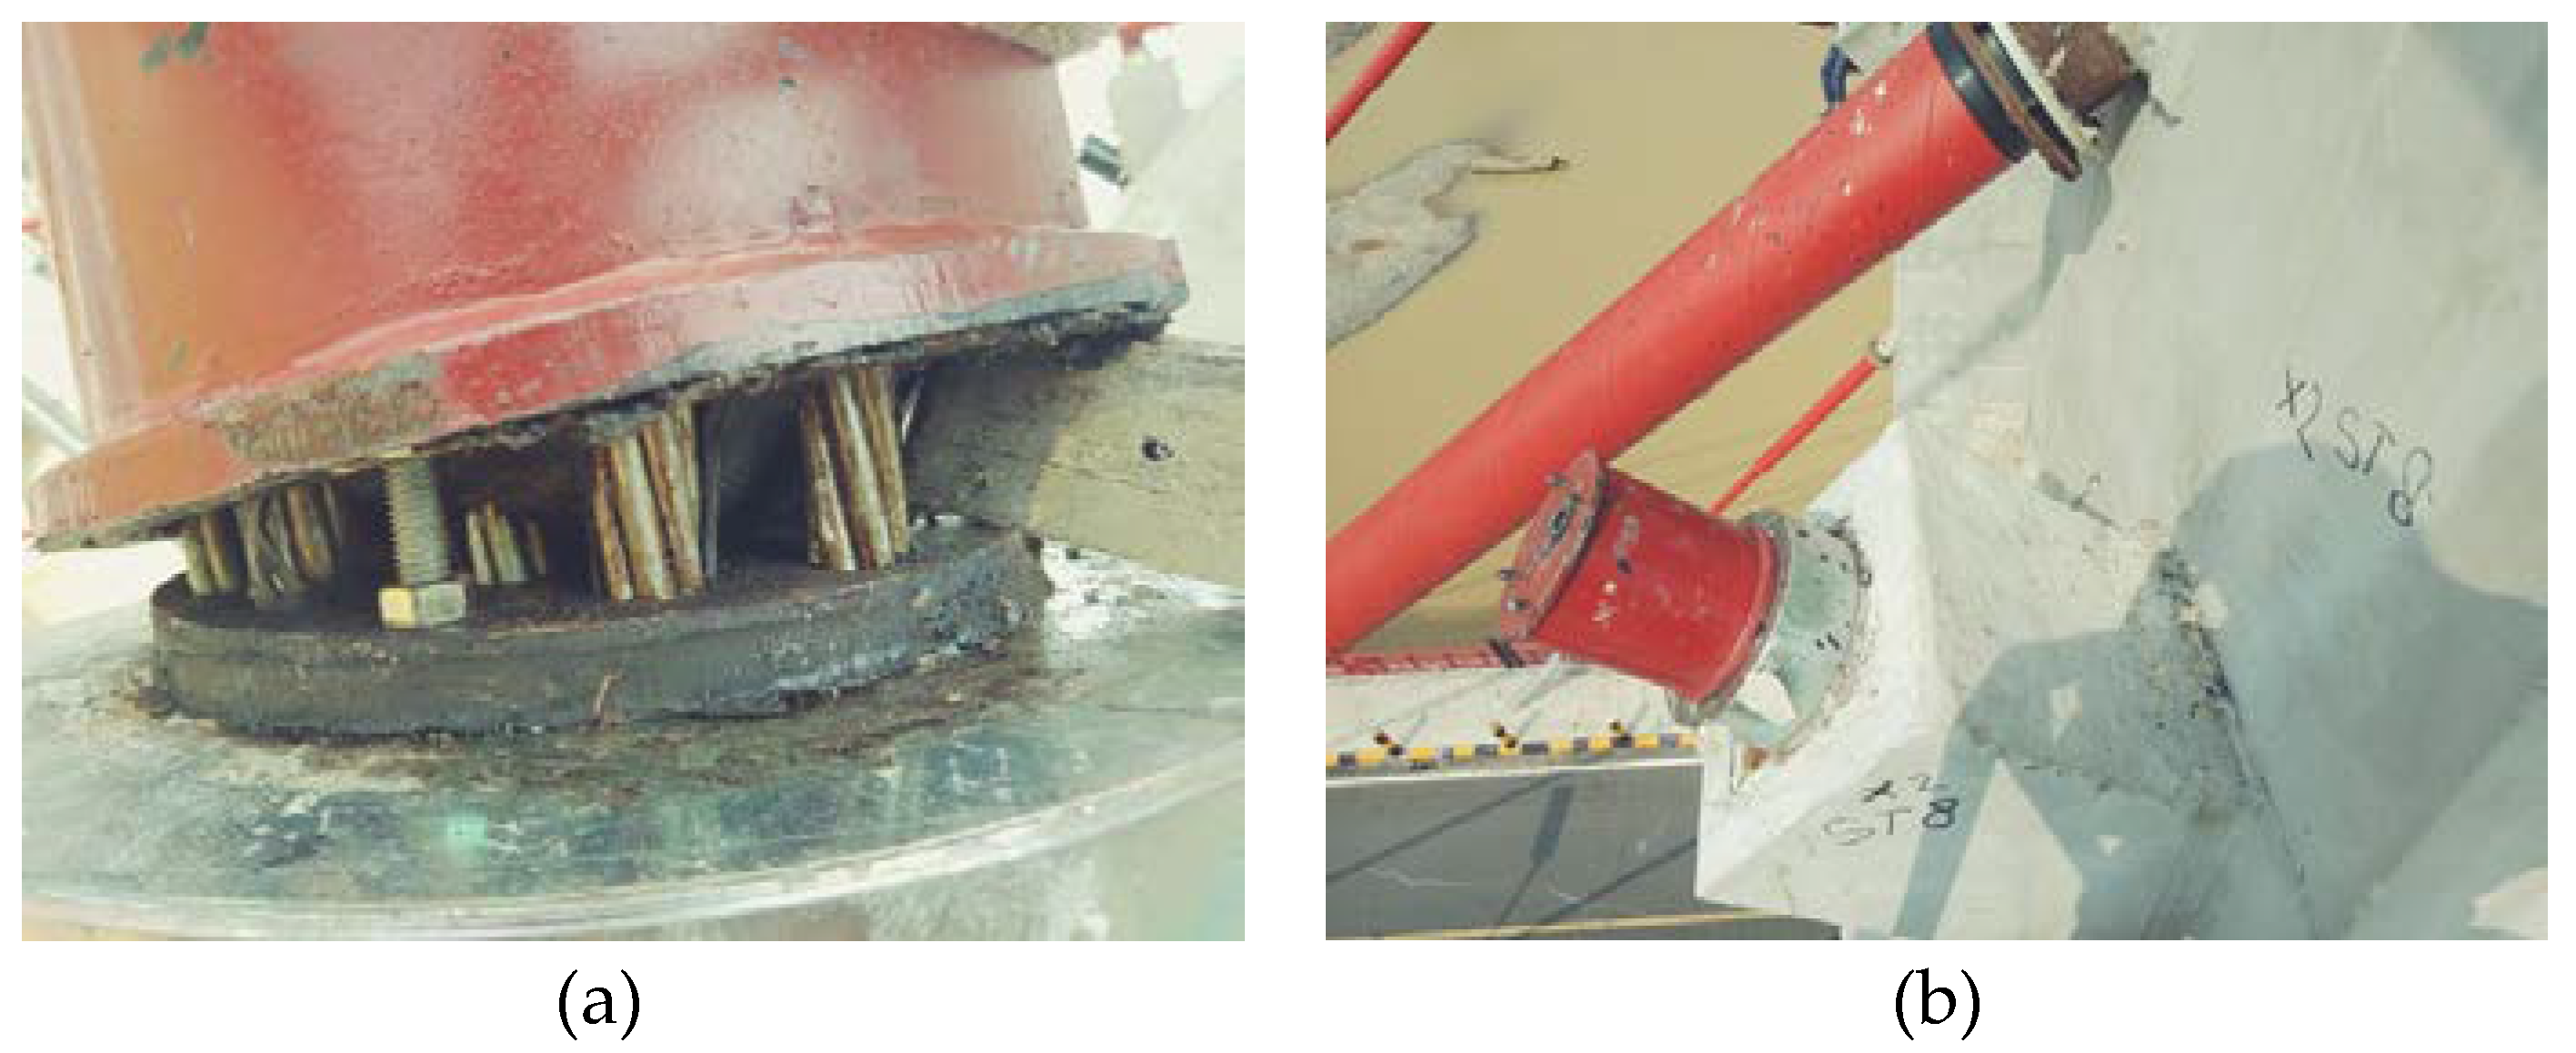

Table 1.
Material Property of Element.
| Element | Section | Size (mm) |
Elastic Modulus (MPa) | Yield Stress (MPa) |
Ultimate Stress (MPa) |
Poisson Ratio |
|---|---|---|---|---|---|---|
| Steel Element | ||||||
| Primary girder | Box | 1200x1500 thickness = 30 |
205000 | 325 | 490 | 0,3 |
| Cross girder | IWF | 800.300.16.24 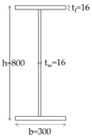
|
||||
| Stringer beam | H | 350.350.12.19 | ||||
| IWF | 350.175.7.11 | |||||
| Concrete Element | ||||||
| Main pylon (non-prismatic) |
Rectangle | 1700x4000 bottom |
25743 | - | - | 0,3 |
| 1700x1500 top | ||||||
| Crossbeam bottom pylon | 1500x100 | |||||
| Crossbeam middle pylon | 2000x1000 | |||||
| Cable Element | ||||||
| Material | : A416-270 (Normal Relaxation Strand) – ASTM A416-74 | |||||
| Diameter | : 0.6 inch (15.24 mm) | |||||
| Diameter+epoxy | : 0.648 inch (16.46 mm) | |||||
| Modulus elasticity | : E= 195000 MPa | |||||
| Poisson ratio | : = 0.3 | |||||
| Ultimate stress | : Fs’=1861.6 MPa | |||||
| Yield stress | : Fpy = 1675.4 MPa | |||||
| Allowable stress (0,45 ultimate stress) |
: Fallow = 837.7 MPa | |||||
Table 2.
Cable forces.
| Cable | Cable Force (N) | Number of strands |
|---|---|---|
| ST 1, 12 | 1254825 | 22 |
| ST 2, 11 | 850768 | 22 |
| ST 3, 10 | 556230 | 22 |
| ST 4, 9 | 513760 | 22 |
| ST 5, 8 | 573650 | 22 |
| ST 6, 7 | 636090 | 19 |
Table 3.
Boundary condition of the 3D model.
| Node/DOF | Dx | Dy | Dz | Rx | Ry | Rz |
|---|---|---|---|---|---|---|
| 1 | 0 | 1 | 1 | 0 | 0 | 0 |
| 2 | 0 | 1 | 1 | 0 | 0 | 0 |
| 3 | 0 | 0 | 1 | 0 | 0 | 0 |
| 4 | 0 | 0 | 1 | 0 | 0 | 0 |
| 5 | 1 | 1 | 1 | 1 | 1 | 1 |
| 6 | 1 | 1 | 1 | 1 | 1 | 1 |
| 7* | 1 | 1 | 1 | 0 | 0 | 0 |
| 8* | 1 | 0 | 1 | 0 | 0 | 0 |
| 1: degree of freedom in this direction is restrained | ||||||
| 0: degree of freedom to this direction is released | ||||||
| *: the boundary condition is link | ||||||
Table 4.
Schematic of dynamic load test.
| Scheme | Load Impact Position | Accelerometer Position |
|---|---|---|
| 1A | L/2 of P1–P2 | L/2 of P1-P2 |
| 1B | L/4 of P1-P2 | |
| 1C | Sidewalk of P1-P2 | |
| 2A | L/2 of P2–P3 | L/2 P2-P3 |
| 2B | 3L/4 P2-P3 | |
| 2C | Sidewalk P2-P3 |
Disclaimer/Publisher’s Note: The statements, opinions and data contained in all publications are solely those of the individual author(s) and contributor(s) and not of MDPI and/or the editor(s). MDPI and/or the editor(s) disclaim responsibility for any injury to people or property resulting from any ideas, methods, instructions or products referred to in the content. |
© 2024 by the authors. Licensee MDPI, Basel, Switzerland. This article is an open access article distributed under the terms and conditions of the Creative Commons Attribution (CC BY) license (http://creativecommons.org/licenses/by/4.0/).
Copyright: This open access article is published under a Creative Commons CC BY 4.0 license, which permit the free download, distribution, and reuse, provided that the author and preprint are cited in any reuse.


