
Submitted:
26 December 2023
Posted:
26 December 2023
You are already at the latest version
Abstract
The study focuses on the impact of new methods for inhibiting malolactic fermentation in white wines on their analytical and sensory properties. Enological preparations with different mecha-nisms of effect were tested: fumaric acid, chitosan, Estaan (a preparation based on tannin inhibi-tion), medium-chain fatty acids (MCFA), sulphur dioxide and a control variant where malolactic fermentation (MLF) was performed. The samples underwent analysis through HPLC (high-performance liquid chromatography) to determine concentrations of malic and lactic acid, as well as biogenic amines. GC (gas chromatography) analysis was used to monitor volatile sub-stances, alongside sensory evaluation. The study demonstrated a significant influence of indi-vidual enological preparations on the aromatic profile of the examined wines. The SO2 and MCFA variants exhibited the highest concentrations of volatile substances within the esters group, spe-cifically isoamyl acetate, 1-hexyl acetate and phenylethyl acetate. Conversely, the fumaric acid and Estaan variants displayed the lowest concentrations of these esters. The most notable disparities were observed in acetoin concentration, with the MCFA variant exhibiting the lowest values. Additionally, the chitosan variant showed higher concentrations of putrescine and spermidine compared to the MCFA and fumaric acid variants, which presented the lowest levels.
Keywords:
inhibition
; malolactic fermentation
; chitosan
; fumaric acid
; medium-chain fatty acids
; tannins
1. Introduction
Malolactic fermentation (MLF) is a biotechnological process performed by lactic acid bacteria predominantly used in red wines, and also in some white wines, to achieve more stable wines with improved sensory profiles [1].
However, MLF can lead to undesirable effects, such as excessive de-acidification, which can result in microbial spoilage [2], the formation of undesirable toxic molecules like biogenic amines or ethyl carbamate [3], and reduced colour intensity (up to 30% in some cases) and stability [4].
In recent years, the loss of freshness due to high pH values and excessive alcohol content has become a characteristic issue in warmer regions. Inhibiting MLF presents an intriguing method to preserve malic acid and retain wine freshness [5].
SO2 is extensively used in enology to control MLF. However, its conversion into combined sulphites diminishes its long-term effectiveness and can cause health problems for sensitive individuals. Therefore, the industry aims to minimise its content [6].
Various techniques and strategies, including High Hydrostatic Pressure, Ultrasound, Pulsed Electric Fields, Pulsed Light, Ionising Irradiation, e-Beam Irradiation, Ozone and electrolysed water, as well as the addition of lysozyme, chitosan, dimethyl dicarbonate, have been described to reduce SO2 levels in wines [7,8].
Lysozyme, at a dose of 500 mg.L-1, hydrolyses cell wall peptidoglycan, resulting in cell lysis and death. Its addition can aid in controlling spoilage by lactic acid bacteria (LAB), reducing acetic acid production and the formation of biogenic amines. However, it is disadvantaged by its precipitation due to red wine phenols, significantly reducing its effectiveness in actual winemaking conditions [9,10,11].
In wine production, chitosan functions as an antioxidant, aiding in clarification, fining, and the chelation of heavy metals [12,13]. It also has the ability to counteract the main spoilage yeast B. bruxellensis [14]. Its efficiency remains independent of the chemical features of the beverage, especially within the characteristic pH range of fermented beverages, and it is removed after treatment [14,15,16]. Chitosan reacts with anionic peptidoglycans in gram-positive LAB bacteria, while in gram-negative bacteria, the target is the anionic surface of the lipopolysaccharide [17]. The degree of acetylation of chitosan and the pH of the medium determine the charge density and consequently the level of antibacterial activity [18].
Fumaric acid, structurally similar to malic acid, acts as a competitive inhibitor for the active site of the malolactic enzyme [19]. It exists as the conjugate acid of fumarate, primarily present in its ionised form at wine pH. Fumarate serves as a significant intermediate in Krebs and urea cycles, potentially absorbed by yeasts and transformed into L-malate. Additionally, it possesses antioxidant and anti-inflammatory properties in its ester forms [20,21,22,23,24,25].
Medium-chain fatty acids (MCFA) (C6 to C12) are produced in small amounts by Saccharomyces cerevisiae during fermentation [26,27]. Decanoic and dodecanoic acids are the most common fatty acids in wine. At higher concentrations, they exert an inhibitory effect on LAB, with their toxicity increasing at low pH, indicating that the undissociated molecule is the toxic form. This form easily permeates membrane phospholipids, entering the cell through passive diffusion. Portions of these acids may be integrated into the plasma membrane, altering its composition and permeability. At concentrations of 20 mg L-1 for decanoic acid and 5 mg L-1 for dodecanoic acid, the ATPase activity of O. Oeni is reduced by approximately 5% and 42%, respectively. The toxicity of MCFA escalates in the presence of ethanol [28].
Potential alternatives to using SO2 are phenolic compounds (PCs), natural constituents of grapes and wines. PCs have been reported to inhibit the growth of LAB in a concentration-dependent manner [29,30,31].
The inhibitory effect of wine polyphenols on LAB has been extensively studied and confirmed for individual compounds against isolated bacteria, primarily O. Oeni species [32,33,34,35,36,37,38,39,40]. Consequently, polyphenols have been suggested as a substitute for sulphites in controlling the growth and metabolism of LAB during winemaking [41,42]. The inhibitory mechanism of polyphenols revolves around their ability to alter the structure of the cell membrane, causing the leakage of bacterial cell components such as proteins, nucleic acids and inorganic ions [43,44].
Inhibiting MLF and associated undesirable LAB also contributes to reducing the concentration of biogenic amines and carbamate in wines. Even when the formation of biogenic amines is controlled by using selected bacteria strains with low histidine decarboxylase activity [45] most of these toxic compounds are produced during MLF or by uncontrolled bacterial spoilage [46].
This study’s novelty lies in comparing the effect of new preparations to inhibit MLF, based on different inhibition mechanisms: fumaric acid, chitosan, Estaan (an oenological preparation based on polyphenols), MCFA, compared to a control experiment using SO2. The effect on volatile wine compounds was determined using GC, and the impact on sensory properties was assessed via quantitative descriptive analysis (QDA) sensory analysis. Additionally, concentrations of biogenic amines, malic and lactic acids were determined by HPLC to evaluate the effect on MLF inhibition.
2. Materials and Methods
2.1. Design of experiment
The experiment involved Hibernal variety grapes harvested manually on October 25, 2022. After destemming and crushing, the grapes underwent pneumatic pressing. The resulting must received a treatment of 35 mg.l-1 SO2 and settled statically for 24 hours. From this settling, 400 L of must was obtained and fermented using active dry yeasts (a neutral strain of Saccharomyces cerevisiae). Initial juice parameters were as follows: sugar content – 195 g.L-1; pH- 3.29; TA- 8.22 g.L-1; YAN- 119 mg.L-1. Alcoholic fermentation occurred at a temperature range of 16–18 °C for 12 days. Subsequently, the wine was divided into smaller glass vessels (2 x 30 L) and subjected to the respective treatments. Two replicates (2 x 30 L) were prepared for each experimental variant. Experimental variants: 1. Control – without treatment; 2. Estaan 4 ml.L-1; 3. Fumaric acid (Protect F) 4 g.L-1; 4. MCFA 10 mg.L-1 + SO2 40 mg.L-1; 5. SO2 50 mg.L-1; 6. Chitosan 150 mg.L-1. After four months (8th of March), samples were taken for the needs of chemical and sensory analysis. Some of the wines were also bottled without finalisation, and on 18th of September one more control chemical analysis was performed.
2.2. Determination of basic analytical parameters in wines
The basic parameters of the resulting wine (alcohol, pH, residual sugar, titratable acidity, malic acid, lactic acid, tartaric acid, acetic acid and glycerol) were determined using an Alpha FTIR analyser (Bruker, Bremen, Germany), employing the attenuated total reflection sampling technique. Prior to the initial measurement, the spectrometer underwent thorough rinsing with deionised water, and the background was established using a blank sample (deionised water). For the analyses, 1 mL samples were extracted with a syringe; 0.5 mL was allocated for system rinsing, while the remaining 0.5 mL was analysed three times. The obtained values were automatically assessed using the OpusWine software (Bruker, Bremen, Germany) [47].
2.3. Determination of individual volatile compounds by GC
The concentration of individual volatile compounds in the wine was determined via the extraction method using methyl tert-butyl ether (MTBE): 20 mL of wine was pipetted into a 25 mL volumetric flask, along with 50 μL of 2-nonanol solution in ethanol, serving as an internal standard (at a concentration of 400 mg.L-1), and 5 mL of a saturated ammonium sulphate ((NH4)2SO4) solution. The contents of the flask were thoroughly mixed; subsequently, 0.75 mL of the extraction solvent (MTBE with an addition of 1% cyclohexane) was added. After further stirring and phase separation, the upper organic layer, along with the resulting emulsion, was transferred to a micro-test tube and centrifuged. The clear organic phase was then dried over anhydrous magnesium sulphate before GCMS analysis. The extraction and subsequent GC analysis were conducted three times. The average values and standard deviations were computed using Excel and Statistica 10. The determination took place on a Shimadzu gas chromatograph (GC-17A) equipped with an autosampler (AOC-5000) and connected to a QP detector (QP-5050A).
Identification was performed using GCsolution software (LabSolutions, version 1.20). The analysis was conducted under the following separation conditions: column: DB-WAX 30 m x 0.25 mm; 0.25 μm stationary phase polyethylene glycol. The detector voltage was set at 1.5 kV. The sample injection volume was 1 μL with a split ratio of 1:5. The carrier gas (helium) flow was 1 mL.min-1 (linear gas velocity 36 cm.s-1), and the injection port temperature was set at 180 °C. The initial column temperature was maintained at 45 °C for 3.5 minutes, followed by temperature gradients: 75 °C gradient at 6 °C.min-1, 126 °C gradient at 3 °C.min-1, 190 °C gradient at 4 °C.min-1 and 250 °C gradient at 5 °C.min-1. The final temperature was sustained for 6.5 minutes. The analysis duration was 60 minutes. The detector operated in SCAN mode with 0.25-second intervals within a range of 14–264. The identification of individual compounds involved comparing the MS spectrum and retention time with the NIST 107 library [48].
2.4. Determination of individual biogenic amines by HPLC
Biogenic amine analyses were conducted using an ExionLC high-pressure binary gradient HPLC system coupled to a 3200QTrap LC‒MSMS/MS detector (AB Sciex, Concord, Canada). The ion source employed was a Turbo V interface equipped with an electrospray ionisation probe. Data processing was carried out using Analyst 1.5.1 software (AB Sciex, Canada) [45]. The mobile phase consisted of solvent A (3 mM HCOONH4 in water) and solvent B (3 mM HCOONH4 in 95% can). The pH of both mobile phases was adjusted to 2.7 with HCOOH. The flow rate of the mobile phase was 0.5 mL min-1. The gradient elution programme was as follows: 0.00 min 100% B; 3.00 min 70% B; 7.00 min 0% B; and 7.10 min 100% B. The sample injection volume was 5 μL, and the separation temperature was set at 40 °C [49].
2.5. Sensory analysis
The sensory evaluation was conducted by a group of seven professional tasters in the sensory analysis laboratory of Mendel University in Brno. The panel of tasters, selected based on interest and availability, comprised seven enology and food science teachers and students, including five males and two females aged 25–40 years. The tasting room was specifically designed to facilitate sensory analyses under controlled conditions, following the guidelines outlined in ISO 8589 standards. The wines were blind tasted in transparent glasses by seven qualified assessors from the Institut national de l’origine et de la qualité (INAO), in accordance with ISO 8586 standards. A quantitative descriptive analysis was conducted to assess parameters such as intensity of flavour, taste, body and complexity, each rated on a scale of 1–10. Additionally, the wines were evaluated using the International Union of Oenologists (UIOE) 100-point scale system. The resulting scores for each wine were averaged, and graphs were generated to present the findings.
2.6. Statistical analysis
The data underwent statistical evaluation using Statistica 12 software. ANOVA analysis was applied followed by Fisher’s LSD test. Graphs were generated using this software.
3. Results and discussion
3.1. Determination of basic analytical parameters in wines
Table 1. displays the results of basic analytical parameters at two time intervals – post-malolactic fermentation on 3/8/2023 and after wine maturation on 9/18/2023. The control variant underwent malolactic fermentation. In most preparations, malolactic fermentation inhibition was achieved. The Estaan variant exhibited partial malic acid degradation post-maturation, while the chitosan variant showcased complete degradation, indicating the absence of inhibitory effects.
3.2. Determination of individual volatile compounds by GC-MS
Figure 1 shows concentrations of fatty acid esters and fatty acids. The most statistically significant differences were observed in the concentrations of ethyl decanoate and decanoic acid, which peaked in the MCFA and SO2 variant, while the control variant exhibited the lowest values. Lipase, released from lactic acid bacteria, metabolises lipids, thereby elevating the concentration of volatile fatty acids in wine [50]. Some studies have reported an increase in octanoic acid after malolactic fermentation [51,52,53] However, our study did not confirm this, as the control variant undergoing malolactic fermentation displayed the lowest concentration of these fatty acids. Other studies also support this, indicating that malolactic fermentation might reduce octanoic acid in wine [53,54,55].
The MCFA preparation comprises octanoic, decanoic and dodecanoic acids in varying proportions. Results from the study [56] reveal that the application of the investigated mixture of MCFA at doses of 10 and 20 mg.L-1 did not lead to an increase in the content of individual fatty acids compared to the control variant.
Alcoholic fermentation in wine production plays a crucial role in generating higher alcohols [57]. These alcohols contribute desirable complexity when their concentration is below 300 mg. L-1, but if exceeding 400 mg.L-1, they can detrimentally affect the wine’s aromatic quality [58].
Figure 2 displays the concentrations of 1-propanol, benzyl alcohol, methionol and acetoin. The variant using fumaric acid (15.9 µg.L-1) contained the highest concentration of 1-propanol, while the chitosan variant contained the least (11.8 µg.L-1). Significant differences were noted in the concentration of benzyl alcohol, with the highest concentration in the chitosan variant (363 µg.L-1) and the control (249 µg.L-1), and the lowest concentrations in the Estaan, MCFA, SO2 and fumaric acid variants (38.5 µg.L-1- 56 µg.L-1).
Methionol, known to have a negative impact on wine, ranged from 404 µg.L-1 – 528 µg.L-1. The lowest concentrations were in the chitosan and control variants (404 µg.L-1 and 434 µg.L-1), while the highest were in the MCFA, SO2 and fumaric acid (521 µg.L-1 – 528 µg.L-1).
Acetoin, in higher concentrations, negatively affects wine. The variant Estaan contained the highest concentration (30 735 µg.L-1), followed by chitosan (3 680 µg.L-1) and control (3 315 µg.L-1). Lower values were found in the SO2 (1 169 µg.L-1) and fumaric acid (659 µg.L-1) variants, while the variant MCFA had the very lowest concentration at only 366 µg.L-1. The low acetoin concentration in the variant MCFA aligns with the results of the study by Licek et al. (2020), indicating that the addition of MCFA results in a lower production of carbonyl compounds such as acetaldehyde or acetoin [59].
MCFA positively affects the reduction of acetoin and diacetyl content, responsible for buttery tones in wine aroma. These compounds are formed during alcoholic fermentation [60] but higher concentrations are produced by lactic acid bacteria during malolactic fermentation [61].
According to the study by Licek [59] acetoin levels (3.14–14.25 mg.L-1) for all variants were well below the reported odour threshold of 150 mg.L-1. However, the measured diacetyl content could be sensory-active. The perception threshold of diacetyl is strongly influenced by the wine style [62]. Nevertheless, reducing acetoin and diacetyl could be another positive effect of the addition of MCFA.
Figure 3 presents the concentrations of ethyl acetate, isoamyl acetate, 1-hexyl acetate and phenylethyl acetate. The control (33 896 µg.L-1) and chitosan (28 974 µg.L-1) variants contained the highest concentration of ethyl acetate, while the fumaric acid (22 506 µg.L-1) and MCFA (23 012 µg.L-1) variants showed the lowest concentrations, all exceeding the odour threshold [59] (12 300 µg.L-1). Studies have reported that ethyl acetate exhibits pineapple, fruity, solvent and balsamic scents [63].
More significant differences were observed for other aromatic substances. Isoamyl acetate, known for its positive sensory effect on wine, was most abundant in the SO2 (710 µg.L-1) and MCFA (646 µg.L-1) variants. In contrast, the control (249 µg.L-1) and fumaric acid (130 µg.L-1) variants contained the least, with concentrations below the odour threshold [60] (160 µg.L-1). Similarly, the concentrations of 1-hexyl acetate and phenylethyl acetate were highest in the SO2 and MCFA variants (56.1 µg.L-1 and 49.4 µg.L-1 for 1-hexylacetate, and 59.3 µg.L-1 and 47.2 µg.L-1 for phenylethyl acetate), and lowest in the fumaric acid variant (only 2.9 µg.L-1 for 1-hexylacetate and 5.5 µg.L-1 for phenylethyl acetate). The measured values suggest that enological preparations like MCFA and SO2 positively affect the content of significant esters, while the fumaric acid and Estaan variants contained the lowest amounts.
In a study by [64], monitoring the effect of different strains of lactic bacteria on aromatic substances, a decrease in most aromatic substances was observed in variants undergoing malolactic fermentation, indicating that inhibiting malolactic fermentation preserves the content of aromatic substances. This was also confirmed in our study, depending on the inhibitor preparation used. For example, the fumaric acid variant contained lower amounts of isoamyl acetate, 1-hexyl acetate and phenylethyl acetate than the Control, where malolactic fermentation was performed.
Significant differences among variants were also noted in the concentration of volatile phenols (Figure 4.). The chitosan variant contained the highest concentration of vinylphenols (183 µg.L-1 for vinylguaiacol and 340 µg.L-1 for vinylphenol), while the Control variant exhibited the lowest (19.2 µg.L-1for vinylguaiacol and 93.7 µg.L-1 for vinylphenol), and the fumaric acid showed 96.3 µg.L-1 for vinylguaiacol and 196 µg.L-1 for vinylphenol. Conversely, regarding ethylphenols, the Control variant contained the highest concentration (162 µg.L-1 for ethylguaiacol and 213 µg.L-1 for ethylphenol), while no ethylphenols were found in the other variants.
While the formation of vinylphenols might be associated with the activity of Saccharomycete yeasts, the creation of ethylphenols is solely attributed to the apiculate yeast Brettanomyces. The study’s findings suggest that all the preparations employed effectively inhibited these apiculate yeasts, as ethylphenols were solely detected in the control variant [65,66].
The obtained results showcase a significant influence of individual preparations on the aromatic profile of the wine. The SO2 and MCFA variants contained the highest concentrations of volatile substances from the ester group – isoamyl acetate, 1-hexyl acetate and phenylethyl acetate. Conversely, the fumaric acid and Estaan variants displayed the lowest concentrations of these esters. Concerning negative aromatic substances like methionol and acetoin, higher concentrations of methionol were measured in the MCFA, SO2 and fumaric acid variants, while the lowest were found in the control and chitosan variants. The most significant differences were observed in the concentration of acetoin. The Estaan variant exhibited the highest concentration, several times exceeding the acetoin concentration of the other variants, while the MCFA variant showed the lowest values, consistent with previous studies demonstrating that the addition of MCFA generally reduces the number of carbonyl compounds [56].
3.3. Determination of individual biogenic amines by HPLC
Biogenic amines negatively impact wine quality and could potentially pose safety concerns for consumers [67]. Amino acids in wine act as major precursors of biogenic amines. In the presence of lactic acid bacteria, these amino acids can be metabolised to produce biogenic amines [68]. Different lactic acid bacteria species possess varying abilities to metabolise amino acids for biogenic amine production. O. Oeni, the most commonly used lactic acid bacteria, also exhibits a high capability of producing biogenic amines [69,70].
Regarding the effect on the content of biogenic amines, only a very slight, statistically insignificant impact of individual preparations was observed (Figure 5.). The preparations had no discernible effect on the histamine content, as the concentration in all samples ranged from 0.43 µg.L-1 -0.45 µg.L-1. The only slight difference was noted in the concentration of putrescine and spermidine, with their highest concentration measured in the chitosan variant (1.76 µg.L-1 for putrescine and 0.83 µg.L-1 for spermidine). This concentration was higher than that in the control, where malolactic fermentation took place, and the lowest in MCFA (1.56v for putrescine) and fumaric acid (0.63 µg.L-1 for spermidine).
3.4. Sensory analysis
The Figure 6. displays the results of individual sensory characteristics such as flavour intensity, taste, body and complexity. The Estaan variant exhibited the lowest score in all sensory characteristics. Flavour intensity was higher in the SO2, MCFA and chitosan variants, while it was lowest in Estaan, fumaric acid and control. Taste intensity showed no statistically significant differences except for the Estaan and control variants. Results for body and complexity did not show statistically significant differences between individual variants.
Another Figure 7. illustrates results on a 100-point scale of sensory analysis. The best results were obtained in the SO2, MCFA and chitosan variants. These results corresponded with the results of the aromatic profile measured by gas chromatography, where the SO2 and MCFA variants exhibited the highest concentrations of positive aromatics such as esters and higher alcohols.
4. Conclusions
This study compared the influence of individual preparations recently used to inhibit malolactic fermentation to reduce the use of SO2. All oenological preparations used to inhibit malolactic fermentation demonstrated an inhibitory effect against lactic bacteria, as measured by FTIR analysis. However, after six months of wine aging, it was observed that the Estaan and chitosan variants underwent partial to complete malic acid degradation, indicating that their inhibitory effect was not permanent.
A significant effect on the content of aromatic substances in the final wine was also demonstrated. The highest ester content was determined in the SO2 and MCFA variants, while the highest 1-propanol content was found in the fumaric acid variant, and the highest benzyl alcohol content was noted in the chitosan variant. The most significant differences were observed in the concentration of acetoin, which negatively affects wine in higher concentrations. Its concentration was lowest in the MCFA variant, while in the other variants, its concentration was several times higher.
Author Contributions
Conceptualization, B.P. ; methodology, B.P. and M.K.; software, J.L.; validation, B.P. and M.K.; formal analysis, J.L.; investigation, B.P.; resources, B.P.; data curation, J.L.; writing—original draft preparation, B.P.; writing—review and editing, B.P; visualization, B.P.; supervision, M.B and J.S.; project administration, B.P., J.L. and J.S.; funding acquisition, J.S. and M.B. All authors have read and agreed to the published version of the manuscript.
Funding
This study was supported by the project “New methods to reduce SO2 in wine” IGA-ZF/2023-ST2-009.
Institutional Review Board Statement
Not applicable.
Informed Consent Statement
Not applicable.
Data Availability Statement
Data are contained within the article.
Conflicts of Interest
The authors declare no conflict of interest.
Appendix

Table A1.
Detailed results of volatile compounds content measured by GC-MS. The average values (n = 6) are supplemented by the ANOVA results (p-value) and the contribution into homogeneous groups (a, b, c, d….) according to Fisher’s LSD (least significant difference) test (α= 0.05).
Table A1.
Detailed results of volatile compounds content measured by GC-MS. The average values (n = 6) are supplemented by the ANOVA results (p-value) and the contribution into homogeneous groups (a, b, c, d….) according to Fisher’s LSD (least significant difference) test (α= 0.05).
| Compound (µg.L-1) |
Chitosan (Mean±SE) |
Control (Mean±SE) |
Estaan (Mean±SE) |
MCFA (Mean±SE) |
SO2 (Mean±SE) |
Fumaric a. (Mean±SE) |
p-value |
|---|---|---|---|---|---|---|---|
| 1-Propanol | 11.8±0.2 a | 13.7±0.4 b | 13.4±0.3 b | 14.7±0.2 c | 15.5±0.1 c | 15.9±0.3 d | p = 0.0000 |
| Benzylalcohol | 363±15 c | 249±11 b | 56±2 a | 41.5±1.1a | 46.6±1.1a | 38.5±1.2 a | p = 0.0000 |
| Methionol | 404±11 a | 434±10 a | 486±8 b | 521±11 c | 528±16 c | 528±12 c | p = 0.0000 |
| Ethyl acetate | 28 974±2273 b | 33 896±671 c | 24 921±521 a | 23 012±581 a | 23 298±439 a | 22 506±441 a | p = 0.0000 |
| Isoamyl acetate | 415±15 c | 249±28 b | 168±7 a | 646±12 d | 710±13 e | 130±2 a | p = 0.0000 |
| 1-Hexyl acetate | 28.2±0.4 c | 11.3±2.2 b | 5.6±0.2 a | 49.4±0.7 d | 56.1±0.8 e | 2.9±0.3 a | p = 0.0000 |
| 2-Phenylethyl acetate |
21.5±1.2 c | 10.9±1.6 b | 6.7±0.2 a | 47.2±0.8 d | 59.3±1.3 e | 5.5±0.1 a | p = 0.0000 |
| Ethyl octanoate | 1 390±19 c | 1 168±32 a | 1 441±21 c,d | 1 505±27 d | 1 458±45 c,d | 1 300±22 b | p = 0.0000 |
| Ethyl decanoate | 268±3 b | 212±3 a | 269±5 b | 459±9 d | 288±8 c | 268±6 b | p = 0.0000 |
| Octanoic acid | 9 522±298 b,c | 8 579±110 a | 9 215±98 b | 10 277±116 d | 9 374±101 b,c | 9 659±130 c | p = 0.0000 |
| Decanoic acid | 2637±151 b | 2197±38 a | 2 588±42 b | 4 965±97 d | 2716±61 b,c | 2 924±88 c | p = 0.0000 |
| 4-Vinylguaiacol | 183±9 e | 19.2±0.9 a | 123±4 c | 141±3 d | 123±5 c | 96.3±3.4 b | p = 0.0000 |
| 4-Vinylphenol | 340±11 e | 93.7±8.3 a | 243±6 c,d | 261±5 d | 231±4 c | 196±5 b | p = 0.0000 |
| 4-Ethylguaiacol | 0±0 a | 162±3 b | 0±0 a | 0±0 a | 0±0 a | 0±0 a | p = 0.0000 |
| 4-Ethylphenol | 0±0 a | 213±5 b | 0±0 a | 0±0 a | 0±0 a | 0±0 a | p = 0.0000 |
| Acetoine | 3680±842 c | 3315±211 b,c | 30735±1699 d | 366±29 a | 1169±74 a,b | 659±57 a | p = 0.0000 |
Table A2.
Detailed results of individual biogenic amines content measured by HPLC. The average values (n = 6) are supplemented by the ANOVA results (p-value) and the contribution into homogeneous groups (a, b, c, d….) according to Fisher’s LSD (least significant difference) test (α= 0.05).
Table A2.
Detailed results of individual biogenic amines content measured by HPLC. The average values (n = 6) are supplemented by the ANOVA results (p-value) and the contribution into homogeneous groups (a, b, c, d….) according to Fisher’s LSD (least significant difference) test (α= 0.05).
| Compound (µg.L-1) |
Estaan (Mean±SE) |
Chitosan (Mean±SE) |
Control (Mean±SE) |
MCFA (Mean±SE) |
SO2 (Mean±SE) |
Fumaric a. (Mean±SE) |
p-value |
|---|---|---|---|---|---|---|---|
| Histamin | 0.43±0.01 a | 0.43±0.01 a | 0.44±0.01 a | 0.42±0.01 a | 0.45±0.01 a | 0.44±0.01 a | p = 0.5263 |
| Phenylethylamin | 0.22±0.01 a,b | 0.22±0.01 a | 0.23±0.00 a,b | 0.24±0.01 b,c | 0.25±0.01 c | 0.25±0.00 c | p = 0.0002 |
| Putrescin | 1.59±0.06 a,b | 1.76±0.07 b | 1.75±0.04 a,b | 1.56±0.06 a | 1.66±0.08 a,b | 1.73±0.10 a,b | p = 0.2200 |
| Spermidin | 0.64±0.03 a | 0.83±0.05 b | 0.66±0.02 a | 0.70±0.02 a,b | 0.68±0.08 a | 0.63±0.07 a | p = 0.1061 |
Table A3.
Detailed results of sensory analysis results. The average values (n = 7) are supplemented by the ANOVA results (p-value) and the contribution into homogeneous groups (a, b, c, d….) according to Fisher’s LSD (least significant difference) test (α= 0.05).
Table A3.
Detailed results of sensory analysis results. The average values (n = 7) are supplemented by the ANOVA results (p-value) and the contribution into homogeneous groups (a, b, c, d….) according to Fisher’s LSD (least significant difference) test (α= 0.05).
| Category | SO2 (Mean±SE) |
MCFA (Mean±SE) |
Estaan (Mean±SE) |
Chitosan (Mean±SE) |
Fumaric a. (Mean±SE) |
Control (Mean±SE) |
p-value |
|---|---|---|---|---|---|---|---|
| Score (100 points) | 84.3±1.2 c | 82.8±1.0 b,c | 78.7±1.6 a | 82.5±1.0 a,b,c | 80.3±1.5 a.b | 78.8±1.7 a | 0.034 |
|
Intensity of flavour |
7.5±0.3 c | 7.0±0.4 b,c | 5.3±0.5 a | 7.0±0.4 b,c | 6.0±0.7 a,c | 6.2±0.5 a,b,c | 0.042 |
| Intensity of taste | 6.3±0.3 a | 6.5±0.6 a | 5.3±0.4 a | 6.3±0.6 a | 6.2±0.7 a | 5.3±0.5 a | 0.453 |
| Body | 5.7±0.4 a | 5.5±0.7 a | 5.0±0.0 a | 6.5±0.7 a | 6.0±0.8 a | 6.2±0.3 a | 0.487 |
| Complexity | 6.2±0.5 b | 6.2±0.6 b | 4.3±0.7 a | 6.7±0.6 b | 6.2±0.8 b | 5.5±0.3 a,b | 0.116 |
References
- Davis, C.; Wibowo, D.; Eschenbruch, R.; Lee, T.; Fleet, G. Practical Implications Of Malolactic Fermentation - A Review. American Journal Of Enology And Viticulture 1985, 36, 290–301. [Google Scholar] [CrossRef]
- Bauer, R.; Dicks, L. Control Of Malolactic Fermentation In Wine. A Review. South African J Enol Viticult 2004, 25. [Google Scholar] [CrossRef]
- Lonvaud-Funel, A. Lactic Acid Bacteria In The Quality Improvement And Depreciation Of Wine. Antonie Van Leeuwenhoek International Journal Of General And Molecular Microbiology 1999, 76, 317–331. [Google Scholar] [CrossRef]
- Vanvuuren, H.; Dicks, L. Leuconostoc Oenos - A Review. American Journal Of Enology And Viticulture 1993, 44, 99–112. [Google Scholar] [CrossRef]
- Morata, A.; Bañuelos, M.; López, C.; Song, C.; Vejarano, R.; Loira, I.; Palomero, F.; Lepe, J. Use Of Fumaric Acid To Control Ph And Inhibit Malolactic Fermentation In Wines. Food Additives And Contaminants Part A-Chemistry Analysis Control Exposure & Risk Assessment 2020, 37, 228–238. [Google Scholar] [CrossRef]
- Osborne, J.; Edwards, C. Inhibition Of Malolactic Fermentation By Saccharomyces During Alcoholic Fermentation Under Low- And High-Nitrogen Conditions:: A Study In Synthetic Media. Australian Journal Of Grape And Wine Research 2006, 12, 69–78. [Google Scholar] [CrossRef]
- Morata, A.; Loira, I.; Vejarano, R.; González, C.; Callejo, M.; Suárez-Lepe, J. Emerging Preservation Technologies In Grapes For Winemaking. Trends In Food Science & Technology 2017, 67, 36–43. [Google Scholar] [CrossRef]
- Raúl, F.-G.; Miquel, P.; Laura, M.; Enric, N.; Claudio, H.; Imma, A. Microbiological, Physical, And Chemical Procedures To Elaborate High-Quality So2-Free Wines. In Grapes And Wines; Intechopen: Rijeka, 2017; P. Ch. 9. [Google Scholar]
- Gao, Y.; Zhang, G.; Krentz, S.; Darius, S.; Power, J.; Lagarde, G. Inhibition Of Spoilage Lactic Acid Bacteria By Lysozyme During Wine Alcoholic Fermentation. Australian Journal Of Grape And Wine Research 2002, 8, 76–83. [Google Scholar] [CrossRef]
- Lerm, E.; Engelbrecht, L.; Du Toit, M. Malolactic Fermentation: The Abc's Of MLF. South African Journal Of Enology And Viticulture 2010, 31, 186–212. [Google Scholar] [CrossRef]
- Ancín-Azpilicueta, C.; Jiménez-Moreno, N.; Moler, J.; Nieto-Rojo, R.; Urmeneta, H. Effects Of Reduced Levels Of Sulfite In Wine Production Using Mixtures With Lysozyme And Dimethyl Dicarbonate On Levels Of Volatile And Biogenic Amines. Food Additives And Contaminants Part A-Chemistry Analysis Control Exposure & Risk Assessment 2016, 33, 1518–1526. [Google Scholar] [CrossRef]
- Chinnici, F.; Natali, N.; Riponi, C. Efficacy Of Chitosan In Inhibiting The Oxidation Of (+)-Catechin In White Wine Model Solutions. Journal Of Agricultural And Food Chemistry 2014, 62, 9868–9875. [Google Scholar] [CrossRef]
- Cheung, R.; Ng, T.; Wong, J.; Chan, W. Chitosan: An Update On Potential Biomedical And Pharmaceutical Applications. Marine Drugs 2015, 13, 5156–5186. [Google Scholar] [CrossRef]
- Taillandier, P.; Joannis-Cassan, C.; Jentzer, J.; Gautier, S.; Sieczkowski, N.; Granes, D.; Brandam, C. Effect Of A Fungal Chitosan Preparation On Brettanomyces Bruxellensis, A Wine Contaminant. Journal Of Applied Microbiology 2015, 118, 123–131. [Google Scholar] [CrossRef]
- Gómez-Rivas, L.; Escudero-Abarca, B.; Aguilar-Uscanga, M.; Hayward-Jones, P.; Mendoza, P.; Ramírez, M. Selective Antimicrobial Action Of Chitosan Against Spoilage Yeasts In Mixed Culture Fermentations. Journal Of Industrial Microbiology & Biotechnology 2004, 31, 16–22. [Google Scholar] [CrossRef]
- Bautista-Baños, S.; Romanazzi, G.; Jiménez-Aparicio, A.; Bautistabanos, S.; Jimenezaparicio, A. Chitosan In The Preservation Of Agricultural Commodities Preface. Chitosan In The Preservation Of Agricultural Commodities 2016, Xv–Xvii. [Google Scholar]
- Mandon P, P.E. Chitosan Market By Source (Shrimp, Squid, Crab, Krill, And Others) And Application (Water Treatment, Biomedical & Pharmaceutical, Cosmetics, Food & Beverage, And Others): Global Opportunity Analysis And Industry Forecast, 2020–2027.. Available Online: (Accessed On .
- Vaara, M. Agents That Increase The Permeability Of The Outer-Membrane. Microbiological Reviews 1992, 56, 395–411. [Google Scholar] [CrossRef]
- Lonvaudfunel, A.; Desaad, A. Purification And Properties Of A Malolactic Enzyme From A Strain Of Leuconostoc-Mesenteroides Isolated From Grapes. Applied And Environmental Microbiology 1982, 43, 357–361. [Google Scholar] [CrossRef]
- 20. D. R. Cofran, B.J.M. The Effect Of Fumaric Acid On Malo-Lactic Fermentation. Agricultural And Food Sciences 1970, 21, 189–192. [Google Scholar] [CrossRef]
- Tchelistcheff, A.; Peterson, R.; Vangelde. M. Control Of Malo-Lactic Fermentation In Wine. American Journal Of Enology And Viticulture 1971, 22, 1-+. [Google Scholar] [CrossRef]
- Pilone, G.; Rankine, B.; Pilone, D. Inhibiting Malo-Lactic Fermentation In Australian Dry Red Wines By Adding Fumaric Acid. American Journal Of Enology And Viticulture 1974, 25, 99–107. [Google Scholar] [CrossRef]
- Galloway, D.; Williams, J.; Moore, C. Effects Of Fumarates On Inflammatory Human Astrocyte Responses And Oligodendrocyte Differentiation. Annals Of Clinical And Translational Neurology 2017, 4, 381–391. [Google Scholar] [CrossRef]
- Cortereal, M.; Leao, C. Transport Of Malic-Acid And Other Dicarboxylic-Acids In The Yeast Hansenula-Anomala. Applied And Environmental Microbiology 1990, 56, 1109–1113. [Google Scholar] [CrossRef]
- Saayman, M.; Van Vuuren, H.; Van Zyl, W.; Viljoen-Bloom, M. Differential Uptake Of Fumarate By Candida utilis And Schizosaccharomyces pombe. Applied Microbiology And Biotechnology 2000, 54, 792–798. [Google Scholar] [CrossRef]
- Alexandre, H.; Costello, P.; Remize, F.; Guzzo, J.; Guilloux-Benatier, M. Saccharomyces cerevisiae - Oenococcus oeni Interactions In Wine:: Current Knowledge And Perspectives. International Journal Of Food Microbiology 2004, 93, 141–154. [Google Scholar] [CrossRef]
- Edwards, C.; Beelman, R.; Bartley, C.; Mcconnell, A. Production Of Decanoic Acid And Other Volatile Compounds And The Growth Of Yeast And Malolactic Bacteria During Vinification. American Journal Of Enology And Viticulture 1990, 41, 48–56. [Google Scholar] [CrossRef]
- R, C.; Mt, V.; A, B.; M, C. Inhibitory Effect Of Sulfur Dioxide And Other Stress Compounds In Wine On The Atpase Activity Of Oenococcus oeni. Microbiol Lett. 2, 2. [CrossRef]
- García-Ruiz, A.; Moreno-Arribas, M.; Martín-Alvarez, P.; Bartolomé, B. Comparative Study Of The Inhibitory Effects Of Wine Polyphenols On The Growth Of Enological Lactic Acid Bacteria. International Journal Of Food Microbiology 2011, 145, 426–431. [Google Scholar] [CrossRef]
- Stivala, M.; Villecco, M.; Fanzone, M.; Jofre, V.; Rodríguez-Vaquero, M.; Aredes, P. Characterization, Antibacterial And Biological Activities Of Phenolic Fraction Of Argentinean Red Wines. The Open Conference Proceedings Journal 2014, 5, 29–37. [Google Scholar] [CrossRef]
- Stivala, M.; Villecco, M.; Fanzone, M.; Jofré, V.; Aredes-Fernández, P. Characterization Of The Phenolic Fraction From Argentine Wine And Its Effect On Viability And Polysaccharide Production Of Pediococcus pentosaceus. Biotechnology Letters 2015, 37, 2435–2444. [Google Scholar] [CrossRef]
- Bloem, A.; Bertrand, A.; Lonvaud-Funel, A.; De Revel, G. Vanillin Production From Simple Phenols By Wine-Associated Lactic Acid Bacteria. Letters In Applied Microbiology 2007, 44, 62–67. [Google Scholar] [CrossRef]
- Campos, F.; Couto, J.; Hogg, T. Influence Of Phenolic Acids On Growth And Inactivation Of Oenococcus oeni And Lactobacillus hilgardii. Journal Of Applied Microbiology 2003, 94, 167–174. [Google Scholar] [CrossRef]
- Figueiredo, A.; Campos, F.; De Freitas, V.; Hogg, T.; Couto, J. Effect Of Phenolic Aldehydes And Flavonoids On Growth And Inactivation Of Oenococcus oeni And Lactobacillus hilgardii. Food Microbiology 2008, 25, 105–112. [Google Scholar] [CrossRef] [PubMed]
- García-Ruiz, A.; Bartolomé, B.; Cueva, C.; Martín-Alvarez, P.; Moreno-Arribas, M. Inactivation Of Oenological Lactic Acid Bacteria (Lactobacillus hilgardii And Pediococcus pentosaceus) By Wine Phenolic Compounds. Journal Of Applied Microbiology 2009, 107, 1042–1053. [Google Scholar] [CrossRef] [PubMed]
- Landete, J.; Rodríguez, H.; De Las Rivas, B.; Muñoz, R. High-Added-Value Antioxidants Obtained From The Degradation Of Wine Phenolics By Lactobacillus plantarum. Journal Of Food Protection 2007, 70, 2670–2675. [Google Scholar] [CrossRef]
- Reguant, C.; Bordons, A.; Arola, L.; Rozès, N. Influence Of Phenolic Compounds On The Physiology Of Oenococcus oeni From Wine. Journal Of Applied Microbiology 2000, 88, 1065–1071. [Google Scholar] [CrossRef]
- Stead, D. The Effect Of Hydroxycinnamic Acids On The Growth Of Wine-Spoilage Lactic-Acid Bacteria. Journal Of Applied Bacteriology 1993, 75, 135–141. [Google Scholar] [CrossRef]
- Theobald, S.; Pfeiffer, P.; Zuber, U.; König, H. Influence Of Epigallocatechin Gallate And Phenolic Compounds From Green Tea On The Growth Of Oenococcus oeni. Journal Of Applied Microbiology 2008, 104, 566–572. [Google Scholar] [CrossRef]
- Vivas, N.; Lonvaudfunel, A.; Glories, Y. Effect Of Phenolic Acids And Anthocyanins On Growth, Viability And Malolactic Activity Of A Lactic Acid Bacterium. Food Microbiology 1997, 14, 291–299. [Google Scholar] [CrossRef]
- Bartowsky, E. Bacterial Spoilage Of Wine And Approaches To Minimize It. Letters In Applied Microbiology 2009, 48, 149–156. [Google Scholar] [CrossRef]
- García-Ruiz, A.; Bartolomé, B.; Martínez-Rodríguez, A.; Pueyo, E.; Martín-Alvarez, P.; Moreno-Arribas, M. Potential Of Phenolic Compounds For Controlling Lactic Acid Bacteria Growth In Wine. Food Control 2008, 19, 835–841. [Google Scholar] [CrossRef]
- Johnston, M.; Hanlon, G.; Denyer, S.; Lambert, R. Membrane Damage To Bacteria Caused By Single And Combined Biocides. Journal Of Applied Microbiology 2003, 94, 1015–1023. [Google Scholar] [CrossRef]
- Rodríguez, H.; Curiel, J.; Landete, J.; De Las Rivas, B.; De Felipe, F.; Gómez-Cordovés, C.; Mancheño, J.; Muñoz, R. Food Phenolics And Lactic Acid Bacteria. International Journal Of Food Microbiology 2009, 132, 79–90. [Google Scholar] [CrossRef] [PubMed]
- Anli, R.E.; Bayram, M. Biogenic Amines In Wines. 2009, 25, 86-102. [CrossRef]
- Jastrzebska, A.; Piasta, A.; Szlyk, E. Simultaneous Determination Of Selected Biogenic Amines In Alcoholic Beverage Samples By Isotachophoretic And Chromatographic Methods. Food Additives And Contaminants Part A-Chemistry Analysis Control Exposure & Risk Assessment 2014, 31, 83–92. [Google Scholar] [CrossRef]
- Rihak, Z.; Prusova, B.; Kumsta, M.; Baron, M. Effect Of Must Hyperoxygenation On Sensory Expression And Chemical Composition Of The Resulting Wines. Molecules 2022, 27. [Google Scholar] [CrossRef] [PubMed]
- Prusova, B.; Baron, M. Effect Of Controlled Micro Oxygenation On White Wine. Ciencia E Tecnica Vitivinicola 2018, 33, 78–89. [Google Scholar] [CrossRef]
- Kumsta, M.; Helmová, T.; Stusková, K.; Baron, M.; Prusová, B.; Sochor, J. Hplc/Hilic Determination Of Biogenic Amines In Wines Produced By Different Winemaking Technologies. Acta Alimentaria 2023, 52, 209–219. [Google Scholar] [CrossRef]
- Ugliano, M.; Moio, L. Changes In The Concentration Of Yeast-Derived Volatile Compounds Of Red Wine During Malolactic Fermentation With Four Commercial Starter Cultures Of Oenococcus oeni. Journal Of Agricultural And Food Chemistry 2005, 53, 10134–10139. [Google Scholar] [CrossRef] [PubMed]
- Sun, S.; Chen, Z.; Jin, C. Combined Influence Of Lactic Acid Bacteria Starter And Final Ph On The Induction Of Malolactic Fermentation And Quality Of Cherry Wines. Lwt-Food Science And Technology 2018, 89, 449–456. [Google Scholar] [CrossRef]
- Knoll, C.; Fritsch, S.; Schnell, S.; Grossmann, M.; Rauhut, D.; Du Toit, M. Influence Of Ph And Ethanol On Malolactic Fermentation And Volatile Aroma Compound Composition In White Wines. Lwt-Food Science And Technology 2011, 44, 2077–2086. [Google Scholar] [CrossRef]
- Sun, S.; Gong, H.; Liu, W.; Jin, C. Application And Validation Of Autochthonous Lactobacillus plantarum Starter Cultures For Controlled Malolactic Fermentation And Its Influence On The Aromatic Profile Of Cherry Wines. Food Microbiology 2016, 55, 16–24. [Google Scholar] [CrossRef]
- Knoll, C.; Fritsch, S.; Schnell, S.; Grossmann, M.; Krieger-Weber, S.; Du Toit, M.; Rauhut, D. Impact Of Different Malolactic Fermentation Inoculation Scenarios On Riesling Wine Aroma. World Journal Of Microbiology & Biotechnology 2012, 28, 1143–1153. [Google Scholar] [CrossRef]
- Pozo-Bayón, M.; Alegría, E.; Polo, M.; Tenorio, C.; Martín-Alvarez, P.; De La Banda, M.; Ruiz-Larrea, F.; Moreno-Arribas, M. Wine Volatile And Amino Acid Composition After Malolactic Fermentation:: Effect Of Oenococcus oeni And Lactobacillus plantarum Starter Cultures. Journal Of Agricultural And Food Chemistry 2005, 53, 8729–8735. [Google Scholar] [CrossRef] [PubMed]
- Licek, J.; Baron, M.; Sochor, J.; Kumsta, M.; Mlcek, J. Observation Of Residues Content After Application Of A Medium-Chain Fatty Acids Mixture At The End Of Alcoholic Fermentation. Fermentation-Basel 2022, 8. [Google Scholar] [CrossRef]
- Ugliano, M.; Henschke, P.A. Yeasts And Wine Flavour. In Wine Chemistry And Biochemistry; Springer New York: New York, Ny, 2009; Pp. 313-392. [Google Scholar]
- Swiegers, J.H.; Pretorius, I.S. Yeast Modulation Of Wine Flavor. Advances In Applied Microbiology 2005, 57, 131–175. [Google Scholar] [CrossRef] [PubMed]
- Licek, J.; Baron, M.; Sochor, J. Comparison Of Mcfa And Other Methods Of Terminating Alcohol Fermentation And Their Influence On The Content Of Carbonyl Compounds In Wine. Molecules 2020, 25. [Google Scholar] [CrossRef] [PubMed]
- Romano, P.; Suzzi, G. Origin And Production Of Acetoin During Wine Yeast Fermentation. Applied And Environmental Microbiology 1996, 62, 309–315. [Google Scholar] [CrossRef] [PubMed]
- Flamini, R.; De Luca, G.; Di Stefano, R. Changes In Carbonyl Compounds In Chardonnay And Cabernet Sauvignon Wines As A Consequence Of Malolactic Fermentation. Vitis 2002, 41, 107–112. [Google Scholar]
- Martineau, B.; Acree, T.E.; Henickkling, T. Effect Of Wine Type On The Detection Threshold For Diacetyl. Food Research International 1995, 28, 139–143. [Google Scholar] [CrossRef]
- Wang, S.; Li, Y.; Li, T.; Yang, H.; Ren, J.; Zhang, B.; Zhu, B. Dibasic Ammonium Phosphate Application Enhances Aromatic Compound Concentration In Bog Bilberry Syrup Wine. Molecules 2017, 22. [Google Scholar] [CrossRef]
- Wang, S.; Zhu, H.; Lan, Y.; Liu, R.; Liu, Y.; Zhang, B.; Zhu, B. Modifications Of Phenolic Compounds, Biogenic Amines, And Volatile Compounds In Cabernet Gernishct Wine Through Malolactic Fermentation By Lactobacillus plantarum And Oenococcus oeni. Fermentation-Basel 2020, 6. [Google Scholar] [CrossRef]
- Chatonnet, P.; Dubourdieu, D.; Boidron, J.; Lavigne, V. Synthesis Of Volatile Phenols By Saccharomycesn cerevisiae In Wines. Journal Of The Science Of Food And Agriculture 1993, 62, 191–202. [Google Scholar] [CrossRef]
- Chatonnet, P.; Dubourdieu, D.; Boidron, J.; Pons, M. The Origin Of Ethylphenols In Wines. Journal Of The Science Of Food And Agriculture 1992, 60, 165–178. [Google Scholar] [CrossRef]
- Guo, Y.; Yang, Y.; Peng, Q.; Han, Y. Biogenic Amines In Wine: A Review. International Journal Of Food Science And Technology 2015, 50, 1523–1532. [Google Scholar] [CrossRef]
- Arena, M.; De Nadra, M. Biogenic Amine Production By Lactobacillus. Journal Of Applied Microbiology 2001, 90, 158–162. [Google Scholar] [CrossRef] [PubMed]
- Cañas, P.; Alonso, S.; Pérez, P.; Prieto, S.; Romero, E.; Herreros, M. Biogenic Amine Production By Oenococcus oeni Isolates From Malolactic Fermentation Of Tempranillo Wine. Journal Of Food Protection 2009, 72, 907–910. [Google Scholar] [CrossRef]
- Guerrini, S.; Mangani, S.; Granchi, L.; Vincenzini, M. Biogenic Amine Production By Oenococcus oeni. Current Microbiology 2002, 44, 374–378. [Google Scholar] [CrossRef]
Figure 1.
Results of GC-MS analysis (ethyl decanoate; ethyl octanoate; octanoic acid; decanoic acid). Detailed results are available in Appendix (Table A1).
Figure 1.
Results of GC-MS analysis (ethyl decanoate; ethyl octanoate; octanoic acid; decanoic acid). Detailed results are available in Appendix (Table A1).
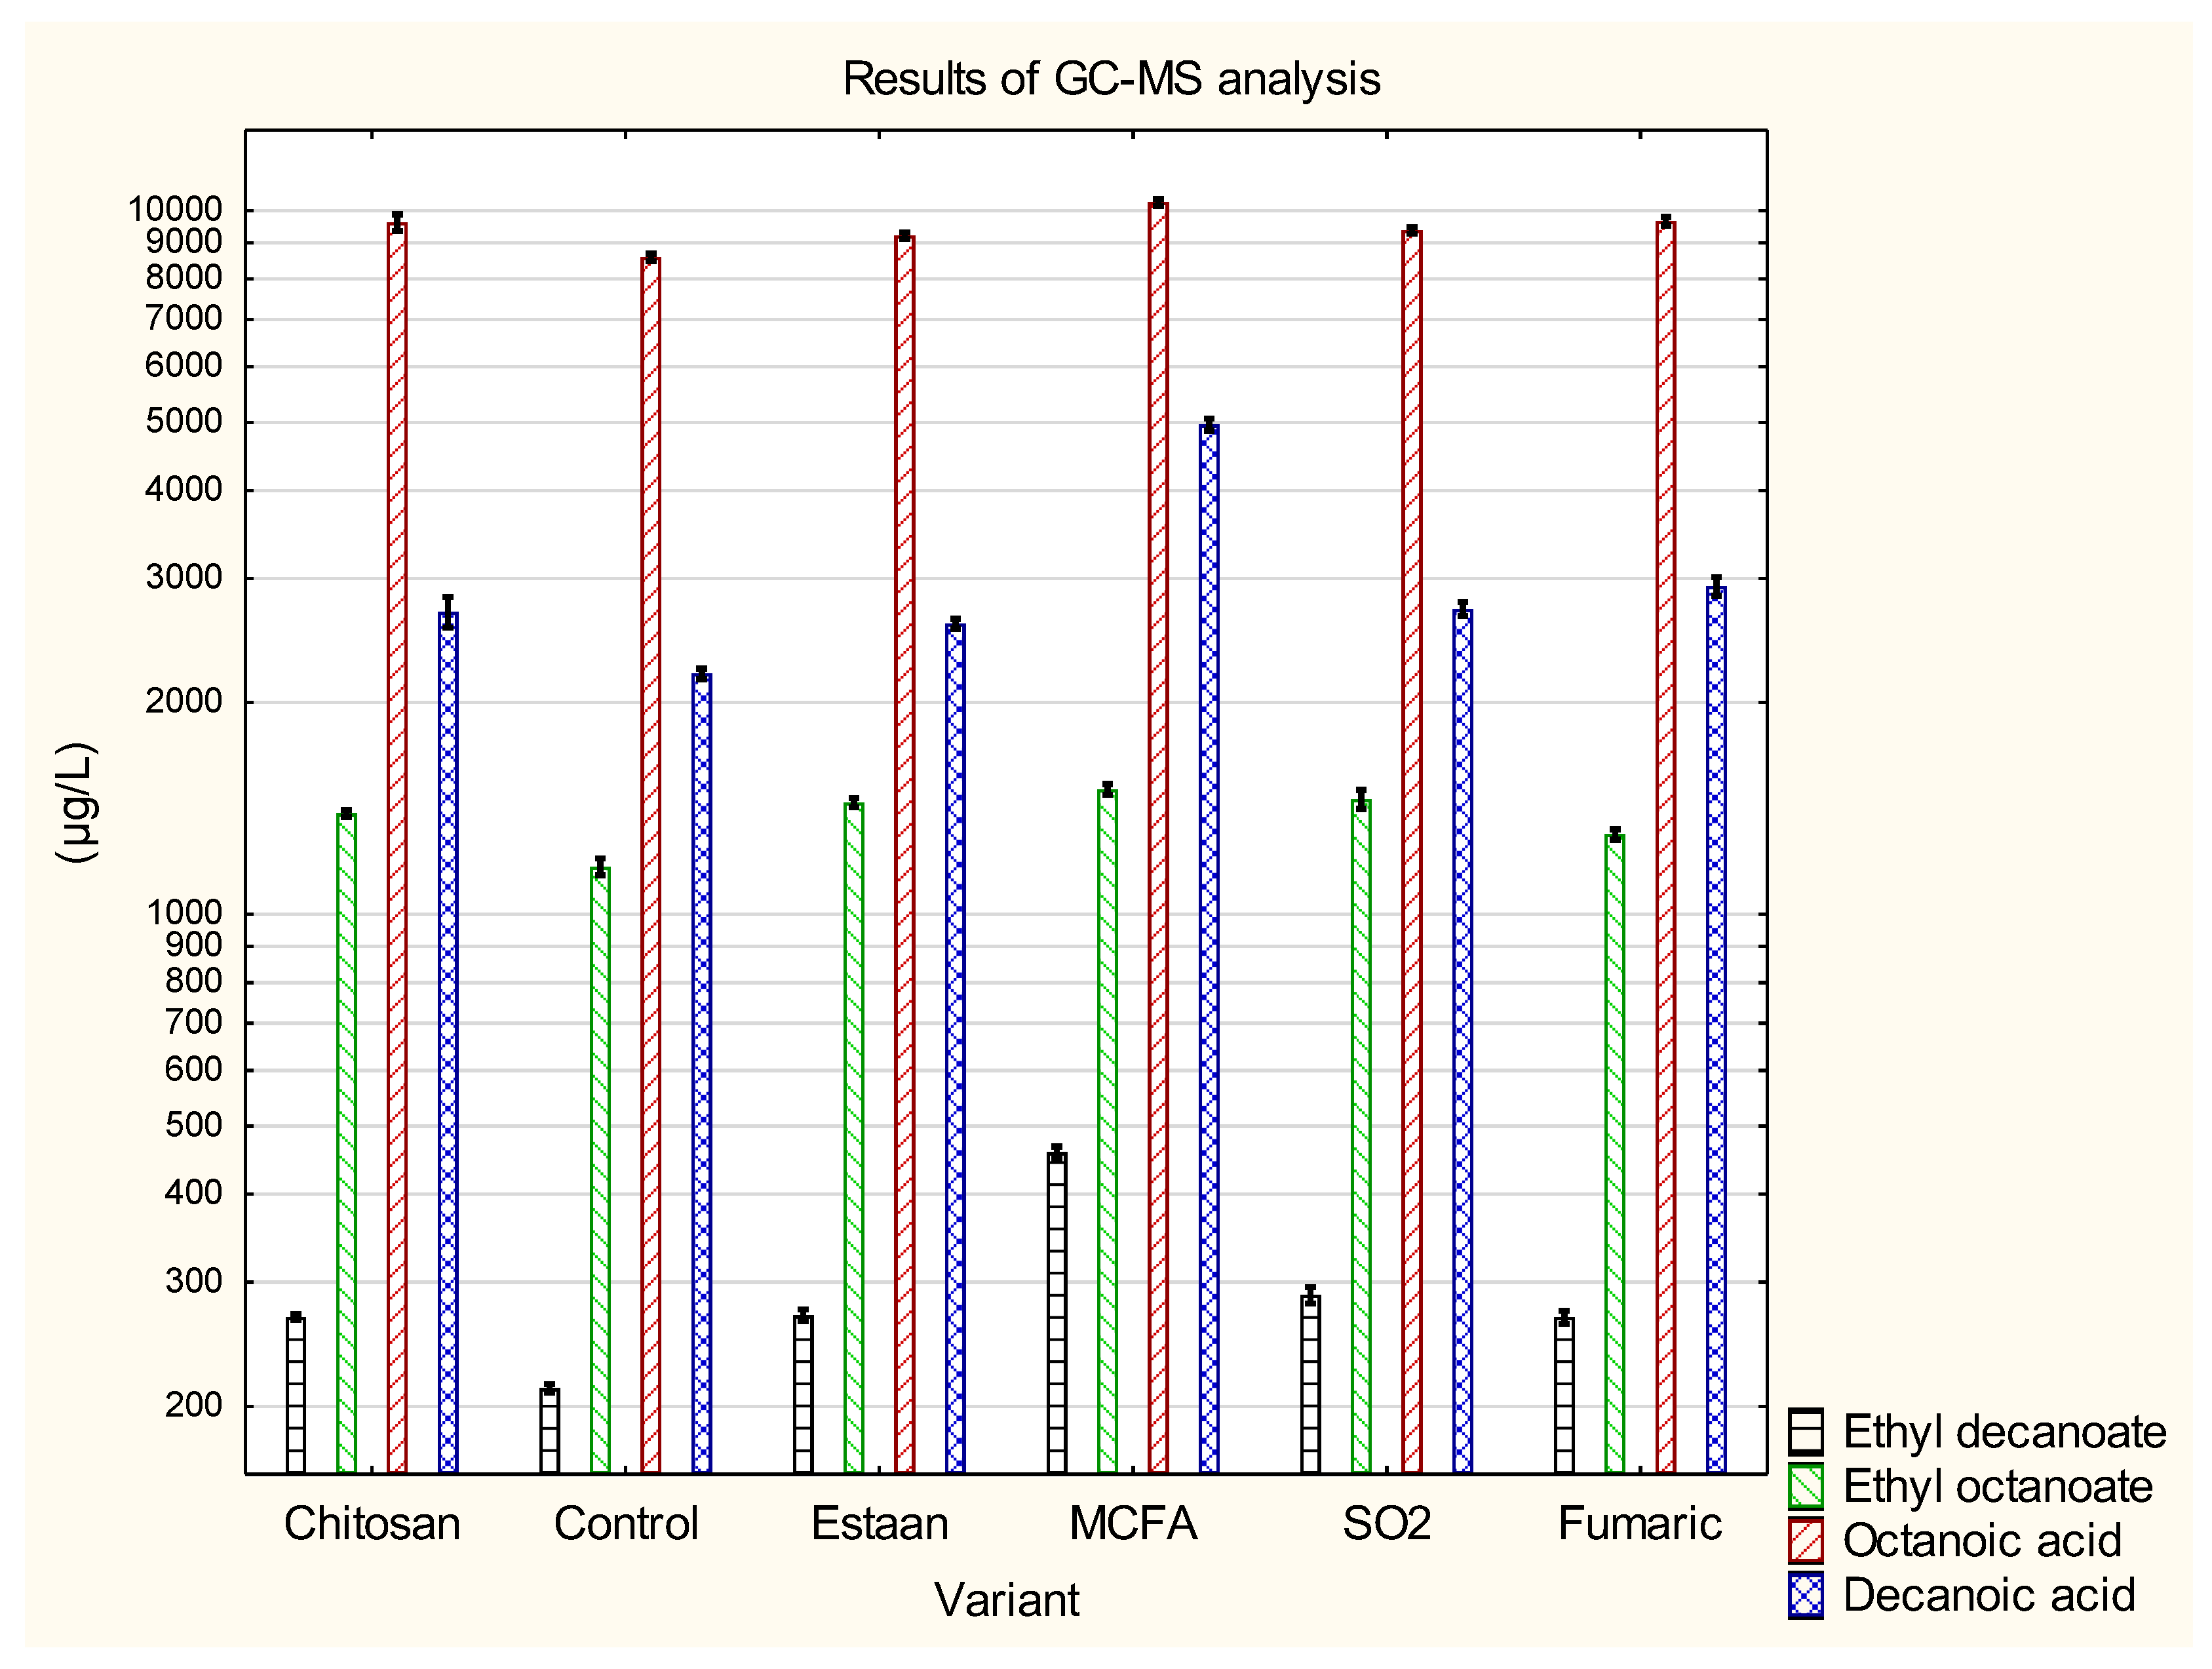
Figure 2.
Results of GC-MS analysis (1-propanol; benzylalcohol; methionol; acetoine). Detailed results are available in Appendix (Table A1).
Figure 2.
Results of GC-MS analysis (1-propanol; benzylalcohol; methionol; acetoine). Detailed results are available in Appendix (Table A1).
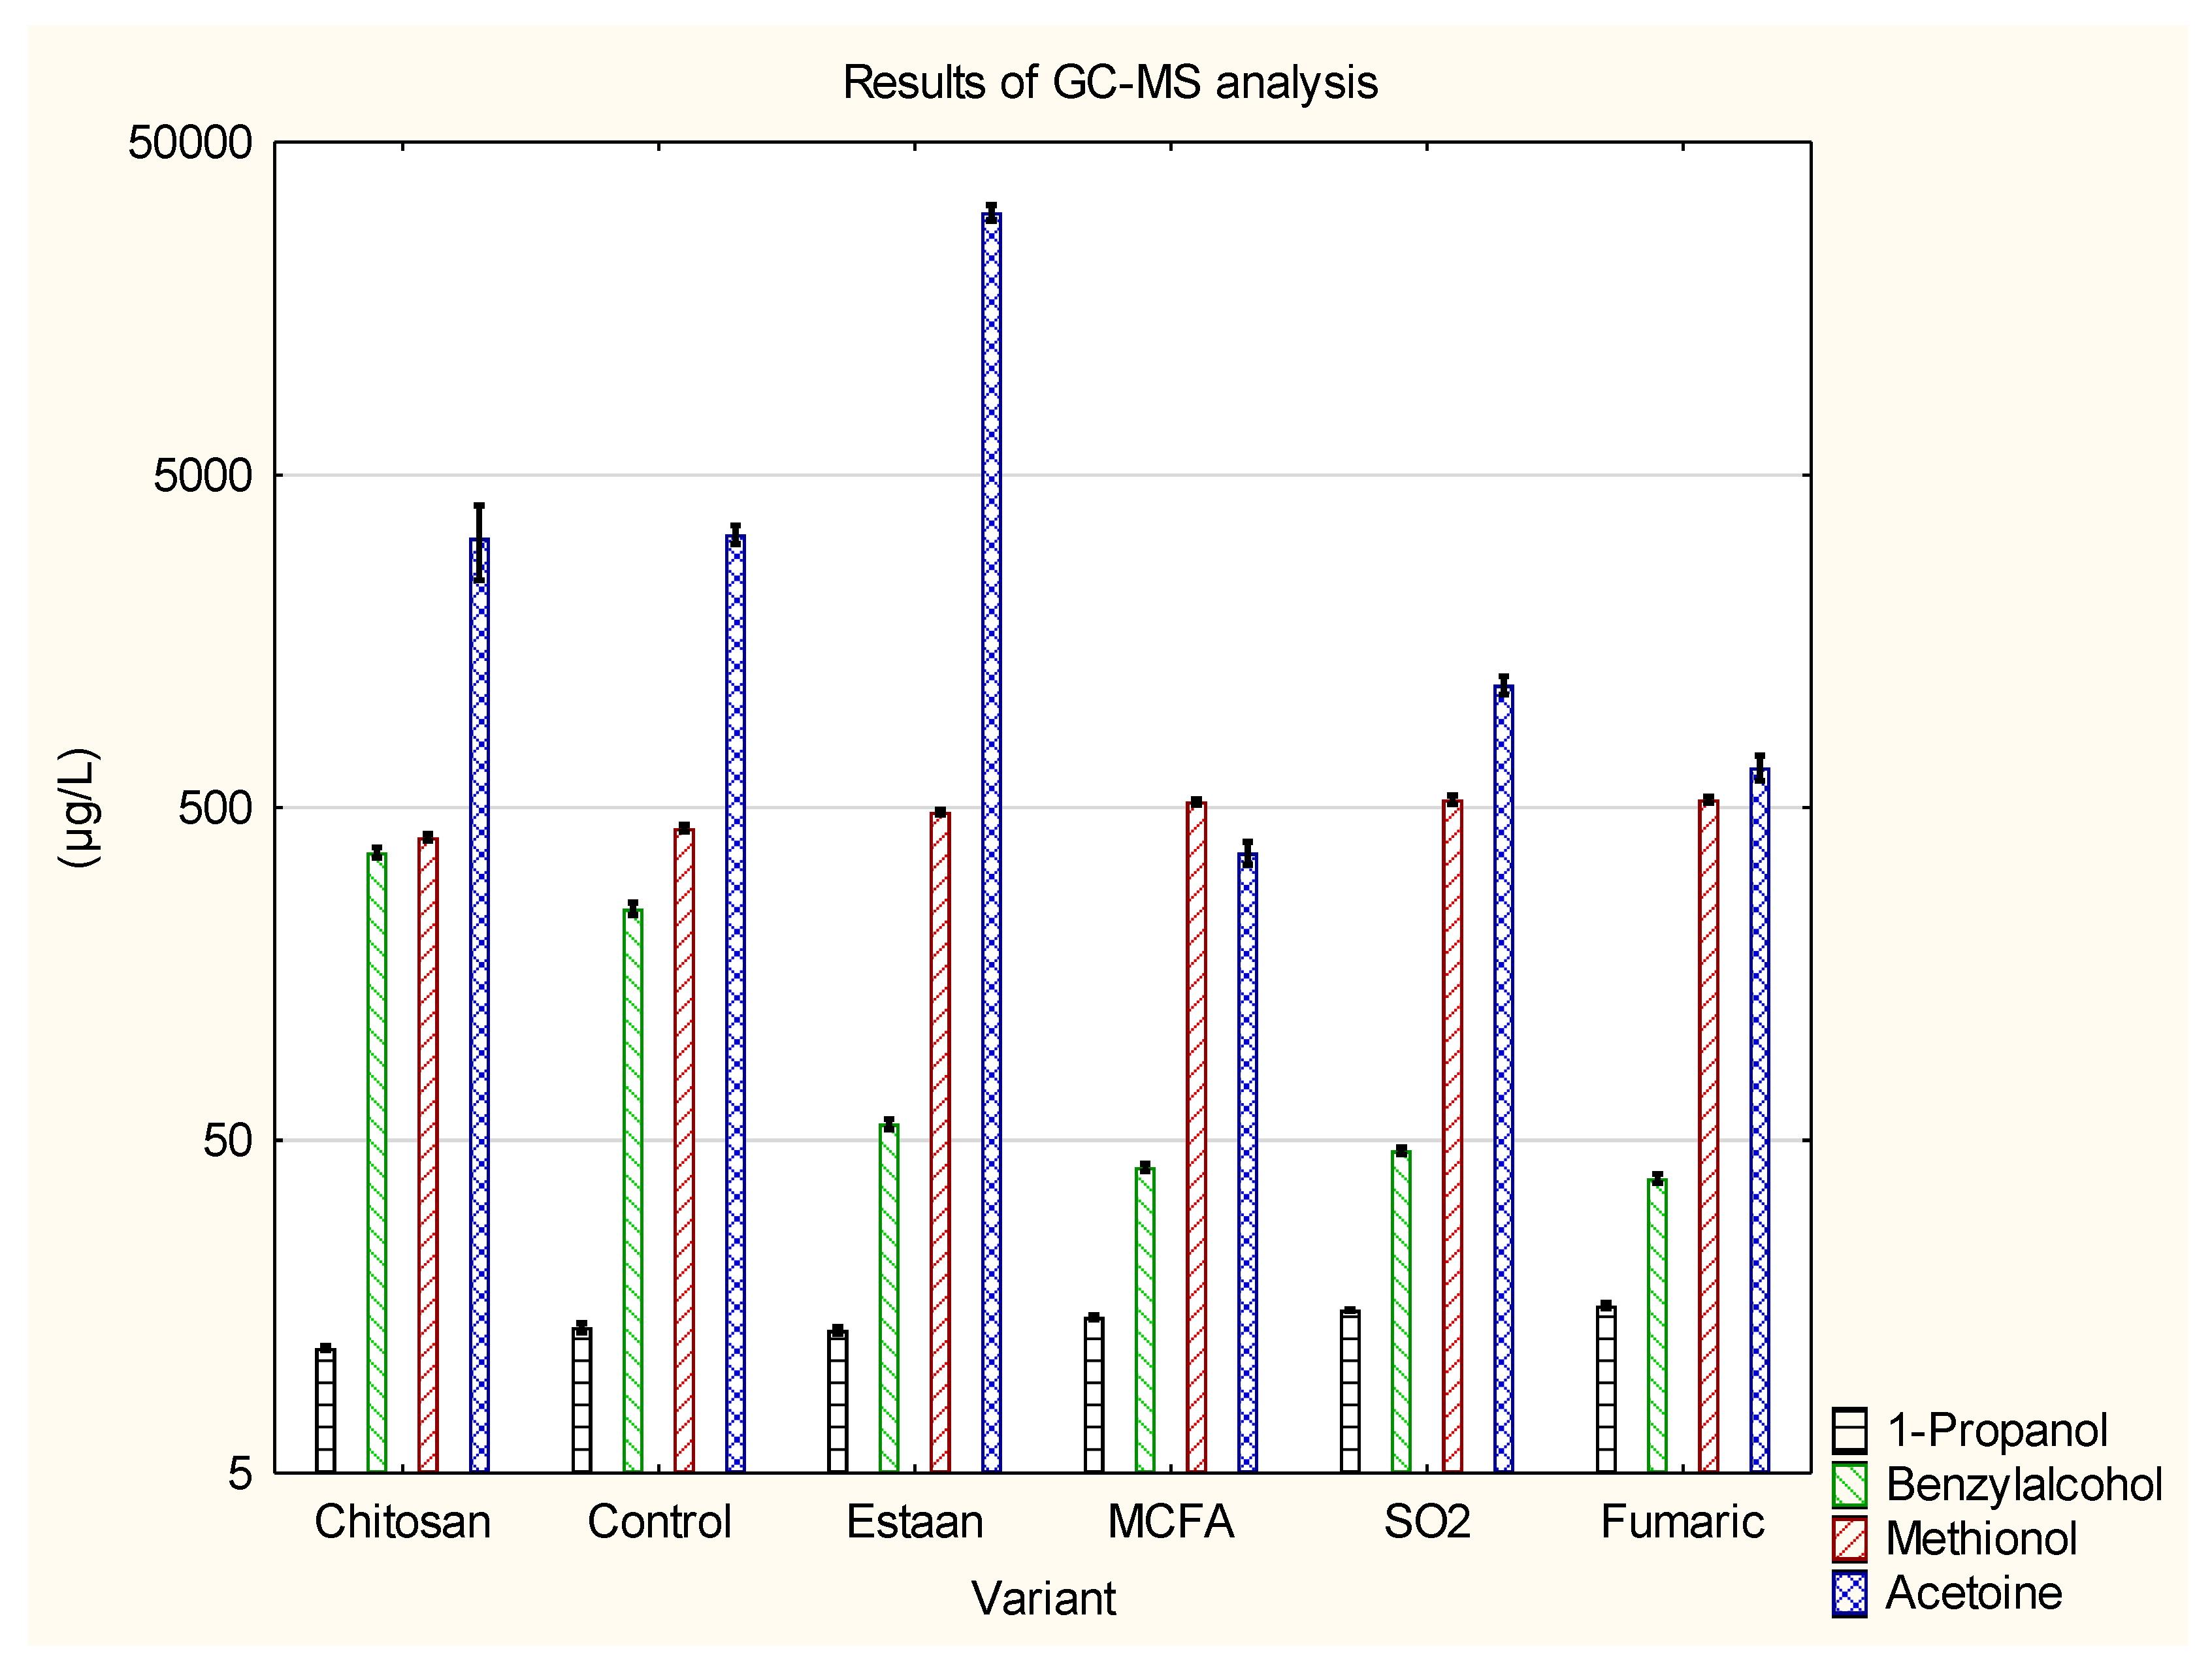
Figure 3.
Results of GC-MS analysis (ethyl-acetate; isoamyl acetate; 1-hexyl acetate; 2-phenylethylacetate). Detailed results are available in Appendix (Table A1).
Figure 3.
Results of GC-MS analysis (ethyl-acetate; isoamyl acetate; 1-hexyl acetate; 2-phenylethylacetate). Detailed results are available in Appendix (Table A1).
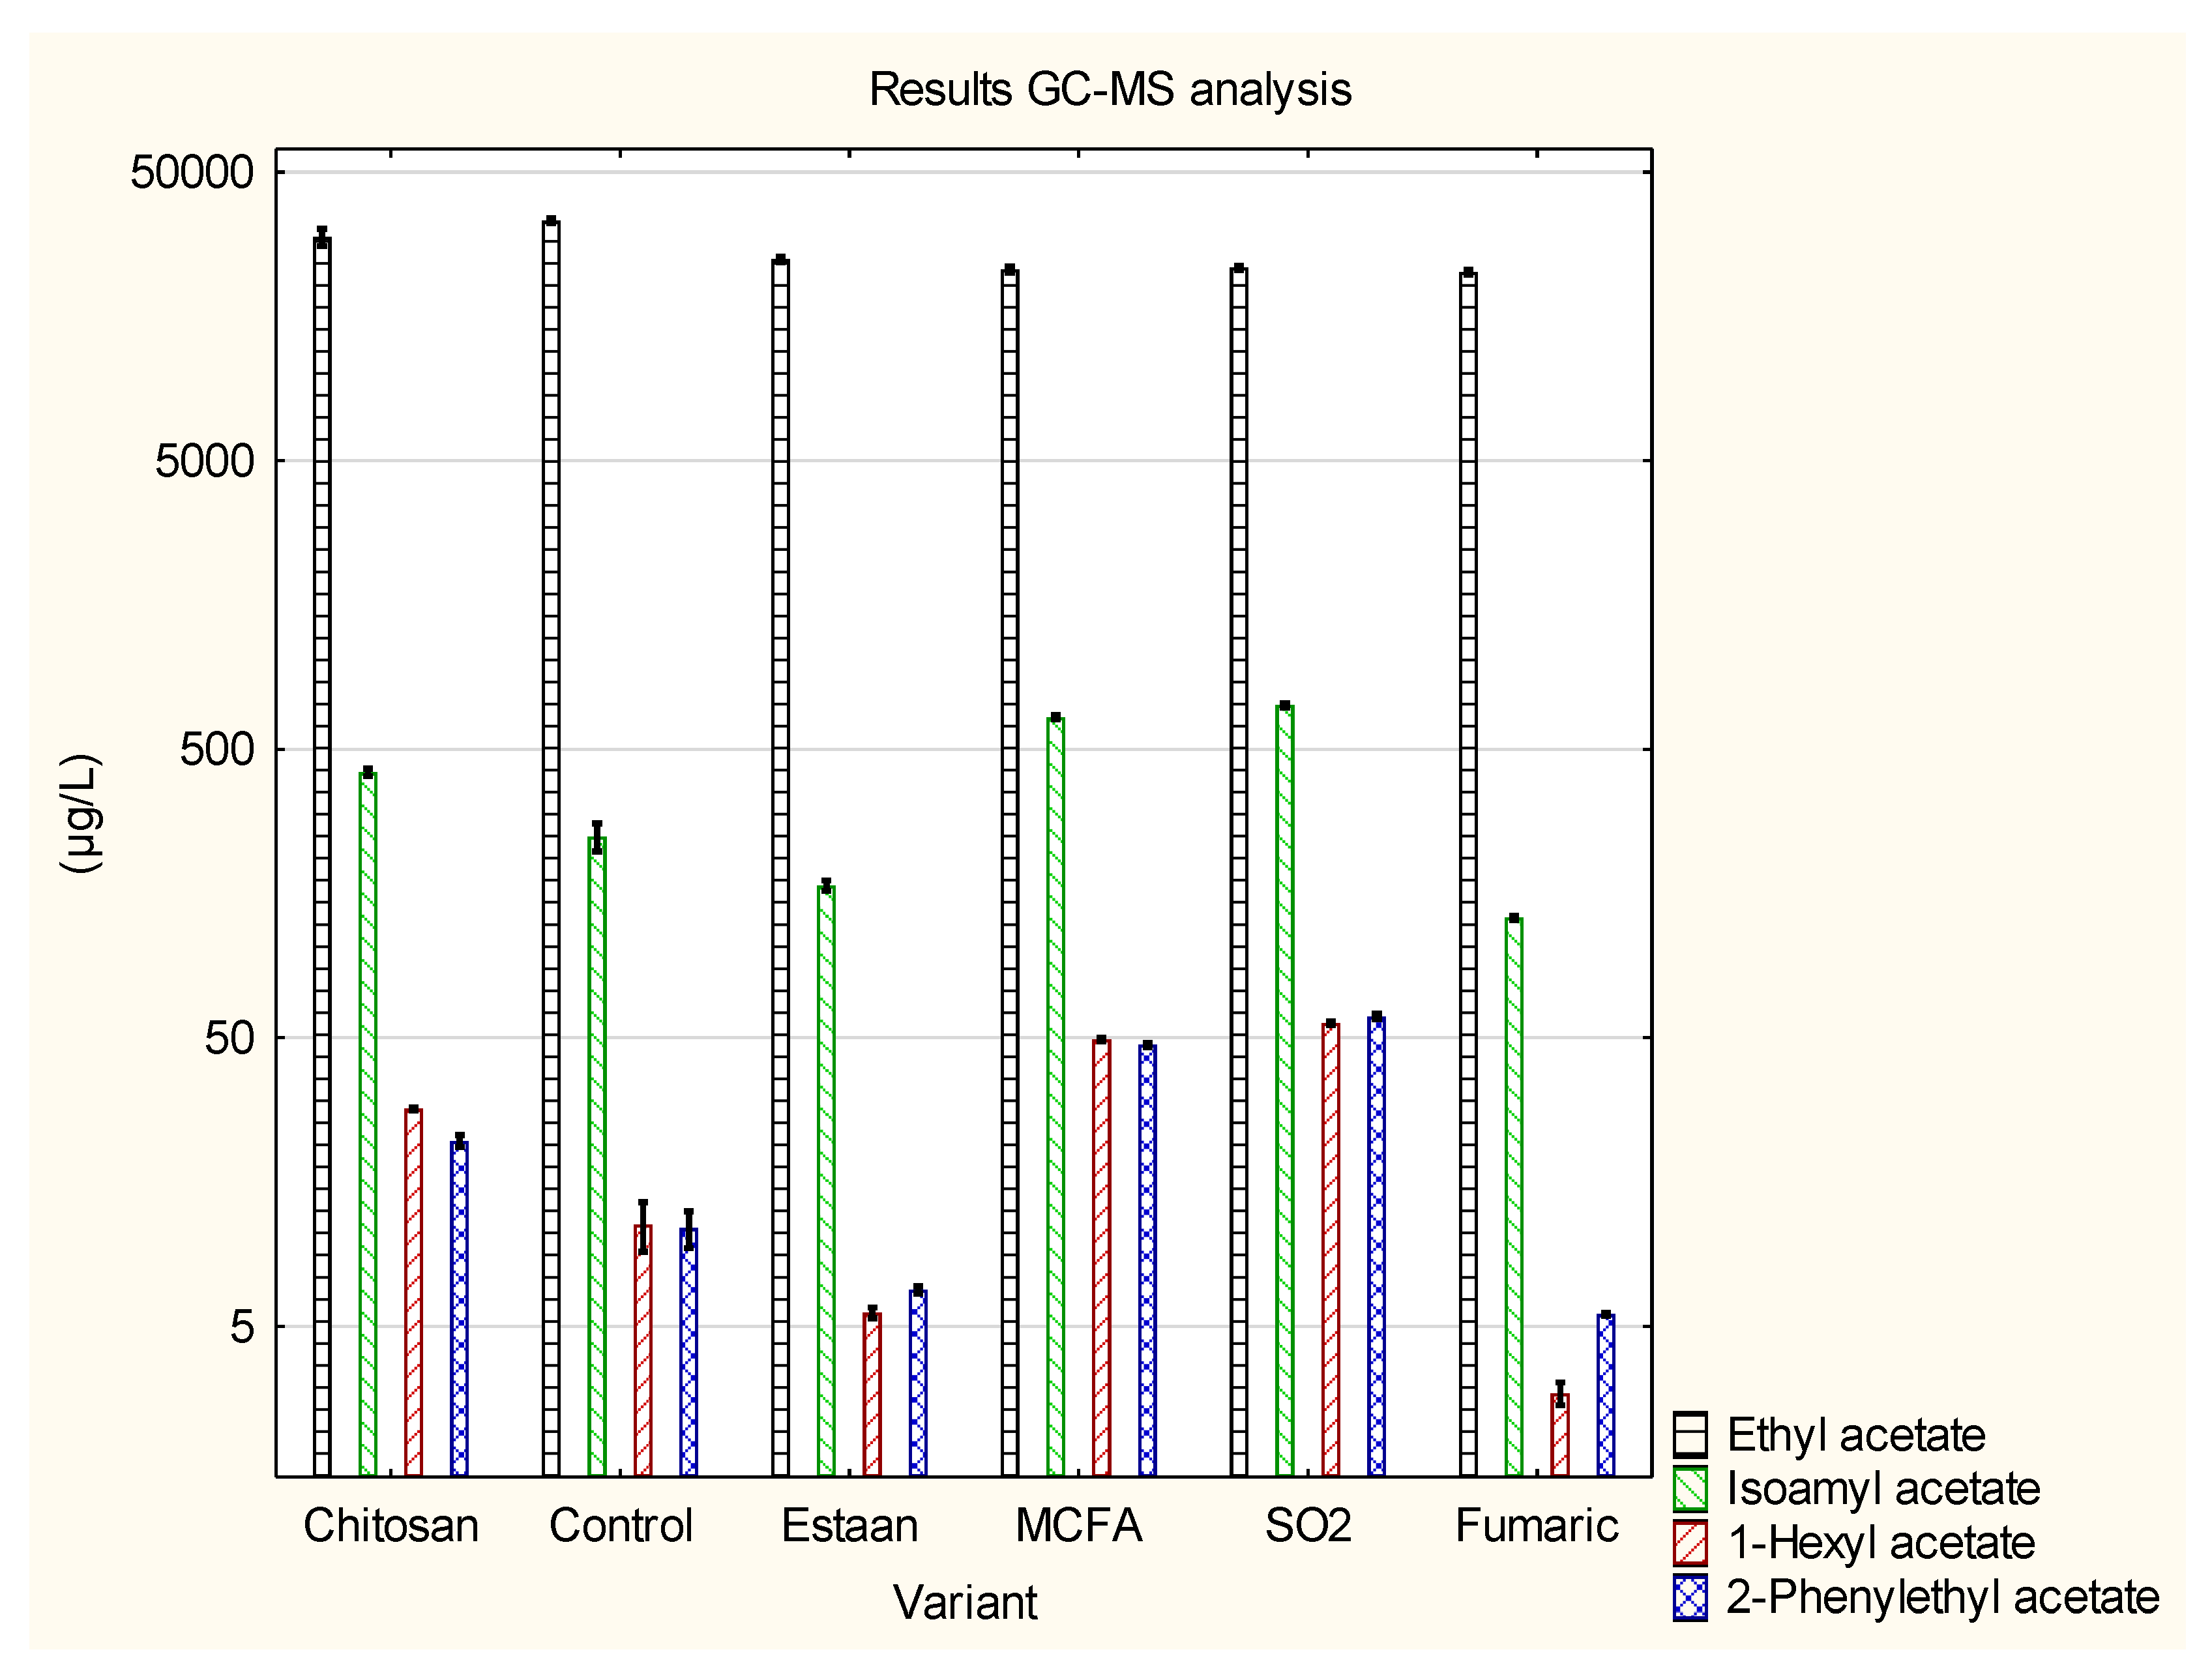
Figure 4.
Results of GC-MS analysis (4-vinylguaiacol; 4-vinylphenol; 4-ethylquaiacol; 4-ethylphenol). Detailed results are available in Appendix (Table A1).
Figure 4.
Results of GC-MS analysis (4-vinylguaiacol; 4-vinylphenol; 4-ethylquaiacol; 4-ethylphenol). Detailed results are available in Appendix (Table A1).
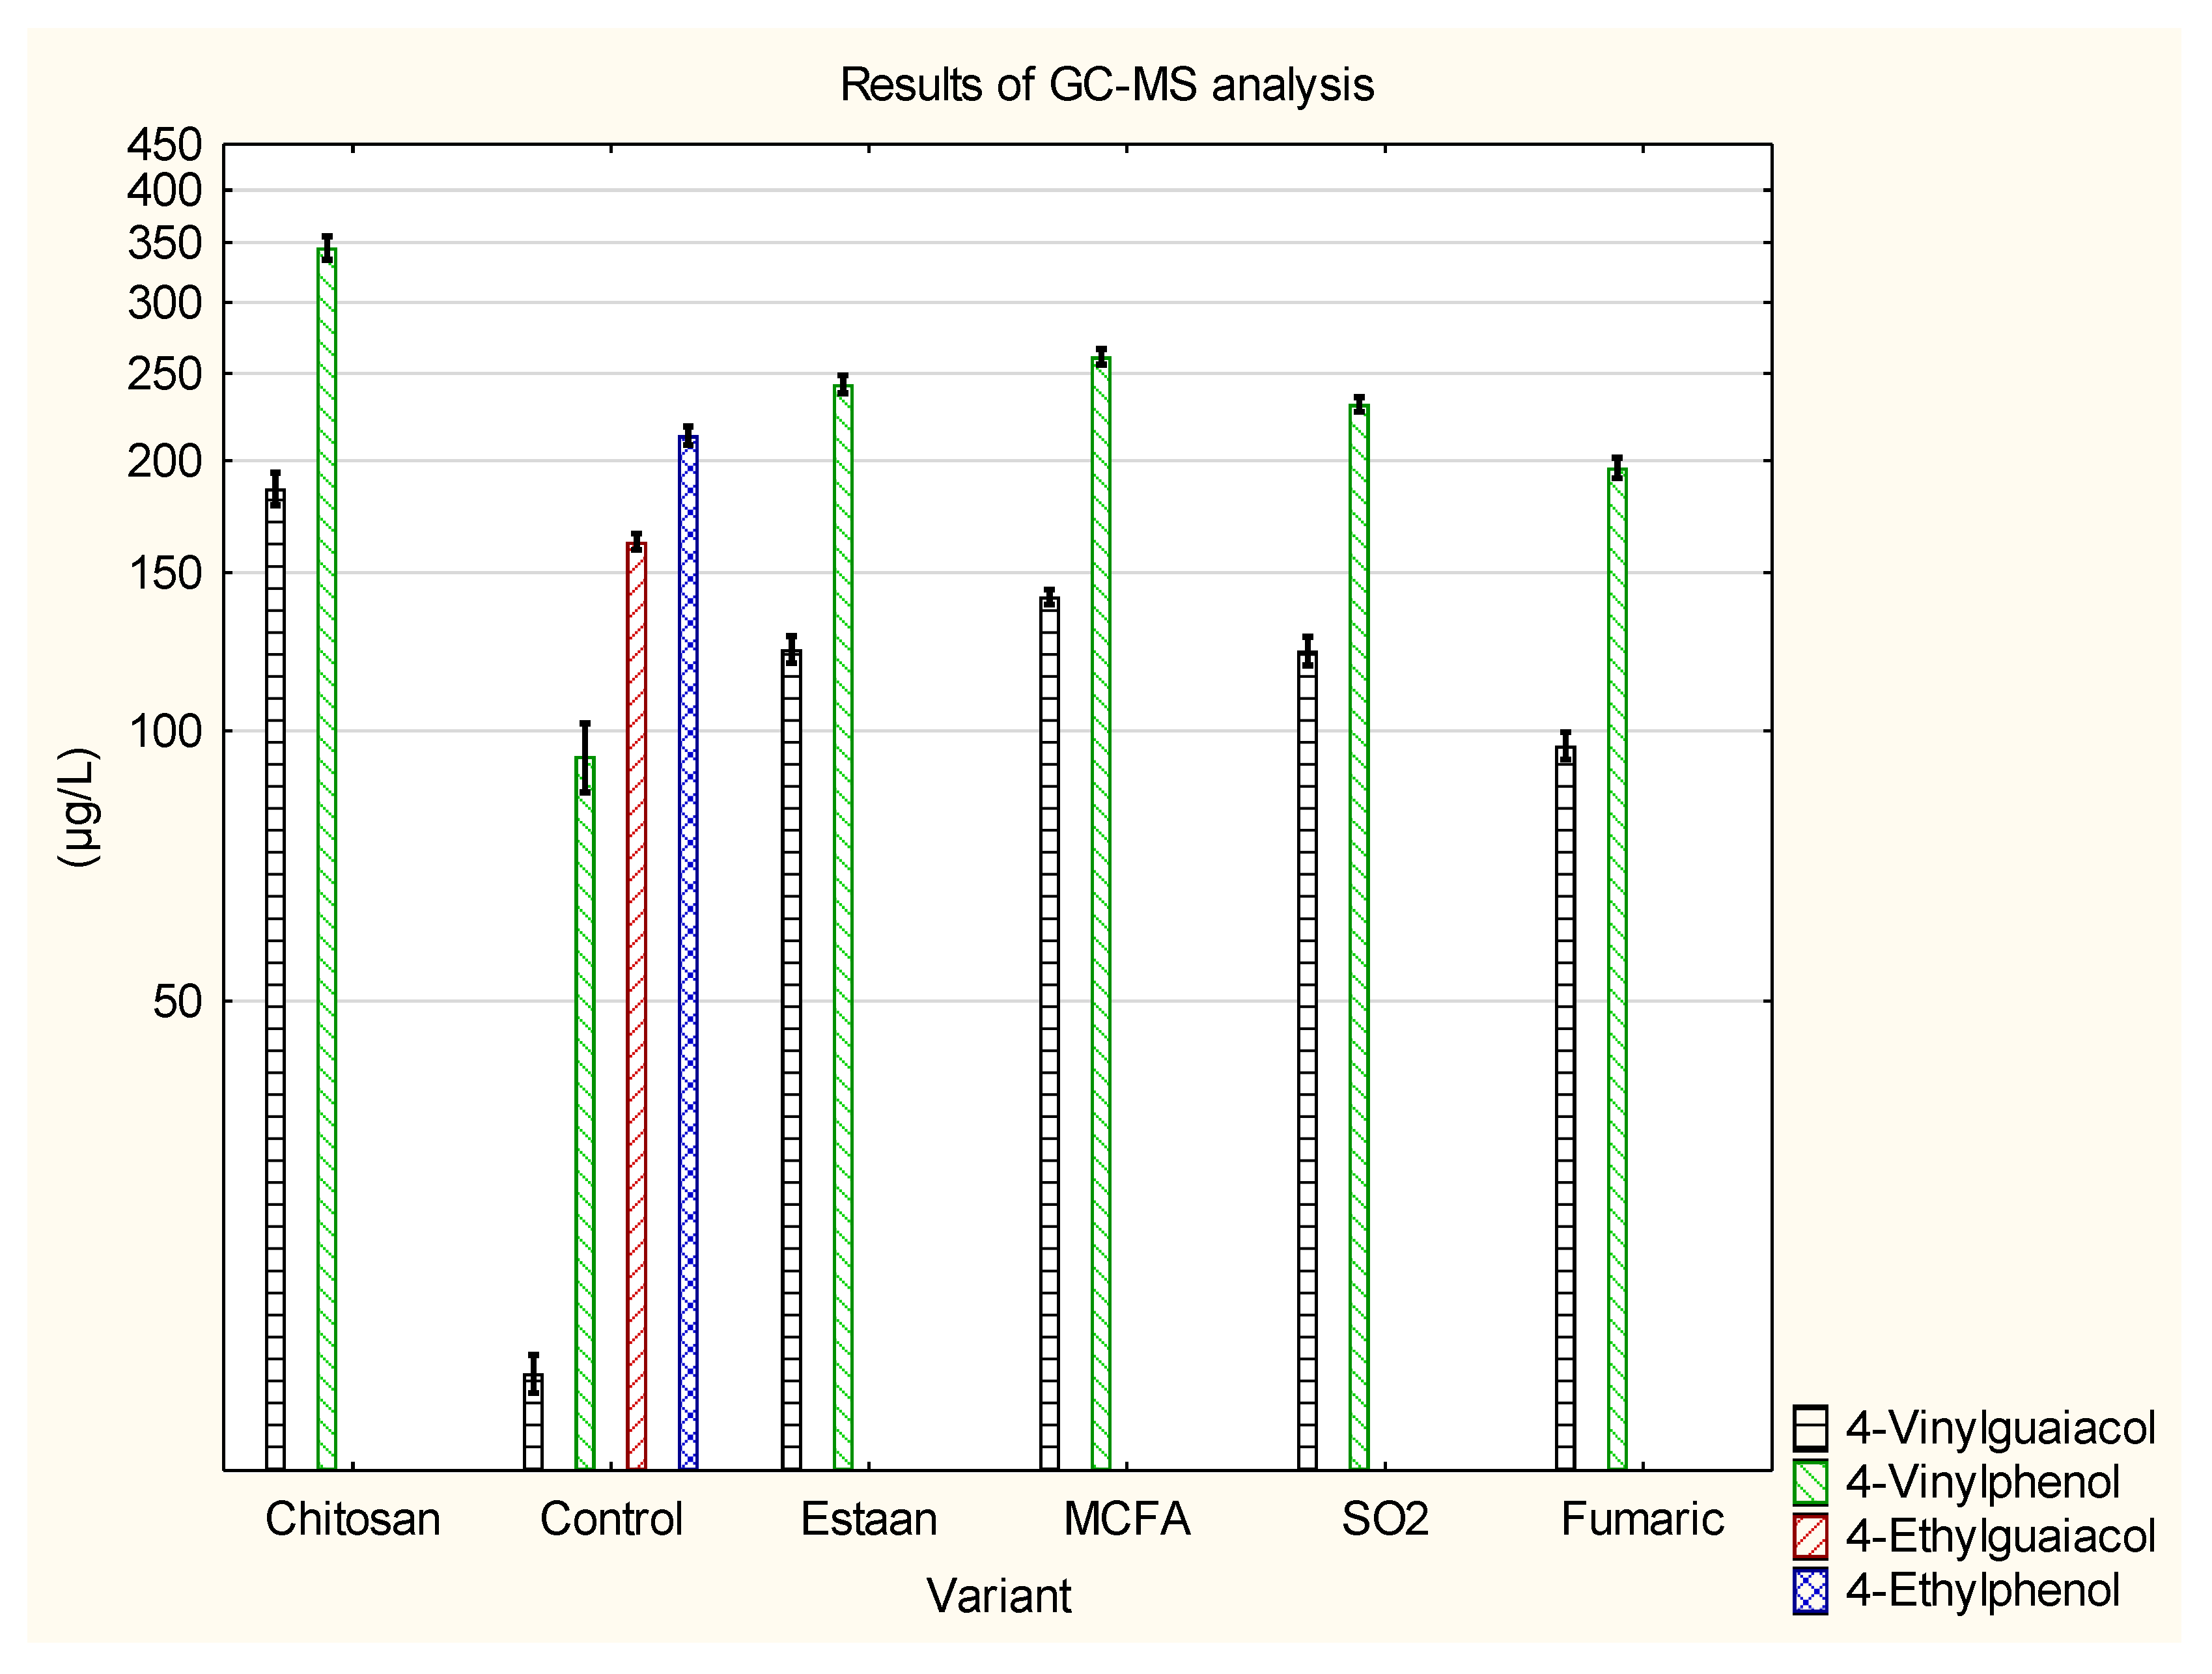
Figure 5.
Results of HPLC analysis of individual biogenic amines. Detailed results are available in Appendix (Table A2).
Figure 5.
Results of HPLC analysis of individual biogenic amines. Detailed results are available in Appendix (Table A2).
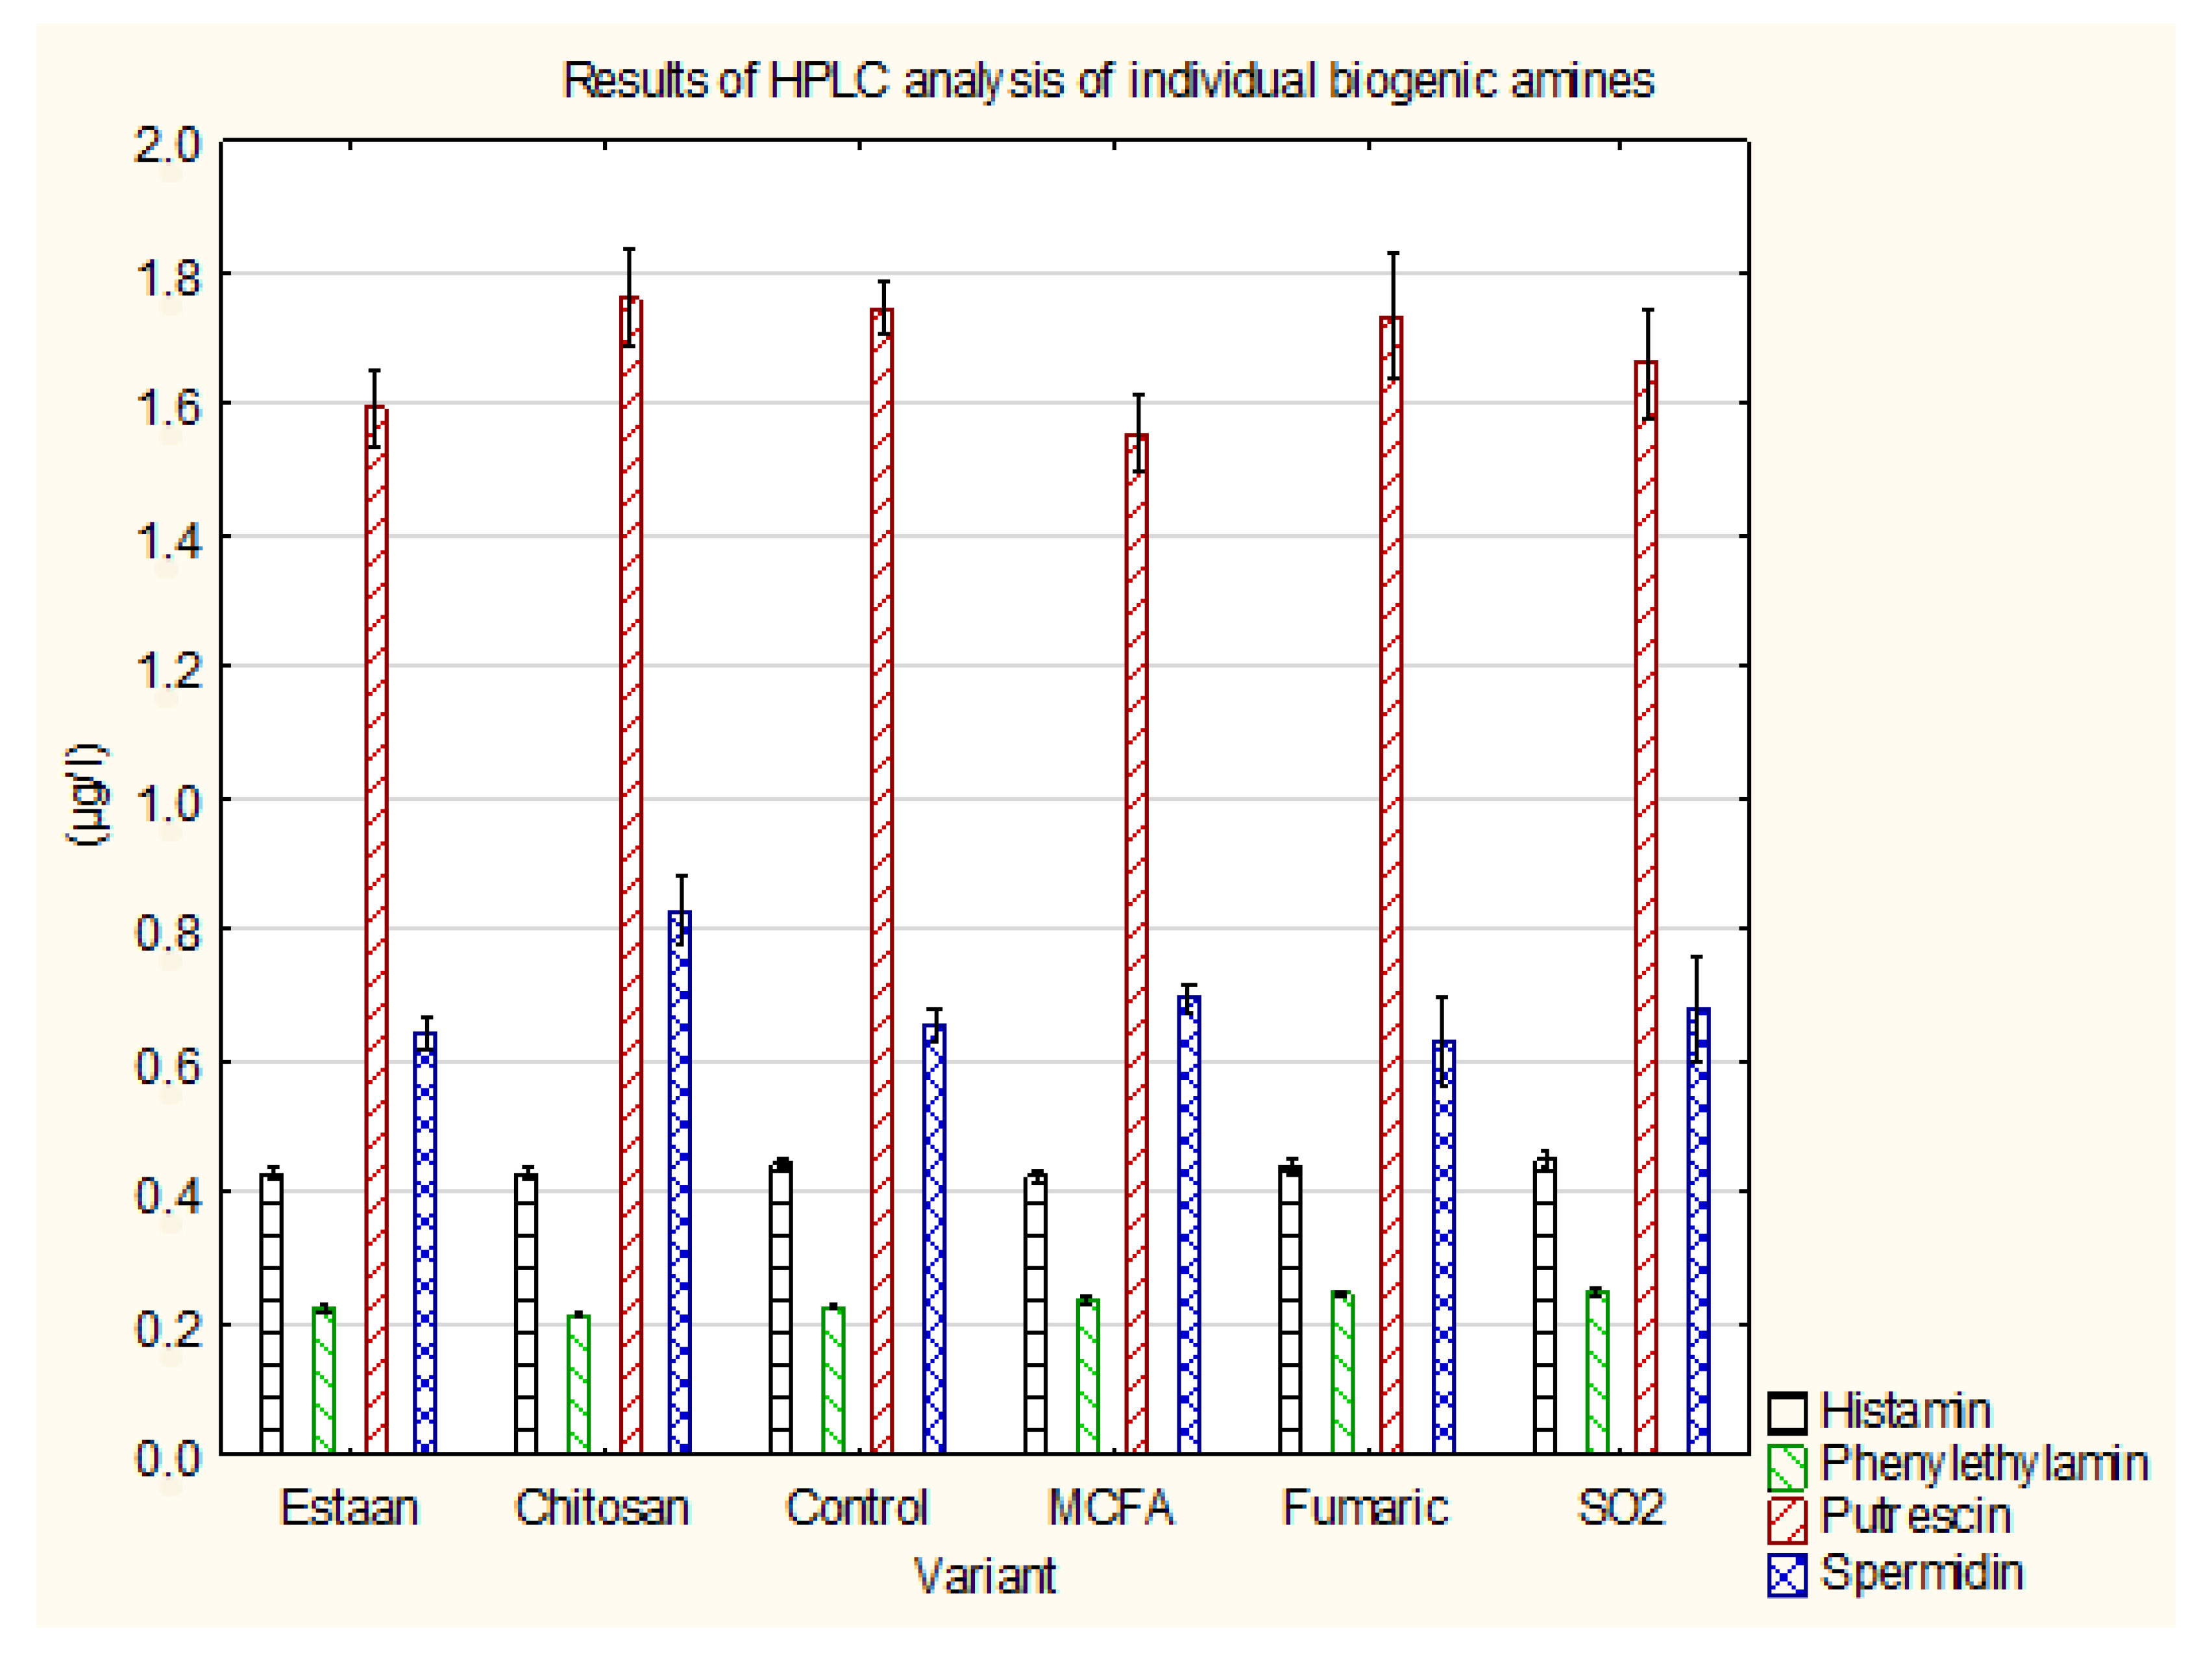
Figure 6.
Results of sensory analysis (profile of wine structure). Detailed results are available in Appendix (Table A3).
Figure 6.
Results of sensory analysis (profile of wine structure). Detailed results are available in Appendix (Table A3).
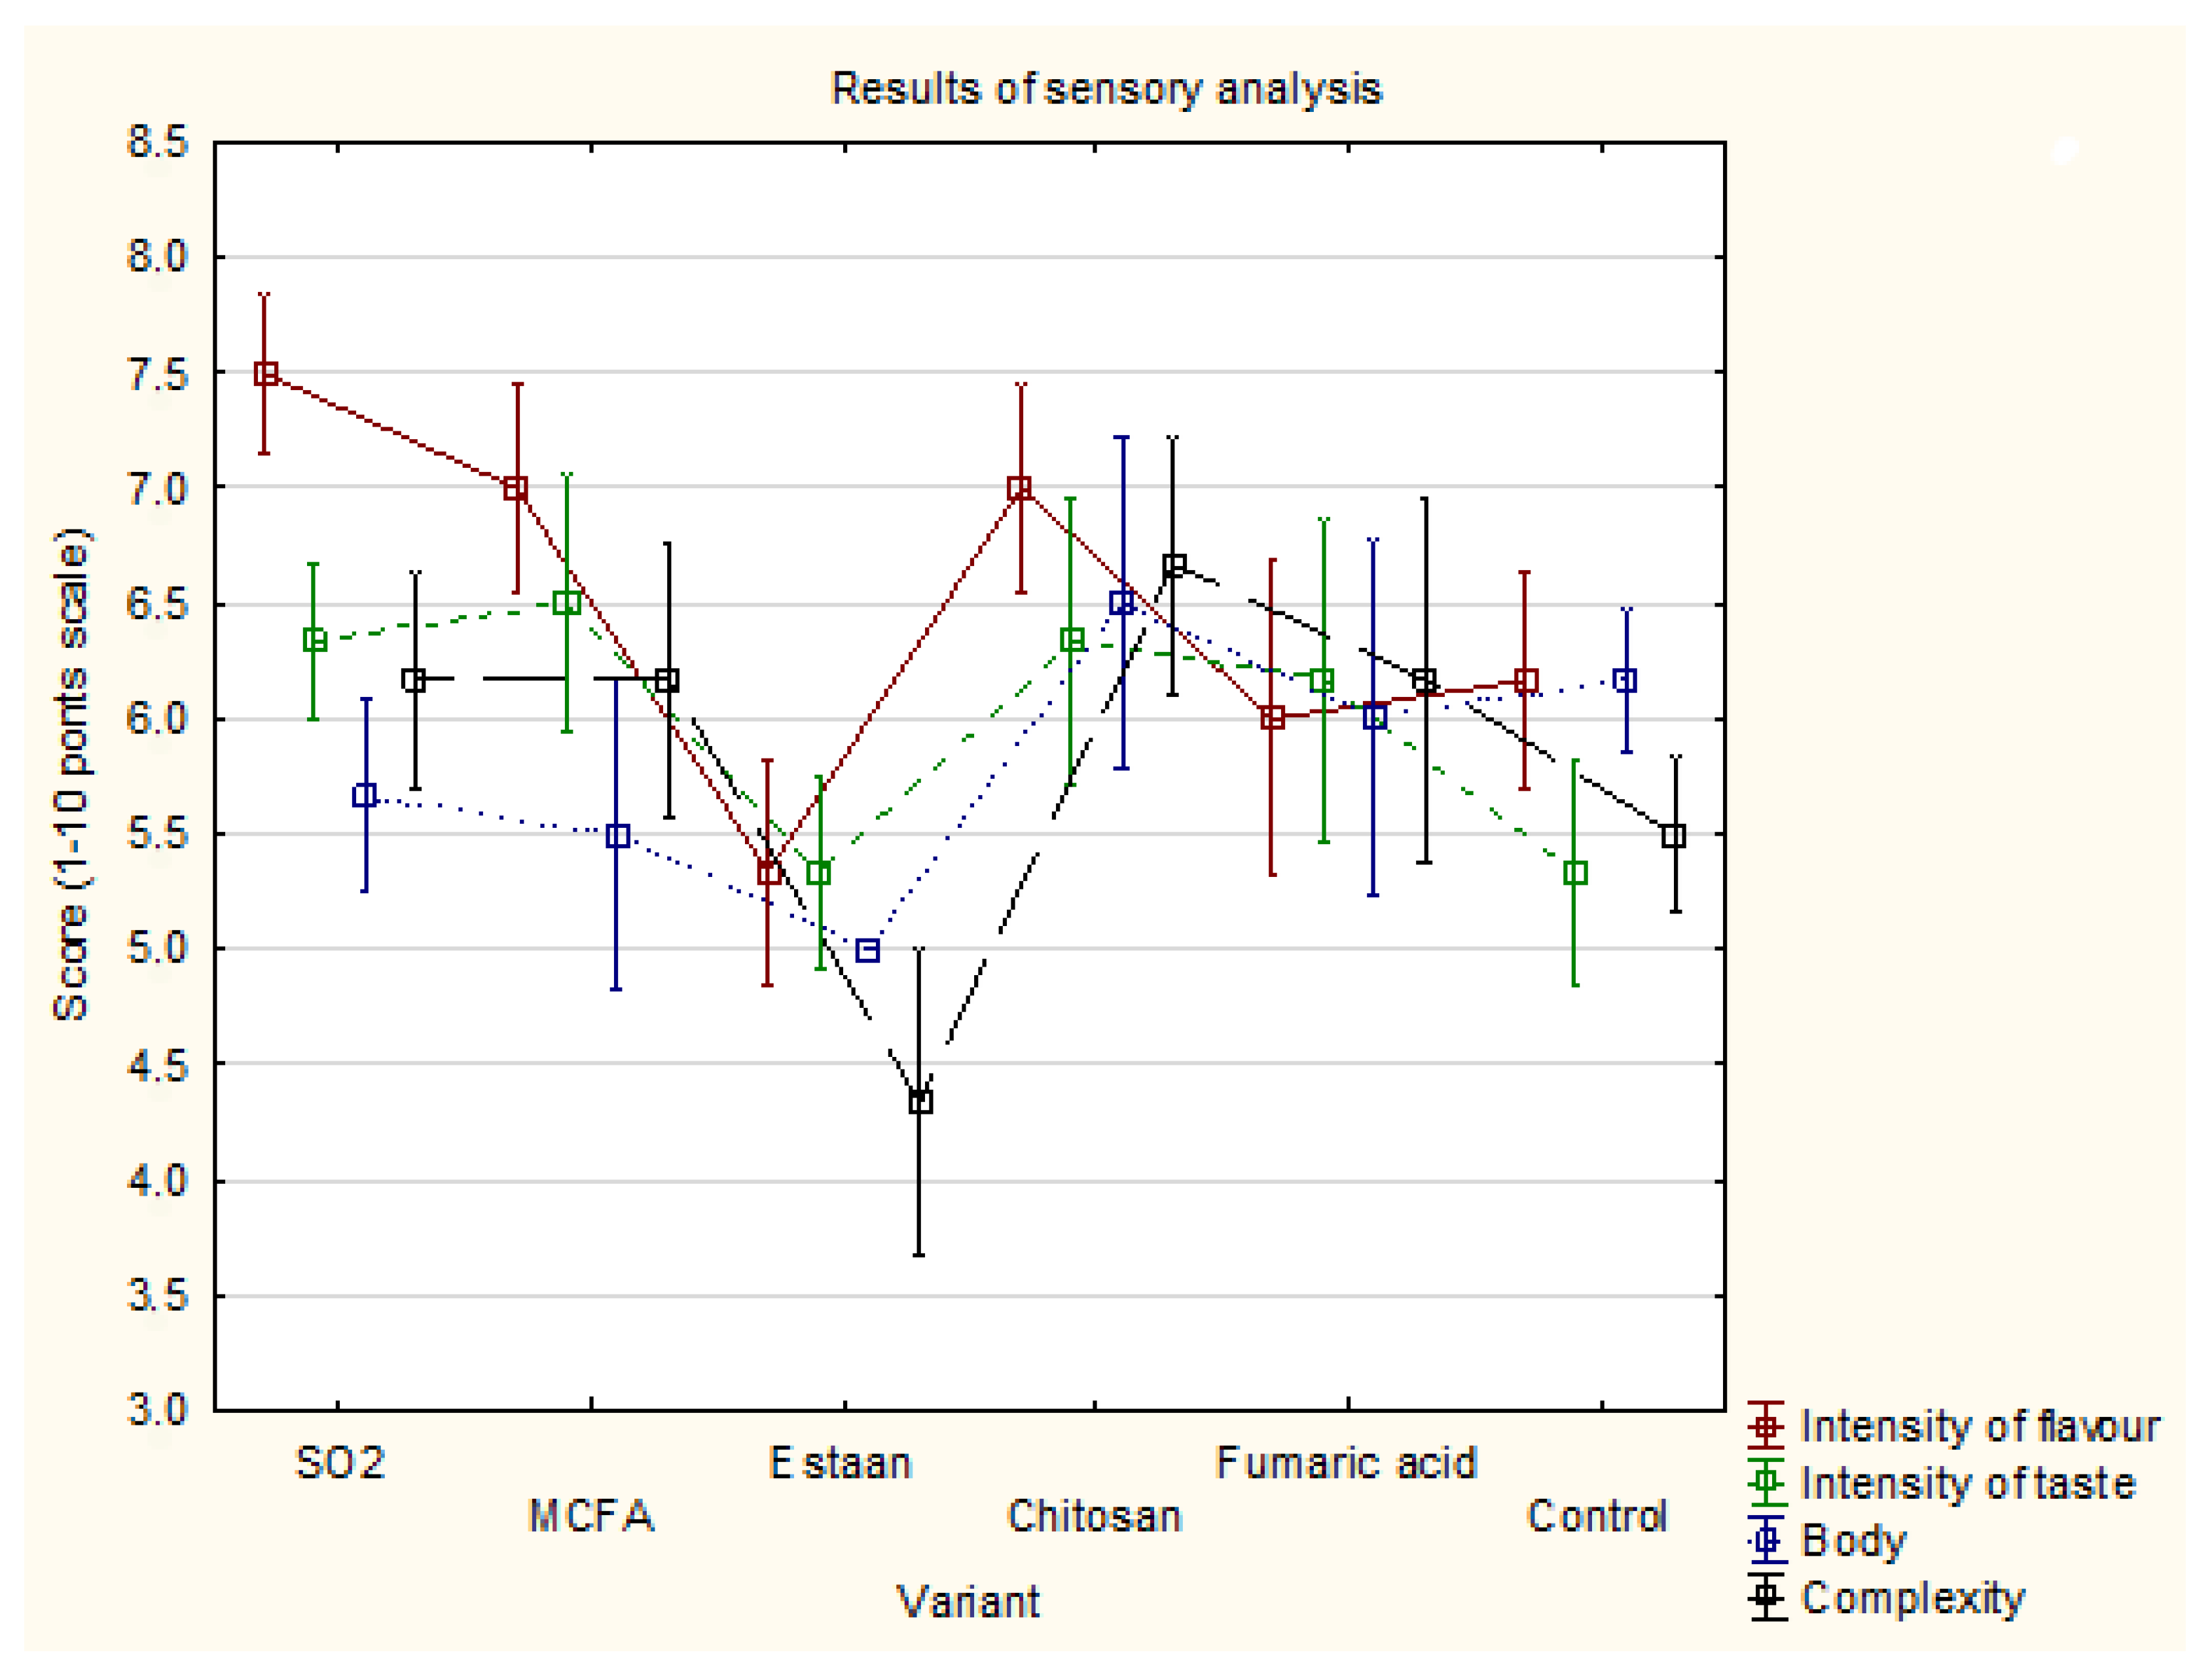
Figure 7.
Results of sensory analysis (100-points evaluation). Detailed results are available in Appendix (Table A3).
Figure 7.
Results of sensory analysis (100-points evaluation). Detailed results are available in Appendix (Table A3).
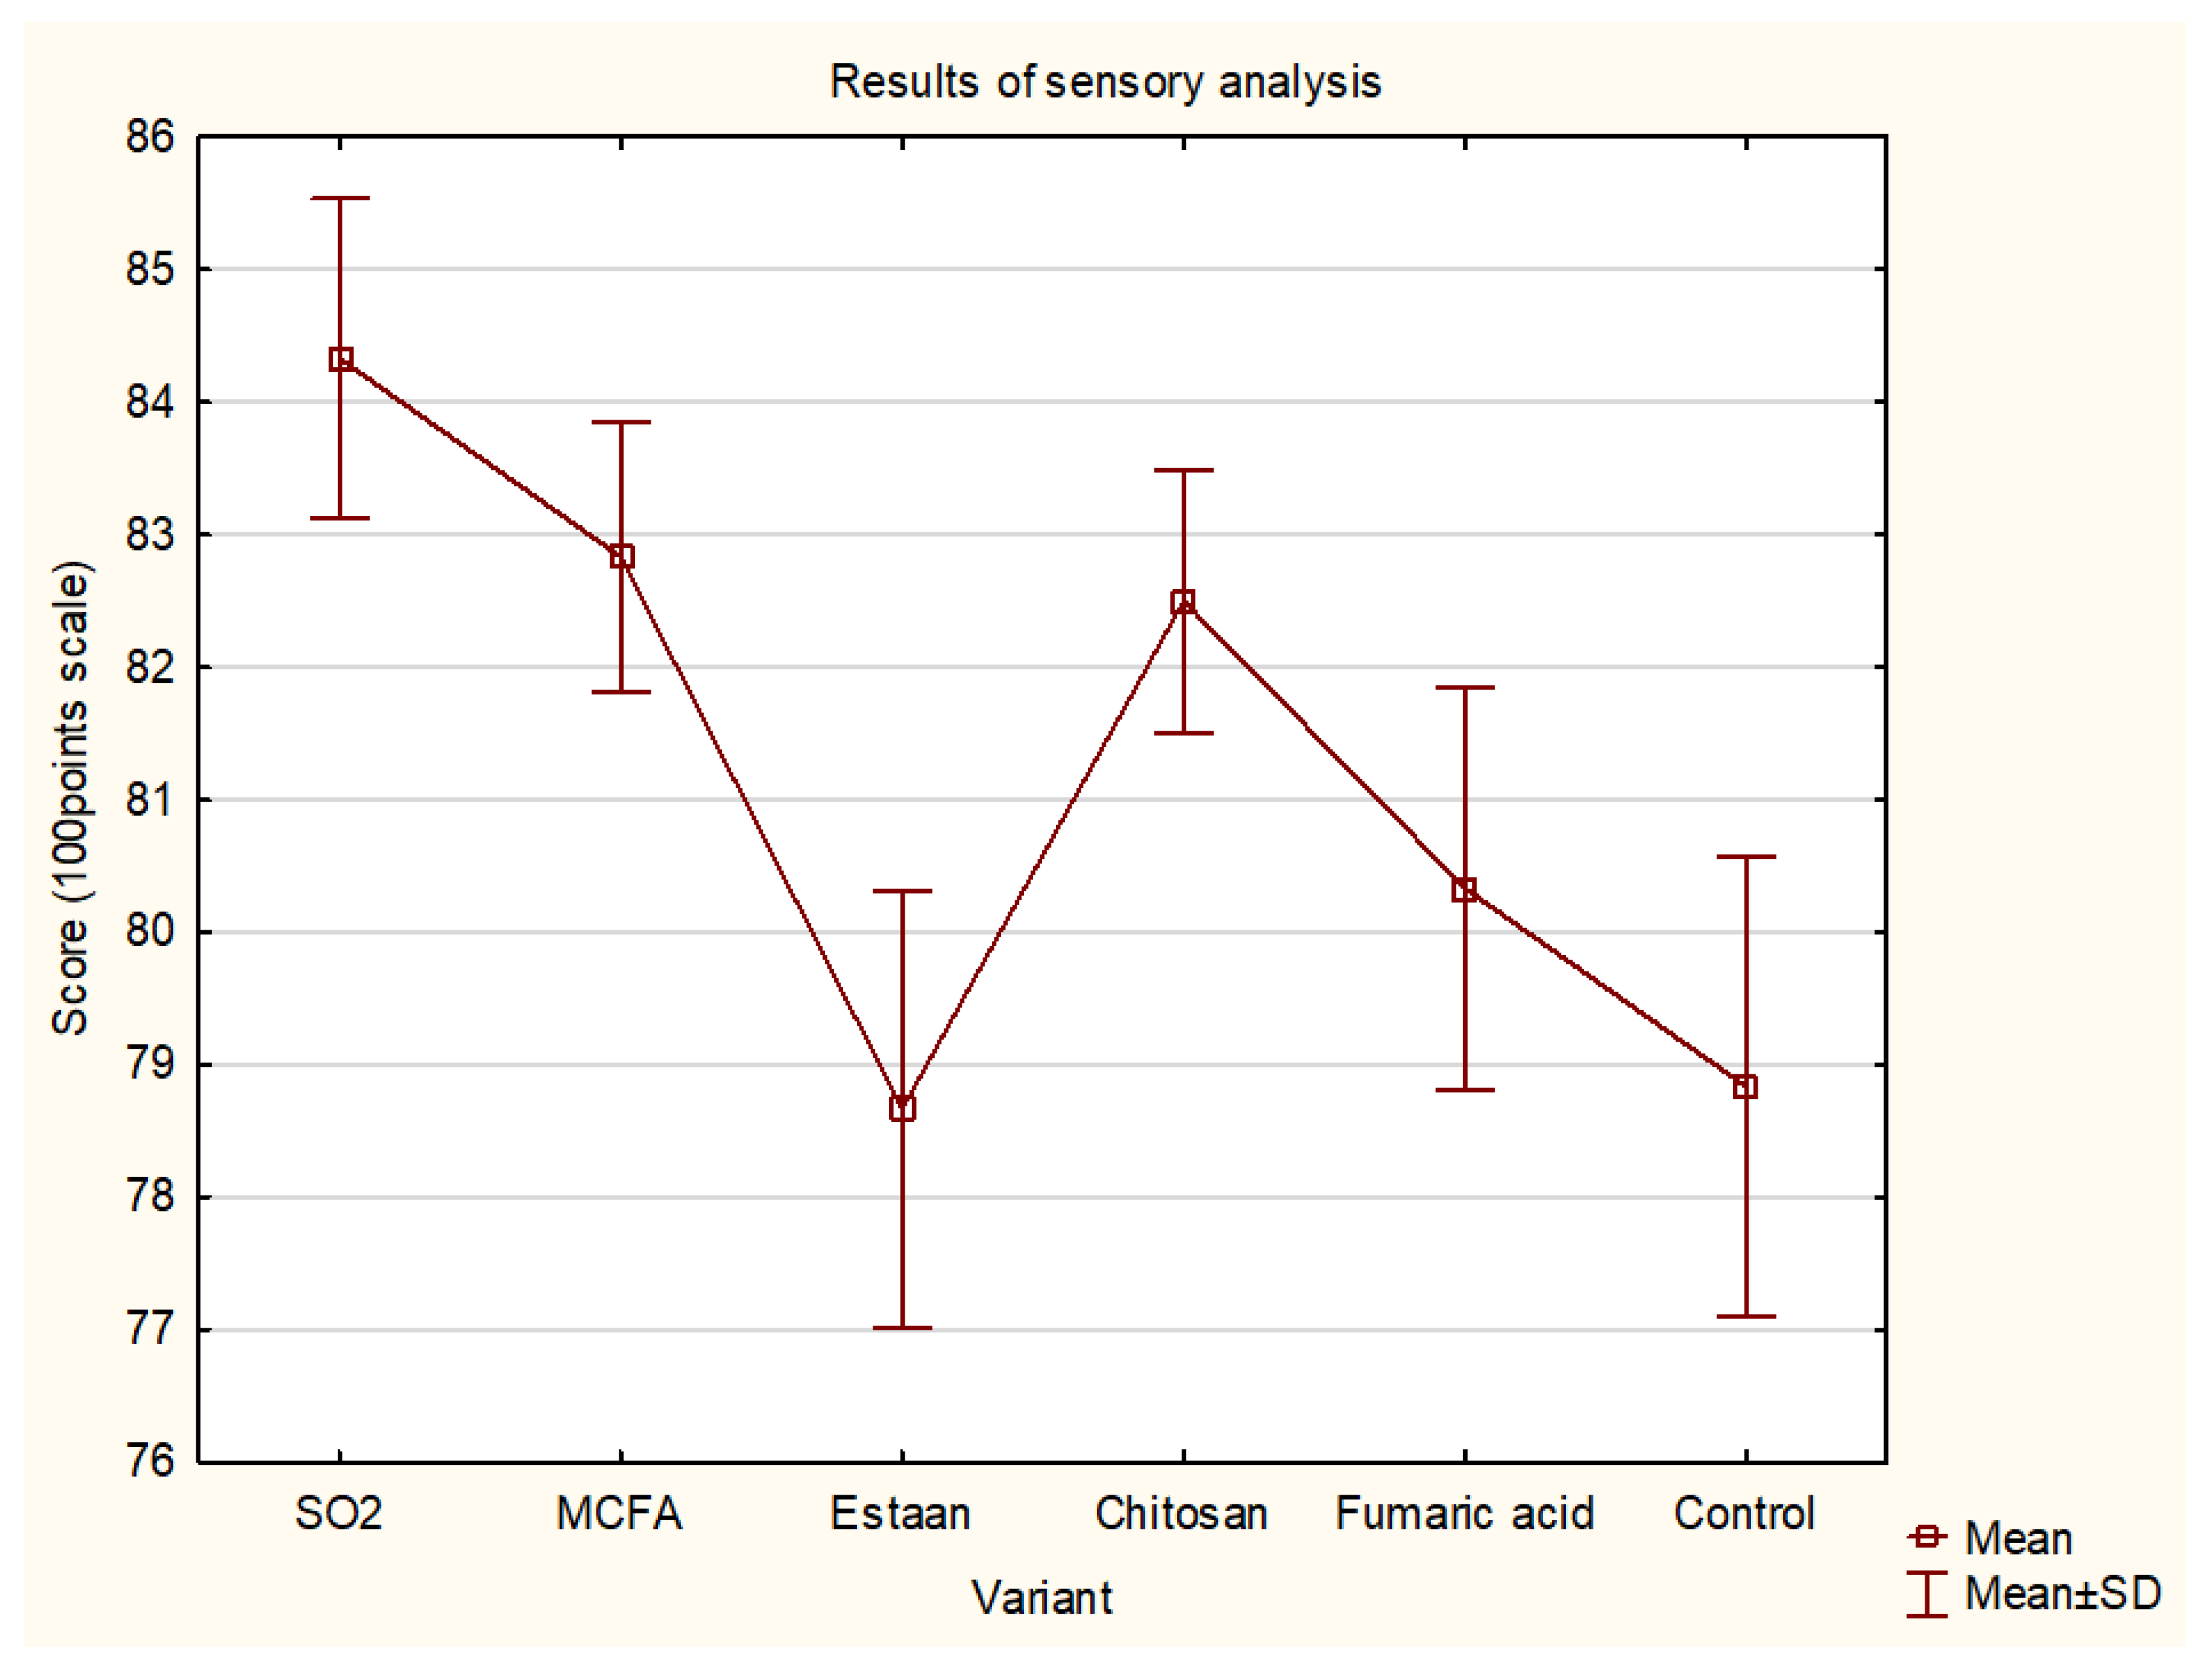
Table 1.
Results of basic analytical parameters (Mean ± SE).
| Variant | Term | Alcohol (% vol.) |
Titr. Acids (g.L-1) |
Res. Sugar (g.L-1) |
pH | Malic acid (g.L-1) |
Lactic acid (g.L-1) |
Acetic acid (g.L-1) |
|---|---|---|---|---|---|---|---|---|
| Control | 8.3. | 11.76±0.28 | 6.13±0.17 | 0.26±0.19 | 3.34±0.02 | 0.35±0.10 | 1.18±0.11 | 0.31±0.02 |
| 18.9. | 12.16±0.02 | 6.18±0.03 | 0.32±0.32 | 2.98±0.02 | 0.79±0.18 | 1.32±0.16 | 0.25±0.02 | |
| SO2 | 8.3. | 12.01±0.06 | 6.89±0.04 | 0.00±0.00 | 3.26±0.02 | 1.97±0.14 | 0.43±0.12 | 0.25±0.02 |
| 18.9. | 12.12±0.02 | 6.61±0.1 | 1.29±0.47 | 3.14±0.01 | 2.16±0.23 | 0.09±0.06 | 0.30±0.02 | |
| Estaan | 8.3. | 12.20±0.04 | 7.18±0.11 | 0.00±0.00 | 3.24±0.01 | 2.18±0.12 | 0.26±0.09 | 0.26±0.02 |
| 18.9. | 12.19±0.04 | 5.76±0.04 | 1.69±0.60 | 3.12±0.07 | 0.61±0.21 | 0.90±0.10 | 0.34±0.02 | |
| MCFA | 8.3. | 12.08±0.03 | 7.10±0.08 | 0.00±0.00 | 3.24±0.02 | 2.23±0.08 | 0.19±0.07 | 0.29±0.02 |
| 18.9. | 12.15±0.04 | 6.60±0.12 | 1.66±0.67 | 3.16±0.02 | 1.93±0.17 | 0.06±0.06 | 0.30±0.02 | |
| Fumaric | 8.3. | 12.10±0.04 | 7.22±0.12 | 0.12±0.11 | 3.22±0.02 | 2.27±0.22 | 0.09±0.05 | 0.29±0.03 |
| 18.9. | 12.15±0.02 | 6.72±0.11 | 2.45±0.39 | 3.12±0.02 | 2.21±0.22 | 0.03±0.03 | 0.32±0.02 | |
| Chitosan | 8.3. | 12.08±0.02 | 7.12±0.13 | 0.12±0.12 | 3.23±0.02 | 2.01±0.21 | 0.33±0.11 | 0.31±0.03 |
| 18.9. | 12.13±0.04 | 6.21±0.06 | 0.00±0.00 | 3.00±0.03 | 0.17±0.07 | 1.53±0.07 | 0.31±0.02 |
Disclaimer/Publisher’s Note: The statements, opinions and data contained in all publications are solely those of the individual author(s) and contributor(s) and not of MDPI and/or the editor(s). MDPI and/or the editor(s) disclaim responsibility for any injury to people or property resulting from any ideas, methods, instructions or products referred to in the content. |
© 2023 by the authors. Licensee MDPI, Basel, Switzerland. This article is an open access article distributed under the terms and conditions of the Creative Commons Attribution (CC BY) license (http://creativecommons.org/licenses/by/4.0/).
Copyright: This open access article is published under a Creative Commons CC BY 4.0 license, which permit the free download, distribution, and reuse, provided that the author and preprint are cited in any reuse.


