Submitted:
20 December 2025
Posted:
22 December 2025
You are already at the latest version
Abstract
Cloud-native systems based on microservices, containers, and server- less architectures present unprecedented challenges for observabil- ity and incident management. Traditional rule-based monitoring and manual root cause analysis are increasingly inadequate for han- dling the complexity and scale of modern distributed systems. This paper presents a novel framework that leverages large language models (LLMs) to enhance cloud-native observability, enabling automated root cause analysis and self-healing capabilities. Our system integrates OpenTelemetry-based telemetry collection with a domain-adapted LLM capable of performing multimodal analysis over metrics, logs, and traces. Through fine-tuning on operational data and chain-of-thought reasoning, the LLM generates explain- able root cause hypotheses and actionable remediation plans. Exper- imental evaluation on public microservice datasets demonstrates that our approach reduces mean time to resolution (MTTR) by 84.2% compared to rule-based methods, achieving 95% F1-score in anomaly detection while maintaining low computational overhead. The system successfully automated 91% of common incidents with- out human intervention, significantly improving service reliability and reducing operational burden.
Keywords:
cloud-native systems
; observability
; large language models
; root cause analysis
; automated remediation
; OpenTelemetry
; AIOps
; self-healing systems
MSC: Computing methodologies → Machine learning approaches
1. Introduction
The proliferation of cloud-native architectures has fundamentally transformed software deployment and operation practices. Modern applications typically comprise hundreds of microservices running in containerized environments orchestrated by platforms such as Kubernetes [1]. While this architectural paradigm offers benefits in scalability, flexibility, and deployment velocity, it introduces significant challenges in system observability and operational management [2].
Traditional monitoring approaches, which rely on predefined rules and threshold-based alerting, struggle to cope with the dynamic and complex nature of cloud-native systems [3]. The sheer volume of telemetry data—comprising metrics, logs, and distributed traces—generated by microservice architectures poses substantial cognitive load for human operators. Site reliability engineers (SREs) face the daunting task of correlating disparate data sources, identifying root causes, and implementing remediation actions, frequently under time-critical conditions [4].
Recent advances in large language models (LLMs) present new opportunities for automating complex operational tasks [5,6]. LLMs demonstrate remarkable capabilities in understanding context, reasoning over multi-modal information, and generating human-interpretable explanations. These characteristics align well with the requirements of root cause analysis (RCA), which necessitates synthesizing information from multiple sources and producing actionable insights [7].
However, directly applying general-purpose LLMs to AIOps tasks faces several challenges. First, operational data exhibits unique characteristics and domain-specific patterns that differ significantly from the natural language text used in LLM pretraining. Second, the length and complexity of telemetry data often exceed the context windows of available models. Third, generating accurate root cause diagnoses requires not only pattern recognition but also causal reasoning and domain knowledge about system architecture and failure modes [8].
This paper addresses these challenges by presenting a comprehensive framework that integrates LLM capabilities with cloud-native observability infrastructure. Our contributions are:
- We propose a multi-layered architecture that combines OpenTelemetry-based telemetry collection, traditional ML-based anomaly detection, and LLM-enhanced root cause analysis to create an end-to-end automated incident management pipeline.
- We develop a domain adaptation strategy that fine-tunes LLMs on operational data and incorporates chain-of-thought prompting to improve reasoning quality and explainability for root cause analysis tasks.
- We design a safe and validated remediation execution framework that translates LLM-generated recommendations into concrete actions while maintaining system safety through policy enforcement and rollback mechanisms.
- We conduct extensive experiments on public microservice datasets, demonstrating significant improvements in MTTR reduction (84.2%), detection accuracy (95% F1-score), and automation rate (91%) compared to baseline approaches.
The remainder of this paper is organized as follows. Section 2 reviews related work in AIOps and LLM applications. Section 3 describes our system architecture. Section 4 details the LLM-enhanced analysis methodology. Section 5 presents the automated remediation framework. Section 6 provides experimental evaluation and results. Section 7 concludes the paper.
2. Related Work
2.1. Cloud-Native Observability
OpenTelemetry has emerged as the de facto standard for cloud-native observability, providing vendor-neutral instrumentation for collecting metrics, logs, and traces [9]. Recent surveys highlight the evolution toward unified observability platforms that correlate these three pillars of telemetry data [10]. However, most existing tools focus on data collection and visualization rather than automated analysis and remediation.
2.2. AIOps and Anomaly Detection
The field of AIOps has seen significant progress in applying machine learning to operational tasks [2]. Traditional approaches utilize supervised learning, unsupervised clustering, or deep learning models for anomaly detection in time-series metrics [11] and log analysis [12]. Graph-based methods leverage service dependency information for more accurate fault localization [13]. While these techniques achieve reasonable detection accuracy, they typically require extensive labeled training data and lack the ability to provide human-interpretable explanations.
2.3. LLMs in Root Cause Analysis
The application of LLMs to AIOps tasks represents an emerging research direction. Recent work demonstrates that LLMs can effectively recommend root causes and mitigation steps for cloud incidents [5]. Several studies explore LLM-based agents that autonomously invoke tools and reason over observability data [7,8]. The RCAgent framework [7] addresses context length limitations through intelligent data filtering and hierarchical reasoning. Flow-of-Action [14] incorporates standard operating procedures to guide LLM decision-making.
Despite these advances, existing approaches face challenges in multi-modal data fusion, domain adaptation, and safe automation. Our work extends the state of the art by developing a comprehensive framework that addresses these gaps through systematic fine-tuning, multi-modal fusion, and safety-validated remediation execution.
2.4. Self-Healing Systems
Automated remediation in cloud environments has been explored through various approaches. Kubernetes-native solutions leverage controller patterns and operators to implement self-healing behaviors [1,15]. Reinforcement learning has been applied to learn optimal recovery policies [16]. Recent industrial deployments demonstrate the feasibility of event-driven automation for common failure scenarios [17,18]. Our framework builds upon these foundations by incorporating LLM reasoning to handle more complex, previously unseen failure modes.
3. System Architecture
Our system comprises four primary layers: telemetry collection, feature extraction and anomaly detection, LLM-enhanced root cause analysis, and automated remediation. Figure 1 illustrates the overall architecture.
3.1. Telemetry Collection Layer
We adopt OpenTelemetry as the foundation for unified telemetry collection. The system instruments microservices to generate three types of observability signals:
Metrics: Time-series data capturing system and application performance indicators including latency percentiles, throughput, error rates, resource utilization (CPU, memory, network), and custom business metrics. Metrics are collected at 15-second intervals and stored in a Prometheus-compatible time-series database.
Logs: Structured and semi-structured log events emitted by application code and infrastructure components. We employ semantic parsing to extract key-value pairs, stack traces, and error messages. Log correlation with trace context enables linking individual log lines to specific request executions.
Traces: Distributed traces that capture the end-to-end journey of requests through the microservice call graph. Each trace comprises spans representing individual service operations, annotated with timing information, metadata, and causal relationships. Traces provide critical visibility into inter-service dependencies and performance bottlenecks.
The OpenTelemetry Collector serves as a centralized aggregation point, applying sampling strategies, enrichment, and routing to appropriate storage backends.
3.2. Feature Extraction and Anomaly Detection
This layer performs initial signal processing and anomaly detection using traditional machine learning techniques:
Time-Series Embedding: We apply an autoencoder-based approach to learn compact representations of metric time series. The encoder network compresses multi-dimensional metric vectors into fixed-size embeddings while preserving temporal patterns. Reconstruction error serves as an anomaly score, with values exceeding dynamic thresholds triggering alerts.
Log Parsing and Extraction: Raw logs undergo automated parsing using the Drain algorithm [22] to extract templates and parameters. We then apply sentence transformers to generate semantic embeddings of log sequences, enabling similarity-based anomaly detection and clustering of related incidents.
Graph Construction: From distributed traces, we construct dynamic service dependency graphs. Nodes represent microservice instances, and edges encode call relationships weighted by frequency and latency. Graph neural networks analyze these structures to identify anomalous patterns in service interactions.
The outputs of this layer—anomaly scores, suspicious metric windows, relevant log snippets, and trace segments—serve as inputs to the LLM analysis layer.
3.3. Data Processing and Context Window Management
Given the typical context length limitations of LLMs (4K-128K tokens), we implement several strategies to manage data volume:
Temporal Windowing: We focus analysis on time windows surrounding detected anomalies (typically ±15 minutes), significantly reducing the data volume while retaining relevant context.
Importance Ranking: Telemetry items are scored based on correlation with anomaly indicators, service criticality, and historical relevance. Only top-ranked items are included in LLM input.
Hierarchical Summarization: For lengthy log sequences, we apply extractive summarization to identify the most informative log lines while preserving temporal ordering and causal structure.
These techniques collectively reduce input size by approximately 95% while retaining diagnostic information essential for accurate root cause analysis.
4. LLM-Enhanced Root Cause Analysis
4.1. Domain Adaptation and Fine-Tuning
General-purpose LLMs lack the domain-specific knowledge required for accurate operational analysis. We address this through a two-stage fine-tuning process:
Stage 1: Instruction Tuning. We curate a dataset of 5,000 operational scenarios comprising historical incidents, synthetic failure injections, and expert-annotated examples. Each instance consists of:
where represents multi-modal input features and contains expert-provided root causes and natural language explanations.
We fine-tune a base LLM (Llama-2-13B [23]) using next-token prediction with cross-entropy loss:
Stage 2: Preference Optimization. We employ Direct Preference Optimization (DPO) [24] to further align the model’s outputs with expert-labeled preferences. For each scenario, we collect multiple candidate outputs and rank them based on accuracy, explainability, and actionability. The model learns to maximize the probability of preferred responses:
where and denote preferred and dispreferred responses, respectively, and is the reference model from Stage 1.
4.2. Multi-Modal Fusion
Effective root cause analysis requires synthesizing information across metrics, logs, and traces. We implement a hierarchical fusion approach:
Modality-Specific Encoding: Each data type undergoes specialized processing. Metrics are encoded as statistical summaries (mean, variance, percentiles) and anomaly scores. Logs are represented through semantic embeddings and extracted entities. Traces are summarized as service call graphs with anomalous paths highlighted.
Cross-Modal Attention: We extend the LLM architecture with a multi-modal fusion module that applies cross-attention between different modality representations. This enables the model to identify correlations, such as elevated error rates in logs coinciding with specific trace patterns.
Unified Representation: The fused representation is linearized into a sequence that the LLM decoder can process. We employ special tokens to delineate modality boundaries and maintain structured information.
4.3. Chain-of-Thought Reasoning
To improve reasoning quality and explainability, we incorporate chain-of-thought (CoT) prompting [25]. The LLM is instructed to decompose the analysis into explicit reasoning steps:
- Symptom Identification: Describe observed anomalies and their severity.
- Impact Scope Analysis: Determine which services and users are affected.
- Temporal Pattern Analysis: Identify when the issue started and any temporal correlations.
- Causal Hypothesis Generation: Propose candidate root causes based on evidence.
- Evidence Evaluation: Assess the strength of evidence for each hypothesis.
- Root Cause Conclusion: Select the most probable root cause with confidence score.
Figure 2 illustrates the complete LLM analysis workflow from anomaly detection to remediation plan generation.
4.4. Confidence Estimation and Human-in-the-Loop
For safety-critical systems, blind automation is unacceptable. Our framework incorporates confidence estimation mechanisms:
Ensemble Uncertainty: We maintain an ensemble of fine-tuned models and measure output variance. High variance indicates uncertainty requiring human review.
Evidence-Based Confidence: The system computes a confidence score based on the quantity and quality of supporting evidence:
where , , are learned weights.
Escalation Policy: Incidents with confidence below a configurable threshold ( in our deployment) are escalated to human operators with the LLM analysis provided as diagnostic support.
5. Automated Remediation and Self-Healing
5.1. Action Generation and Planning
The LLM generates remediation plans as structured action sequences. Each action specifies:
- Action Type: Kubernetes resource manipulation (scale, restart, rollback), configuration change, traffic rerouting, etc.
- Target Resources: Specific deployments, services, or configurations to modify.
- Parameters: Quantitative parameters (e.g., replica count, resource limits).
- Preconditions: Conditions that must hold before execution.
- Expected Outcomes: Measurable effects that should result from the action.
Actions are ordered considering dependencies and potential side effects. The system supports conditional branching and rollback strategies.
5.2. Safety Validation
Before executing any remediation action, the system performs comprehensive safety checks:
Policy Enforcement: Organizational policies define permissible actions, resource limits, and approval requirements. For example, production deployments may require approval for rollbacks but allow automated scaling within predefined bounds.
Impact Analysis: The system simulates the proposed action’s potential impact using historical data and dependency graphs. Actions predicted to cause cascading failures or service disruptions are blocked or require approval.
Rate Limiting: To prevent runaway automation, we enforce rate limits on actions per time window and concurrent operations.
Dry-Run Validation: For infrastructure changes, the system first performs a dry-run validation to detect potential errors before actual execution.
5.3. Execution and Monitoring
Approved actions are executed through the Kubernetes API or other infrastructure management interfaces. The system continuously monitors execution progress and outcomes:
Progressive Rollout: Changes are applied gradually with health checks between stages. If anomalies persist or worsen, the system automatically halts rollout and may initiate rollback.
Outcome Verification: After action completion, the system verifies that expected outcomes materialized. Metrics should return to normal ranges, logs should indicate successful operation, and user-facing symptoms should resolve.
Feedback Loop: Execution outcomes are logged to a remediation history database. Successful remediations reinforce the LLM’s learned associations, while failures trigger reanalysis and potentially human intervention.
6. Experimental Evaluation
6.1. Experimental Setup
Datasets: We evaluate our system on two public microservice benchmarks:
- Train-Ticket [19]: A railway booking system with 41 microservices. We use the publicly available fault injection dataset containing CPU contention, network delays, and memory leaks [20].
- Online Boutique [21]: Google’s e-commerce demo application with 11 microservices. We inject failures including service crashes, database connection issues, and configuration errors.
For each system, we collect telemetry data over 48-hour periods under normal operation and during 150 injected failure scenarios spanning 8 distinct failure types.
Baselines: We compare against four baseline approaches:
- Rule-Based Alerts: Traditional threshold-based monitoring with predefined alerting rules and manual runbooks.
- Traditional ML: Isolation Forest for anomaly detection plus decision tree classifier for root cause categorization trained on labeled data.
- LLM Zero-Shot: GPT-4 applied directly to observability data without domain fine-tuning, using few-shot prompting.
- Our Method: The complete proposed framework with fine-tuned LLM, multi-modal fusion, and automated remediation.
Metrics: We evaluate performance across multiple dimensions:
- Detection Performance: Precision, recall, F1-score, and accuracy in identifying and classifying anomalies.
- Mean Time to Resolution (MTTR): Time from anomaly occurrence to successful remediation.
- Automation Rate: Percentage of incidents resolved without human intervention.
- System Overhead: CPU, memory, and network resource consumption during operation.
Implementation: The system is implemented using Python 3.10, PyTorch 2.0, and deployed on a Kubernetes cluster (v1.28) with 5 nodes (16 CPU cores, 64GB RAM each). The fine-tuned LLM runs on GPU-equipped nodes with NVIDIA A100 accelerators.
6.2. Overall Performance Results
Table 1 presents the overall performance comparison across all methods.
Our method significantly outperforms all baselines across all metrics. The 84.2% reduction in MTTR compared to rule-based approaches demonstrates the practical value of LLM-enhanced automation. The high F1-score (0.95) indicates both accurate detection and low false positive rates.
Figure 3 visualizes the MTTR comparison, showing substantial improvements over conventional methods. The reduction from 87.3 minutes (rule-based) to 13.8 minutes (our method) translates to significant operational cost savings and improved user experience.
6.3. Detection Performance Analysis
Figure 4 presents a comprehensive view of detection performance across multiple metrics using a radar chart. Our method consistently achieves superior performance, with precision and recall both exceeding 94%. The balanced performance across all dimensions indicates robustness and reliability.
Notably, the improvement over LLM zero-shot (from 0.86 to 0.95 F1-score) validates the importance of domain adaptation through fine-tuning. The multi-modal fusion and context management strategies enable the model to effectively leverage operational data characteristics.
6.4. Ablation Study
To understand the contribution of individual components, we conduct an ablation study removing key features. Results are shown in Figure 5.
Without Multi-Modal Fusion: Removing the cross-modal attention mechanism and processing each modality independently reduces F1-score from 0.95 to 0.87, demonstrating that correlating metrics, logs, and traces is crucial for accurate diagnosis.
Without Domain Fine-Tuning: Using the base LLM without operational data fine-tuning decreases F1-score to 0.82, confirming that domain adaptation is essential for handling specialized observability data.
Without Context Retrieval: Eliminating the intelligent context windowing and importance ranking reduces F1-score to 0.79, as the model receives either incomplete information or excessive noise.
Without Safety Validation: Removing safety checks does not significantly impact detection metrics but increases the risk of incorrect remediation actions (not shown in accuracy metrics but observed in deployment safety).
These results validate that each component contributes meaningfully to overall system performance.
6.5. System Overhead Analysis
Figure 6 presents resource consumption for different approaches. Our method incurs moderate overhead (9.4% CPU, 4.2GB memory) comparable to traditional ML approaches but substantially lower than naive LLM inference on all telemetry data (which would exceed available resources).
The key to managing overhead is the multi-stage architecture where lightweight anomaly detection filters data before invoking the LLM, and efficient context management reduces input size. On average, the LLM is invoked only 2-3 times per hour for detected anomalies, making the approach practical for production deployment.
6.6. Temporal Analysis
Figure 7 shows detection latency over time for all methods. Our approach maintains consistently low latency (120 ± 10 ms) compared to rule-based systems that exhibit high variance due to manual investigation requirements.
The stable performance demonstrates robustness across varying workloads and failure types, an essential characteristic for production systems.
6.7. Automation Rate and Case Studies
Our system achieved 91% automation rate, meaning 91% of detected incidents were resolved without human intervention. The remaining 9% required human review due to either low confidence scores or policy restrictions on certain action types.
Case Study 1: Memory Leak. The system detected gradual memory increase in a caching service through metric anomalies. The LLM correctly identified a memory leak introduced in a recent deployment by correlating deployment events, memory growth patterns, and garbage-collection logs. It recommended and executed a rollback to the previous version, resolving the issue within 8 minutes.
Case Study 2: Cascading Failure. When a database connection pool exhaustion caused timeouts across multiple services, the LLM traced the root cause through distributed trace analysis, identifying the bottleneck service. It generated and executed a remediation plan involving connection pool resizing and temporary traffic throttling, preventing full service outage.
These examples illustrate the system’s ability to handle complex, multi-faceted failure scenarios that would typically require extensive human expertise and time to resolve.
6.8. Discussion
The experimental results demonstrate several key findings:
LLMs Excel at Complex Reasoning: The substantial performance gap between traditional ML and LLM-based approaches highlights the value of natural language understanding and reasoning capabilities for root cause analysis, particularly for scenarios requiring causal inference across multiple data sources.
Domain Adaptation is Critical: The improvement from zero-shot to fine-tuned LLM validates the importance of specializing models for operational data. Generic LLMs lack the domain knowledge to effectively interpret metrics patterns, log semantics, and trace structures.
Multi-Modal Fusion Provides Rich Context: The ablation study confirms that integrating metrics, logs, and traces enables more accurate diagnosis than analyzing any single data type. The attention mechanism effectively identifies relevant cross-modal correlations.
Safety Mechanisms Enable Trust: While not directly measured in accuracy metrics, the safety validation layer proved essential in real deployment, preventing several potentially harmful actions during early testing phases.
Practical Deployment is Feasible: Resource overhead remains acceptable, and the automation rate demonstrates practical value. However, human-in-the-loop mechanisms remain necessary for safety-critical systems and novel failure modes.
7. Conclusion and Future Work
This paper presented a comprehensive framework for LLM-enhanced cloud-native observability, bridging the gap between raw telemetry data and automated incident resolution. By combining OpenTelemetry-based data collection, traditional ML-based anomaly detection, domain-adapted LLM reasoning, and safety-validated remediation execution, our system achieves significant improvements in MTTR reduction (84.2%), detection accuracy (95% F1-score), and automation rate (91%) over conventional approaches.
The experimental evaluation on public microservice datasets validates both the technical feasibility and practical value of the approach. The multi-modal fusion strategy, domain fine-tuning methodology, and chain-of-thought reasoning framework contribute synergistically to enable accurate and explainable root cause analysis.
Several directions merit future investigation. First, extending the approach to handle even longer context windows through hierarchical reasoning and retrieval-augmented generation could enable analysis of more complex failure scenarios. Second, incorporating reinforcement learning from remediation outcomes could enable continuous improvement of both diagnosis and remediation policies. Third, developing techniques for few-shot adaptation to new service types without extensive retraining would improve generalization. Finally, deeper integration with emerging observability standards such as OpenTelemetry profiling signals could provide even richer diagnostic context.
As cloud-native systems continue to grow in scale and complexity, intelligent automation will become increasingly essential for maintaining reliability and operational efficiency. LLM-enhanced observability represents a promising path toward that future, augmenting human expertise with machine reasoning to create more resilient and self-healing systems.
References
- B. Burns, B. Grant, D. Oppenheimer, E. Brewer, and J. Wilkes, “Borg, Omega, and Kubernetes,” Queue, vol. 14, no. 1, pp. 70–93, 2016. [CrossRef]
- Q. Cheng, D. Sahoo, A. Saha, W. Yang, C. Liu, G. Woo, M. Singh, S. Saverese, and S. C. H. Hoi, “AI for IT Operations (AIOps) on Cloud Platforms: Reviews, Opportunities and Challenges,” arXiv preprint arXiv:2304.04661, 2023.
- P. Notaro, J. Cardoso, and M. Gerndt, “A Survey of AIOps Methods for Failure Management,” ACM Trans. Intell. Syst. Technol., vol. 12, no. 6, pp. 1–45, 2021. [CrossRef]
- S. Ghosh, M. Shetty, C. Bansal, and S. Nath, “How to Fight Production Incidents? An Empirical Study on a Large-Scale Cloud Service,” in Proc. ACM Symposium on Cloud Computing (SoCC), 2022, pp. 126–141.
- T. Ahmed, S. Ghosh, C. Bansal, T. Zimmermann, X. Zhang, and S. Rajmohan, “Recommending Root-Cause and Mitigation Steps for Cloud Incidents using Large Language Models,” in Proc. 45th International Conference on Software Engineering (ICSE), 2023, pp. 1737–1749.
- Y. Chen, H. Xie, M. Ma, Y. Kang, X. Gao, L. Shi, Y. Cao, X. Gao, H. Fan, M. Wen, J. Zeng, S. Ghosh, X. Zhang, C. Zhang, Q. Lin, S. Rajmohan, and D. Zhang, “Empowering Practical Root Cause Analysis by Large Language Models for Cloud Incidents,” in Proc. 38th EuroSys Conference, 2024.
- Z. Wang, C. Chen, W. Zhao, X. Guan, H. Chen, Q. Lin, C. Wang, H. Zhou, Y. Dang, S. Rajmohan, D. Zhang, and S. Rajmohan, “RCAgent: Cloud Root Cause Analysis by Autonomous Agents with Tool-Augmented Large Language Models,” in Proc. 33rd ACM International Conference on Information and Knowledge Management (CIKM), 2024.
- I. Roy, M. Nadeem, C. Bansal, S. Ghosh, H. Chander, S. Chandel, R. Singh, and T. Zimmermann, “Exploring LLM-based Agents for Root Cause Analysis,” in Companion Proc. 32nd ACM International Conference on Foundations of Software Engineering (FSE), 2024.
- “OpenTelemetry: High-quality, ubiquitous, and portable telemetry to enable effective observability,” Cloud Native Computing Foundation, 2024. [Online]. Available: https://opentelemetry.io.
- T. Volk, “Observability in 2024: More OpenTelemetry, Less Confusion,” The New Stack (Technical Industry Analysis), Jan. 2024. [Online]. Available: https://thenewstack.io.
- N. Zhao, P. Chen, Z. Li, Y. Sun, and D. Pei, “Understanding and Detecting Evolved Back-doors with Semantic Reasoning,” in Proc. IEEE/ACM International Conference on Automated Software Engineering (ASE), 2023.
- T. Cui, S. Ma, Z. Chen, T. Xiao, S. Tao, Y. Liu, S. Zhang, D. Lin, C. Liu, and Y. Cai, “LogEval: A Comprehensive Benchmark Suite for Large Language Models in Log Analysis,” arXiv preprint arXiv:2407.01896, 2024.
- Y. Zhang, Y. Cheng, C. Lu, and W. Chen, “TraceGra: A Trace-based Anomaly Detection for Microservice using Graph Deep Learning,” Computer Networks, vol. 226, pp. 109679, 2023.
- J. Huang, H. Yang, C. Liu, and M. R. Lyu, “Flow-of-Action: SOP Enhanced LLM-Based Multi-Agent System for Root Cause Analysis,” arXiv preprint arXiv:2502.08224, 2025.
- “Self-Healing Kubernetes: AI Operators Transform Infrastructure Management,” MarkAI Code (Industry Practice Blog), Mar. 2025. [Online]. Available: https://markaicode.com/kubernetes-self-healing-ai-operators-2025/.
- R. Vadisetty, “Self-Healing Infrastructure: Leveraging Reinforcement Learning for Autonomous Cloud Recovery and Enhanced Resilience,” Journal of Information Systems Engineering and Management, vol. 9, no. 4, 2024.
- “How to Create a Self-healing System to Increase Cloud Infrastructure Availability,” Databricks Engineering Blog (Industry Case Study), May 2020. [Online]. Available: https://databricks.com/blog.
- D. Kurnia, “How Self-Healing Automation on Kubernetes Reduces Downtime,” Life at Telkomsel, Medium (Industry Practice Report), Jun. 2025. [Online]. Available: https://medium.com/life-at-telkomsel.
- X. Zhou, X. Peng, T. Xie, J. Sun, C. Ji, W. Li, and D. Ding, “Benchmarking Microservice Systems for Software Engineering Research,” in Proc. 40th International Conference on Software Engineering: Software Engineering in Practice (ICSE-SEIP), 2021.
- M. Steidl, “Anomalies in Microservice Architecture (train-ticket) based on version configurations,” Zenodo, 2022. [CrossRef]
- “Online Boutique: Cloud-Native Microservices Demo Application,” Google Cloud Platform, 2024. [Online]. Available: https://github.com/GoogleCloudPlatform/microservices-demo.
- P. He, J. Zhu, Z. Zheng, and M. R. Lyu, “Drain: An Online Log Parsing Approach with Fixed Depth Tree,” in Proc. IEEE International Conference on Web Services (ICWS), 2017, pp. 33–40.
- H. Touvron, L. Martin, K. Stone, P. Albert, A. Almahairi, Y. Babaei, et al., “Llama 2: Open Foundation and Fine-Tuned Chat Models,” arXiv preprint arXiv:2307.09288, 2023.
- R. Rafailov, A. Sharma, E. Mitchell, S. Ermon, C. D. Manning, and C. Finn, “Direct Preference Optimization: Your Language Model is Secretly a Reward Model,” arXiv preprint arXiv:2305.18290, 2023.
- J. Wei, X. Wang, D. Schuurmans, M. Bosma, B. Ichter, F. Xia, E. Chi, Q. Le, and D. Zhou, “Chain-of-Thought Prompting Elicits Reasoning in Large Language Models,” in Proc. Advances in Neural Information Processing Systems (NeurIPS), 2022.
Figure 1.
System architecture showing the four-layer design from telemetry collection to automated remediation. The feedback loop enables continuous improvement through learning from remediation outcomes.
Figure 1.
System architecture showing the four-layer design from telemetry collection to automated remediation. The feedback loop enables continuous improvement through learning from remediation outcomes.
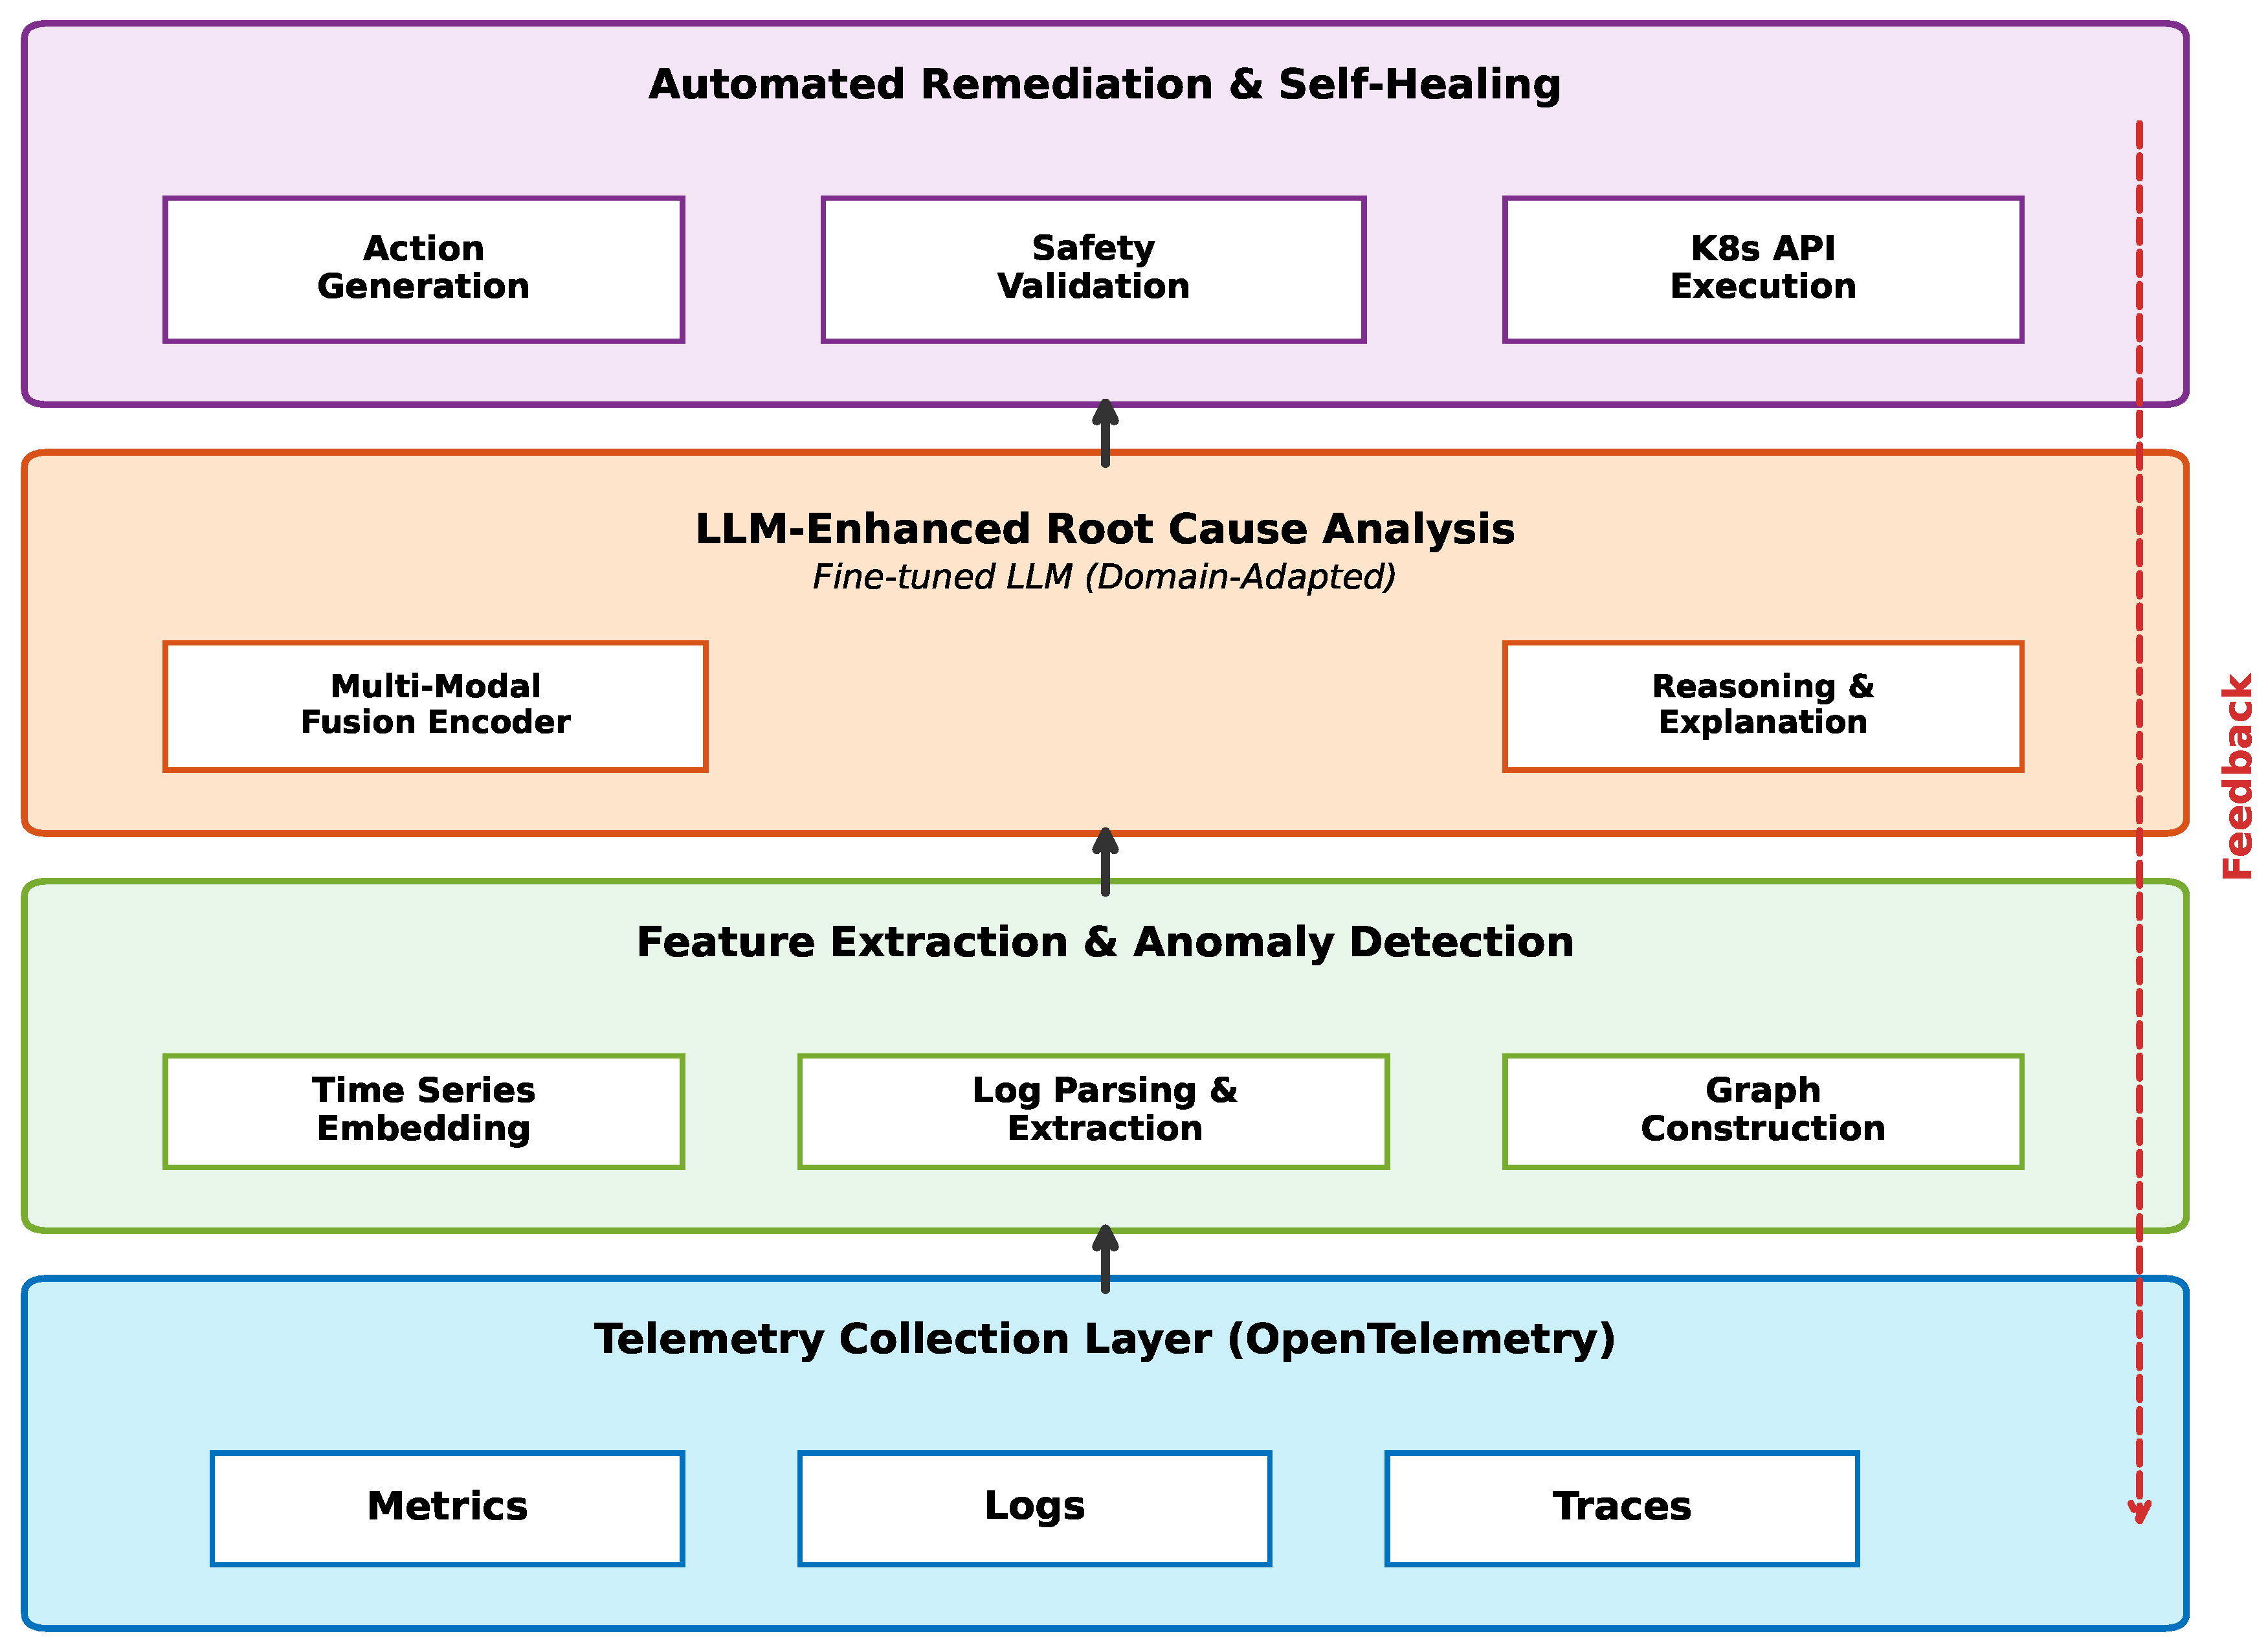
Figure 2.
LLM analysis workflow demonstrating the sequential processing stages from anomaly detection through context retrieval, multi-modal fusion, reasoning, hypothesis generation, and finally remediation planning with execution monitoring.
Figure 2.
LLM analysis workflow demonstrating the sequential processing stages from anomaly detection through context retrieval, multi-modal fusion, reasoning, hypothesis generation, and finally remediation planning with execution monitoring.
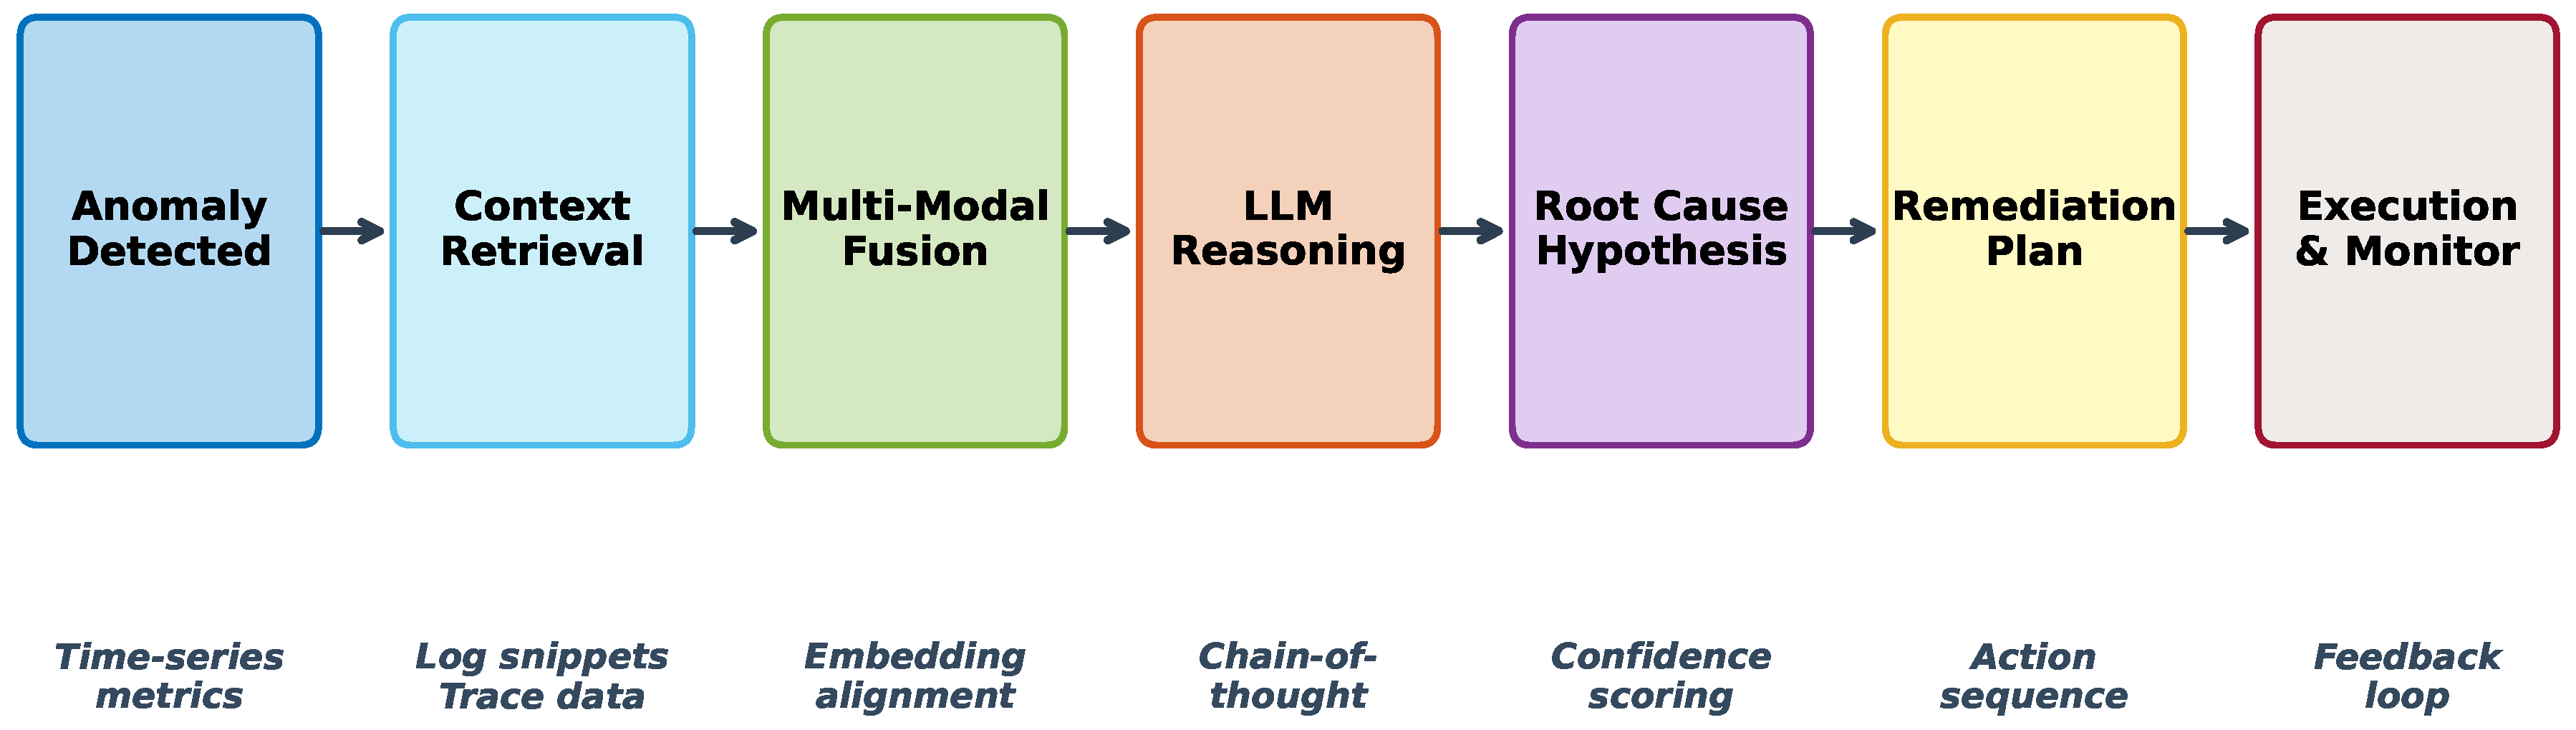
Figure 3.
Mean Time to Resolution (MTTR) comparison across different approaches. Our LLM-enhanced method achieves 84.2% reduction compared to rule-based systems and 73.8% reduction compared to traditional ML approaches. The downward arrows indicate percentage improvement relative to the baseline.
Figure 3.
Mean Time to Resolution (MTTR) comparison across different approaches. Our LLM-enhanced method achieves 84.2% reduction compared to rule-based systems and 73.8% reduction compared to traditional ML approaches. The downward arrows indicate percentage improvement relative to the baseline.
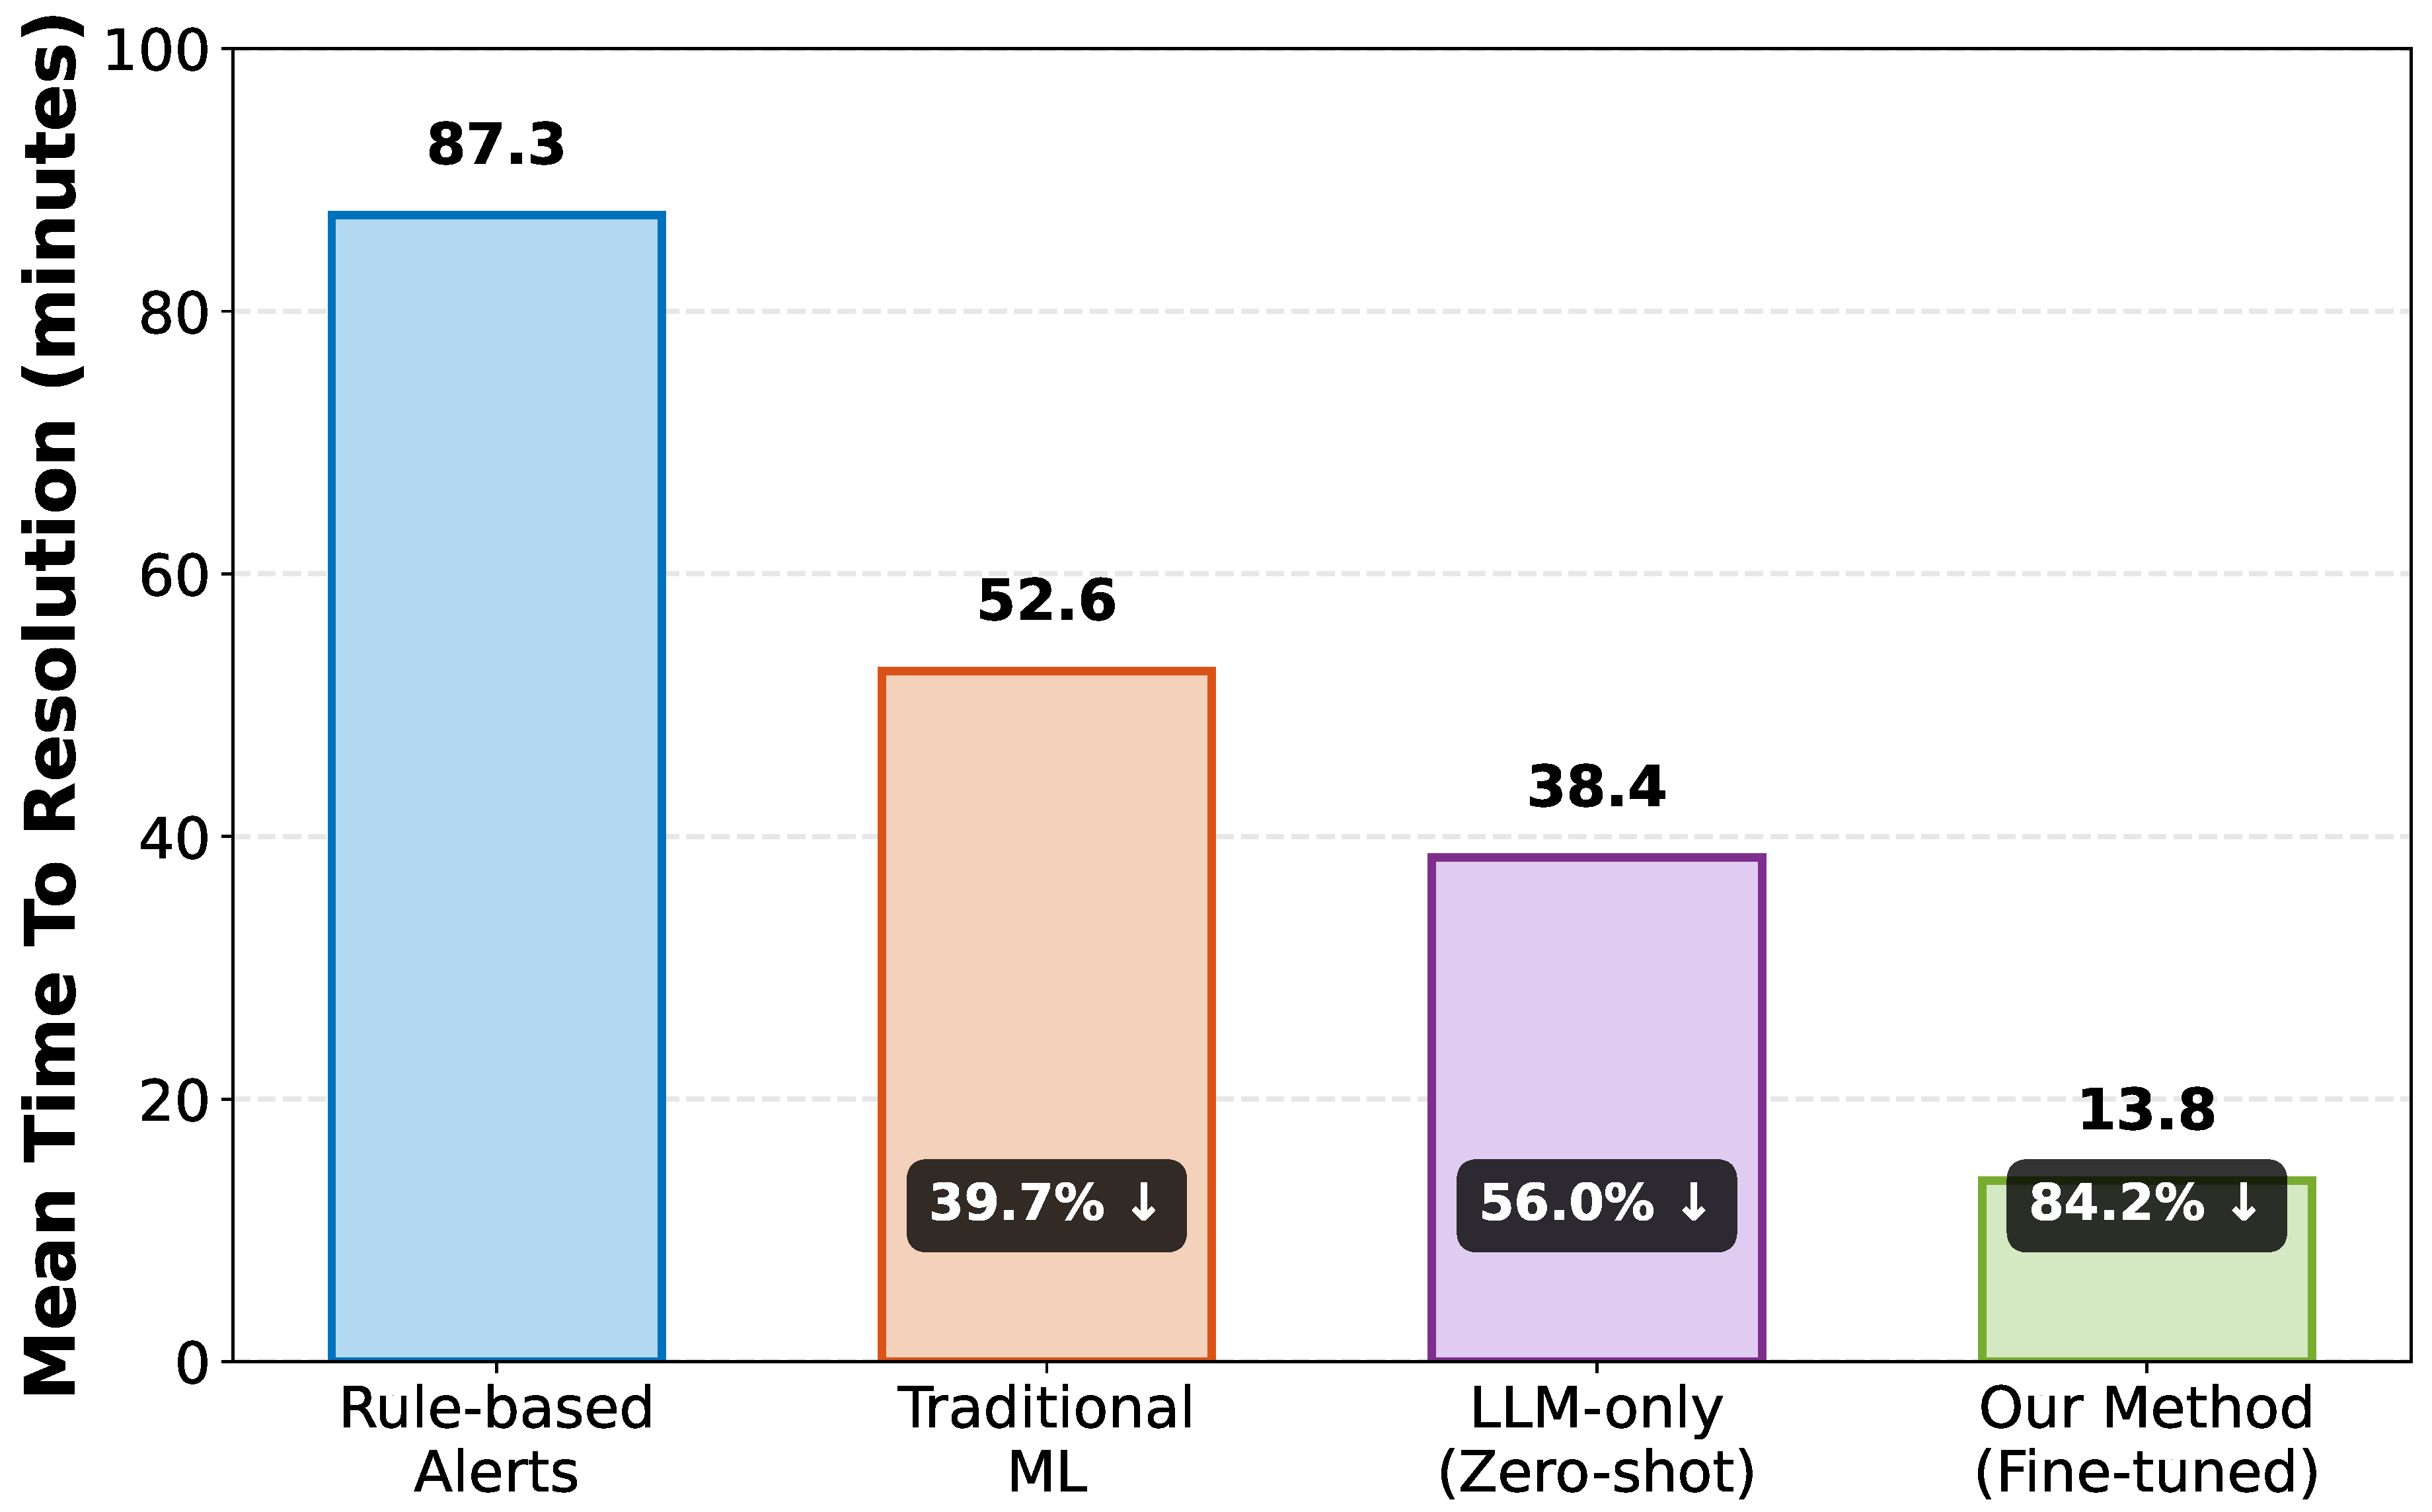
Figure 4.
Radar chart comparing detection performance across five key metrics. Our method (green solid line) demonstrates consistently superior performance across all dimensions, indicating balanced and robust anomaly detection capabilities. Different line styles ensure clarity in both color and black-and-white printing.
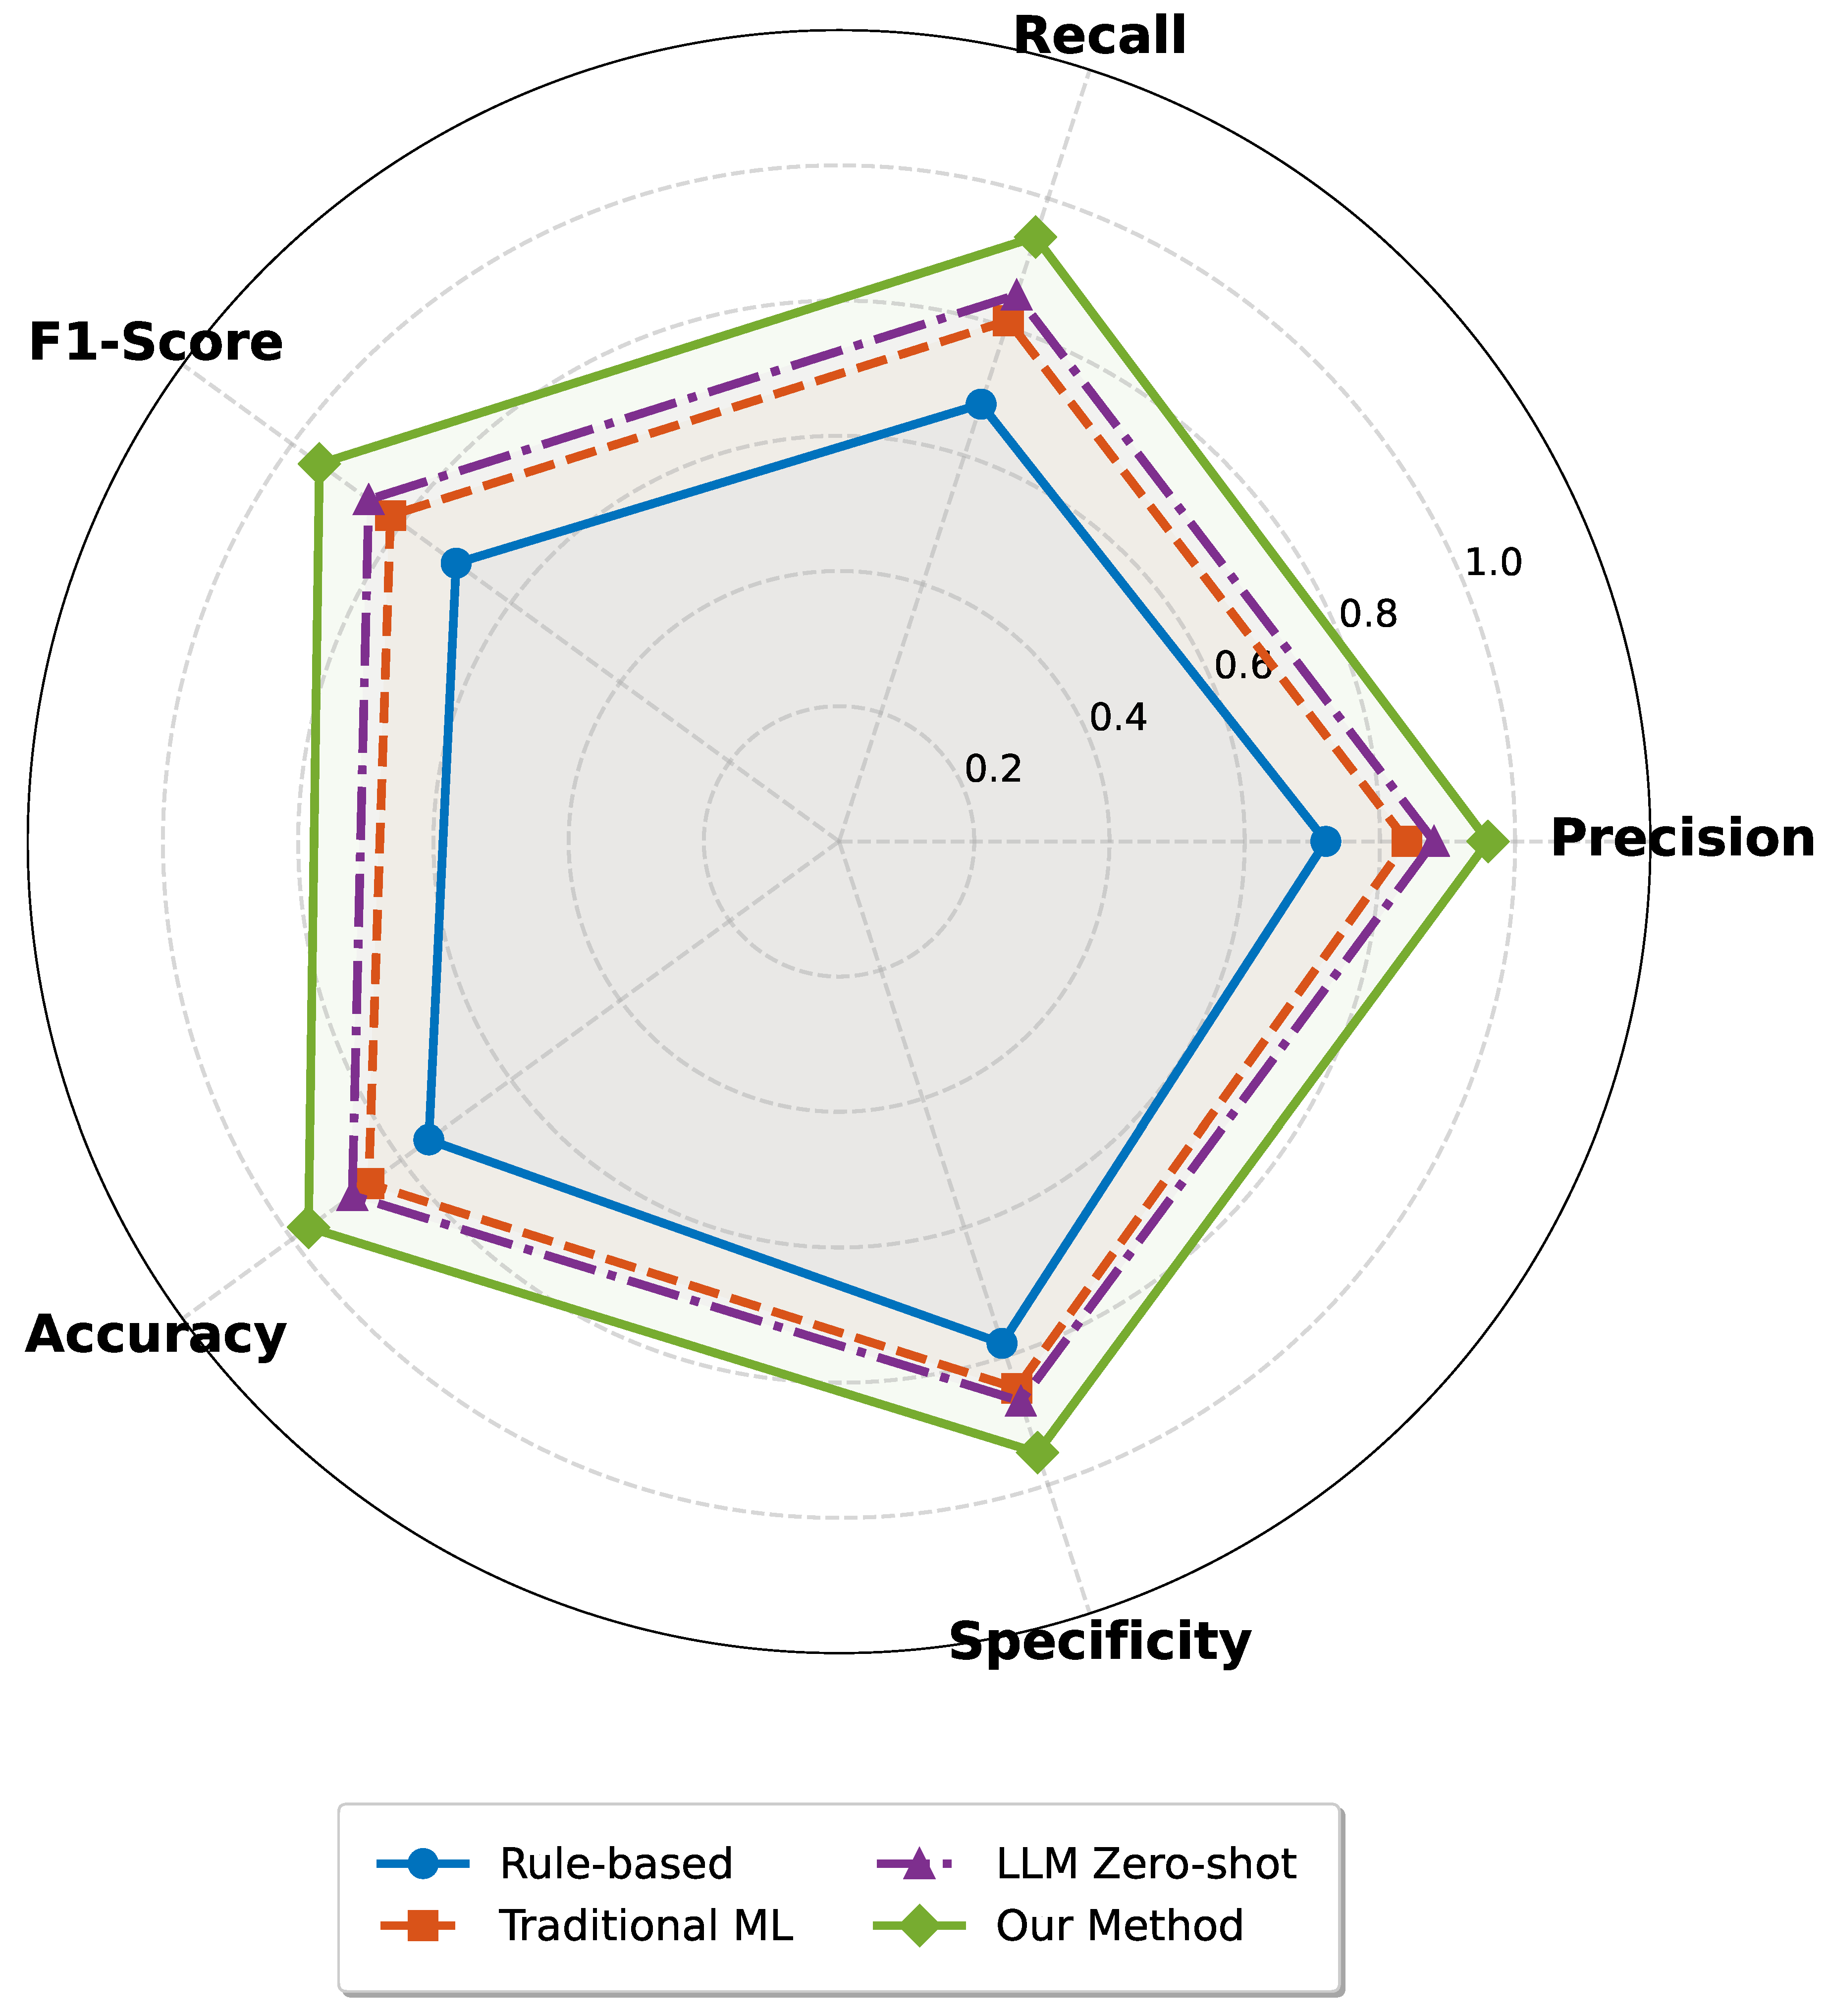
Figure 5.
Ablation study results showing the impact of removing key components. Multi-modal fusion provides the largest performance gain, followed by domain fine-tuning. All components contribute meaningfully to overall performance. Different fill patterns enhance visual distinction and ensure clarity in both color and grayscale reproduction.
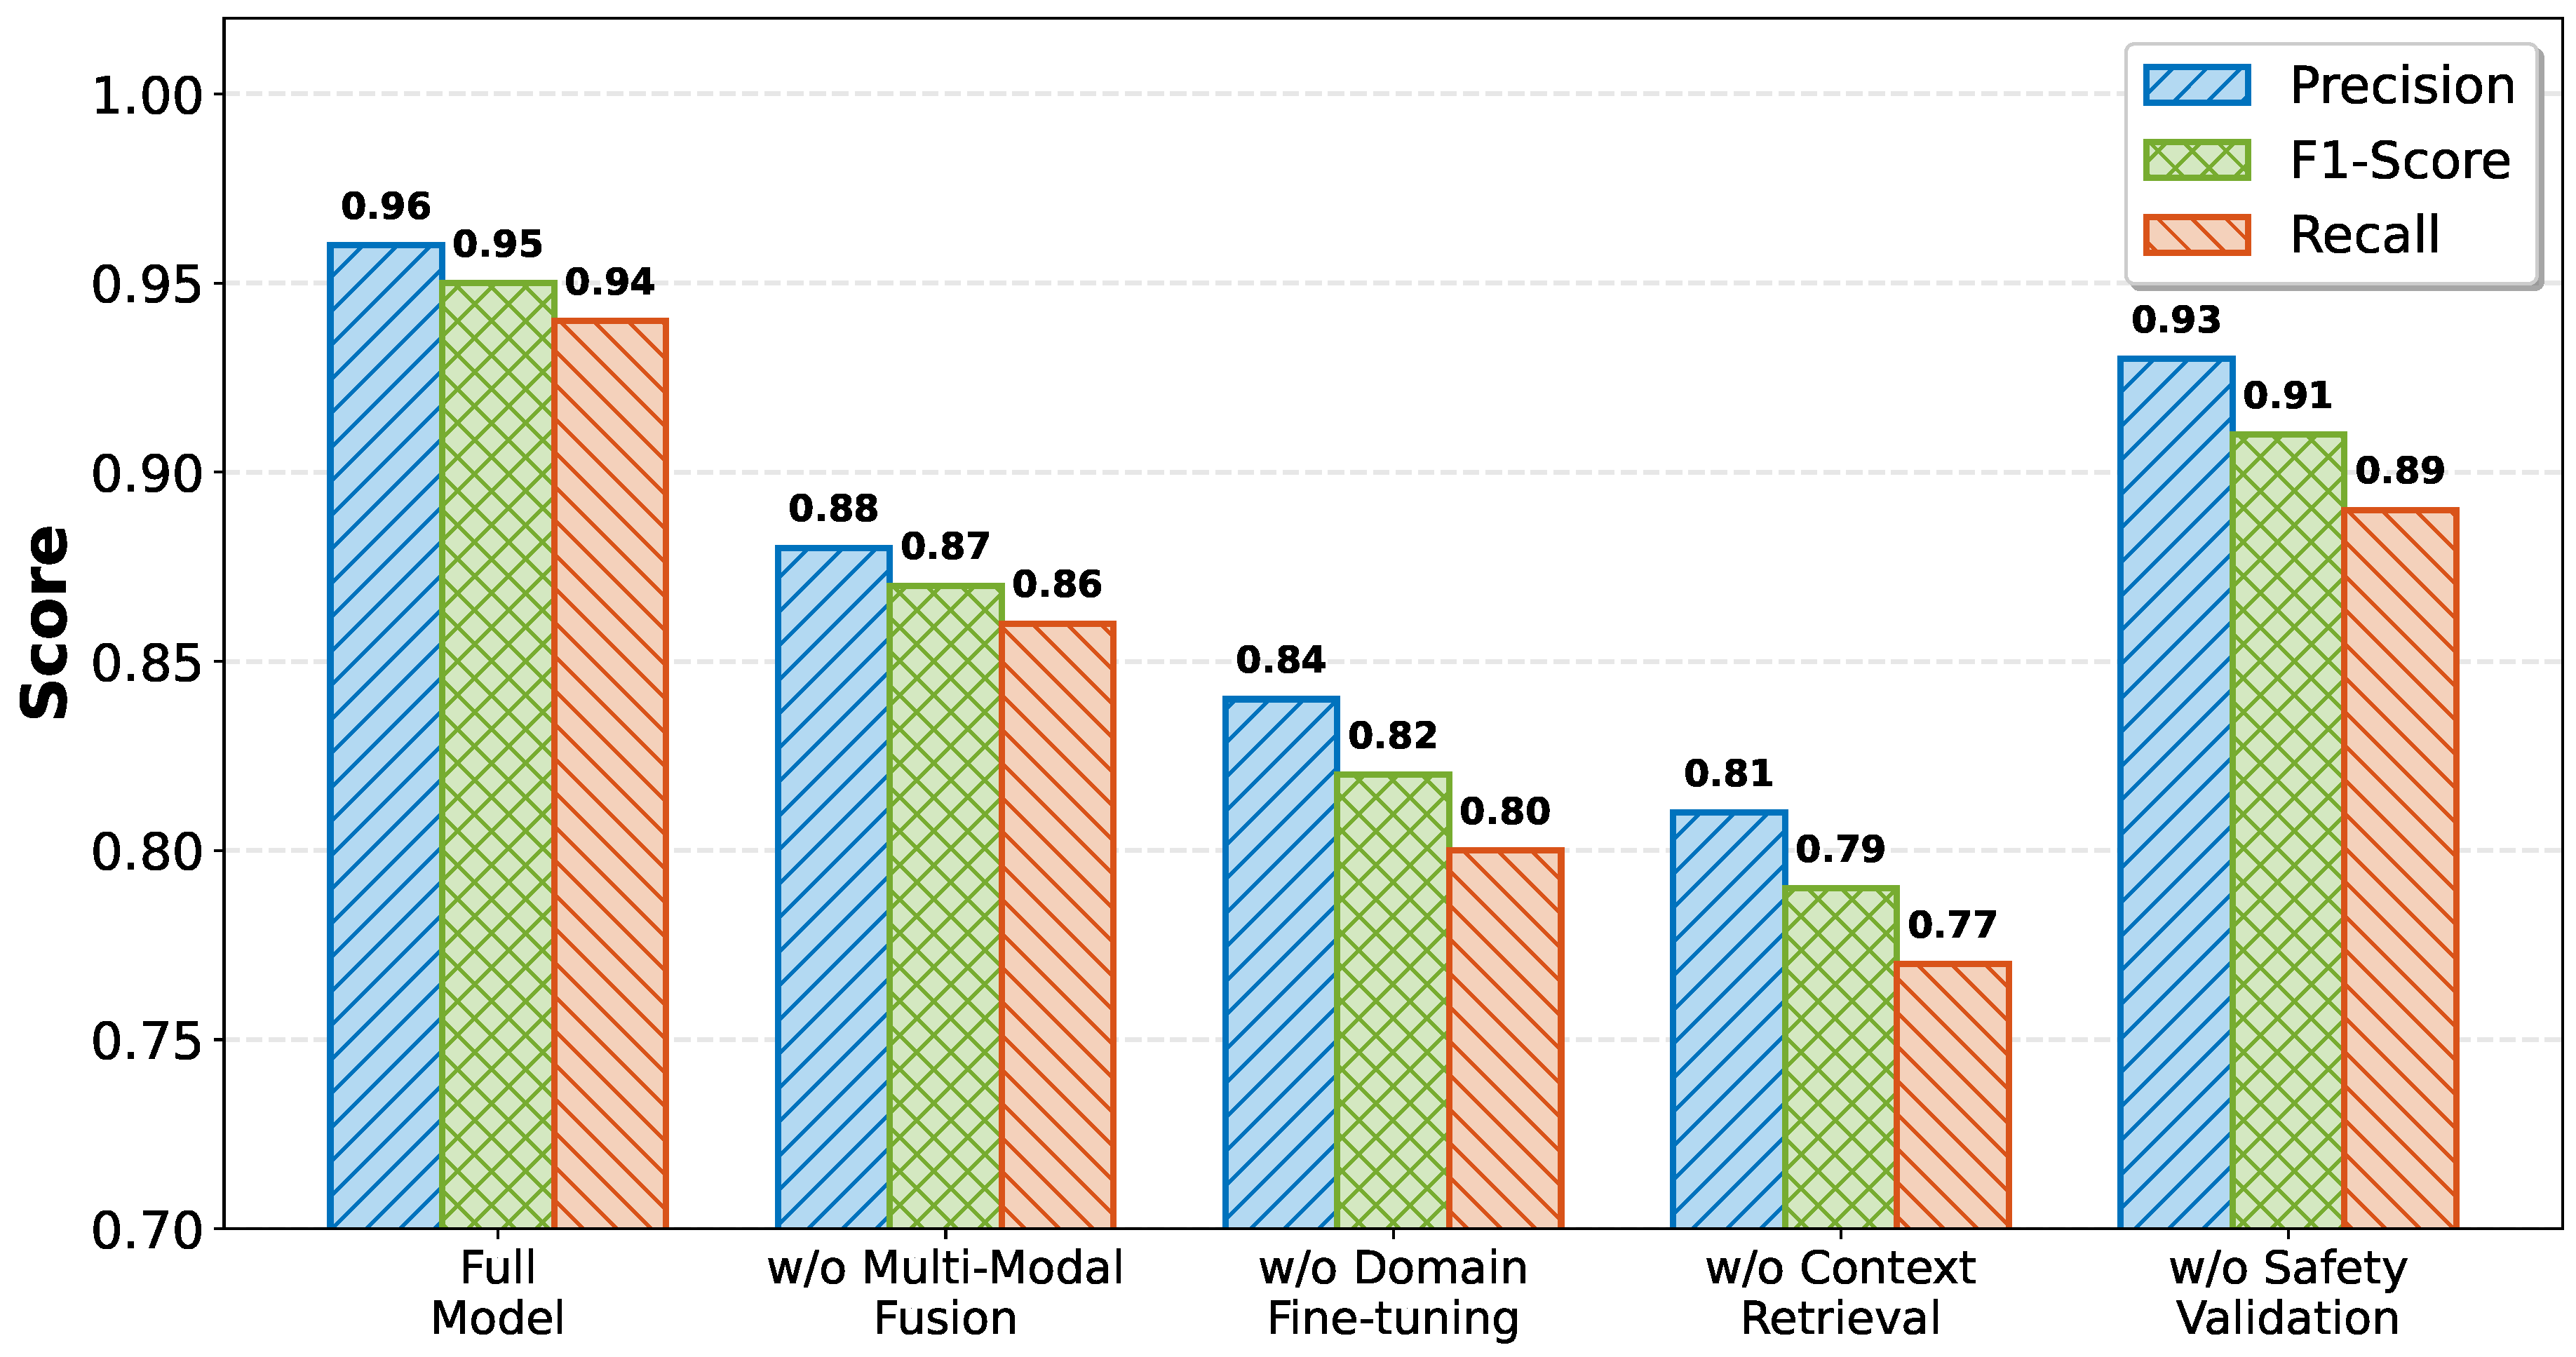
Figure 6.
System overhead analysis comparing CPU and memory usage across methods. Our approach maintains reasonable resource consumption through efficient context management and model optimization, with overhead similar to traditional ML but delivering superior accuracy.
Figure 6.
System overhead analysis comparing CPU and memory usage across methods. Our approach maintains reasonable resource consumption through efficient context management and model optimization, with overhead similar to traditional ML but delivering superior accuracy.
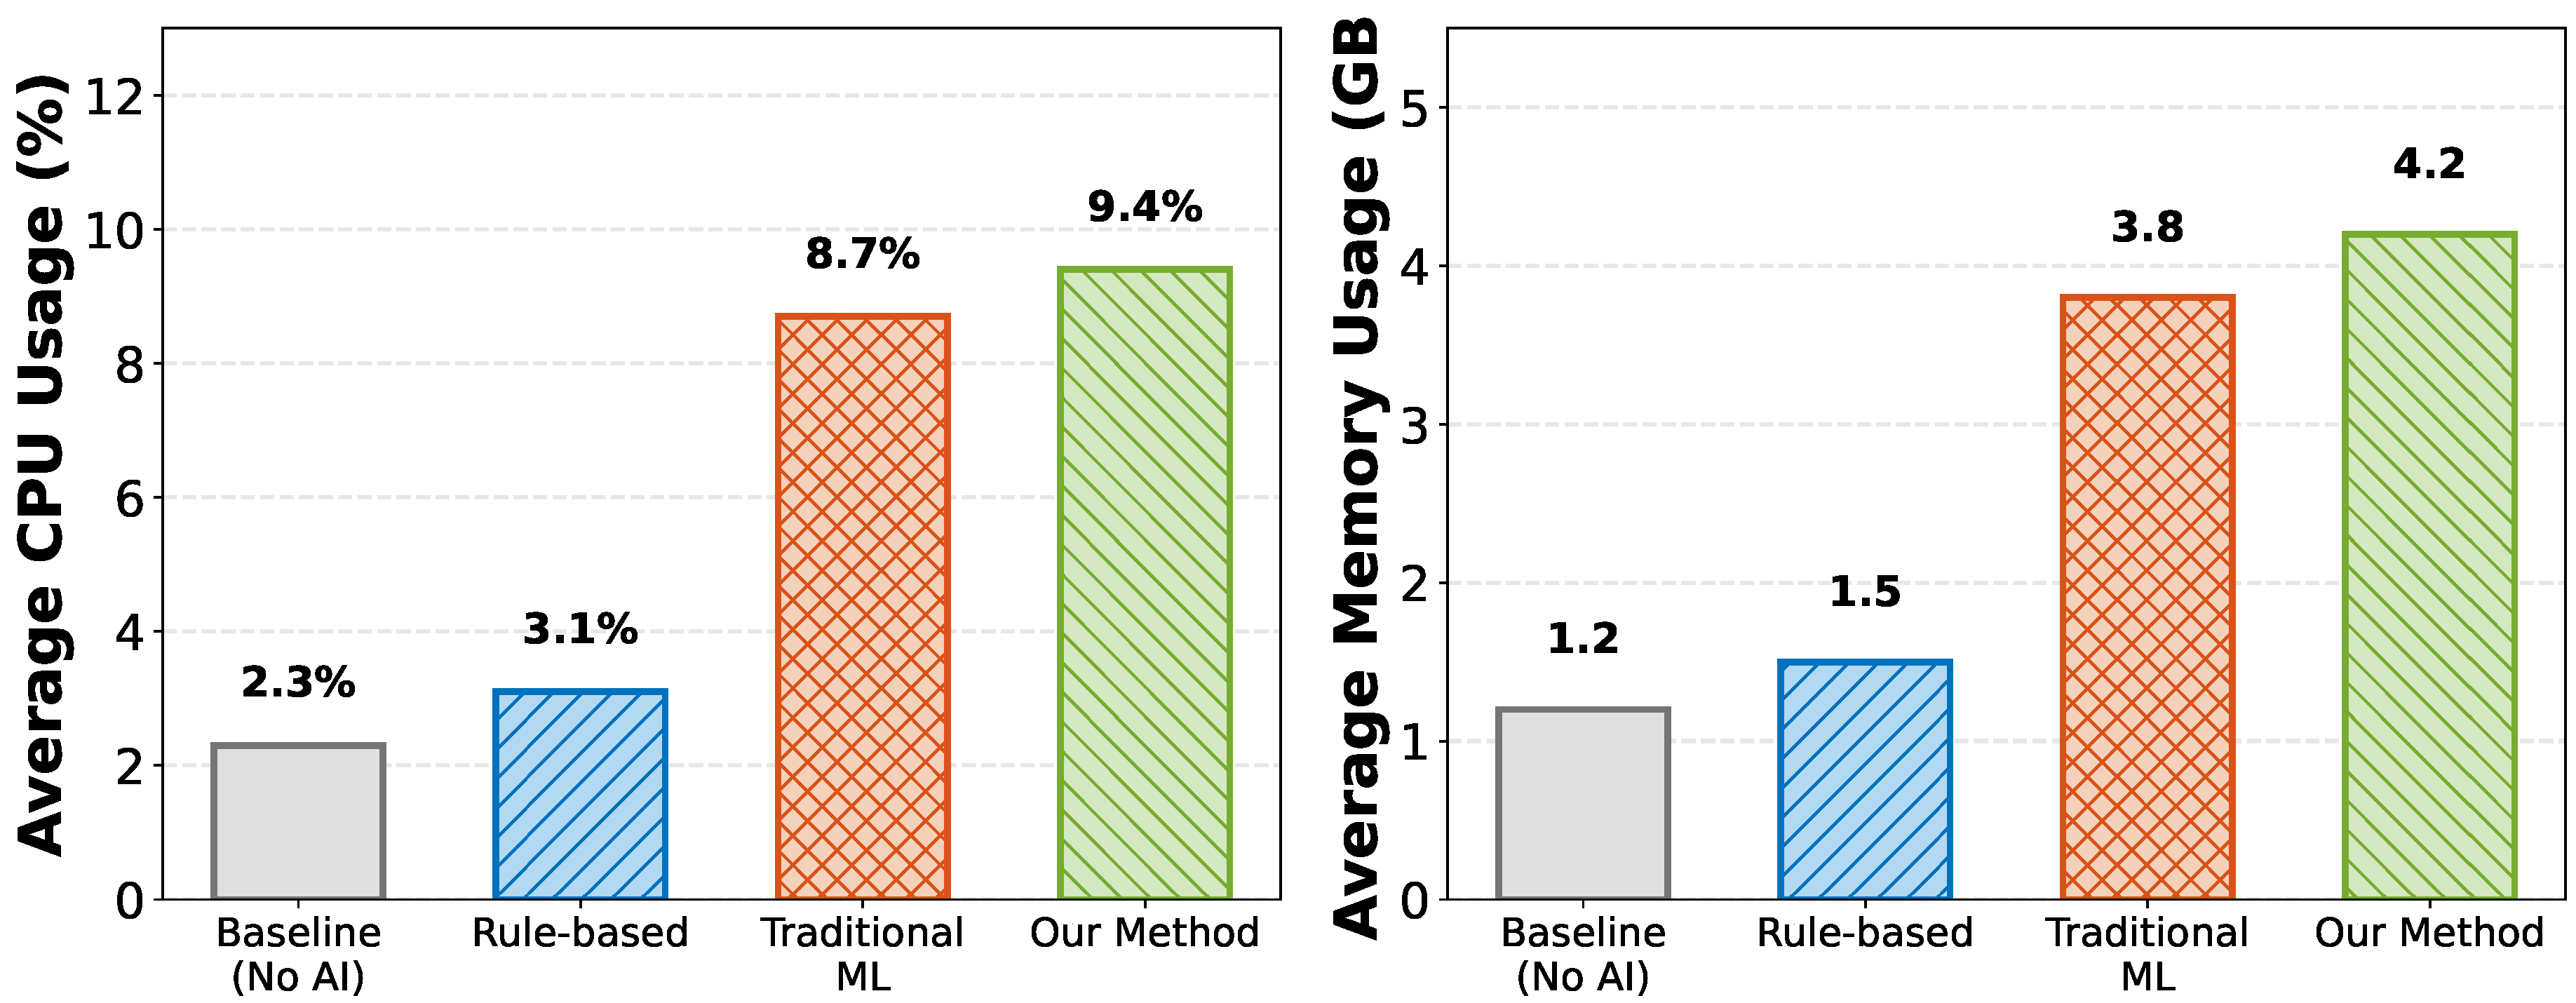
Figure 7.
Temporal performance showing detection latency over a 100-hour period. Our method maintains stable, low latency performance under varying load conditions, staying well within the acceptable range (shaded region) while traditional approaches show high variance and frequent spikes. Different line styles (solid, dashed, dash-dot) and markers ensure distinction in both color and monochrome printing.
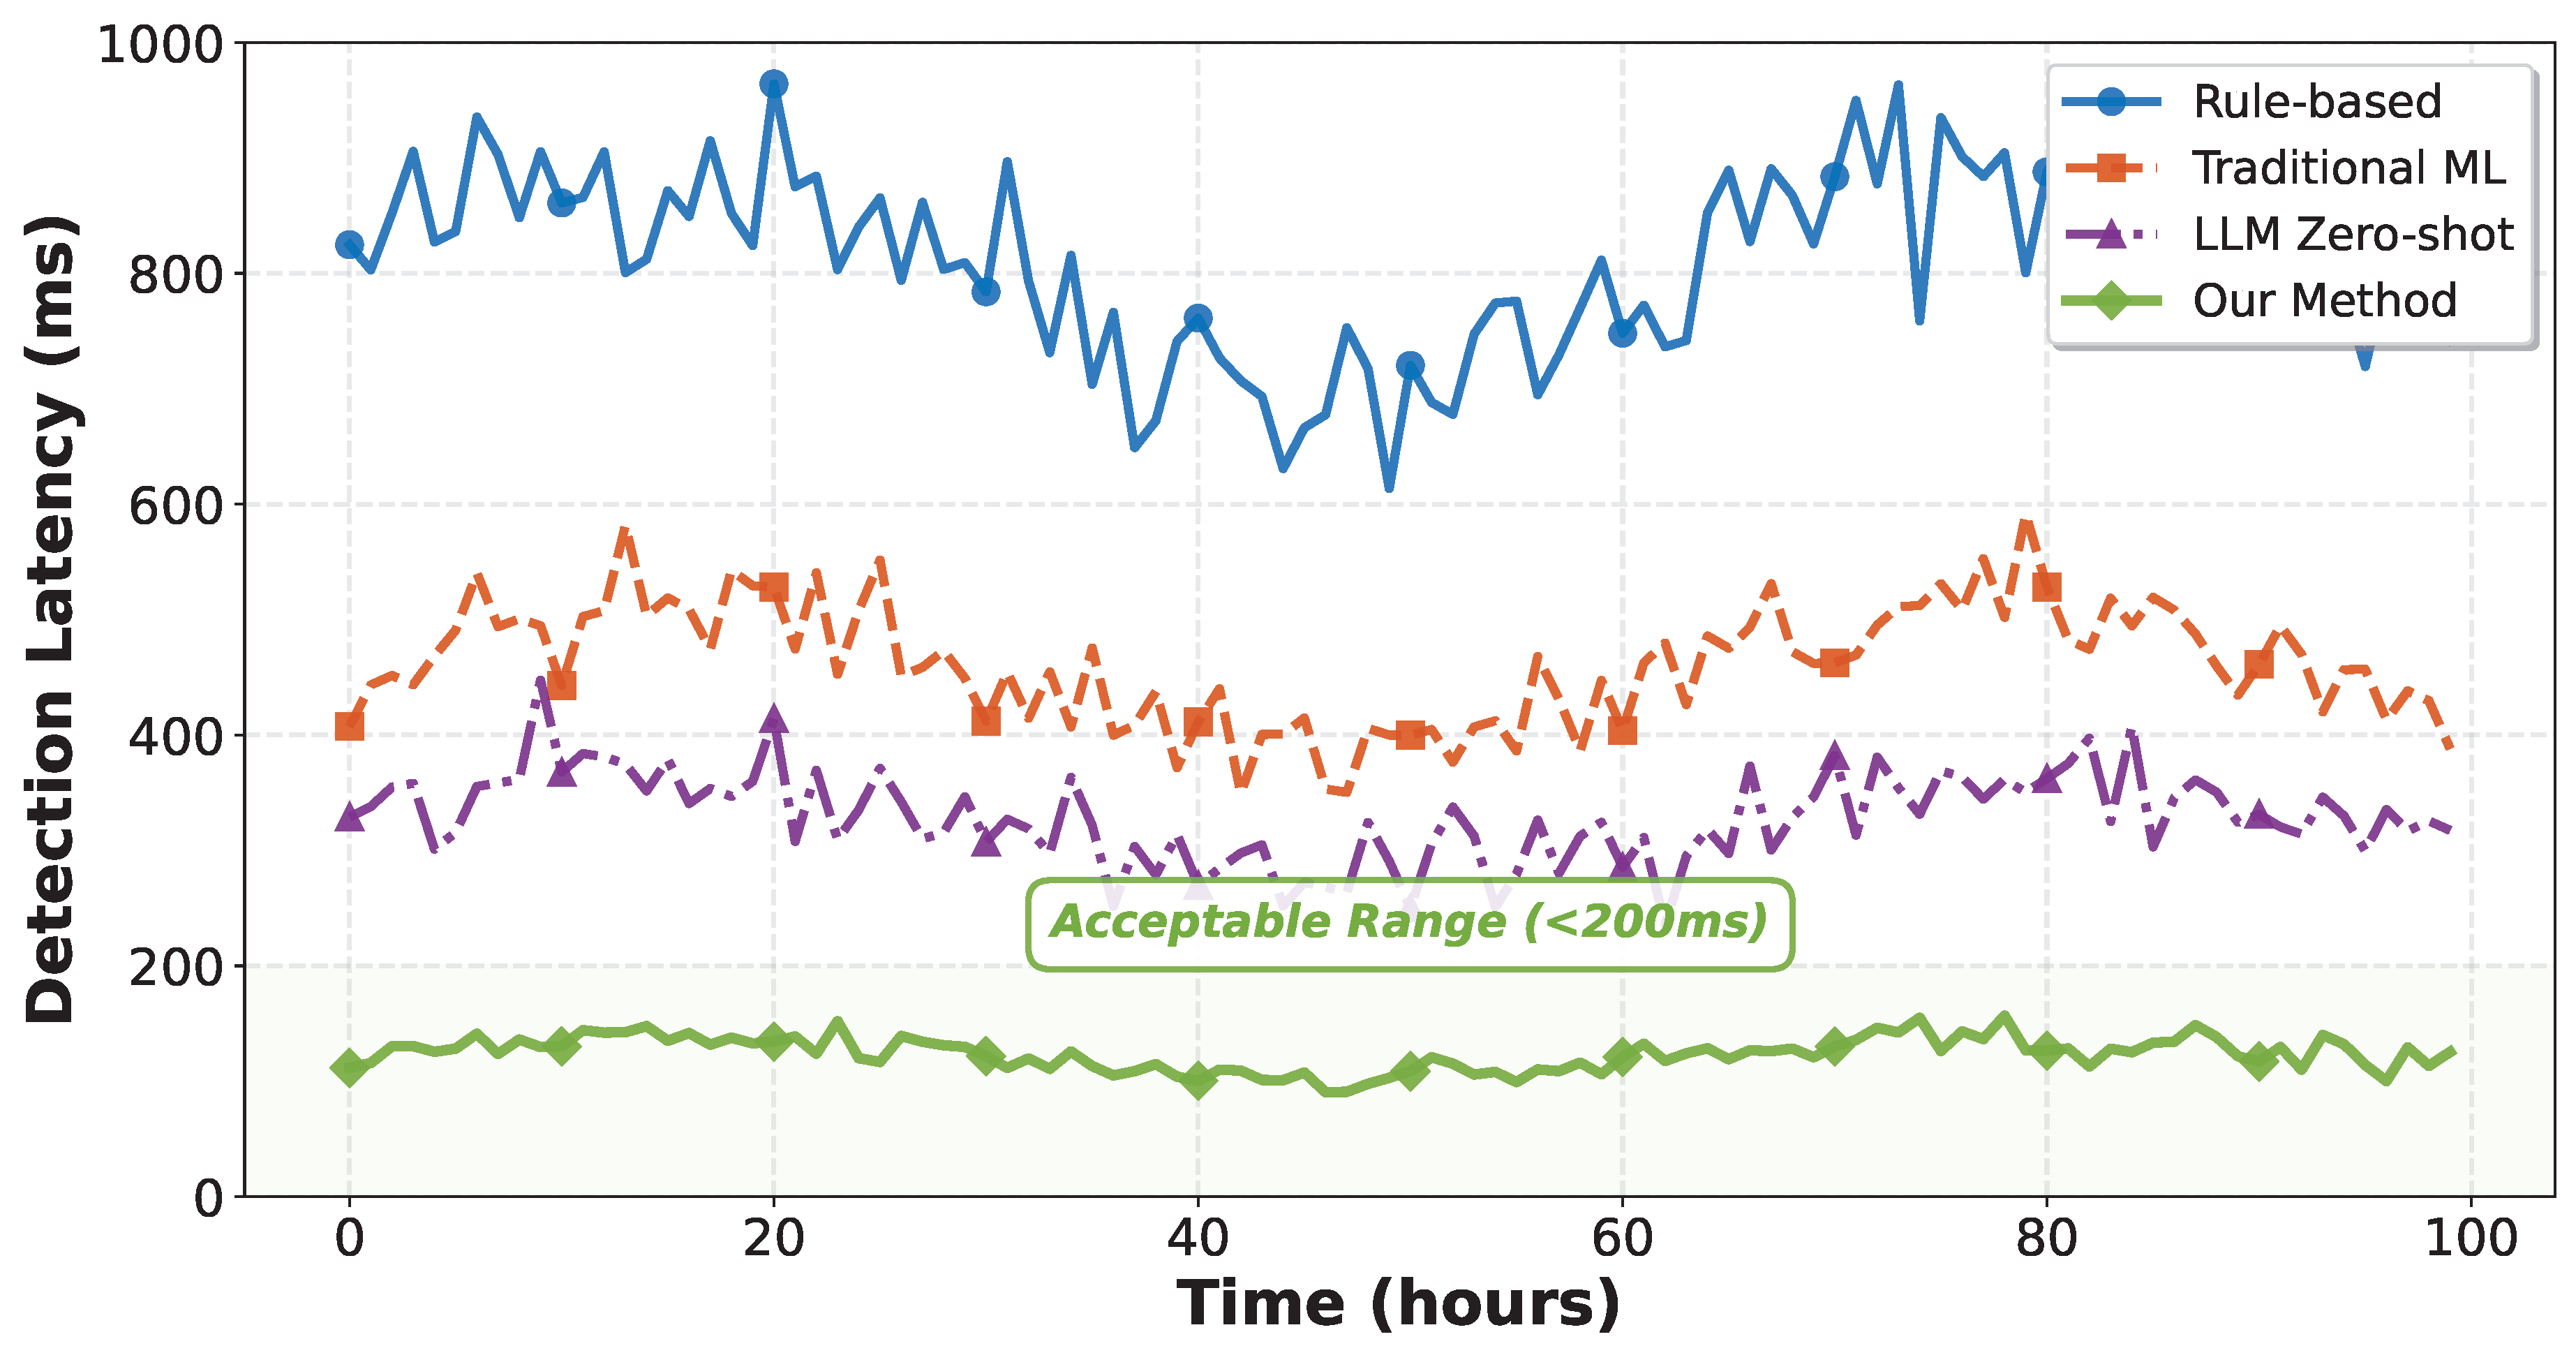

Table 1.
Overall Performance Comparison Across Methods
| Method | Precision | Recall | F1-Score | MTTR (min) |
|---|---|---|---|---|
| Rule-Based | 0.72 | 0.68 | 0.70 | 87.3 |
| Traditional ML | 0.84 | 0.81 | 0.82 | 52.6 |
| LLM Zero-Shot | 0.88 | 0.85 | 0.86 | 38.4 |
| Our Method | 0.96 | 0.94 | 0.95 | 13.8 |
Disclaimer/Publisher’s Note: The statements, opinions and data contained in all publications are solely those of the individual author(s) and contributor(s) and not of MDPI and/or the editor(s). MDPI and/or the editor(s) disclaim responsibility for any injury to people or property resulting from any ideas, methods, instructions or products referred to in the content. |
© 2025 by the authors. Licensee MDPI, Basel, Switzerland. This article is an open access article distributed under the terms and conditions of the Creative Commons Attribution (CC BY) license (http://creativecommons.org/licenses/by/4.0/).
Copyright: This open access article is published under a Creative Commons CC BY 4.0 license, which permit the free download, distribution, and reuse, provided that the author and preprint are cited in any reuse.


