
Submitted:
12 December 2025
Posted:
15 December 2025
You are already at the latest version
Preprints on COVID-19 and SARS-CoV-2
Abstract
The overlapping circulation of influenza (Flu), SARS-CoV-2 (SC2), and respiratory syncytial virus (RSV) continues to challenge clinical laboratories, particularly in settings with limited automation and fragmented healthcare coverage. This study expanded the CDC Flu-SC2 assay by incorporating a laboratory-developed test for RSV A/B detection into a fully automated quadruplex RT-qPCR (LDRA) on the Panther Fusion® Open Access™ system. The design, based on more than 8,000 RSV genomic sequences targeting the conserved M gene, achieved optimal amplification efficiencies (97–105%) and full multiplex compatibility. Analytical assessment established limits of detection between 9.6 and 37.8 copies per reaction, absence of cross-reactivity with 30 respiratory pathogens, and inclusivity for 33 viral variants. Commutability and diagnostic performance among the LDRA, CE-marked Allplex™ SARS-CoV-2/FluA/FluB/RSV, and IVD-marked Panther Fusion® SARS-CoV-2/Flu A/B/RSV Assays were evaluated using 405 nasopharyngeal UTM-conserved swabs. The LDRA demonstrated excellent concordance (overall agreement≥98%, k > 0.95), strong diagnostic accuracy, and reliable detection of mixed infections. This quadruplex provides a fully automated, rapid, and accurate solution for the simultaneous detection of influenza A, influenza B, SARS-CoV-2, and RSV viruses, enhancing molecular diagnostic capacity and supporting equitable, timely clinical decision-making in middle-income healthcare systems, such as that of the Dominican Republic.
Keywords:
RT-qPCR
; multiplex assay
; respiratory viruses
; SARS-CoV-2
; influenza A/B
; respiratory syncytial virus
; Panther Fusion® Open Access™
; laboratory-developed test (LDT)
; performance evaluation
; molecular diagnostics
1. Introduction
The coronavirus disease 2019 pandemic (COVID-19) has dramatically altered the epidemiology of other respiratory viruses. Between 2020 and 2021, these viruses circulated at historically low levels due to public health measures aimed at containing the spread of severe acute respiratory syndrome coronavirus 2 (SARS-CoV-2 or SC2). During this period, the traditionally endemic influenza A (IAV), influenza B (IBV), and respiratory syncytial virus (RSV) were virtually absent [1,2]. However, following the relaxation of public health measures, an unexpected resurgence of influenza and RSV was observed, even outside of its usual season [3]. Such was the impact that, between 2022 and 2023, "tripledemic" events were described in some parts of the world due to concurrent outbreaks of SC2, influenza, and RSV [4]. Today, six years after the first report of SC2 infection, as anticipated by Yun, et al. [5], influenza, SC2, and RSV infections are the most common causes of respiratory illness in humans, particularly among children and adults [6].
Infections caused by influenza, SC2, and RSV represent a major global public health threat due to their high transmissibility, morbidity, and economic burden. According to the World Health Organization (WHO), seasonal influenza causes approximately 1 billion cases annually, including 3 to 5 million severe cases, and between 290,000 and 650,000 deaths worldwide [7]. As for SC2, from the onset of the pandemic in 2020 through November 2024, over 770 million confirmed cases and more than 7 million deaths were reported globally, with an unprecedented health and economic impact [8]. RSV, in turn, is one of the leading causes of acute lower respiratory tract infections in children under five and older adults. In the former group, it causes more than 3.6 million hospitalizations and approximately 100,000 deaths annually, with infants under six months of age being the most affected. [9]. It is estimated that between 100,000 and 180,000 adults aged 65 or older are hospitalized annually in the United States due to RSV, with between 6,000 and 10,000 deaths resulting from associated complications [10]. In economic terms, the U.S. Centers for Disease Control and Prevention (CDC) estimate that influenza generates an annual cost in the United States of between $11.2 billion and $35.4 billion, while the cumulative burden of SC2 in that country exceeded $5.6 trillion through January 2022, including medical expenses, productivity losses, and social costs. Although economic data on RSV are more limited, hospitalizations for this infection in adults are estimated to generate a direct cost of approximately $1.3 billion annually in the United States [6]. These figures underscore the urgent need to strengthen surveillance, diagnosis, and prevention systems, especially in vulnerable populations such as young children, older adults, and people with comorbidities.
The high mutation rate of RNA viruses places healthcare systems under recurring strain due to cyclical infection patterns. The ability of these viruses to cause epidemics, and occasionally pandemics, highlights the threat they pose to human health [11]. While seasonality may vary among viruses, respiratory infections can occur year-round [12]. The current co-circulation of SC2 with influenza and RSV presents an added challenge for healthcare systems due to the overlapping signs and symptoms of respiratory infections. This convergence also highlights the potential for co-infections to increase the risk of complications and hinder treatment strategies [13,14,15]. In this context, rapid, specific, and simultaneous detection of respiratory pathogens has been described as the most effective strategy for positively impacting control efforts and guiding therapeutic and clinical management decisions with patients [16]. Improving the timeliness of diagnosis and detection of co-infections [3,12,13] helps reduce antibiotic use, limits the need for additional laboratory tests [17], optimizes cost-effectiveness, and decreases the risk of complications, hospitalizations, and mortality [3].
Although several diagnostic methods for detecting respiratory viruses are available, nucleic acid amplification tests (NAATs) are considered the gold standard in clinical settings [18], in particular, assays employing reverse transcription and real-time multiplex PCR (RT-qPCR) in a single tube [3,4,6,11,18,19,20,21,22,23]. In 2021, the CDC published a molecular assay developed for the simultaneous detection of IAV, IBV, and SC2 (CDC Flu-SC2) [24], which received authorization for use from the U.S. Food and Drug Administration (FDA). This is a semi-automated RT-qPCR assay that uses commonly available extraction and amplification platforms in molecular biology laboratories. One of its major drawbacks, in addition to requiring manual handling during sample and reagent preparation, is the inability to detect RSV in the same reaction. This study aims to develop an RT-qPCR assay for the detection of RSV A/B (LDT RSV) that is compatible with the CDC Flu-SC2 triplex assay. The study also aims to validate a new, fully automated quadruplex assay (LDRA: laboratory-developed respiratory assay) on the Panther Fusion® Open Access™ system for the simultaneous detection of IAV, IBV, SC2, and RSV in nasopharyngeal swabs from patients with respiratory infections.
2. Materials and Methods
2.1. Clinical Samples, Ethical Aspects, and Eligibility
The methodological approach described in this study was conducted by the Research and Development (R&D) Group of the Molecular Biology department of Referencia Laboratorio Clínico, Santo Domingo Oeste, Dominican Republic. Residual material from 405 nasopharyngeal swabs preserved in Universal Transport Medium (UTM) (Copan, CA, USA) was used. These specimens originated from patients for whom a medical prescription had been issued for the molecular diagnosis of respiratory infection by influenza A (IAV), influenza B (IBV), SARS-CoV-2 (SC2), or respiratory syncytial virus (RSV). Although samples included in the study were randomly selected between October 2023 and September 2025, all were collected in accordance with the clinical laboratory’s confidentiality and informed-consent policies. In this regard, all patients gave their express consent for the possibility of using the remainder of their samples in research and development activities, as well as for the publication of the results, provided that the protection of their privacy and the confidentiality of their data were guaranteed. Therefore, all samples used were de-identified to remove any link between results and patients’ personal information.
The acceptance and rejection criteria were applied by the laboratory during the preanalytical stage according to the standard operating procedures (SOP), to ensure result quality. No eligibility criteria related to patients’ demographic data were imposed. All residual clinical samples included in the evaluation satisfied the laboratory’s acceptance criteria. Samples were stored immediately after the prescribed diagnostic analysis at −70 °C until their use in the experiments described in this report.
2.2. Assay Design and Optimization
2.2.1. Oligo Design
Oligonucleotide design for the RSV A/B amplification and detection assay (LDT RSV) was performed as previously described [25,26]. Briefly, a total of 8,661 complete RSV sequences (RSV types A and B) were retrieved from the NCBI Virus database (https://www.ncbi.nlm.nih.gov/labs/virus/, accessed on September 2025). Sequences were aligned using the MAFFT algorithm within Unipro UGENE v48.0 (Unipro, Novosibirsk, Russia). The alignment was validated (and the sequence set reduced to 8,100), redundancies were removed, and a conserved region of the RSV Matrix (M) gene was selected by calculating sequence entropy (Supplementary Figures S1 and S2, based on Supplementary Files S1–S4). Using the consensus sequence derived from the alignment as reference, three primers and one TaqMan probe were designed employing Oligo v7.60 (Molecular Biology Insights Inc., CO, USA), Benchling™ (Benchling, CA, USA) and OligoAnalyzer™ (Integrated DNA Technologies, IA, USA) in a coordinated workflow (Figure 1). The TaqMan-probe’s 5′ end was labeled with the reporter fluorophore cyanine 5 (Cy5), the 3′ end was phosphorylated and labeled with the Iowa Black® RQ dark quencher (IAbRQSp), and the ninth nucleotide (5′→3′) was labeled with the internal dark quencher TAO™. The LDT RSV oligos were designed to minimize the likelihood of heterodimer formation with the other oligos in the CDC Flu-SC2 assay [24]. Only the CDC SC2 detection probe was modified to reduce the risk of false negatives due to mutations present in currently circulating variants. All oligos used in the new quadruplex LDRA assay, resulting from combining the LDT RSV and CDC Flu-SC2 assays, are shown in Table 1.
All oligonucleotides were synthesized and purified by HPLC by Integrated DNA Technologies (IDT, IA, USA). Optimal purity was defined as ≥85%. All oligonucleotides were shipped lyophilized.
2.2.2. In Silico Specificity Evaluation
The in silico specificity of the primers and detection probe was analyzed as previously described [26]. To this end, homology, inclusivity and exclusivity (cross-reactivity) against related microorganisms and against human background DNA were evaluated. Briefly, homology analysis was performed by open search using the NCBI BLAST tool (https://blast.ncbi.nlm.nih.gov, accessed on September 2025). For 100% coverage, high-homology sequences were defined as those with a percentage of identity ≥95% and an expectation value (E-value) ≤10–2 [27]. Exclusivity, on the other hand, was evaluated by closed homology search against sequences of at least 68 clinically and biologically relevant respiratory microorganisms (Supplementary Table S1). Low homology, and consequently a low probability of cross-reactivity, was defined as an E-value >10–2, regardless of the coverage or percentage of identity values [26]. Cross-reactivity with human DNA (background noise) was evaluated using MFEprimer version 3.1 [28] (https://mfeprimer3.igenetech.com/ or https://m4.igenetech.com/, accessed on September 2025). The following parameters were set: “Background Database”, “UCSC - Homo sapiens - hg38 – Genome”; “Allow mismatch at the 3’ end”, “No” (default); “Tm min”, “48 °C” (minimum Tm required for binding stability between the primer and its binding sites: Ta – 10 °C); “Concentration of divalent cations (usually MgCl2)”, “4.0 mM”; “Annealing oligo concentration”, “800 nM” (optimized primer concentration); “Product size”, from “0” to “1,000” bp. Finally, inclusivity was estimated using a design coverage analysis. The SCREENED v1.0 tool (Sciensano Galaxy External) [29] (https://galaxy.sciensano.be/, accessed on September 2025) was used together with all sequences available in the NCBI Virus (https://www.ncbi.nlm.nih.gov/labs/virus/, accessed on September 2025) and GISAID EpiRSV™ (https://gisaid.org/, accessed on September 2025): 3,705 RSV A and 3,178 RSV B sequences from NCBI Virus, and 11,752 RSV A and 13,910 RSV B sequences from GISAID. Any sequence with missing or ambiguous sequence information was removed from the analysis for that target region.
2.2.3. Synthetic controls: Ultramer™ Duplex
Synthetic Ultramer™ duplex oligonucleotides were used as amplification controls for all optimization assays. These are oligonucleotides of no more than 200 bp that carry, respectively, the target sequences of the IAV, IBV, SC2, RSV A, and RSV B viruses targeted by the LDRA test (Supplementary Table S2). Controls were synthesized, purified by standard desalting and shipped lyophilized (4 nmol) by Integrated DNA Technologies (IDT, CA, USA).
2.2.4. Ultramer™ Duplex Control Preparation: Stock Solution
Synthetic Ultramer™ duplex controls were reconstituted and stock solutions prepared as previously described [26]. Briefly, each 4 nmol synthetic control was reconstituted in 1 mL IDTE buffer (10 mM Tris, 0.1 mM EDTA), pH 8.0 (IDT, IA, USA). By serial 1:10 dilutions in the same buffer, 13 additional concentration levels were prepared for each synthetic control. Thus, the stock dilution panels consisted of 14 levels with concentrations ranging from 2.41 × 10¹⁵ to 2.41 × 10² copies/mL.
2.2.5. Assay Optimization
Optimization of physicochemical conditions for each monoplex assay composing the quadruplex LDRA was carried out as previously described [25,26]. Salt concentrations (KCl and MgCl2) were optimized first, followed by oligo (primers and probe) concentrations. Finally, the concentration of PCR-grade betaine, 5 M (Sigma-Aldrich, MO, USA) and the annealing temperature (Ta) of the amplification protocol were optimized in a single temperature gradient assay: a 10 °C range, from 54–64 °C (54 °C, 54.7 °C, 56 °C, 57.9 °C, 60.4 °C, 62.3 °C, 63.5 °C and 64 °C). The rest of the amplification protocol variables (reverse transcription and denaturation temperature and time, annealing time, and number of amplification cycles) were kept at the default settings of the Panther Fusion® Open Access™ RNA amplification standard protocol (Hologic, CA, USA) so that the critical amplification time (55 min) was not exceeded.
All primer and probe reconstitution solutions (PPR) for optimization experiments were prepared in an 8 mM Tris-HCl buffer. All optimization experiments were performed using the off-label protocol of the Panther Fusion® Open Access™ RNA/DNA Enzyme Cartridge (Hologic, CA, USA) on a CFX96-IVD thermal cycler (Bio-Rad, CA, USA). To this end, the synthetic Ultramer™ duplex controls at a nominal concentration of 2,41 × 10⁵ copies/mL (Ct ≈ 30) were used. The thermocycler protocol of the optimized quadruplex LDRA assay was as follows: 1 cycle of 46 °C for 8 min, 1 cycle of 95 °C for 2 min, 45 cycles of 95 °C for 5 s, and 58 °C for 21 s with fluorescence reading. The MyAccess™ Software, version v2.1.2.1 (Hologic, CA, USA), was used to develop the LDT protocol on the Panther Fusion system. The protocol for the Panther Fusion® Open Access™ system is available in the Supplementary File S5. Table 2 summarizes the optimized physicochemical conditions of the quadruplex LDRA assay.
2.2.6. Amplification Efficiency and Multiplex Compatibility
Amplification efficiency (E) and post-optimization multiplex compatibility were evaluated as previously described [26]. As evaluation panels, the stock solutions of the synthetic Ultramer™ duplex controls for each pathogen were used, ranging from 2,41 × 10⁹ copies/mL to 2,41 × 10² copies/mL (8 levels). Each level of the evaluation panels was amplified at least in triplicate with each of the monoplex assays that comprise the quadruplex LDRA assay. In a graph of cycle threshold (Ct) values versus the logarithm of relative fluorescence units (Log(RFU)), the fluorescence threshold was set at approximately the midpoint of the linear phase of the amplification curves. A graph of the (Ct) values vs. the logarithm of the nominal initial concentration of each level of the dilution panel (Log(Ci)) was constructed. The scatter plot was fitted to a curve with the general equation y = m x + n, where y represents Ct values, x represents Log(Ci) values, m is the slope and n the y-intercept. The slope, its 95% confidence interval (95% CI), and goodness of linear fit (R2) were calculated. From the slope, the E and its 95% CI were estimated using the following equation:
E was considered acceptable for values between 90% and 110% with R2 ≥ 0.98.
Similarly, for multiplex compatibility evaluation, Ct values and E for each individual assay were calculated in two scenarios: in the absence (monoplex) and in the presence (multiplex) of template DNA and oligos from the other assays comprising the quadruplex LDRA. Multiplex compatibility was assumed when, across all levels of the corresponding evaluation panel and for each monoplex–multiplex pair, i) the |ΔCt| ≤ 0.5, ii) the E acceptability criterion described above was satisfied, and iii) no indications of significantly compromised sensitivity in the multiplex reaction (e.g., failure or inefficient amplification) were observed. For these purposes, the off-label protocol of the Panther Fusion® Open Access™ RNA/DNA Enzyme Cartridge was used on the CFX96-IVD analyzer.
Finally, the amplification efficiency per molecular target was verified under the definitive conditions of the quadruplex LDRA assay on the Panther Fusion® Open Access™ system.
2.2.7. Panther Fusion® Open Access™ RNA/DNA Enzyme Cartridge: Off-Label Protocol
Briefly, the wells containing the aliquots of the Panther Fusion® Open Access™ RNA/DNA Enzyme Cartridge were perforated using a nuclease-free punching tool. The lyophilized enzyme was reconstituted with 20 μL of PPR. It was incubated at room temperature (18–25 °C) for 1–5 min and homogenized by vortexing using short, repeated pulses to prevent foaming. Amplification and detection were carried out in the CFX96-IVD analyzer, using 96-well PCR plates, in a reaction volume of 25 μL: 20 µL of master mix (MMX) + 5 µL of DNA template.
2.3. Analytical Performance
2.3.1. Analytical Sensitivity (Limit of Detection)
The limit of detection (LoD) of the LDRA assay was estimated using dilution panels prepared from the five synthetic Ultramer™ duplex controls. Starting from the respective stock solutions at a concentration of 2.41 × 10⁷ copies/mL, working solutions of the five Ultramer™ duplex synthetic controls were prepared at a nominal concentration of 6.4 × 10³ copies/mL. The diluent consisted of UTM from negative nasopharyngeal swabs in the Panther Fusion® Specimen Lysis Tube (SLM) medium (Hologic Inc., CA, USA) at the manufacturer-recommended proportion: 0.5 mL UTM per 0.71 mL SLM [30] (UTM/SLM).
LoD evaluation panels were prepared by seven additional 1:2 serial dilutions in UTM/SLM from the working solutions of each synthetic control. Thus, each LoD panel was composed of eight 1:2 serial dilutions with concentrations ranging from 6.4 × 10³ copies/mL (2.3 × 10² copies/reaction) down to 5.0 × 101 copies/mL (1.8 × 100 copies/reaction). This corresponds, in the primary sample (UTM, before mixing with SLM) to concentrations ranging from 1.5 × 10⁴ copies/mL to 11.2 × 10² copies/mL.
Conversion from copies/mL in the UTM/SLM mixture to copies/reaction was performed using the following equation:
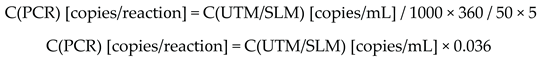
where, C(PCR) [copies/reaction] is the number of copies of the target sequence in the PCR reaction; C(UTM/SLM) [copies/mL] is the concentration of the target sequence, in copies/mL, in the UTM/SLM mixture; 1000 is the conversion factor from mL to µL; 360 is the sample volume in µL aspirated by the Panther Fusion® system; 50, the elution volume in µL; 5, the volume of eluate in µL used by the system for the RT-qPCR amplification reaction. The calculation assumes 100% recovery during the nucleic acid extraction and isolation process.
The calculation of the equivalent concentration of the target sequence in the primary sample (UTM), based on the concentration in the UTM/SLM mixture, was performed using the fundamental equation of volumetry:
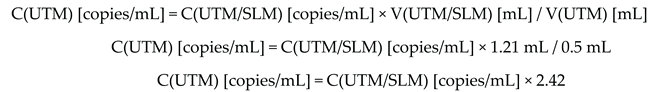
Where, C(UTM) [copies/mL] is the concentration, in copies/mL, of the target sequence in the primary sample; C(UTM/SLM) [copies/mL] is the concentration of the target sequence, in copies/mL, in the UTM/SLM mixture; V(UTM/SLM) [mL] is the volume, in mL, of the UTM/SLM mixture (1.21 mL); V(UTM) [mL] is the volume, in mL, of the primary sample (0.5 mL).
Using a single lot of specific (PPR) and generic reagents, a single instrument, and one operator, 20 replicates of each member of the evaluation panels were analyzed. The frequencies of positive results per level were recorded. The LoD was defined as the concentration corresponding to a 95% (C95) probability of occurrence or positive results. The cutoff was set at the maximum possible threshold cycle of the employed amplification and detection protocol (Ct = 45).
2.3.2. Analytical Specificity: Cross-Reactivity (In Vitro Exclusivity) and In Vitro Inclusivity
Analytical specificity was evaluated with pathogen panels composed of selected samples obtained from commercial quality-control panels and external quality assessment (EQA) schemes. Commercial controls/panels included NATtrol Respiratory Verification Panel 2.1 (Zeptometrix, NY, USA), Respiratory Multiplex (1 to 5) Q Control (Qnostics, Scotland, UK), Amplirun® SARS-CoV-2 RNA Controls1 (Vircell, Granada, Spain), Amplirun® Total SARS-CoV-2/FluA/FluB/RSV Control (Swab) (Vircell, Granada, Spain), and AccuPlex™ H5N1 Influenza Reference Material Kit (LGC Clinical Diagnostics Inc., MA, USA). EQA programs used were ID3 and IDR (2023 and 2024) from the College of American Pathologists (CAP), and INFTP24 (2024) from Quality Control for Molecular Diagnostics (QCMD). Each member of the analytical-specificity evaluation panels was tested in triplicate with the LDRA assay.
For cross-reactivity assessment, 30 respiratory pathogens (bacterial and viral) were analyzed at clinically relevant concentrations as specified by the manufacturers. The pathogens included in the panel were: Adenovirus A, Adenovirus 1, Adenovirus 3, Adenovirus 14, Adenovirus 31, Bordetella parapertussis, Bordetella pertussis, Chlamydia pneumoniae, Coronavirus 229E, Coronavirus HKU-1, Coronavirus NL63, Coronavirus OC43, Enterovirus A16, Enterovirus 68, Enterovirus A71, Influenza A, Influenza B, Mycoplasma pneumoniae, Metapneumovirus 8, Metapneumovirus A2, Metapneumovirus B2, Parainfluenza 1, Parainfluenza 2, Parainfluenza 3, Parainfluenza 4, Rhinovirus 1A, Rhinovirus 16, RSV A, SARS-CoV-2, and Legionella pneumophila.
For in vitro inclusivity evaluation, 32 distinct variants/strains (no duplicates) of IAV, IBV, SC2 and RSV were tested: i) 17 IAV variants/strains, including seasonal H1N1 (H1N1sea), 2009 pandemic-derived H1N1 (H1N1pdm09), H3N2, H5N1 and H7N7 subtypes; ii) four IBV variants/strains spanning Victoria and Yamagata lineages; iii) seven SC2 variants/strains including Alpha, Beta, Gamma, Delta and Omicron lineages; and iv) four variants/strains for each RSV subtype A and B.
2.3.3. Precision
Within-laboratory precision of the quadruplex LDRA assay was evaluated using a five-member panel in a UTM/SLM matrix. The precision panel comprised one negative member (matrix) and four doubly positive members. In the positive members, the pathogens IAV were combined with SC2, and IBV were combined with RSV at two concentrations: low (30 < Ct ≤ 35) and moderate (25 < Ct ≤ 30). Only low–moderate and moderate–low concentration pairings were analyzed for each pathogen combination. Pathogens used to prepare the panel were IAV, A/NY/02/09 (H1N1pdm09); IBV, B/Florida/02/06 (Victoria); SC2, USA-WA1/2020 and RSV, type A, all from the NATtrol Respiratory Verification Panel 2.1 commercial panel.
All panel members were tested in duplicate by one operator in one daily run on two Panther Fusion® systems using two lots of specific reagents (PPR) over 14 consecutive days. Panel samples were stored at 2 °C to 8 °C for the duration of the evaluation. A new vial of PPR from each lot was thawed daily.
Percent agreement between observed and expected results was calculated for each pathogen and panel member. Within-laboratory imprecision, and its components (within-lot, between-lot, between-instrument, within-run/day [repeatability], and between-day precision), were expressed as standard deviation (SD) and coefficient of variation (CV).
2.3.4. Method Comparison: Agreement Assessment
Agreement between results from 405 clinical samples tested with the quadruplex LDRA assay and the commercial comparator assays —Panther Fusion® SARS-CoV-2/Flu A/B/RSV Assay (Hologic Inc., CA, USA; PFRA, Panther Fusion respiratory assay) and Allplex™ SARS-CoV-2/FluA/FluB/RSV Assay (Seegene Inc., Seoul, South Korea; APRA, Allplex respiratory assay)— was estimated. Discordant samples were retested with all RT-qPCR assays involved in the evaluation. Samples that remained consistently discordant were resolved by consensus (see Diagnostic Performance section). Samples with an “invalid” result were excluded from the analysis.
Allplex™ SARS-CoV-2/FluA/FluB/RSV Assay (APRA)
All clinical samples were tested with APRA, a multiplex RT-qPCR assay designed for simultaneous detection of SC2, IAV, IBV and RSV A/B. Viral RNA extraction was performed using the MagNA Pure 96 DNA and Viral NA Large Volume kit (Roche Molecular Systems Inc., NJ, USA) on the automated MagNA Pure 96 platform, following the manufacturer’s instructions [31]. For this, the nucleic acid extraction and isolation protocol “Viral NA Universal LV 4.0” was used, with a sample input of 500 µL and 50 µL elution volume. Amplification and detection were performed on the CFX96-IVD analyzer [32], using the enzyme mixes and oligonucleotides provided in the comparator test kit, in a 20 µL amplification volume. The assay includes endogenous (Endo IC) and exogenous (Exo IC) internal controls to validate sample quality and the entire analytical process. The assay has been validated for the detection of target sequences from the N, RdRp, and S genes of SC2, the M gene of IAV, the NS2 gene of IBV, and the M gene of RSV. Results were interpreted automatically with Seegene Viewer v3.33 (Seegene Inc., Seoul, Korea), analyzing Ct values in channels FAM (SC2 [S gene] and RSV), HEX (SC2 [RdRp gene] and IBV), Cal Red 610 (SC2 [N gene] and IAV), and Quasar 670 (Endo and Exo IC). The total time from extraction to obtaining results was approximately 4 hours.
LDRA and Panther Fusion® SARS-CoV-2/Flu A/B/RSV Assay (PFRA)
All clinical samples, as well as those used in the analytical specificity evaluation, were stabilized in SLM according to the manufacturer’s instructions [30]. Stabilized samples were stored at 2–8 °C for no more than 10 days. Stabilized samples were tested with both the evaluative LDRA and the comparator PFRA according to the manufacturer’s specifications [33]. Briefly, after loading the specific and generic components of both assays, samples and corresponding controls were loaded and the test was assigned via the instrument user interface. The Panther Fusion® system automates sample and reagent preparation. By default, the RNA extraction protocol aspirates 360 µL of stabilized sample and yields nucleic acids in 50 µL elution volume. RT-qPCR amplification and detection for both assays occur in the Fusion® module with a 25 µL reaction volume (20 µL MMX + 5 µL eluate). Both assays used Panther Fusion® Extraction Reagent-S and Panther Fusion® Internal Control-S (IC-S; Hologic Inc., CA, USA), although the IC-S was only detected in the comparator PFRA.
The PFRA amplification/detection reagent contains all specific (primers and fluorescent detection probes) and generic (reverse transcriptase, DNA polymerase, salts, etc.) components for selective amplification of target sequences in the M genes of IAV, IBV and RSV and the Orf1ab gene of SC2. The kit is supplied with lyophilized amplification components ready for use in sealed cartridges of up to 12 tests, in boxes of up to 96. The LDRA amplification/detection reagent consists of two components: i) specific: the PPR solution (user-prepared) that is a mixture of primers, fluorescent probes, salts and additives for selective amplification of the target sequences in IAV and RSV M genes, IBV NS2 gene and SC2 N gene; and ii) generic: the Panther Fusion® Open Access™ RNA/DNA enzyme cartridge (Hologic Inc., CA, USA) containing reverse transcriptase and DNA polymerase.
The Panther Fusion® system automatically interprets results by analyzing accumulated fluorescence in channels FAM (IAV in both assays), HEX (IBV and RSV in LDRA and PFRA, respectively), ROX (SC2 in both assays), Quasar 670 (RSV and IBV in LDRA and PFRA, respectively) and Quasar 705 (IC, which in LDRA is human RNase P). Although the PFRA comparator’s interpretation algorithm is not disclosed to the user, the LDRA was configured as follows: i) “positive” if the sigmoid fluorescence curve crosses the predefined fluorescence threshold: 200 RFU for IAV and IBV, 100 RFU for SC2, 50 RFU for RSV and 100 RFU for the RNase P (IC); ii) “negative” if the fluorescence curve does not cross the predefined threshold provided the IC is “positive”; and iii) “invalid” when all channels, including the IC channel, are negative.
Turnaround time from extraction to results on the Panther Fusion® system was approximately 2.5 hours for both assays.
2.4. Diagnostic Performance
Diagnostic sensitivity (dSens) and specificity (dSpec), as well as positive predictive value (PPV) and negative predictive value (NPV) for LDRA, PFRA and APRA were calculated by comparison with expected results using 2 × 2 contingency tables. The expected result was defined as the consensus of results obtained by the three RT-qPCR assays involved in the evaluation for the same molecular target. Consensus was defined according to the following rules: A) “positive” if at least two of the three assays are positive; B) “negative” if at least two of the three assays are negative.
2.5. Mixed Infection Detection Capability
The degree of agreement between the LDRA evaluative assay and commercial comparators PFRA and APRA was estimated using only positive samples for any of IAV, IBV, SC2, or RSV (335 samples). As a reference, a consensus was employed defined by the following rules: A) “mixed infection” (Mix) if at least two of three assays detect the same two or more pathogens in the same sample; B) “single infection” (Sin) if at least two of three assays detect the same single pathogen only.
2.6. Statistical Analysis
The 95% confidence intervals (95% CI) for slopes (Ct vs Log(Ci) plots) and for amplification efficiencies by molecular target for the LDRA assay were estimated using the standard error of the slope from a regression analysis performed in Microsoft® Excel (Microsoft Corp., WA, USA).
LoD per pathogen/target and their 95% CI were calculated by Probit regression from the recorded hit frequencies per dilution level.
Grubbs’ test was used to identify outlier Ct values in the precision evaluation. After excluding outliers, a three-way ANOVA was performed to estimate components of within-laboratory precision: within-lot, between-lot, between-instrument, between-run/day, and within-run/day precision, expressed as standard deviation (SD) and coefficient of variation (CV).
The detection agreement per target and the detection capability of mixed infections (co-infections) among the LDRA, PFRA, and APRA assays were estimated. To this end, the positive/mixed infection percent agreement (PPA/MixPA), negative/single infection percent agreement (NPA/SinPA), overall percent agreement (OPA), and Cohen's kappa statistic (k-index) were determined by means of 2 x 2 contingency tables. An OPA ≥ 95% and k > 0.8 were considered indicative of excellent agreement [34,35].
The Wilson score method for binomial proportions was used to compute 95% CI for percent agreements (PPA/MixPA, NPA/SinPA, OPA), positivity rates (PR), and diagnostic performance parameters (dSens, dSpec, PPV, NPV). The 95% CI for k-index and for SD were calculated using the Wald method for binomial proportions and Exact/MLS methods, respectively [36].
The McNemar-Mosteller nonparametric test was used to assess statistical significance of differences in PR, dSens, and dSpec between the comparative and comparator RT-qPCR assays (LDRA, PFRA and APRA).
All analyses were performed with Analyse-it® for Microsoft® Excel software, Ultimate Edition, version 6.16.2 (Analyse-it Software Ltd, Leeds, UK). A statistical significance level of 5% (p < 0.05) was considered.
3. Results
3.1. Design Evaluation and Assay Optimization
3.1.1. In Silico Specificity Evaluation
When evaluating the homology of the primers and probe for RSV A/B detection, all sequences found via BLAST yielded a coverage and percent identity >95% and an E-value less than 10-2 only for RSV (Supplementary File S6). The in silico exclusivity of the oligos was 100%: Sequences in the database of 68 respiratory related microorganisms yielded a coverage and percent identity less than 95% and an E-value greater than 10-2 (Supplementary File S7). Using the bioinformatic web tool MFEprimer v3.1 revealed that the probability of amplifying human DNA sequences (background noise) with the oligos designed for the detection of RSV A/B was found to be negligible (Supplementary File S8).
In silico inclusivity analysis of the LDT RSV oligos produced predicted true-positive rates of 99.73% and 99.93% when evaluating 3,360 RSV A and 2,834 RSV B sequences, respectively, from the NCBI database. Likewise, analysis of 11,653 RSV A and 13,907 RSV B sequences from the GISAID database revealed estimated inclusivity of 99.06% and 99.89%, respectively (Supplementary Table S3, based on Supplementary Files S9–S12).
3.1.2. Amplification Efficiency and Multiplex Compatibility
Amplification efficiencies of the optimized monoplex assays were within the acceptability range (90% ≤ E ≤ 110%) (data not shown). Moreover, none of the individual assays showed evidence of interference from the other assays comprising the quadruplex LDRA, indicating optimal compatibility (Supplementary Figure S3). On the Panther Fusion® Open Access™ system, the quadruplex LDRA exhibited R2 ≥ 0.99 and amplification efficiencies for all targets that met the predefined acceptability criteria (Table 3, Figure 2, and Supplementary Figure S3).
3.2. Analytical Performance
3.2.1. Analytical Sensitivity (Limit of Detection)
Table 4 shows absolute and relative hit frequencies (positive results) by target and dilution level of the analytical sensitivity evaluation panel.
According to the Probit regression, analytical sensitivity of LDRA, expressed as the target concentration corresponding to a 95% probability of detection (C95), was: 37.8 copies/reaction (95% CI: 29.5–58.0) for IAV; 13.9 copies/reaction (95% CI: 11.0–21.1) for IBV; 9.6 copies/reaction (95% CI: 7.4–14.6) for SC2; 12.3 copies/reaction (95% CI: 9.6–18.0) for RSV A; and 25.1 copies/reaction (95% CI: 20.4–34.4) for RSV B (Table 5 y Figure 3).
3.2.2. Analytical Specificity
Cross-Reactivity (In Vitro Exclusivity)
No cross-reactivity was observed with any of the pathogens included in the evaluation panel that are clinically related to the LDRA targets. Reactivity (sigmoidal fluorescent amplification curve) was only obtained in the detection channels corresponding to the IAV, IBV, SC2 and RSV viruses (Table 6).
In Vitro Inclusivity
All subtypes and variants of the respiratory viruses tested with LDRA produced “positive” results in the respective detection channels for IAV, IBV, SC2 and RSV; no false-negative results were found in the in vitro inclusivity panel (Table 7).
3.2.3. Precision
Two outlier Ct values and two invalid results due to instrument errors were excluded from analysis. After exclusions, agreement with expected results exceeded 99%. Within-laboratory precision of the LDRA assay was: 0.33 (95% CI: 0.28–0.48), 0.23 (0.21–0.29), 0.46 (0.40–0.59), and 0.42 (0.38–0.50) for the moderate level of IAV, IBV, SC2 and RSV, respectively; and 1.00 (0.91–1.17), 0.42 (0.38–0.52), 0.51 (0.46–0.66), and 0.52 (0.48–0.64) for the low level of IAV, IBV, SC2 and RSV, respectively (Table 8). Figure 4 shows the main contributing components to the within-laboratory precision of the LDRA assay.
3.2.4. Method Comparison: Agreement Assessment
No invalid results were found with any of the assays involved in the method comparison, therefore no samples were excluded. With respect to the PFRA comparator assay, the LDRA yielded four (0.99%) and one (0.25%) discordant negative results for SC2 and RSV, respectively. Meanwhile, compared to the APRA comparator assay, the LDRA produced three (0.74%) discordant positive results: one for IAV (0.25%), one for IBV (0.25%), and one for RSV (0.25%). Discordant samples were reanalyzed with all three RT-qPCR assays and the same results were obtained. One discordant sample was considered SC2-positive by all three assays after reanalysis of six replicates; in that experiment 2/6, 3/6 and 6/6 replicates were positive for SC2 by LDRA, PFRA and APRA, respectively. In the APRA assay, reactivity was observed only for the S gene of SC2 in all analyzed replicates. Correspondingly, the negative percent agreement (NPA), positive percent agreement (PPA), overall percent agreement (OPA) and k-index for the detection of the four respiratory viruses, across both comparator pairs, were no lower than 99.7% (95% CI: 98.1–99.9%), 95.7% (95% CI: 89.3–98.3%), 99.0% (95% CI: 97.5–99.6%), and 0.971 (95% CI: 0.944–0.999), respectively (Table 9).
3.3. Diagnostic Performance
According to the McNemar–Mosteller nonparametric test, differences in positive rates (PR) for IAV, IBV, SC2 and RSV between LDRA and the comparators PFRA and APRA were not statistically significant (p > 0.7322). With respect to consensus, PFRA yielded four (0.99%) and one (0.25%) false-positive results for SC2 and RSV, respectively, while APRA produced three (0.74%) false-negative results: one for IAV (0.25%), one for IBV (0.25%) and one for RSV (0.25%). All LDRA results agreed with the consensus. Therefore, LDRA assay showed diagnostic sensitivity and specificity of 100% for detection of the four respiratory viruses (IAV, IBV, SC2 and RSV). Although commercial comparator assays PFRA and APRA yielded some diagnostic performance parameters values below 100%, no statistically significant differences were observed between these assays and LDRA nor between the comparators themselves (p > 0.1250) (Table 10).
3.4. Mixed Infection Detection Capability
Of 335 samples positive for at least one of IAV, IBV, SC2 or RSV, only seven (2.09%) showed consensus evidence of a mixed infection. One sample tested positive for SC2 and IBV, one for IBV and RSV, one for IAV and RSV, three for SC2 and RSV, and one for SC2 and IAV. The LDRA assay detected all seven co-infections with no disagreement versus the consensus results (OPA = 100% [95% CI: 98.9–100%]; k = 1.000). The PFRA assay detected the seven samples with consensus co-infections, plus three additional discordant samples: one positive for IAV and RSV and two positive for SC2 and IAV (OPA = 99.1% [95% CI: 97.4–99.7%]; k = 0.819 [95% CI: 0.619–1.000]). Conversely, the APRA assay detected five of the consensus co-infection samples. In this case, one sample was positive only for SC2 instead of for SC2 and IBV, and another sample was positive only for IAV instead of for IAV and RSV (OPA = 99.4% [95% CI: 97.8–99.8%]; k = 0.830 [95% CI: 0.599–1.000]) (Table 11).
4. Discussion
There is no doubt that SC2 has become endemic, as evidenced by its integration into the cyclical seasonality dynamics of respiratory viral infections caused by influenza and RSV. The incorporation of multiplex assays into routine surveillance and diagnostic workflows is essential to optimize turnaround time (TAT), care costs, and resource use [3]. Today, numerous commercial multiplex assays exist for simultaneous detection of respiratory viruses, including IAV, IBV, SC2 and RSV. Many have received FDA authorization and have been validated on multiple automated platforms [37]. Although these assays may share excellent analytical and clinical performance for diagnosis, operational and technical requirements, available technology, and —why not— local socioeconomic and epidemiological context are the major determinants guiding laboratory choice. In this study we aimed to develop an RT-qPCR assay for detection of RSV A/B (LDT RSV) and to validate the new assay resulting from combining it with the U.S. CDC assay (CDC Flu-SC2) [24]. We optimized and validated the new quadruplex (LDRA: CDC Flu-SC2 + LDT RSV) on the Panther Fusion® Open Access™ system for fully automated, simultaneous detection of IAV, IBV, SC2, RSV and human RNase P (internal control). This approach seeks to enhance diagnostic sustainability and strengthen response capacity during concurrent circulation of these respiratory viruses, a phenomenon increasingly reported after the post-pandemic reemergence of RSV and influenza [2,38]. Use of human RNase P as an internal control adds a safety element because it functions as a control of sample-collection adequacy. Assays such as the PFRA comparator used in this study, which rely only on process controls, introduce an additional risk of false negatives when clinical samples have not been collected effectively [39].
In settings where health insurance coverage is fragmented or insufficient, as is commonly the case in the Dominican Republic, laboratory-developed tests (LDTs) can improve equity and access to molecular diagnostics, which remain costly in many countries. LDTs have been identified as a key tool for laboratories seeking to adapt diagnostic capacity to local needs, especially in resource-limited contexts [40]. Validation of such assays on routinely used automated platforms also facilitates implementation and sustainability by enabling use of existing infrastructure and reducing dependence on commercial reagents [41]. Additionally, these tests promote technological autonomy and laboratory adaptability in the face of changing viral epidemiology or commercial supply availability, a strategic advantage in health systems with high variability in access [40,42].
Although an FDA-approved homologous assay is available for the Panther Fusion® platform (PFRA), the decision to validate our proposal on the system’s open channel was driven by local operational availability and the aim of exploring lower-cost alternatives while maintaining equivalent quality standards. The Panther Fusion® system is a mid-to-high throughput platform that can process up to 1,000 samples in 24 hours. This, together with continuous and random access loading, substantially reduces TAT (approx. 2.5 hours.) and confers an operational advantage for clinical management and infection control, particularly during seasonal peaks. End-to-end automation improves result quality by minimizing human error while contributing to efficiency and scalability.
The RSV detection assay (LDT RSV) in our study was developed independently, without using previously published oligonucleotide designs as a starting point. However, comparative analysis with existing designs revealed partial overlaps worth noting. First, the forward primer (RSV A/B_fwd) of LDT RSV lies in the same hybridization region selected by Fan, et al. [43], Tang, et al. [44], and Wang, et al. [45]; However, only the primer of the first author shares an identical sequence to that used in this study. Secondly, the reverse primers (RSV A_rev and RSV B_rev) target a hybridization region that overlaps by 96.4% (27/28 nt) with that of the primers of Tang, et al. [44], one of which contains the exact same sequence as the reverse primer from Wang, et al. [45]. Finally, the probe (RSV A/B_prb) locates in the same hybridization region chosen by Tang, et al. [44], and Wang, et al. [45], but we incorporated degenerate bases (Y = C/T) in our probe to increase inclusivity against RSV genetic variability (Supplementary Figure S4). It is worth noting that Tang, et al. [44] is an “improved” version of Wang, et al. [45]. The similarities among RSV oligo designs suggest that the procedure used in our study was robust.
The in silico (Supplementary Tables S1) and in vitro (Table 6) evaluation of the analytical specificity of our design agree that there is a very low risk of cross-reactivity with RSV-related biological agents (microbiota and other respiratory pathogens). Similarly, inclusivity (Supplementary Table S3 and Table 7) rules out a significant risk of false negatives due to mutations in the target sequence. This is demonstrated by the pooled inclusivity (99.21% for RSV A and 99.9% for RSV B), which places our LDT RSV assay at a risk level comparable to that of Fan, et al. [43], with inclusivities of 99.71% for RSV A and 99.86% for RSV B, and that of Tang, et al. [44], with an inclusivity of 99.74% for RSV B. However, with regard to the inclusivity of the RSV A design by Tang, et al. [44] (98.0%) and that of the comparator PFRA [33] (98.12% for RSV A and 98.23% for RSV B), our design showed improved inclusivity or a lower risk of false negatives (Supplementary Figure S5). In the context of an external evaluation program by the World Health Organization (WHO, 2019-2020), Williams, et al. [46] reported a maximum of 4 mismatches (between the probe and the reverse primer) in the CDC design (Wang, et al. [45]) when tested against representative circulating RSV strain sequences. Although those authors indicated this did not negatively affect RSV detection, the pooled inclusivity of that design has substantially declined to date (94.4% for RSV A and 14.26% for RSV B) (Supplementary Figure S5), which implies a significant risk of false negatives. Differences in inclusivity between our design and the PFRA comparator may be attributable, at least in part, to differences in calculation methods, prediction criteria, and the number and representativeness of viral nucleotide sequences available at the times of evaluation. The PFRA manufacturer used 1,599 RSV A and 1,240 RSV B sequences from NCBI and GISAID covering the period from January 1, 2015, to February 15, 2022. In contrast, our study calculated the inclusivity of the LDRA assay and the designs by Fan, et al. [43], Tang, et al. [44], and Wang, et al. [45] using all available sequences from the same NCBI and GISAID databases through September 30, 2025. This resulted in a total of 15,013 RSV A sequences and 16,741 to 16,747 RSV B sequences.
All the aspects of optimal analytical specificity discussed above also highlight the suitability of selecting a conserved region within the RSV M gene as the target sequence. The remaining oligo designs (CDC Flu-SC2), directed at IAV, IBV and SC2 detection (considering the SC2 probe modification described here), retain excellent in silico (Supplementary Table S4) and in vitro (Table 6 and Table 7) analytical specificity, supporting the quadruplex LDRA’s use for influenza and COVID-19 diagnosis. In this regard, amplification efficiencies (97–105%) and R² ≥ 0.99 for all targets further underscore the robustness of the multiplex strategy, since no evidence of target competition-related penalty was observed.
The LDRA assay achieved an LoD per target between 9.6 and 37.8 copies/reaction. This analytical parameter is highly dependent on evaluation samples, extraction method, extraction/elution/amplification volumes, PCR instrument and other experimental conditions. Furthermore, lack of consensus and limited availability of certified reference materials make comparability of analytical sensitivity between assay methods difficult and preclude a single clinically useful universal acceptability criterion. Possibly for these reasons, the literature shows heterogeneity in evaluation procedures, materials and the units used to express RT-qPCR LoD. Due to these differences, LoD results for IAV, IBV and SC2 obtained in this study are difficult to compare with those of the predecessor CDC Flu-SC2 assay [24]. Although the LDRA LoD may be comparable to, or appreciably different from, recently reported values for homologous assays, it appears to meet a practical empirical threshold of high sensitivity when able to detect ≤ 102 copies/reaction (≤ 104 copies/mL) [5,11,24,44,47,48,49].
Precision estimation is an indispensable requirement in analytical performance evaluation, yet not all authors report it. Low imprecision reduces clinical result uncertainty, particularly near the LoD where therapeutic and epidemiological control decisions may be affected [50]. In our study, percent agreement between observed and expected results was maximal (112/112: 100%) except for four replicates (111/112: 99.1%) that were excluded: two by Grubbs’ outlier test and two due to instrument processing errors beyond user control. The main contributors to within-laboratory imprecision for LDRA assay were, in descending order, run/day (within-run/day precision or repeatability) and PPR lot (within-lot precision). Instrument (between-instrument precision) contributed moderately, depending on pathogen and level, with values as low as 0% and as high as 1.7% (accounting for 88.2% of laboratory imprecision). Between-lot and between-run/day precision contributed little. The highest imprecision (2.9%) occurred in the panel member containing the low IAV level. For other pathogens, differences between imprecision components were minimal. Generally, for RT-qPCR assays CV < 10% and CV < 5% are considered good and excellent, respectively [51]. Shu, et al. [24] declared variance values >2 (SD = 1.41) to be unacceptable during the production quality control of CDC Flu-SC2. In this context, the CV/SD values reported here for LDRA (CV: 0.9–2.9%; SD: 0.23–1.00) reflect excellent analytical precision and demonstrate great consistency of the new multiplex assay, even near the LoD. Previous reports meet these adequacy criteria [13,15,24,44].
Discordances observed between LDRA and PFRA assays yielded Ct values between 37.3 and 39.7 for SC2 and 38.8 for RSV. Similarly, discordances between LDRA and APRA assays showed Ct values of 36.6, 37.6 and 38.0 for IAV, IBV and RSV, respectively. The sample that exhibited differences in detection frequency across six SC2 replicates by the three RT-qPCR assays had mean Ct values similar to these discordances: LDRA, 37.8 (2 positives out of 6 replicates); PFRA, 38.3 (3 positives out of 6 replicates); and APRA, 34.2 (6 positives out of 6 replicates). All these discordances occur at high Ct values (approx. 34.2–38.3) and may indicate sensitivity differences or stochastic effects near the LoD. Detection of only the S gene of SC2 by APRA assay may also be influenced by target-specific factors, since it has been reported that RdRp detection sensitivity for that assay can be greater than S gene sensitivity [52]. This finding underscores the importance of multitarget detection for high-mutation RNA respiratory viruses. Despite the discordances, LDRA assay showed excellent concordance with PFRA and APRA assays across a broad Ct range for the four viruses, yielding k ≥ 0.971 (OPA ≥ 99%) and k ≥ 0.991 (OPA ≥ 99.8%), respectively. Thus, LDRA assay meets commutability criteria with the comparators. Recent studies likewise report substantial commutability among RT-qPCR assays for simultaneous detection of IAV, IBV, SC2 and RSV, with NPA, PPA and OPA values between 95% and 100% [3,5,6,11,14,15,21,48,52]. Values below the acceptability limit for comparability are most likely attributable to a small sample size or an unbalanced number of positive (or negative) samples, as observed for IBV (PPA = 88.9%) and SC2 (PPA = 33.3%) in the studies published byTang, et al. [44], and Matic, et al. [20], respectively. Although heterogeneity exists across comparative statistics in the literature, RT-qPCR assays for diagnosing IAV, IBV, SC2 and RSV generally meet commonly accepted criteria for acceptability [34,35].
Comparison to consensus results provided a diagnostic performance benchmark and a means to resolve discordances. In LDRA assay no false negatives or false positives were found, so diagnostic sensitivity, specificity and predictive values were maximal (100%). The SC2 false positives observed with PFRA assay, the most frequent in this study, have been previously reported [21]. Two of these coincided with IAV co-detection. These false positives could be due to cross-contamination during sample processing or to comparator design-related specificity issues. However, it cannot be ruled out that this finding is at least partially associated with errors in version 7.2.7 of the Panther Fusion® platform software or the crosstalk correction algorithm, as was previously reported [53]. It is worth noting that although the PFRA assay manufacturer recently implemented an adaptive crosstalk correction to mitigate inter-channel artifacts in high viral-load samples, this study was performed with software version 7.2.7.2 [54]. Conversely, the three false negatives found with APRA may be due to sensitivity differences relative to LDRA and PFRA assays or to stochasticity near the LoD, given their high Ct values. Nevertheless, there were no statistically significant differences in diagnostic performance parameters among the three RT-qPCR assays (p > 0.1250). Therefore, the LDRA quadruplex assay and the two commercial comparators assessed in this study all demonstrate “world-class” clinical performance in diagnosing influenza, SC2, and RSV in symptomatic patients. This finding is consistent with previous studies of similar assays. The reported diagnostic sensitivities and specificities of such assays typically range from 95% to 100% and from 96.8% to 100%, respectively [3,18,22,55].
Co-infections involving IAV, IBV, SC2 and RSV have been described previously [56,57,58]. Although infrequent, their detection has prognostic value in patient care because it enables risk stratification for complications and mortality [59,60]. Epidemiologically, co-infections may indicate the need for more active surveillance [61]. In our study, mixed-infection frequency (2.09%) falls within the commonly observed post-pandemic range (0.3–10%) [21,50,60,61,62,63]. The most frequent co-infection was SC2 + RSV, likely because three outbreaks of these two viruses occurred during the sample-selection period, together with two IAV and one IBV outbreaks (Supplementary Figure S6). This may explain why SC2 and RSV were the most frequent viruses in co-infection samples (3 of 7), followed by IAV and IBV (2 of 7). Differences in co-infection detectability among the three RT-qPCR assays and the consensus are grounded in the false-negative and false-positive results discussed above. As recently described in a multiplex IAV typing assay [64], false negatives in consensus co-infected samples may reflect preferential amplification of the higher viral-load target sequence. This could indicate some degree of interference among the oligos in the multiplex design. Despite these differences, all assays met the excellent agreement requirement for co-infection detection.
Finally, it is worth highlighting the most prominent limitations of our work. This is a single-center study, which may limit extrapolation to other regions or epidemiological contexts. Oligo designs target single regions of viruses with high genetic variability, particularly IAV and SC2. The population sample size is relatively small compared with the long period over which clinical samples were randomly selected. No demographic, epidemiological or clinical data of the patients were available, so potential correlations could not be explored. Clinical samples were de-identified residuals stored retrospectively, so results reflect detection frequency in the analyzed cohort only and should not be interpreted as indicators of population prevalence. The LoD likely underestimates the true analytical sensitivity because synthetic evaluation materials with target concentrations not traceable to a certified reference standard were used. Although these limitations should be considered when interpreting the results, they do not invalidate the technical relevance or scientific value of the study.
5. Conclusions
The quadruplex version of the CDC (LDRA) assay, which detects and distinguishes four of the most common respiratory viruses, showed optimal analytical and clinical performance comparable to commercial alternatives, despite modifications. Therefore, the new multiplex represents a reliable option for the diagnosis and comprehensive surveillance of IAV, IBV, SC2, and RSV. Its validation on the fully automated Panther Fusion® platform makes the assay a useful tool for accelerating clinical decision-making and surveillance strategies while optimizing resources in medium- to high-performance clinical settings.
Supplementary Materials
The following supporting information can be downloaded at the website of this paper posted on Preprints.org, Supplementary Figures and Tables.docx (Figures S1–S6, and Tables S1–S4); File S1: Conserved Region Search_WO Redundancies.txt; File S2: Positional Nt Numerical Summary_WO Redundancies.txt; File S3: Entropy & Coverage_WO Redundancies_M gene.xls; File S4: Entropy & Coverage_WO Redundancies_L gene.xls; File S5: LDT_Flu-SC2-RSV_v2 (Open Access v3.0).pdf; File S6: In silico homology analysis (BLAST).txt; File S7: In silico cross-reactivity (BLAST).txt; File S8: hDNA cross-reactivity (MFEprimer3.1).txt; File S9: Genbank_RSV A_Inclusivity & Clustering.xls; File S10: Genbank_RSV B_Inclusivity & Clustering.xls; File S11: GISAID_RSV A_Inclusivity & Clustering.xls; File S12: GISAID_RSV B_Inclusivity & Clustering.xls.
Author Contributions
Conceptualization, A.C.M.; methodology, A.C.M.; validation, R.A.R.R., M.E.A.B. and K.V.M.L; formal analysis, A.C.M.; investigation, M.E.A.B., R.A.R.R., M.N.S.O., K.V.M.L. and A.C.M.; resources, K.V.M.L. and A.C.M.; data curation, R.A.R.R., M.E.A.B. and A.C.M.; writing—original draft preparation, A.C.M.; writing—review and editing, R.A.R.R., M.N.S.O. and A.C.M.; visualization, A.C.M.; supervision, K.V.M.L.; project administration, A.C.M.; funding acquisition, A.C.M. All authors have read and agreed to the published version of the manuscript.
Funding
This research received no external funding.
Institutional Review Board Statement
Ethical review and approval were waived for this study due to because the samples used were leftovers from clinical samples analyzed under medical prescription, which were collected in compliance with the confidentiality and informed consent policies of the clinical laboratory. In short, all patients expressly agreed to the possibility of using the remnants of their clinical samples (residual clinical samples) in research and development, and to the possibility of publishing the results obtained in the research, provided that the privacy of patient data is protected.
Informed Consent Statement
Not applicable.
Data Availability Statement
The findings of this study are based on metadata associated with 285,828 sequences of the M gene of IAV; 67,101 sequences of the NS2 gene of IBV; 77,878 sequences of SC2; 11,752 sequences of RSV A and 13,910 sequences of RSV B, available on GISAID (https://gisaid.org/) up to September 30th, 2025 for IAV, IBV, and RSV, but from January 1st, 2023 to September 30th, 2025 for SC2, and accessible at https://doi.org/10.55876/gis8.251031bq, https://doi.org/10.55876/gis8.251031eu, https://doi.org/10.55876/gis8.251031yn, https://doi.org/10.55876/gis8.250930wc, and https://doi.org/10.55876/gis8.250930mw, respectively.
Acknowledgments
This study was developed by researchers from the Research and Development (R&D) Group of the Molecular Biology Department at Referencia Laboratorio Clínico. The authors express their profound gratitude for the resources made available and for the exceptional interest of the Executive Directorate of the clinical laboratory, headed by Patricia León, Mark Kelly, and Priscilla Kelly, in terms of research, innovation, and development to provide molecular tests to the Dominican community tailored to their socioeconomic and epidemiological context. The authors have reviewed and edited the output and take full responsibility for the content of this publication. We thank María Luisa Hernández Quesada (www.linkedin.com/in/maría-luisa-quesada-2b8404228) for the assistance with English-language editing.
Conflicts of Interest
The authors declare no conflicts of interest. The content of this document reflects the authors’ views and does not necessarily represent those of Referencia Laboratorio Clínico. The clinical laboratory and its directors had no role in the design of the study; in the collection, analyses, or interpretation of data; in the writing of the manuscript; or in the decision to publish the results. The use of trade names is solely for identification purposes and does not imply endorsement by the clinical laboratory or any government or regulatory authority.
Abbreviations
The following abbreviations are used in this manuscript:
| 95% CI | 95% confidence interval |
| ANOVA | Analysis of variance |
| APRA | Allplex™ SARS-CoV-2/FluA/FluB/RSV assay (Allplex respiratory assay) |
| ASRC | Amplirun® SARS-CoV-2 RNA Controls |
| CAP | College of American Pathologist |
| CDC | Centers for Disease Control and Prevention |
| CV | Coefficient of variation |
| Cy5 | Cyanine 5 dye |
| Cy5.5 | Cyanine 5.5 dye |
| DNA | Deoxyribonucleic acid |
| dSens | Diagnostic sensitivity |
| dSpec | Diagnostic specificity |
| E | Amplification efficiency |
| EQA | External quality assessment |
| E-value | Expectation value |
| FAM | 6-carboxifluoresceína dye |
| FN | False negative |
| FP | False positive |
| fwd | Forward primer |
| GISAID | Global Initiative on Sharing Influenza Data |
| H1N1pdm09 | H1N1 subtype derived from the 2009 pandemic |
| H1N1sea | Seasonal H1N1 subtype |
| IAV | Influenza A virus |
| IBV | Influenza B virus |
| IC | Internal control |
| ID3 | CAP Nucleic Acid Amp, Respiratory Ltd EQA Programme |
| IDR | CAP Infectious Disease, Respiratory EQA Programme |
| INFTP24 | QCMD 2024 Influenza Typing EQA Programme |
| k | Kappa index |
| LDRA | Laboratory-developed respiratory assay |
| LDT | Laboratory-developed test |
| LDT RSV | RSV amplification and detection assay |
| LoD | Limit of detection |
| MAFFT | Multiple alignment using fast Fourier transform |
| MixPA | Mixed infection percent agreement |
| MMX | Master mix |
| n | Total number of samples/replicates |
| NAAT | Nucleic acid amplification test |
| NATRVP 2.1 | NATtrol Respiratory Verification Panel 2.1 |
| NCBI | National Center for Biotechnology Information |
| Neg | Negative result |
| NPA | Negative percent agreement |
| NPV | Negative predictive value |
| nt | Nucleotide |
| OPA | Overall percent agreement |
| PFRA | Panther Fusion® SARS-CoV-2/Flu A/B/RSV assay (Panther Fusion respiratory assay) |
| PPA | Positive percent agreement |
| PPR | Primers and probes reconstitution solution |
| PPV | Positive predictive value |
| PR | Positive rate |
| prb | Probe |
| QCMD | Quality Control for Molecular Diagnostics |
| qPCR | Real-time PCR or Quantitative PCR |
| RdRp | RNA-dependent RNA polymerase |
| rev | Reverse primer |
| RFU | Relative fluorescence units |
| RNA | Ribonucleic acid |
| RNase P | RNase P humana |
| RSV | Respiratory syncytial virus |
| RT | Reverse transcription |
| RT-qPCR | Real-time PCR with reverse transcription |
| RTX#QC | Respiratory Multiplex (1 to 5) Q Control |
| SC2 | SARS-CoV-2 |
| SD | Standard deviation |
| SinPA | Single infection percent agreement |
| SLM | Medium of the Panther Fusion® Specimen Lysis Tube (specimen lysis medium) |
| SOP | Standard operating procedure |
| TAT | Turnaround time |
| TexRd-XN | Texas Red-XN dye |
| Ta | Annealing temperature |
| Tm | Melting temperature |
| TN | True negative |
| TP | True positive |
| UTM | Universal transport medium |
| UTM/SLM | Disolución de UTM de hisopados nasofaríngeos negativos en SLM a la proporción de 0.5:0.71 mL. |
| WHO | World Helath Organization |
| YakYel | Yakima Yellow dye |
| 1 | Amplirun® SARS-CoV-2 B.1.1.7 (Alpha) RNA Control, Amplirun® SARS-CoV-2 B.1.351 (Beta) RNA Control, Amplirun® SARS-CoV-2 B.1.617.2 (Delta) RNA Control, Amplirun® SARS-CoV-2 P.1 (Gamma) RNA Control, Amplirun® SARS-CoV-2 BA.1 (Omicron) RNA Control. |
References
- Olsen, S.J.; Azziz-Baumgartner, E.; Budd, A.P.; Brammer, L.; Sullivan, S.; Pineda, R.F.; Cohen, C.; Fry, A.M. Decreased Influenza Activity During the COVID-19 Pandemic - United States, Australia, Chile, and South Africa, 2020. MMWR Morb Mortal Wkly Rep 2020, 69, 1305–1309. [Google Scholar] [CrossRef] [PubMed]
- Park, M.; Choi, W.S.; Cowling, B.J. Shifts in Influenza and Respiratory Syncytial Virus Infection Patterns in Korea After the COVID-19 Pandemic Resulting From Immunity Debt: Retrospective Observational Study. JMIR Public Health Surveill 2025, 11, e68058. [Google Scholar] [CrossRef] [PubMed]
- Boukli, N.; Flamand, C.; Chea, K.L.; Heng, L.; Keo, S.; Sour, K.; In, S.; Chhim, P.; Chhor, B.; Kruy, L.; et al. One assay to test them all: Multiplex assays for expansion of respiratory virus surveillance. Frontiers in Medicine 2023, 10. [Google Scholar] [CrossRef] [PubMed]
- Komu, J.G.; Jamsransuren, D.; Matsuda, S.; Ogawa, H.; Takeda, Y. Performance Evaluation of a Fully Automated Molecular Diagnostic System for Multiplex Detection of SARS-CoV-2, Influenza A/B Viruses, and Respiratory Syncytial Virus. Diagnostics 2025, 15, 1791. [Google Scholar] [CrossRef]
- Yun, J.; Park, J.H.; Kim, N.; Roh, E.Y.; Shin, S.; Yoon, J.H.; Kim, T.S.; Park, H. Evaluation of Three Multiplex Real-time Reverse Transcription PCR Assays for Simultaneous Detection of SARS-CoV-2, Influenza A/B, and Respiratory Syncytial Virus in Nasopharyngeal Swabs. J Korean Med Sci 2021, 36, e328. [Google Scholar] [CrossRef]
- Upadhyay, P.; Surur, F.; Singh, V. Performance Assessment of a Multiplex Real-Time PCR Assay for Detection of Viruses Causing Respiratory Tract Infections. Diagnostics (Basel) 2024, 14. [Google Scholar] [CrossRef]
- World Health Organization. Influenza (seasonal). Available online: https://www.who.int/news-room/fact-sheets/detail/influenza-%28seasonal%29 (accessed on 16 September 2025).
- World Health Organization. COVID-19 epidemiological update –. Available online: https://www.who.int/publications/m/item/covid-19-epidemiological-update---24-december-2024 (accessed on 16 September 2025).
- World Health Organization. Respiratory syncytial virus (RSV). Available online: https://www.who.int/news-room/fact-sheets/detail/respiratory-syncytial-virus-(rsv) (accessed on 16 September 2025).
- Center for Disease Control and Prevention. RSV in Adults. Available online: https://www.cdc.gov/rsv/adults/index.html (accessed on 16 September 2025).
- Tai, C.-S.; Jian, M., Jr.; Lin, T.-H.; Chung, H.-Y.; Chang, C.-K.; Perng, C.-L.; Hsieh, P.-S.; Shang, H.-S. Analytical performance evaluation of a multiplex real-time RT-PCR kit for simultaneous detection of SARS-CoV-2, influenza A/B, and RSV. PeerJ 2025, 13, e19693. [Google Scholar] [CrossRef]
- Lee, J.S.; Ahn, J.J.; Kim, S.J.; Yu, S.Y.; Koh, E.J.; Kim, S.H.; Sung, H.S.; Huh, J.W.; Hwang, S.Y. POCT Detection of 14 Respiratory Viruses Using Multiplex RT-PCR. BioChip Journal 2021, 15, 371–380. [Google Scholar] [CrossRef]
- Pabbaraju, K.; Wong, A.A.; Ma, R.; Zelyas, N.; Tipples, G.A. Development and validation of a multiplex reverse transcriptase-PCR assay for simultaneous testing of influenza A, influenza B and SARS-CoV-2. Journal of virological methods 2021, 293, 114151. [Google Scholar] [CrossRef]
- Kim, T.Y.; Bae, G.E.; Kim, J.Y.; Kang, M.; Jang, J.H.; Huh, H.J.; Chung, D.R.; Lee, N.Y. Evaluation of the Kaira COVID-19/Flu/RSV Detection Kit for detection of SARS-CoV-2, influenza A/B, and respiratory syncytial virus: A comparative study with the PowerChek SARS-CoV-2, influenza A&B, RSV Multiplex Real-time PCR Kit. PloS one 2022, 17, e0278530. [Google Scholar] [CrossRef]
- Chan, W.S.; Wong, K.P.; Yau, S.K.; Wong, C.Y.; Chan, T.C.; Hung, J.; Lai, K.T.; Leung, C.P.; Wang, C.L.; Au, C.H.; et al. Clinical Evaluation of Xpert Xpress CoV-2/Flu/RSV plus and Alinity m Resp-4-Plex Assay. Diagnostics (Basel) 2024, 14. [Google Scholar] [CrossRef] [PubMed]
- Centers for Disease Control and Prevention (CDC). Clinical Guidance for Patients with Acute Respiratory Illness Being Hospitalized When SARS-CoV-2 and Influenza Viruses are Co-Circulating. Available online: https://www.cdc.gov/flu/hcp/clinical-guidance/testing-guidance-for-clinicians-hospitalized.html (accessed on 17 September 2025).
- Sinha, R. The role and impact of new technologies on healthcare systems. Discover Health Systems 2024, 3. [Google Scholar] [CrossRef]
- Abdullah, A.; Sam, I.C.; Ong, Y.J.; Theo, C.H.; Pukhari, M.H.; Chan, Y.F. Comparative Evaluation of a Standard M10 Assay with Xpert Xpress for the Rapid Molecular Diagnosis of SARS-CoV-2, Influenza A/B Virus, and Respiratory Syncytial Virus. Diagnostics 2023, 13, 3507. [Google Scholar] [CrossRef]
- McElvania, E.; Rao, D.; Greninger, A.L.; Harnett, G.; Larcena, A.; Patel, A.; Webster, B.; Ulen, C.; Green, D.F.; King, D.; et al. Evaluation of Cepheid Xpert Xpress CoV-2/Flu/RSV plus for nasal and nasopharyngeal specimens tested in CLIA-accredited and CLIA-waived settings. Journal of clinical virology: the official publication of the Pan American Society for Clinical Virology 2025, 180, 105851. [Google Scholar] [CrossRef]
- Matic, N.; Lawson, T.; Ritchie, G.; Lowe, C.F.; Romney, M.G. Testing the limits of multiplex respiratory virus assays for SARS-CoV-2 at high cycle threshold values: Comparative performance of cobas 6800/8800 SARS-CoV-2 & Influenza A/B, Xpert Xpress SARS-CoV-2/Flu/RSV, and cobas Liat SARS-CoV-2 & Influenza A. Journal of the Association of Medical Microbiology and Infectious Disease Canada 2024, 8, 328–335. [Google Scholar] [CrossRef] [PubMed]
- Sasidharan, A.; Selvarangan, R.; Konrad, K.; Faron, M.L.; Shakir, S.M.; Hillyard, D.; McCall, R.K.; McHardy, I.H.; Goldberg, D.C.; Dunn, J.J.; et al. Multi-center clinical evaluation of the Panther Fusion SARS-CoV-2/Flu A/B/RSV assay in nasopharyngeal swab specimens from symptomatic individuals. Journal of clinical microbiology 2023, 61, e0082723. [Google Scholar] [CrossRef]
- Zhen, W.; Manji, R.; Smith, E.; Wuitschick, J.; Lucic, D.; Berry, G.J. Evaluation of the Alinity m Resp-4-Plex Assay for the Detection of Severe Acute Respiratory Syndrome Coronavirus 2, Influenza A Virus, Influenza B Virus, and Respiratory Syncytial Virus. Microbiol Spectr 2022, 10, e0109021. [Google Scholar] [CrossRef]
- Chung, H.Y.; Jian, M.J.; Chang, C.K.; Lin, J.C.; Yeh, K.M.; Yang, Y.S.; Chen, C.W.; Hsieh, S.S.; Tang, S.H.; Perng, C.L.; et al. Multicenter study evaluating one multiplex RT-PCR assay to detect SARS-CoV-2, influenza A/B, and respiratory syncytia virus using the LabTurbo AIO open platform: epidemiological features, automated sample-to-result, and high-throughput testing. Aging (Albany NY) 2021, 13, 24931–24942. [Google Scholar] [CrossRef]
- Shu, B.; Kirby, M.K.; Davis, W.G.; Warnes, C.; Liddell, J.; Liu, J.; Wu, K.H.; Hassell, N.; Benitez, A.J.; Wilson, M.M.; et al. Multiplex Real-Time Reverse Transcription PCR for Influenza A Virus, Influenza B Virus, and Severe Acute Respiratory Syndrome Coronavirus 2. Emerg Infect Dis 2021, 27, 1821–1830. [Google Scholar] [CrossRef]
- Caballero Méndez, A.; Reynoso de la Rosa, R.A.; Abreu Bencosme, M.E.; Sosa Ortiz, M.N.; Pichardo Beltre, E.; de la Cruz Garcia, D.M.; Pinero Santana, N.J.; Bacalhau de Leon, J.C. Development and performance evaluation of a qPCR-based assay for the fully automated detection of group B Streptococcus (GBS) on the Panther Fusion Open Access system. Microbiol Spectr 2024, 12, e0005724. [Google Scholar] [CrossRef]
- Caballero Méndez, A.; Reynoso de La Rosa, R.A.; Abreu Bencosme, M.E.; Sosa Ortiz, M.N.; Pichardo Beltré, E.; de La Cruz García, D.M.; Piñero Santana, N.J.; Bacalhau de León, J.C. Screening for Streptococcus agalactiae: Development of an Automated qPCR-Based Laboratory-Developed Test Using Panther Fusion Open AccessTM. Bio-protocol 2025, 15, e5255. [Google Scholar] [CrossRef] [PubMed]
- Rodriguez, A.; Rodriguez, M.; Cordoba, J.J.; Andrade, M.J. Design of primers and probes for quantitative real-time PCR methods. Methods Mol Biol 2015, 1275, 31–56. [Google Scholar] [CrossRef] [PubMed]
- Wang, K.; Li, H.; Xu, Y.; Shao, Q.; Yi, J.; Wang, R.; Cai, W.; Hang, X.; Zhang, C.; Cai, H.; et al. MFEprimer-3.0: quality control for PCR primers. Nucleic acids research 2019, 47, W610–W613. [Google Scholar] [CrossRef] [PubMed]
- Galaxy, C. The Galaxy platform for accessible, reproducible, and collaborative data analyses: 2024 update. Nucleic acids research 2024, 52, W83–W94. [Google Scholar] [CrossRef]
- Hologic Inc. Panther Fusion® Specimen Lysis. 2022, 001, AW-26255-001. [Google Scholar]
- Roche Inc. MagNA Pure 96 DNA andViral NA Large Volume Kit. 2021, 10. [Google Scholar]
- Seegene Inc. 12/2023 V2.01_(EN); Allplex™ SARS-CoV-2/FluA/FluB/RSV Assay. 2023.
- Hologic Inc. Panther Fusion® SARS-CoV-2/Flu A/B/RSV Assay. 2025, 002, 32326–001001. [Google Scholar]
- Silva, D.T.; Starke-Buzetti, W.A.; Alves-Martin, M.F.; Paixao Mdos, S.; Tenorio Mda, S.; Lopes, M.L. Comparative evaluation of several methods for Canine Visceral Leishmaniasis diagnosis. Rev Bras Parasitol Vet 2014, 23, 179–186. [Google Scholar] [CrossRef]
- Tahir, B.; Weldegebreal, F.; Ayele, F.; Ayana, D.A. Comparative evaluation of saliva and nasopharyngeal swab for SARS-CoV-2 detection using RT-qPCR among COVID-19 suspected patients at Jigjiga, Eastern Ethiopia. PloS one 2023, 18, e0282976. [Google Scholar] [CrossRef]
- Erdoğan, S.; Gülhan, O.T. Alternative Confidence Interval Methods Used in the Diagnostic Accuracy Studies. Computational and Mathematical Methods in Medicine 2016, 2016, 1–7. [Google Scholar] [CrossRef]
- Centers for Disease Control and Prevention. Multiplex Assays Authorized for Simultaneous Detection of Influenza Viruses and SARS-CoV-2 by FDA. Available online: https://www.cdc.gov/flu/hcp/testing-methods/flu-covid19-detection.html?utm (accessed on 10 October 2025).
- Koçer, İ.; Demirbakan, H.; Aktaş, A. Temporal dynamics and forecasting of respiratory viral infections during and after the SARS-CoV-2 pandemic (2020–2027): a multiplex PCR and ARIMA-based study. Frontiers in Microbiology 2025, 16. [Google Scholar] [CrossRef] [PubMed]
- Leung, E.C.; Chow, V.C.; Lee, M.K.; Tang, K.P.; Li, D.K.; Lai, R.W. Evaluation of the Xpert Xpress SARS-CoV-2/Flu/RSV Assay for Simultaneous Detection of SARS-CoV-2, Influenza A and B Viruses, and Respiratory Syncytial Virus in Nasopharyngeal Specimens. Journal of clinical microbiology 2021, 59. [Google Scholar] [CrossRef] [PubMed]
- Spitzenberger, F.; Patel, J.; Gebuhr, I.; Kruttwig, K.; Safi, A.; Meisel, C. Laboratory-Developed Tests: Design of a Regulatory Strategy in Compliance with the International State-of-the-Art and the Regulation (EU) 2017/746 (EU IVDR [In Vitro Diagnostic Medical Device Regulation]). Therapeutic Innovation & Regulatory Science 2022, 56, 47–64. [Google Scholar] [CrossRef]
- Gao, J.; Jennings, L.J. Quality Assurance and Quality Control in Molecular Diagnostic Laboratories. In Practical Oncologic Molecular Pathology: Frequently Asked Questions; Ding, Y., Zhang, L., Eds.; Springer International Publishing: Cham, 2021; pp. 77–85. [Google Scholar]
- Teirlinck, A.C.; Broberg, E.K.; Stuwitz Berg, A.; Campbell, H.; Reeves, R.M.; Carnahan, A.; Lina, B.; Pakarna, G.; Bøås, H.; Nohynek, H.; et al. Recommendations for respiratory syncytial virus surveillance at the national level. European Respiratory Journal 2021, 58, 2003766. [Google Scholar] [CrossRef]
- Fan, G.; Qian, Q.; Tang, Y.; Liu, J.; Yang, L.; Peng, Y.; Lin, Y.; Ou, G.; Luo, Y.; Shen, C.; et al. The dynamic etiology and epidemiological patterns of acute respiratory tract infections during and post non-pharmacological interventions of SARS-CoV-2 in Shenzhen, China: a two years’ prospective cohort study from June 2022. Frontiers in Cellular and Infection Microbiology 2025, 15. [Google Scholar] [CrossRef]
- Tang, H.T.; Norz, D.; Grunwald, M.; Giersch, K.; Pfefferle, S.; Fischer, N.; Aepfelbacher, M.; Rohde, H.; Lutgehetmann, M. Analytical and clinical validation of a novel, laboratory-developed, modular multiplex-PCR panel for fully automated high-throughput detection of 16 respiratory viruses. Journal of clinical virology: the official publication of the Pan American Society for Clinical Virology 2024, 173, 105693. [Google Scholar] [CrossRef]
- Wang, L.; Piedra, P.A.; Avadhanula, V.; Durigon, E.L.; Machablishvili, A.; López, M.-R.; Thornburg, N.J.; Peret, T.C.T. Duplex real-time RT-PCR assay for detection and subgroup-specific identification of human respiratory syncytial virus. J. Virol. Methods 2019, 271, 113676. [Google Scholar] [CrossRef]
- Williams, T.; Jackson, S.; Barr, I.; Bi, S.; Bhiman, J.; Ellis, J.; Von Gottberg, A.; Lindstrom, S.; Peret, T.; Rughooputh, S.; et al. Results from the second WHO external quality assessment for the molecular detection of respiratory syncytial virus, 2019–2020. Influenza and Other Respiratory Viruses 2023, 17. [Google Scholar] [CrossRef]
- Vogels, C.B.F.; Brito, A.F.; Wyllie, A.L.; Fauver, J.R.; Ott, I.M.; Kalinich, C.C.; Petrone, M.E.; Casanovas-Massana, A.; Muenker, Catherine; Moore, M.A.J.; et al. Analytical sensitivity and efficiency comparisons of SARS-CoV-2 RT–qPCR primer–probe sets. Nature Microbiology 2020, 5, 1299–1305. [Google Scholar] [CrossRef]
- Kim, T.Y.; Kim, J.Y.; Shim, H.J.; Yun, S.A.; Jang, J.H.; Huh, H.J.; Kim, J.W.; Lee, N.Y. Performance Evaluation of the PowerChek SARS-CoV-2, Influenza A & B Multiplex Real-Time PCR Kit in Comparison with the BioFire Respiratory Panel. Ann Lab Med 2022, 42, 473–477. [Google Scholar] [CrossRef]
- Havasi, A.; Visan, S.; Cainap, C.; Cainap, S.S.; Mihaila, A.A.; Pop, L.A. Influenza A, Influenza B, and SARS-CoV-2 Similarities and Differences - A Focus on Diagnosis. Front Microbiol 2022, 13, 908525. [Google Scholar] [CrossRef] [PubMed]
- Huang, Z.; Song, J.; Shi, C.; Fan, X.; Xiao, Y.; Wang, X. Development and validation of an automated and high-throughput quadruplex RT–ddPCR assay for the detection of influenza A, influenza B, respiratory syncytial virus, and SARS-CoV-2. Frontiers in Cellular and Infection Microbiology 2025, 15. [Google Scholar] [CrossRef] [PubMed]
- Hays, A.; Islam, R.; Matys, K.; Williams, D. Best Practices in qPCR and dPCR Validation in Regulated Bioanalytical Laboratories: Best Practices in qPCR and dPCR Validation in Regulated Bioanalytical Laboratories. The AAPS journal 2022, 24, 36. [Google Scholar] [CrossRef] [PubMed]
- Kim, T.Y.; Kim, J.Y.; Shim, H.J.; Yun, S.A.; Jang, J.H.; Huh, H.J.; Kim, J.W.; Lee, N.Y. Comparison of the PowerChek SARS-CoV-2, Influenza A&B, RSV Multiplex Real-time PCR Kit and BioFire Respiratory Panel 2.1 for simultaneous detection of SARS-CoV-2, influenza A and B, and respiratory syncytial virus. Journal of virological methods 2021, 298, 114304. [Google Scholar] [CrossRef]
- U.S Food; Drug Administration. MAUDE Adverse Event Report: HOLOGIC, INC. FUSION SARS COV-2/FLU/RSV; PANTHER FUSION SARS COV-2/FLU A/B/RSV ASSAY. Available online: https://www.accessdata.fda.gov/scripts/cdrh/cfdocs/cfmaude/detail.cfm?mdrfoi__id=20263844 (accessed on 30 September 2025).
- U.S Food; Drug Administration. 510(k) SUBSTANTIAL EQUIVALENCE DETERMINATION. Available online: https://www.accessdata.fda.gov/cdrh_docs/reviews/K241240.pdf (accessed on 12 September 2025).
- Wolters, F.; Grunberg, M.; Huber, M.; Kessler, H.H.; Pruller, F.; Saleh, L.; Febreau, C.; Rahamat-Langendoen, J.; Thibault, V.; Melchers, W.J.G. European multicenter evaluation of Xpert(R) Xpress SARS-CoV-2/Flu/RSV test. Journal of medical virology 2021, 93, 5798–5804. [Google Scholar] [CrossRef]
- Tang, M.L.; Li, Y.Q.; Chen, X.; Lin, H.; Jiang, Z.C.; Gu, D.L.; Chen, X.; Tang, C.X.; Xie, Z.Q. Co-Infection with Common Respiratory Pathogens and SARS-CoV-2 in Patients with COVID-19 Pneumonia and Laboratory Biochemistry Findings: A Retrospective Cross-Sectional Study of 78 Patients from a Single Center in China. Med Sci Monit 2021, 27, e929783. [Google Scholar] [CrossRef]
- Alvares, P.A. SARS-CoV-2 and Respiratory Syncytial Virus Coinfection in Hospitalized Pediatric Patients. Pediatr Infect Dis J 2021, 40, e164–e166. [Google Scholar] [CrossRef]
- Zandi, M.; Soltani, S.; Fani, M.; Abbasi, S.; Ebrahimi, S.; Ramezani, A. Severe acute respiratory syndrome coronavirus 2 and respiratory syncytial virus coinfection in children. Osong Public Health Res Perspect 2021, 12, 286–292. [Google Scholar] [CrossRef]
- Cong, B.; Deng, S.; Wang, X.; Li, Y. The role of respiratory co-infection with influenza or respiratory syncytial virus in the clinical severity of COVID-19 patients: A systematic review and meta-analysis. Journal of Global Health 2022, 12. [Google Scholar] [CrossRef]
- Krumbein, H.; Kümmel, L.S.; Fragkou, P.C.; Thölken, C.; Hünerbein, B.L.; Reiter, R.; Papathanasiou, K.A.; Renz, H.; Skevaki, C. Respiratory viral co-infections in patients with COVID-19 and associated outcomes: A systematic review and meta-analysis. Rev. Med. Virol. 2023, 33. [Google Scholar] [CrossRef]
- Padilha, D.A.; Barazzetti, F.H.; Schörner, M.A.; Grisard, H.B.D.S.; Filho, V.B.; Kawagoe, E.K.; Souza, D.S.M.; Bazzo, M.L.; Wagner, G.; Fongaro, G. Respiratory Viruses Coinfections During the COVID-19 Pandemic in Southern Brazil. COVID 2025, 5, 133. [Google Scholar] [CrossRef]
- Trifonova, I.; Korsun, N.; Madzharova, I.; Alexiev, I.; Ivanov, I.; Levterova, V.; Grigorova, L.; Stoikov, I.; Donchev, D.; Christova, I. Epidemiological and Genetic Characteristics of Respiratory Viral Coinfections with Different Variants of Severe Acute Respiratory Syndrome Coronavirus 2 (SARS-CoV-2). Viruses 2024, 16, 958. [Google Scholar] [CrossRef]
- Pratt, G.W.; Wong, C.L.; Rao, L.V. Prevalence and Co-Detection Rates of SARS-CoV-2, Influenza, and Respiratory Syncytial Virus: A Retrospective Analysis. APMIS: acta pathologica, microbiologica, et immunologica Scandinavica 2025, 133, e70010. [Google Scholar] [CrossRef]
- An, S.H.; Kim, N.Y.; Heo, G.B.; Kang, Y.M.; Lee, Y.J.; Lee, K.N. Development and evaluation of a multiplex real-time RT-PCR assay for simultaneous detection of H5, H7, and H9 subtype avian influenza viruses. Journal of virological methods 2024, 327, 114942. [Google Scholar] [CrossRef]
Figure 1.
Target sequence, primers and probe of the RSV A/B amplification and detection assay (LDT RSV): amplicon, 80 bp.
Figure 1.
Target sequence, primers and probe of the RSV A/B amplification and detection assay (LDT RSV): amplicon, 80 bp.
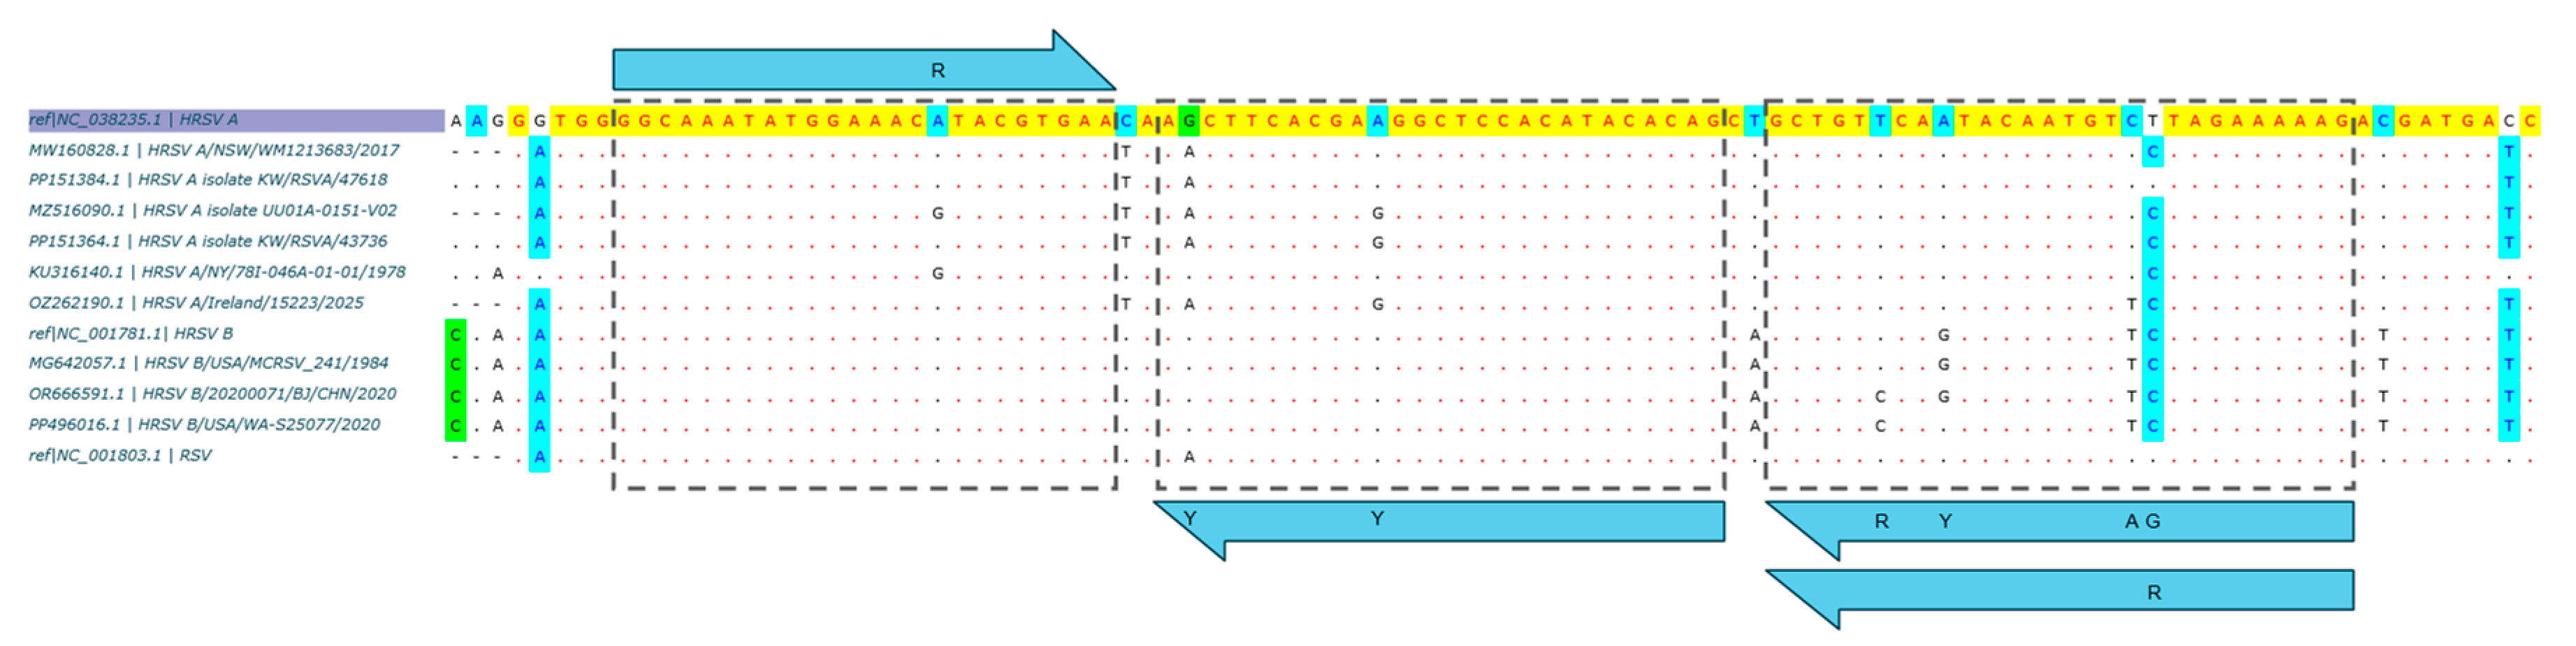
Figure 2.
Amplification efficiency analysis per target in a multiplex setting (LDRA): (a) Linear regression per assay, with error bars (standard deviation) per level; (b) amplification efficiency (E) per target, with its 95% CI and acceptance limits (dashed lines). IAV, influenza A virus; IBV, influenza B virus; SC2, SARS-CoV-2 virus; RSV A, respiratory syncytial virus type A; RSV B, respiratory syncytial virus type B.
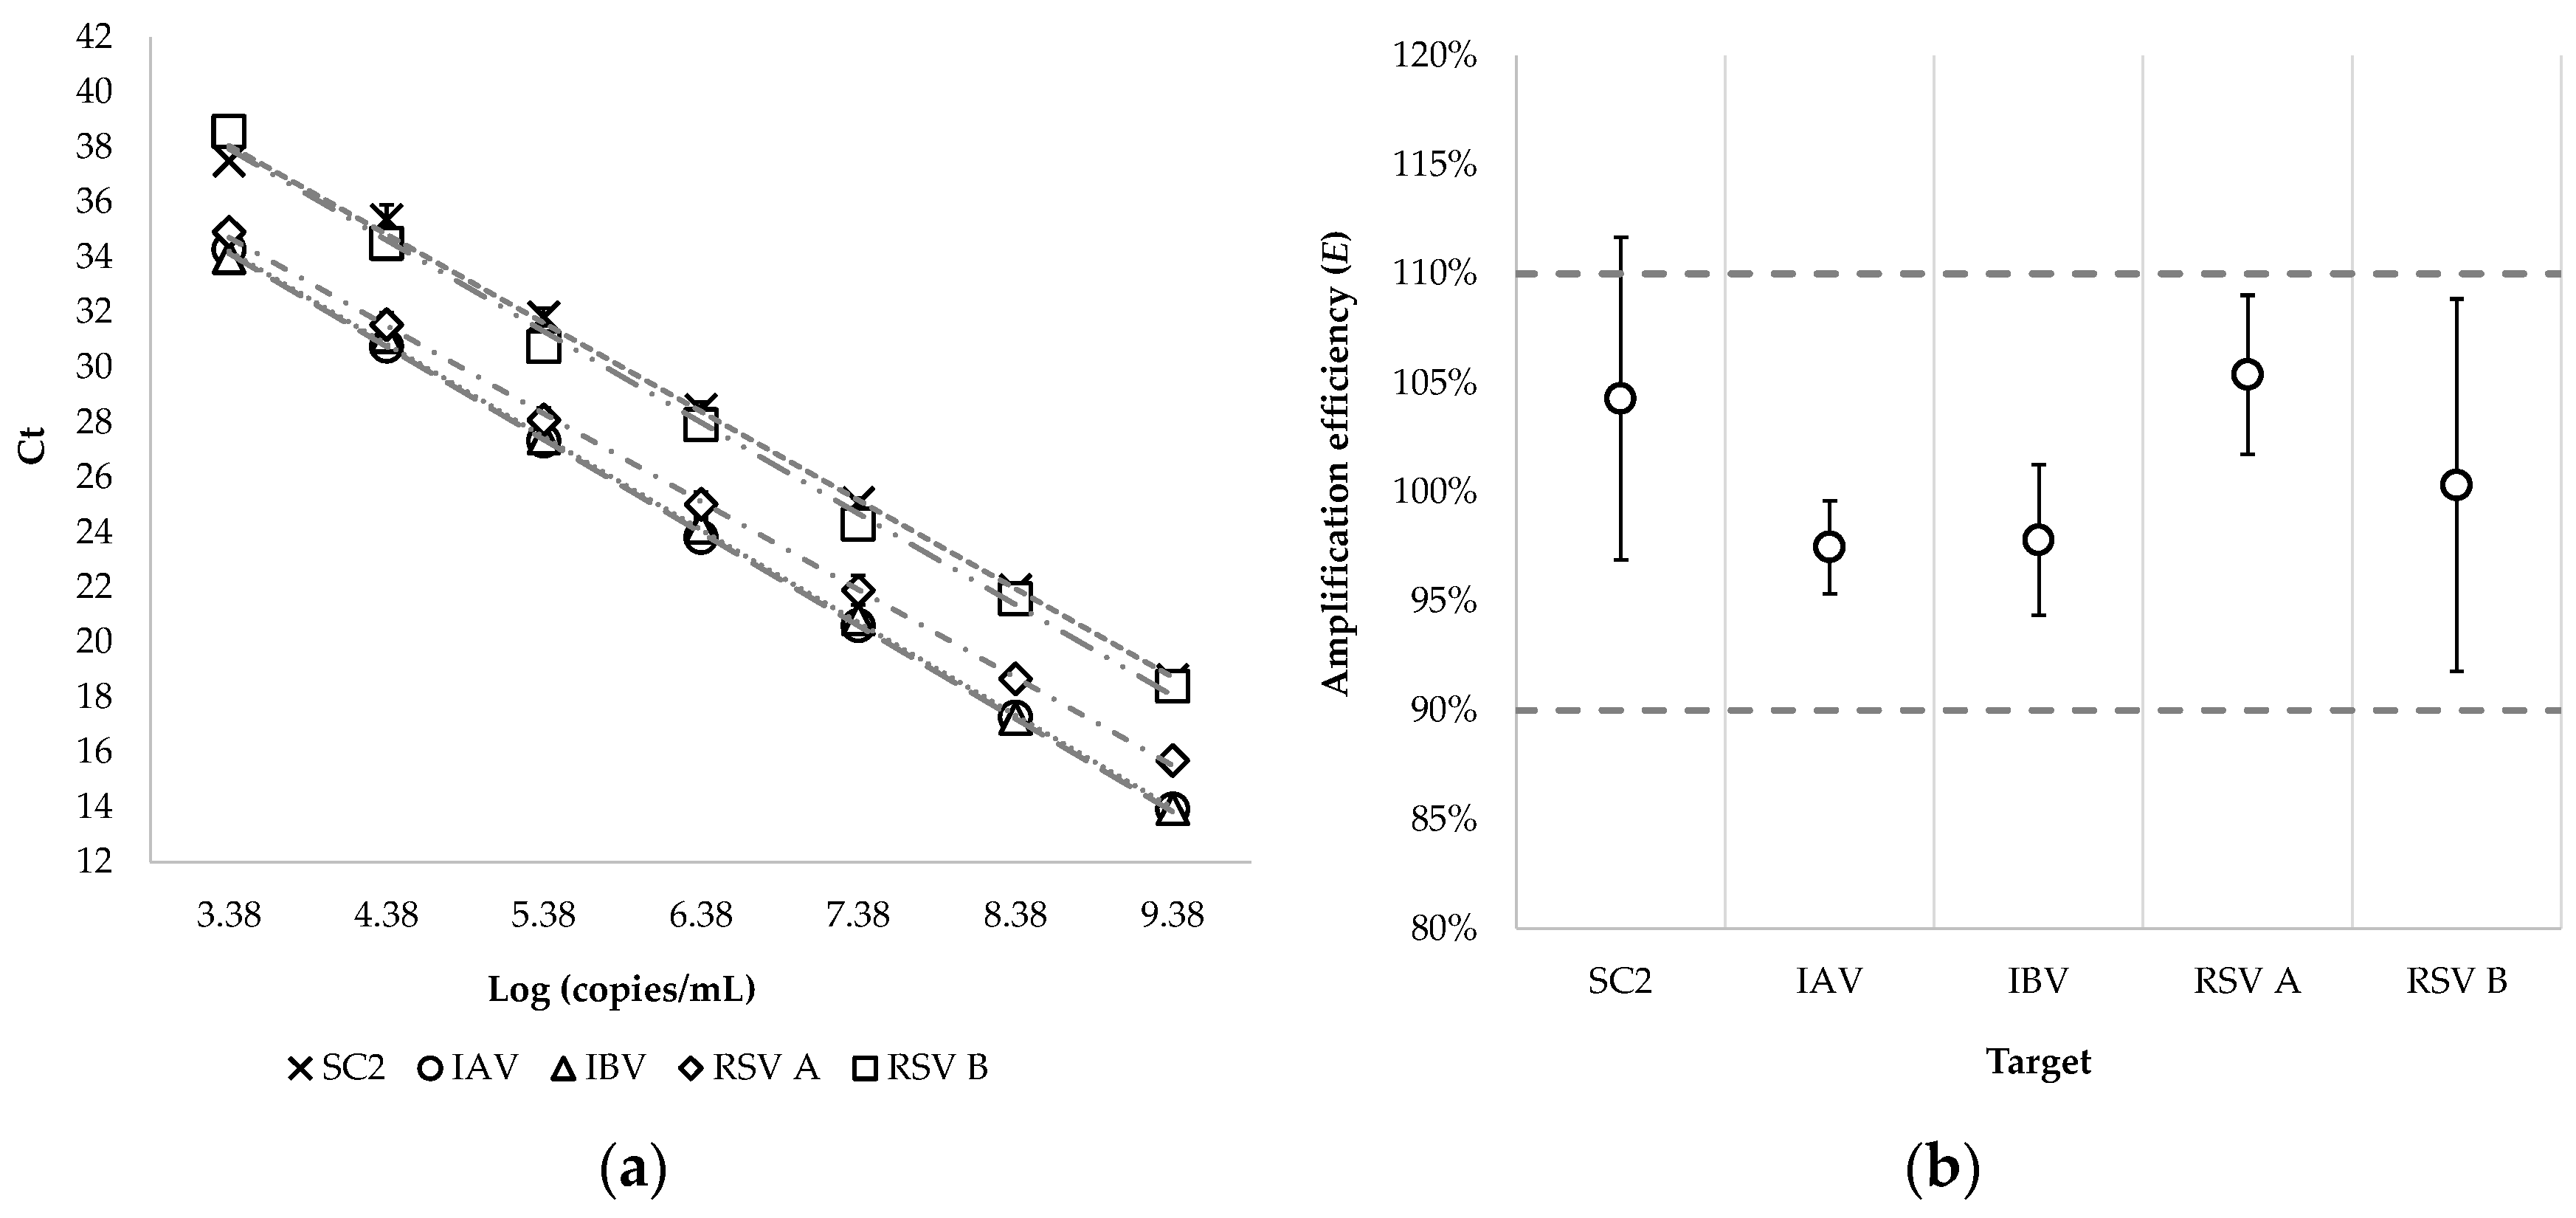
Figure 3.
Probit regression. Estimation of the limit of detection (LoD) of the LDRA in copies/reaction for: (a) influenza A virus; (b) influenza B virus; (c) SARS-CoV-2 virus; (d) respiratory syncytial virus type A; (e) respiratory syncytial virus type B. The red dashed lines intersect at the C95 value (LoD). The solid and dashed gray lines represent the best fit of the probit regression (theoretical frequency) and its 95% CI, respectively. The circles represent the observed frequency.
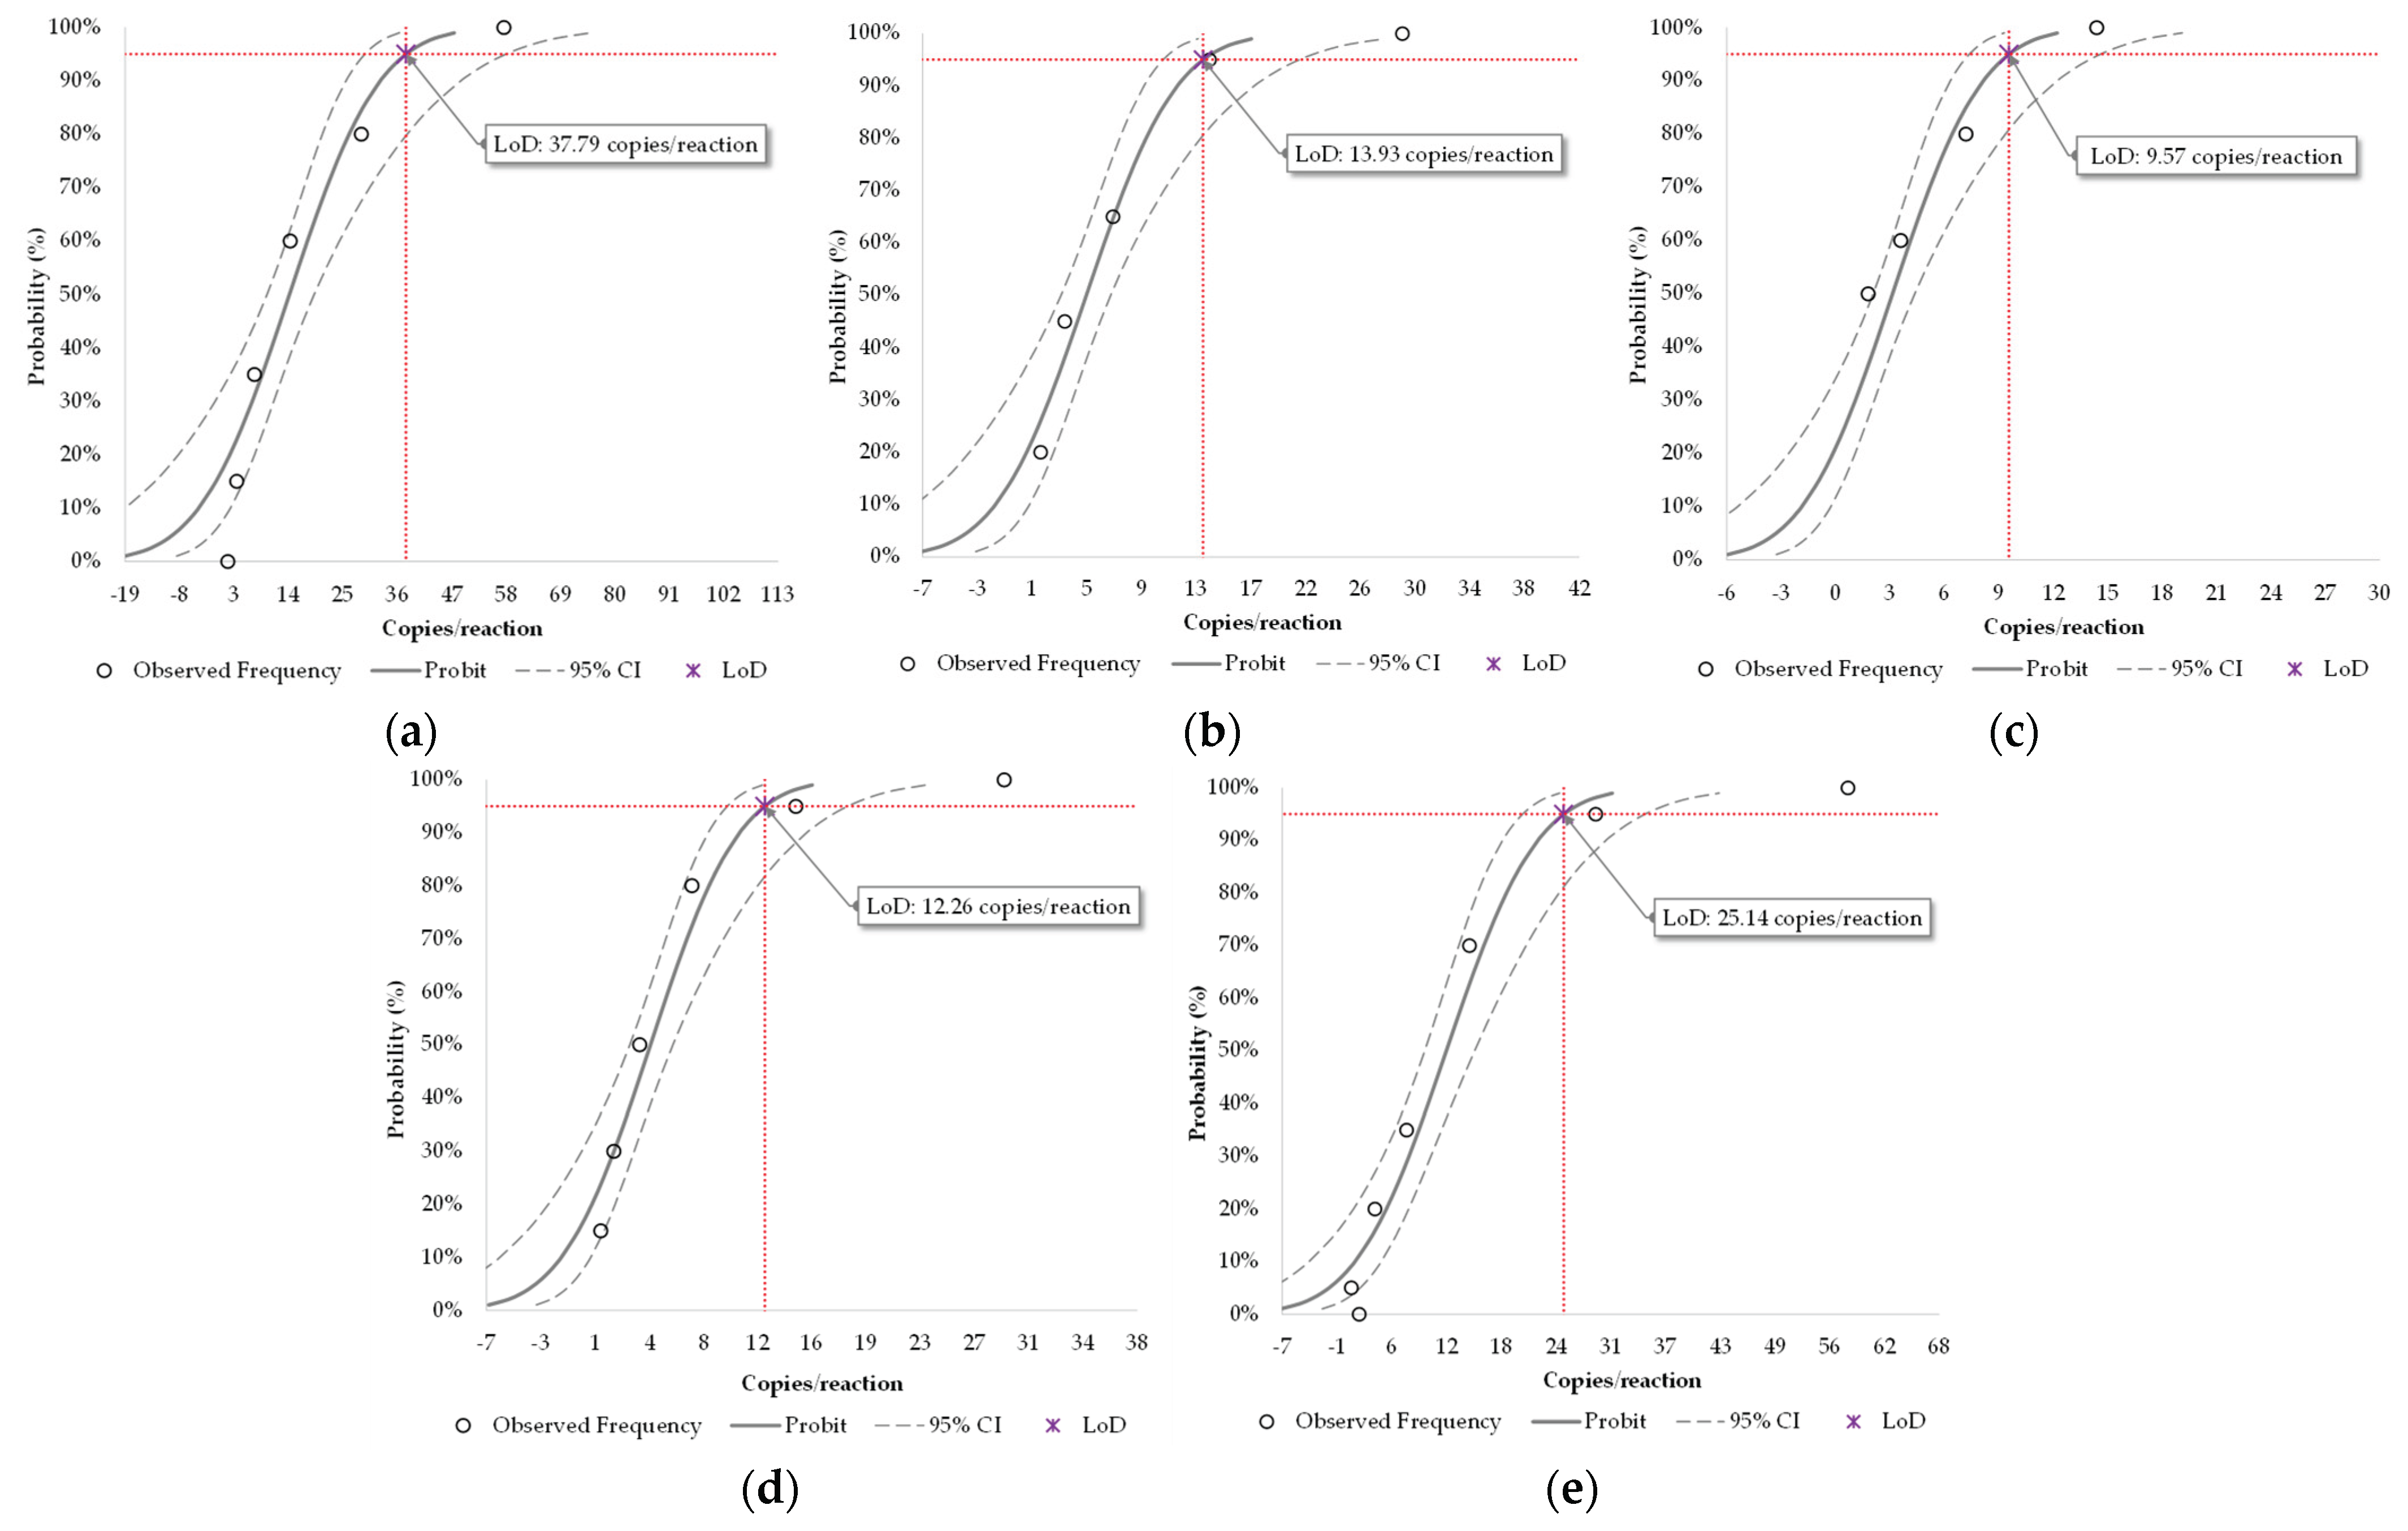
Figure 4.
Laboratory precision of the quadruplex LDRA: (a) Low level; (b) Moderate level. The diamond represents the within-laboratory precision, the square represents the within-run/day precision, and the triangle represents the within-laboratory precision. The error bars represent the 95% confidence interval (95% CI). IAV, influenza A virus; IBV, influenza B virus; SC2, SARS-CoV2 virus; RSV, respiratory syncytial virus.
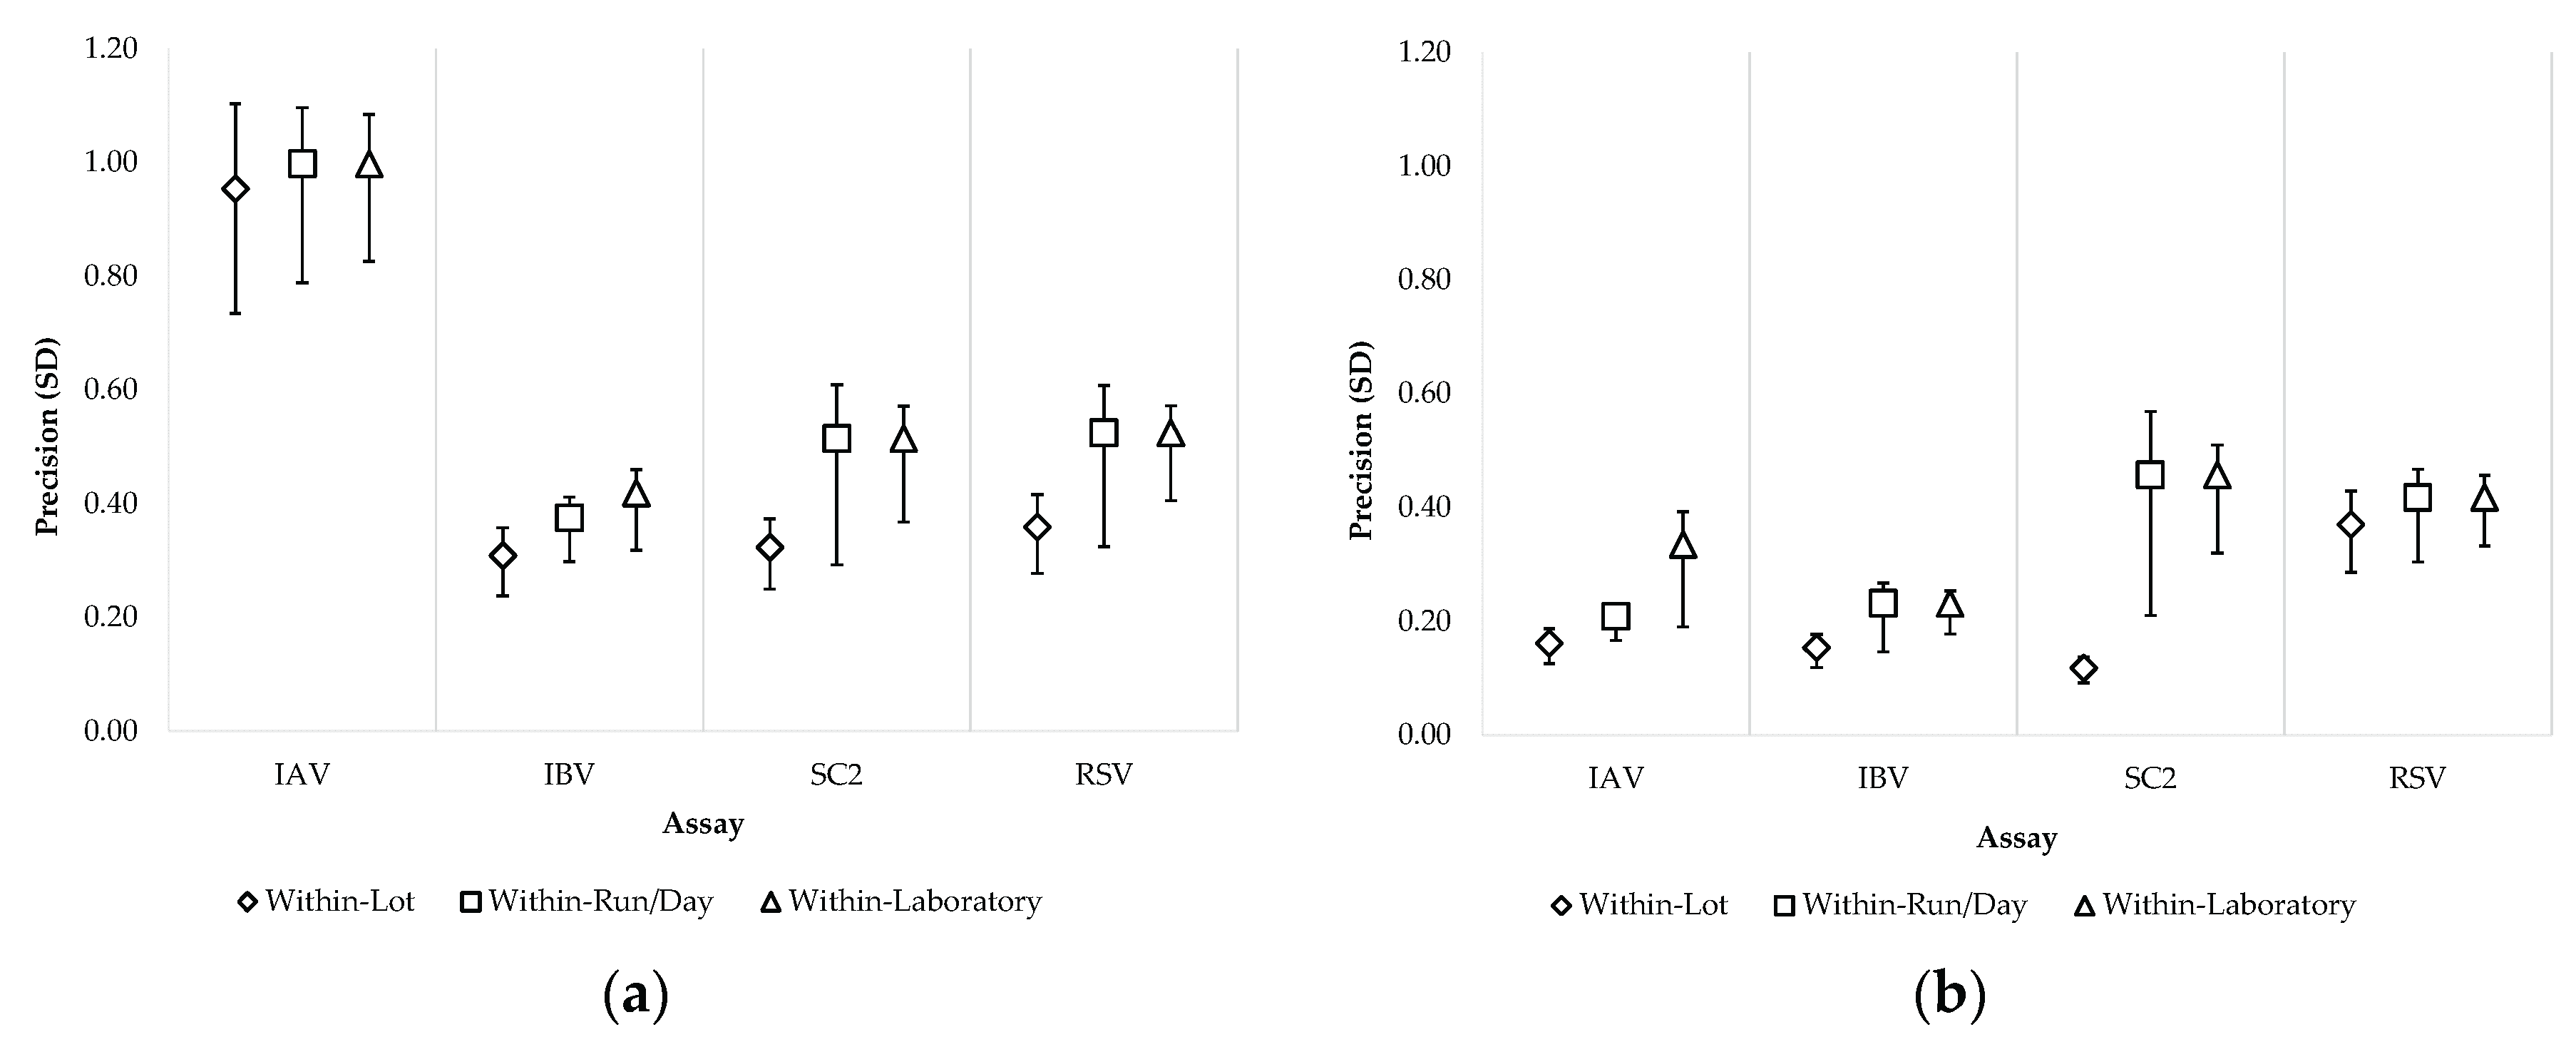

Table 1.
Primers and probes of the quadruplex LDRA.
| Assay_Oligo type | Target gene * | Nucleotide position * | Oligo sequence (5’→3’) | Tm ** (°C) | Amplicon size (nt) | Ref |
|---|---|---|---|---|---|---|
| IAV_fwd1 | M | 143–167 | CAA GAC CAA TCY TGT CAC CTC TGA C | 65.4 # | 106 | [24] |
| IAV_fwd2 | 143–167 | CAA GAC CAA TYC TGT CAC CTY TGA C | 65 # | |||
| IAV_rev1 | 248–226 | GCA TTY TGG ACA AAV CGT CTA CG | 64.3 # | |||
| IAV_rev2 | 248–226 | GCA TTT TGG ATA AAG CGT CTA CG | 62.2 | |||
| IAV_prb 1 | 224–201 | /FAM/TGC AGT CCT /ZEN/ CGC TCA CTG GGC ACG/IABkFQ/ | 73.1 | |||
| IBV_fwd | NS2 | 758–779 | TCC TCA AYT CAC TCT TCG AGC G | 64.7 # | 103 | [24] |
| IBV_rev | 860–840 | CGG TGC TCT TGA CCA AAT TGG | 63.8 | |||
| IBV_prb 2 | 802–828 | /YakYel/CCA ATT CGA /ZEN/ GCA GCT GAA ACT GCG GTG/IABkFQ/ | 70.7 | |||
| SC2_fwd | N | 29,463–29,485 | CTG CAG ATT TGG ATG ATT TCT CC | 61.7 | 92 | [24] |
| SC2_rev | 29,554–29,530 | CCT TGT GTG GTC TGC ATG AGT TTA G | 65.2 | |||
| SC2_prb 3 | 29,491–29,520 | /TexRd-XN/ATT GCA ACA /TAO/ ATC CAT GAG CMG TGC TGA CTC/IAbRQSp/ | 70.9 # | |||
| RSV A/B_fwd | M | 3,226–3,249 | GGC AAA TAT GGA AAC RTA CGT GAA | 62.9 # | 80 | This study |
| RSV A_rev | 3,308–3,281 | CTT TTT CTA RGA CAT TGT ATT GAA CAG C | 62.5 # | |||
| RSV B_rev | 3,308–3,281 | CTT TTT CTA GAA CAT TGT AYT GRA CAG C | 63 # | |||
| RSV A/B_prb 4 | 3,278–3,252 | /CY5/CTG TGT ATG /TAO/ TGG AGC CYT CGT GAA GYT/IAbRQSp/ | 69.2 # | |||
| RNaseP_fwd | Human RNase P | 28–46 | AGA TTT GGA CCT GCG AGC G | 64.4 | 65 | [24] |
| RNaseP_rev | 92–73 | GAG CGG CTG TCT CCA CAA GT | 66.2 | |||
| RNaseP_prb 5 | 49–71 | /CY5.5/TTC TGA CCT GAA GGC TCT GCG CG/IAbRQSp/ | 70 |
Nucleotide positions are indicated as location in the sequences for the Matrix (M) gene (Genbank accession number NC_026431.1) of influenza A virus (IAV), Nonstructural protein (NS2) gene (Genbank accession number NC_002211.1) of influenza B virus (IBV), Nucleocapsid (N) gene (Genbank accession number NC_045512.2) of SARS-CoV-2 (SC2), M gene (Genbank accession number NC_001803.1) of respiratory syncytial virus (RSV), or human ribonuclease P (RNase P) gen, subunit p30 (Genbank accession number NM_004613.4). ** Melting temperature ™ was estimated using OligoAnalyzer (Integrated DNA Technologies, IA, USA) according to the SantaLucia (1998) algorithm, assuming: concentration of oligos, 200 nM; concentration of divalent ions, 3 mM; concentration of monovalent ions, 50 mM; and concentration of deoxyribonucleoside triphosphate (dNTP), 0.8 mM. # Indicates average Tm for oligos containing degenerate nucleotides. 1 Probe labeled at the 5’-end with the reporter molecule 6-carboxyfluorescein (FAM), with a ZEN™ quencher between the 9th and 10th nucleotide, and with an Iowa Black FQ quencher (IABkFQ) at the 3’-end (Integrated DNA Technologies, IA, USA). 2 Probe labeled at the 5’-end with the Yakima Yellow (YakYel) reporter, with a ZEN™ quencher between the 9th and 10th nucleotide, and with an Iowa Black FQ quencher (IABkFQ) at the 3’-end. 3 Probe labeled at the 5′-end with the Texas Red-XN (TexRd-XN) reporter, with a TAO quencher between the 9th and 10th nucleotide, and with an Iowa Black RQ quencher (IAbRQSp) at the 3′-end (Integrated DNA Technologies, IA, USA). The modification of the probe is highlighted in bold and underlined (M for A). 4 Probe labeled at the 5’-end with the Cyanine 5 (Cy5) reporter, with a TAO quencher between the 9th and 10th nucleotide, and with an Iowa Black RQ quencher (IAbRQSp) at the 3’-end. 5 Probe labeled at the 5’-end with the Cyanine 5.5 (Cy5.5) reporter between the 9th and 10th nucleotide, and with an Iowa Black RQ quencher (IAbRQSp) at the 3’-end. fwd, forward primer; rev, reverse primer; prb, probe; Ref, bibliographic references.
Table 2.
Optimized PPR for the quadruplex LDRA.
| Reagent | Concentration | Volume | |||
|---|---|---|---|---|---|
| Stock/Working | Reaction (PCR) | PPR (1.25x) |
Unitarian 1 | PPR (40 tests) 2 |
|
| Water, PCR grade | n/a | n/a | n/a | 13.04 µL | 782.25 µL |
| K+ | 1 M | 75 mM | 93.75 mM | 1.88 µL | 112.5 µL |
| Mg++ | 1 M | 4 mM | 5 mM | 0.1 µL | 6 µL |
| TRIS | 1 M | 8 mM | 10 mM | 0.2 µL | 12 µL |
| IAV_fwd1 | 100 µM | 0.4 µM | 0.5 µM | 0.1 µL | 6 µL |
| IAV_fwd2 | 100 µM | 0.4 µM | 0.5 µM | 0.1 µL | 6 µL |
| IAV_rev1 | 100 µM | 0.6 µM | 0.75 µM | 0.15 µL | 9 µL |
| IAV_rev2 | 100 µM | 0.2 µM | 0.25 µM | 0.05 µL | 3 µL |
| IAV_prb | 100 µM | 0.2 µM | 0.25 µM | 0.05 µL | 3 µL |
| IBV_fwd | 100 µM | 0.8 µM | 1 µM | 0.2 µL | 12 µL |
| IBV_rev | 100 µM | 0.8 µM | 1 µM | 0.2 µL | 12 µL |
| IBV_prb | 100 µM | 0.4 µM | 0.5 µM | 0.1 µL | 6 µL |
| SC2_fwd | 100 µM | 0.8 µM | 1 µM | 0.2 µL | 12 µL |
| SC2_rev | 100 µM | 0.8 µM | 1 µM | 0.2 µL | 12 µL |
| SC2_prb | 100 µM | 0.2 µM | 0.25 µM | 0.05 µL | 3 µL |
| RSV A/B_fwd | 100 µM | 0.8 µM | 1 µM | 0.2 µL | 12 µL |
| RSV A_rev | 100 µM | 0.8 µM | 1 µM | 0.2 µL | 12 µL |
| RSV B_rev | 100 µM | 0.8 µM | 1 µM | 0.2 µL | 12 µL |
| RSV A/B_prb | 100 µM | 0.4 µM | 0.5 µM | 0.1 µL | 6 µL |
| RNaseP_fwd | 100 µM | 0.3 µM | 0.38 µM | 0.08 µL | 4.5 µL |
| RNaseP_rev | 100 µM | 0.3 µM | 0.38 µM | 0.08 µL | 4.5 µL |
| RNaseP_prb | 100 µM | 0.15 µM | 0.19 µM | 0.04 µL | 2.25 µL |
| Betaine | 5 M | 0.5 M | 0.63 M | 2.5 µL | 150 µL |
| Total volume | n/a | n/a | n/a | 20 µL | 1,200 µL |
1 An amplification volume of 25 µL is assumed: 20 µL of PPR in a lyophilized enzyme well (master mix or MMX) + 5 µL of DNA template (eluate). 2 A PPR volume of 1,200 µL yields 40 tests on the Panther Fusion® system (excluding the dead volume) and requires 400 µL of Oil Reagent (Hologic, CA, USA).
Table 3.
Amplification efficiency analysis per target in a multiplex setting (LDRA).
| Target | R2 * | Slope (95% CI) | E** (95% CI) | ||
|---|---|---|---|---|---|
| IAV | 0.9998 | -3.38 | (-3.44–-3.33) | 97% | (95.3–99.7%) |
| IBV | 0.9995 | -3.38 | (-3.47–-3.29) | 98% | (94.3–101.5%) |
| SC2 | 0.9978 | -3.22 | (-3.4–-3.05) | 104% | (96.9–112.8%) |
| RSV A | 0.9995 | -3.20 | (-3.28–-3.12) | 105% | (101.7–109.3%) |
| RSV B | 0.9966 | -3.31 | (-3.54–-3.09) | 100% | (91.8–110.6%) |
* Goodness of fit. ** Amplification efficiency. IAV, influenza A virus; IBV, influenza B virus; SC2, SARS-CoV-2 virus; RSV A, respiratory syncytial virus type A; RSV B, respiratory syncytial virus type B.
Table 4.
Hit rate by dilution level for the analytical sensitivity evaluation panel of the quadruplex LDRA assay.
Table 4.
Hit rate by dilution level for the analytical sensitivity evaluation panel of the quadruplex LDRA assay.
| Level | Concentration | Observed Frequency (Hit Rate) | ||||||||||
|---|---|---|---|---|---|---|---|---|---|---|---|---|
| copies/mL 1 | copies/reaction | IAV | IBV | SC2 | RSV A | RSV B | ||||||
| 1 | 15,488 | 230.4 | 20/20 | (100%) | 20/20 | (100%) | 20/20 | (100%) | 20/20 | (100%) | 20/20 | (100%) |
| 2 | 7,744 | 115.2 | 20/20 | (100%) | 20/20 | (100%) | 20/20 | (100%) | 20/20 | (100%) | 20/20 | (100%) |
| 3 | 3,872 | 57.6 | 20/20 | (100%) | 20/20 | (100%) | 20/20 | (100%) | 20/20 | (100%) | 20/20 | (100%) |
| 4 | 1,936 | 28.8 | 16/20 | (80%) | 20/20 | (100%) | 20/20 | (100%) | 20/20 | (100%) | 19/20 | (95%) |
| 5 | 968 | 14.4 | 12/20 | (60%) | 19/20 | (95%) | 20/20 | (100%) | 19/20 | (95%) | 14/20 | (70%) |
| 6 | 484 | 7.2 | 7/20 | (35%) | 13/20 | (65%) | 16/20 | (80%) | 16/20 | (80%) | 7/20 | (35%) |
| 7 | 242 | 3.6 | 3/20 | (15%) | 9/20 | (45%) | 12/20 | (60%) | 10/20 | (50%) | 4/20 | (20%) |
| 8 | 121 | 1.8 | 0/20 | (0%) | 4/20 | (20%) | 10/20 | (50%) | 6/20 | (30%) | 0/20 | (0%) |
1 Concentration of the target sequence in the primary sample (UTM), before mixing with SLM. IAV, influenza A virus; IBV, influenza B virus; SC2, SARS-CoV-2 virus; RSV A, respiratory syncytial virus type A; RSV B, respiratory syncytial virus type B.
Table 5.
Limit of detection (LoD) of the LDRA assay per target sequence/pathogen.
| Pathogen | LoD (95% CI) | |||
|---|---|---|---|---|
| copies/mL 1 | copies/reaction | |||
| IAV | 2,541 | (1,981–3,899) | 37.8 | (29.5–58.0) |
| IBV | 936 | (736–1,420) | 13.9 | (11.0–21.1) |
| SC2 | 643 | (496–982) | 9.6 | (7.4–14.6) |
| RSV A | 824 | (648–1,208) | 12.3 | (9.6–18.0) |
| RSV B | 1,690 | (1,374–2,313) | 25.1 | (20.4–34.4) |
1 Concentration of the target sequence in the primary sample (UTM), before mixing with SLM. IAV, influenza A virus; IBV, influenza B virus; SC2, SARS-CoV-2 virus; RSV A, respiratory syncytial virus type A; RSV B, respiratory syncytial virus type B.
Table 6.
Analytical specificity: cross-reactivity of the LDRA assay.
| Pathogen | Variant, Subtype, Lineage or Strain |
Source | Result | |||
|---|---|---|---|---|---|---|
| IAV | IBV | SC2 | RSV | |||
| Adenovirus 1 | n/a | NATRVP 2.1 | – | – | – | – |
| Adenovirus 3 | n/a | – | – | – | – | |
| Adenovirus 31 | n/a | – | – | – | – | |
| Bordetella parapertussis | A747 | – | – | – | – | |
| Bordetella pertussis | A639 | – | – | – | – | |
| Chlamydia pneumoniae | CWL-029 | – | – | – | – | |
| Coronavirus 229E | n/a | – | – | – | – | |
| Coronavirus HKU-1 | n/a | – | – | – | – | |
| Coronavirus NL63 | n/a | – | – | – | – | |
| Coronavirus OC43 | n/a | – | – | – | – | |
| Influenza A | A/NY/02/09 (H1N1pdm09) | + | – | – | – | |
| Influenza B | B/Florida/02/06 (Victoria) | – | + | – | – | |
| Mycoplasma pneumoniae | M129 | – | – | – | – | |
| Metapneumovirus 8 | Peru6-2003 | – | – | – | – | |
| Parainfluenza 1 | n/a | – | – | – | – | |
| Parainfluenza 2 | n/a | – | – | – | – | |
| Parainfluenza 3 | n/a | – | – | – | – | |
| Parainfluenza 4 | n/a | – | – | – | – | |
| Rhinovirus 1A | n/a | – | – | – | – | |
| RSV A | n/a | – | – | – | + | |
| SARS-CoV-2 | USA-WA1/2020 | – | – | + | – | |
| Adenovirus 14 | n/a | RTX1-5QC | – | – | – | – |
| Enterovirus A16 | n/a | – | – | – | – | |
| Enterovirus 68 | n/a | – | – | – | – | |
| Metapneumovirus A2 | n/a | – | – | – | – | |
| Rhinovirus 16 | n/a | – | – | – | – | |
| Adenovirus A | n/a | IDR-C 2024 | – | – | – | – |
| Enterovirus A71 | n/a | IDR-A 2023 | – | – | – | – |
| Legionella pneumophila | Philadelphia Group 1 | – | – | – | – | |
| Metapneumovirus B2 | n/a | – | – | – | – | |
NATRVP 2.1, NATtrol Respiratory Verification Panel 2.1; RTX1-5QC, Respiratory Multiplex (1 to 5) Q Control; EQA, external quality assessment; CAP, College of American Pathologist; IDR, CAP Infectious Disease, Respiratory EQA Programme.
Table 7.
Analytical specificity: in vitro inclusivity of the LDRA assay.
| Pathogen | Variant, Subtype, Lineage or Strain |
Source | Result | |||
|---|---|---|---|---|---|---|
| IAV | IBV | SC2 | RSV | |||
| Influenza A | A/NY/02/09 (H1N1pdm09) | NATRVP 2.1 | + | – | – | – |
| A/NewCaledonia/20/99 (H1N1sea) | + | – | – | – | ||
| A/Brisbane/10/07 (H3N2) | + | – | – | – | ||
| A/Brisbane/02/2018 (H1N1pdm09) | IDR-A 2023 | + | – | – | – | |
| A/HongKong/2671/2019 (H3N2) | IDR-B 2023 | + | – | – | – | |
| A/Victoria/2570/2019 (H1N1pdm09) | ID3-C 2024 | + | – | – | – | |
| A/Cambodia/e0826360/2020 (H3N2) | ID3-A 2024 | + | – | – | – | |
| A/Kansas/14/2017 (H3N2) | ID3-B 2023 | + | – | – | – | |
| A/Netherlands/1250/2016 (H1N1pdm09) | INFTP24 | + | – | – | – | |
| A/Hong Kong/213/2003 (H5N1) | + | – | – | – | ||
| A/Netherlands/398/2014 (H3N2) | + | – | – | – | ||
| A/Netherlands/2393/2015 (H3N2) | + | – | – | – | ||
| A/Mallard/Netherlands/2/2009 (H7N7) | + | – | – | – | ||
| A/NIBRG-14 (H5N1) * | ASRC | + | – | – | – | |
| A/Brisbane/59/2007 (H1N1sea) | + | – | – | – | ||
| A/Perth/16/2009 (H3N2) | + | – | – | – | ||
| A/cattle/Texas/56283/2024 (H5N1) | APLH5N1 | + | – | – | – | |
| Influenza B | B/Florida/02/06 (Victoria) | NATRVP 2.1 | – | + | – | – |
| B/Washington/02/2019 (Victoria) | ID3-A 2024 | – | + | – | – | |
| B/Brisbane/60/2008 (Yamagata) | ATSFR | – | + | – | – | |
| B/Phuket/3073/2013 (Yamagata) | ID3-B 2024 | – | + | – | – | |
| SARS-CoV-2 | B.1.1.7 (Alpha) | ASRC | – | – | + | – |
| B.1.351 (Beta) | – | – | + | – | ||
| P.1 (Gamma) | – | – | + | – | ||
| B.1.617.2 (Delta) | – | – | + | – | ||
| BA.1 (Omicron) | – | – | + | – | ||
| A (USA-WA1/2020) | ID3-A 2024 | – | – | + | – | |
| B (Italy-INMI1/2020) | ID3-B 2024 | – | – | + | – | |
| RSV | n/a (Type A) | NATRVP 2.1 | – | – | – | + |
| RTX1QC | – | – | – | + | ||
| ID3-A 2024 | – | – | – | + | ||
| n/a (Type B) | RTX5QC | – | – | – | + | |
| IDR-B 2024 | – | – | – | + | ||
| 4/2015 (Type B) | IDR-B 2023 | – | – | – | + | |
| 9320 (Type B) | ATSFR | – | – | – | + | |
* A/reassortant/NIBRG-14 (Viet Nam/1194/2004 x Puerto Rico/8/1934). H1N1sea, seasonal H1N1; H1N1pdm09, H1N1 derived from the 2009 pandemic; NATRVP 2.1, NATtrol Respiratory Verification Panel 2.1; EQA, external quality assessment; CAP, College of American Pathologist; QCMD, Quality Control for Molecular Diagnostics; INFTP24, QCMD 2024 Influenza Typing EQA Programme; APLH5N1, AccuPlex™ H5N1 Influenza Reference Material Kit; IDR, CAP Infectious Disease, Respiratory EQA Programme; ID3, CAP Nucleic Acid Amp, Respiratory Ltd EQA Programme; ATSFR, Amplirun® Total SARS-CoV-2/FluA/FluB/RSV Control (Swab); ASRC, Amplirun® SARS-CoV-2 RNA Controls; RTX#QC, Respiratory Multiplex (1 to 5) Q Control.
Table 8.
LDRA assay variability.
| Member panel | Content | Pathogen | Level | Agreed/n | Agreement | Mean Ct | Within Lot |
Between Lot |
Between Instrument |
Between Run/Day |
Within Run/Day |
Within Laboratory (Total) |
||||||
|---|---|---|---|---|---|---|---|---|---|---|---|---|---|---|---|---|---|---|
| SD (95% CI) |
CV | SD (95% CI) |
CV | SD (95% CI) |
CV | SD (95% CI) |
CV | SD (95% CI) |
CV | SD (95% CI) |
CV | |||||||
| 1 | Neg | n/a | n/a | 112/112 | 100% | n/a | n/a | n/a | n/a | n/a | n/a | n/a | n/a | n/a | n/a | n/a | n/a | n/a |
| 2 | IAV/SC2 | IAV | Mod | 112/112 | 100% | 27.93 | 0.16 | 0.6% | 0.13 | 0.5% | 0 | 0% | 0.26 | 0.9% | 0.21 | 0.7% | 0.33 | 1.2% |
| (0.14–0.2) | (0.07–0.21) | (0–0.12) | (0.18–0.43) | (0.19–0.25) | (0.28–0.48) | |||||||||||||
| SC2 | Low | 112/112 | 100% | 34-40 | 0.32 | 0.9% | 0 | 0% | 0.4 | 1.2% | 0 | 0% | 0.51 | 1.15% | 0.51 | 1.5% | ||
| (0.27–0.4) | (0–0.21) | (0.27–0.66) | (0–0.33) | (0.42–0.74) | (0.46–0.66) | |||||||||||||
| 3 | SC2/IAV | IAV | Low | 111/112 1 | 99.1% | 34.84 | 0.95 | 2.7% | 00 | 0% | 0.3 | 0.8% | 0 | 0% | 1 | 2.9% | 1 | 2.9% |
| (0.8–1.17) | (0–0.55) | (0–0.68) | (0–0.43) | (0.9–1.21) | (0.91–1.17) | |||||||||||||
| SC2 | Mod | 112/112 | 100% | 25.49 | 0.12 | 0.5% | 0.1 | 0.4% | 0.43 | 1.7% | 0 | 0% | 0.46 | 1.8% | 0.46 | 1.8% | ||
| (0.1–0.14) | (0.06–0.16) | (0.31–0.69) | (0–0.22) | (0.35–0.7) | (0.4–0.59) | |||||||||||||
| 4 | IBV/RSV | IBV | Mod | 112/112 | 100% | 25.30 | 0.15 | 0.6% | 0.1 | 0.4% | 0.14 | 0.5% | 0 | 0% | 0.23 | 0.9% | 0.23 | 0.9% |
| (0.13–0.19) | (0.03–0.17) | (0.05–0.25) | (0–0.12) | (0.2–0.32) | (0.21–0.29) | |||||||||||||
| RSV | Low | 111/112 1 | 99.1% | 34.72 | 0.36 | 1% | 0.17 | 0.5% | 0.34 | 1% | 0 | 0% | 0.52 | 1.5% | 0.52 | 1.5% | ||
| (0.3–0.44) | (0–0.33) | (0.18–0.6) | (0–0.24) | (0.44–0.72) | (0.48–0.64) | |||||||||||||
| 5 | RSV/IBV | IBV | Low | 111/112 2 | 99.1% | 32.21 | 0.31 | 1% | 0.21 | 0.7% | 0 | 0% | 0.19 | 0.6% | 0.38 | 1.2% | 0.42 | 1.3% |
| (0.26–0.38) | (0.05–0.35) | (0–0.22) | (0.06–0.34) | (0.34–0.45) | (0.38–0.52) | |||||||||||||
| RSV | Mod | 111/112 2 | 99.1% | 26.07 | 0.37 | 1.4% | 0.12 | 0.5% | 0.15 | 0.6% | 0 | 0% | 0.42 | 1.6% | 0.42 | 1.6% | ||
| (031–0.46) | (0–0.29) | (0–0.34) | (0–0.2) | (0.37–0.53) | (0.38–0.5) | |||||||||||||
1 Outlier. 2 Invalid result by system error. n, total number of replicates; SD, standard deviation; CV, coefficient of variation; 95% CI, 95% confidence interval; Neg, negative; IAV, influenza A virus; IBV, influenza B virus; SC2, SARS-CoV2 virus; RSV, respiratory syncytial virus; Mod, moderate level.
Table 9.
Method agreement.
| Comparator RT-qPCR Assay | Target | Candidate RT-qPCR Assay: LDRA | n | NPA (95% CI) |
PPA (95% CI) |
OPA (95% CI) |
k (95% CI) |
||
|---|---|---|---|---|---|---|---|---|---|
| + | – | ||||||||
| PFRA | IAV | + | 65 | 0 | 405 | 100% | 100% | 100% | 1.000 |
| – | 0 | 340 | (98.9–100%) | (94.4–100%) | (99.1–100%) | (1.000–1.000) | |||
| IBV | + | 79 | 0 | 405 | 100% | 100% | 100% | 1.000 | |
| – | 0 | 326 | (98.8–100%) | (95.4–100%) | (99.1–100%) | (1.000–1.000) | |||
| SC2 | + | 88 * | 4 | 405 | 100% | 95.7% | 99.0% | 0.971 | |
| – | 0 | 313 | (98.8–100%) | (89.3–98.3%) | (97.5–99.6%) | (0.944–0.999) | |||
| RSV | + | 111 | 1 | 405 | 100% | 99.1% | 99.8% | 0.994 | |
| – | 0 | 293 | (98.7–100%) | (95.1–99.8%) | (98.6–100%) | (0.982–1.000) | |||
| APRA | IAV | + | 64 | 0 | 405 | 99.7% | 100% | 99.8% | 0.991 |
| – | 1 | 340 | (98.4–99.9%) | (94.3–100%) | (98.6–100%) | (0.973–1.000) | |||
| IBV | + | 78 | 0 | 405 | 99.7% | 100% | 99.8% | 0.992 | |
| – | 1 | 326 | (98.3–99.9%) | (95.3–100%) | (98.6–100%) | (0.977–1.000) | |||
| SC2 | + | 88 * | 0 | 405 | 100% | 100% | 100% | 1.000 | |
| – | 0 | 317 | (98.8–100%) | (95.8–100%) | (99.1–100%) | (1.000–1.000) | |||
| RSV | + | 110 | 0 | 405 | 99.7% | 100% | 99.8% | 0.994 | |
| – | 1 | 294 | (98.1–99.9%) | (96.6–100%) | (98.6–100%) | (0.982–1.000) | |||
* One of the samples was considered consistently positive for SC2, even though differences in the frequency of hit rates were found when analyzing six replicates of the same sample: 2 out of 6 using LDRA, 3 out of 6 using PFRA, and 6 out of 6 using APRA (positivity only for the SC2 S gene). LDRA, laboratory-developed respiratory assay (CDC Flu-SC2 + LDT RSV); PFRA, Panther Fusion® SARS-CoV-2/Flu A/B/RSV assay; APRA, Allplex™ SARS-CoV-2/FluA/FluB/RSV assay; IAV, influenza A virus; IBV, influenza B virus; SC2, SARS-CoV2 virus; RSV, respiratory syncytial virus; n, total number of samples; NPA, negative percent agreement; PPA, positive percent agreement; OPA, overall percent agreement; k, k-index; 95% CI, 95% confidence interval.
Table 10.
Diagnostic performance parameters.
| RT-qPCR Assay |
Target | TP | FP | FN | TN | n | PR (95% CI) |
dSens (95% CI) |
dSpec (95% CI) |
PPV (95% CI) |
NPV (95% CI) |
|---|---|---|---|---|---|---|---|---|---|---|---|
| LDRA | IAV | 65 | 0 | 0 | 340 | 405 | 16.0% | 100% | 100% | 100% | 100% |
| (12.8–19.9%) | (94.4–100%) | (98.9–100%) | (94.5–100%) | (98.9–100%) | |||||||
| IBV | 79 | 0 | 0 | 326 | 405 | 19.5% | 100% | 100% | 100% | 100% | |
| (15.9–23.6%) | (95.4–100%) | (98.8–100%) | (95.4–100%) | (98.9–100%) | |||||||
| SC2 | 88 | 0 | 0 | 317 | 405 | 21.7% | 100% | 100% | 100% | 100% | |
| (18.0–26.0%) | (95.8–100%) | (98.8–100%) | (95.9–100%) | (98.8–100%) | |||||||
| RSV | 111 | 0 | 0 | 294 | 405 | 27.4% | 100% | 100% | 100% | 100% | |
| (23.3–32.0%) | (96.7–100%) | (98.7–100%) | (96.7–100%) | (98.8–100%) | |||||||
| PFRA | IAV | 65 | 0 | 0 | 340 | 405 | 16.0% | 100% | 100% | 100% | 100% |
| (12.8–19.9%) | (94.4–100%) | (98.9–100%) | (94.5–100%) | (98.9–100%) | |||||||
| IBV | 79 | 0 | 0 | 326 | 405 | 19.5% | 100% | 100% | 100% | 100% | |
| (15.9–23.6%) | (95.4–100%) | (98.8–100%) | (95.4–100%) | (98.9–100%) | |||||||
| SC2 | 88 | 4 | 0 | 313 | 405 | 22.7% | 100% | 98.7% | 95.7% | 100% | |
| (18.9–27.0%) | (95.8–100%) | (96.8–99.5%) | (89.3–98.3%) | (98.8–100%) | |||||||
| RSV | 111 | 1 | 0 | 293 | 405 | 27.7% | 100% | 99.7% | 99.1% | 100% | |
| (23.5–32.2%) | (96.7–100%) | (98.1–99.9%) | (94.0–99.9%) | (98.8–99.9%) | |||||||
| APRA | IAV | 64 | 0 | 1 | 340 | 405 | 15.8% | 98.5% | 100% | 100% | 99.7% |
| (12.6–19.7%) | (91.8–99.7%) | (98.9–100%) | (94.4–100%) | (98.0–100%) | |||||||
| IBV | 78 | 0 | 1 | 326 | 405 | 19.3% | 98.7% | 100% | 100% | 99.7% | |
| (15.7–23.4%) | (93.2–99.8%) | (98.8–100%) | (95.4–100%) | (97.9–100%) | |||||||
| SC2 | 88 | 0 | 0 | 317 | 405 | 21.7% | 100% | 100% | 100% | 100% | |
| (18.0–26.0%) | (95.8–100%) | (98.8–100%) | (95.9–100%) | (98.8–100%) | |||||||
| RSV | 110 | 0 | 1 | 294 | 405 | 27.2% | 99.1% | 100% | 100% | 99.7% | |
| (23.1–31.7%) | (95.1–99.8%) | (98.7–100%) | (96.7–100%) | (97.7–100%) |
LDRA, laboratory-developed respiratory assay (CDC Flu-SC2 + LDT RSV); PFRA, Panther Fusion® SARS-CoV-2/Flu A/B/RSV assay; APRA, Allplex™ SARS-CoV-2/FluA/FluB/RSV assay; IAV, influenza A virus; IBV, influenza B virus; SC2, SARS-CoV2 virus; RSV, respiratory syncytial virus; TP, true positive; FP, false positive; FN, false negative; TN, true negative; n, total number of samples; PR, positive rate; dSens, diagnostic sensitivity; dSpec, diagnostic specificity; PPV, positive predictive value; NPV, negative predictive value; 95% CI, 95% confidence interval.
Table 11.
RT-qPCR assay capability comparison for detecting mixed infections.
| RT-qPCR Assay |
Consensus | n | SinPA (95% CI) |
MixPA (95% CI) |
OPA (95% CI) |
k (95% CI) |
||
|---|---|---|---|---|---|---|---|---|
| Mix | Sin | |||||||
| LDRA | Mix | 7 | 0 | 335 | 100% | 100% | 100% | 1.000 |
| Sin | 0 | 328 | (98.8–100%) | (64.6–100%) | (98.9–100%) | (1.000–1.000) | ||
| PFRA | Mix | 7 | 3 | 335 | 99.1% | 100% | 99.1% | 0.819 |
| Sin | 0 | 325 | (97.3–99.7%) | (64.6–100%) | (97.4–99.7%) | (0.619–1.000) | ||
| APRA | Mix | 5 | 0 | 335 | 100% | 71.4% | 99.4% | 0.830 |
| Sin | 2 | 328 | (98.8–100%) | (35.9–91.8%) | (97.8–99.8%) | (0.599–1.000) | ||
LDRA, laboratory-developed respiratory assay (CDC Flu-SC2 + LDT RSV); PFRA, Panther Fusion® SARS-CoV-2/Flu A/B/RSV assay; APRA, Allplex™ SARS-CoV-2/FluA/FluB/RSV assay; n, total number of positive samples; Mix, mixed infection detected; Sin, single infection detected; SinPA, single infection percent agreement; MixPA, mixed infection percent agreement; OPA, overall percent agreement; k, k-index; 95% CI, 95% confidence interval.
Disclaimer/Publisher’s Note: The statements, opinions and data contained in all publications are solely those of the individual author(s) and contributor(s) and not of MDPI and/or the editor(s). MDPI and/or the editor(s) disclaim responsibility for any injury to people or property resulting from any ideas, methods, instructions or products referred to in the content. |
© 2025 by the authors. Licensee MDPI, Basel, Switzerland. This article is an open access article distributed under the terms and conditions of the Creative Commons Attribution (CC BY) license (http://creativecommons.org/licenses/by/4.0/).
Copyright: This open access article is published under a Creative Commons CC BY 4.0 license, which permit the free download, distribution, and reuse, provided that the author and preprint are cited in any reuse.


