Submitted:
12 December 2025
Posted:
12 December 2025
You are already at the latest version
Abstract
The accuracy of dynamics parameters in the transmission system is essential for high-performance motion trajectory planning and stable operation of heavy-duty ser-vo presses. To mitigate the performance degradation and potential overload risks caused by deviations between theoretical and actual parameters, this paper proposes a dynamics model accuracy enhancement method that integrates multi-objective global sensitivity analysis and ant colony optimization-based calibration. First, a nonlinear dynamics model of the eight-bar mechanism was constructed based on Lagrange's equations, which systematically incorporates generalized external force models con-sistent with actual production, including gravity, friction, balance force, and stamping process load. Subsequently, six key sensitive parameters were identified from 28 sys-tem parameters using Sobol global sensitivity analysis, with response functions defined for torque prediction accuracy, transient overload risk, thermal load, and work done. Based on the sensitivity results, a parameter calibration model was formulated to minimize torque prediction error and transient overload risk, and solved by the ant colony algorithm. Experimental validation shows that, after calibration, the root mean square error between predicted and measured torque decreases significantly from 1366.9 N·m to 277.7 N·m (a reduction of 79.7%), the peak error drops by 72.7%, and the servo motor’s effective torque prediction error was reduced from 7.6% to 1.4%. In an automotive door panel stamping application on a 25,000 kN heavy-duty servo press, the production rate increases from 11.4 to 11.6 strokes per minute, demonstrating en-hanced performance without compromising operational safety. This study provides a theoretical foundation and an effective engineering solution for high-precision model-ing and performance optimization of heavy-duty servo presses.
Keywords:
servo press
; eight-bar mechanism
; parameter calibration
; global sensitivity analysis
; dynamic modeling
1. Introduction
Servo presses, as core equipment in intelligent manufacturing, are heralding a paradigm shift in forming processes across the automotive, aerospace, and rail transportation sectors by virtue of their programmable slide trajectories, inherent process flexibility, and superior energy efficiency [1,2,3,4]. Unlike the conventional mechanical press, the servo press enables precise modulation of slide motion, yielding production rate enhancements of 15-30% while substantially improving part quality and tool life [5,6,7]. In high-end manufacturing, heavy-duty servo presses are tasked with the precision forming of large-scale, complex components (e.g., automotive body panels and aircraft skins), where the accurate characterization of their transmission system dynamics model is an indispensable prerequisite for ensuring machining precision, equipment reliability, and operational energy efficiency [8]. However, as the servo press continues to advance towards larger sizes, higher speeds, and greater intelligence, the transmission system exhibits increasingly complex dynamic behaviors characterized by pronounced nonlinearities and multi-source disturbance coupling. Dynamics parameters adopted in the design phase—such as friction coefficients, moments of inertia, and transmission efficiencies—are typically derived from idealized assumptions or empirical correlations, and thus often fail to accurately reflect operational uncertainties arising from assembly tolerances, component wear, and lubrication variability. This mismatch between theoretical and actual parameters leads to severe deficiencies in the predictive accuracy of dynamics models built upon nominal values, thereby forcing trajectory planning and control strategies to be overly conservative. Such conservatism not only limits the full utilization of equipment capacity but also risks servo motor overload and overheating due to transient load prediction errors [9,10,11]. Consequently, developing the high-precision dynamics model with precisely calibrated parameters is of paramount theoretical and practical importance for unlocking the full performance potential of servo presses.
High-precision modeling of heavy-duty servo presses is confronted with multiple challenges. Firstly, widely adopted multi-linkage mechanisms (e.g., eight-bar and six-bar linkages) exhibit pronounced kinematic and dynamic nonlinearities, which manifest as time-varying inertia matrices and strong coupling effects arising from Coriolis and centrifugal forces. Secondly, the system operation is subject to coupled multi-physics disturbances, encompassing nonlinear friction at kinematic joints, fluctuations in slide balance forces, and variations in stamping process loads, which collectively constitute a high-dimensional, strongly coupled dynamic system. Scholars worldwide have conducted extensive research in this domain. Wang et al. [12] established an electromechanical coupling model for a crank servo press based on Lagrange's equations, thereby revealing the influence law of motor speed on the dynamic response of the slide. Halicioglu et al. [13] investigated a low-capacity servo press with a rated load of 500 kN and a stroke of 200 mm, through which dynamic modeling and parameter optimization were employed to effectively improve its motion accuracy. Zhai et al. [14] performed an in-depth analysis of the coupling mechanism between inertial force imbalance and component elastic deformation on the positioning accuracy of the slide in a six-bar linkage press; by optimizing the mass parameters of the links and structural stiffness, the slide positioning error could be reduced to ±0.02 mm. Cheng et al. [15] tackled the issue of excessive slide acceleration in a six-bar main mechanism by constructing a parametric model in Adams software and employing sensitivity analysis coupled with multi-objective optimization algorithms to identify key variables, thereby achieving substantial reductions in peak acceleration and significant extension of die life. Xu et al. [16] developed a multi-domain model encompassing complete stamping mechanics, hydraulic systems, and servo drives, through which the dynamic response of the servo press was predicted via simulation and equipment vibration was mitigated through the design of servo motor speed profiles. It is noteworthy that the authors' prior research [17] proposed a parameter calibration method specifically for the transmission system of a heavy-duty servo press. Through optimization of five key parameters, the average error in servo motor torque prediction was reduced from 12.3% to 6.9%, while the peak error was substantially decreased from 74.2% to 10.1%, thereby achieving a marginal improvement in production rate.
Although prior research has made notable progress, the accuracy of current dynamic models remains insufficient to meet the demands of high-performance control and optimization under heavy-duty operating conditions. A critical limitation is that existing models have generally failed to adequately account for the combined effects of kinematic joint friction losses, slide counterbalance forces, and stamping forces, resulting in a significant deficiency in predicting the instantaneous peak torque of the servo motor. This prediction bias directly constrains the efficacy of model-based advanced control algorithms (such as MPC and optimal trajectory planning), forcing equipment to operate with large safety margins and preventing the full realization of its dynamic performance potential. Therefore, developing a high-fidelity model that precisely captures the true dynamic characteristics of the transmission system—particularly maintaining fidelity under transient impact loads—is central to overcoming current performance bottlenecks. This necessitates a modeling methodology that systematically integrates a generalized external force model consistent with real production conditions and an efficient parameter identification strategy.
In consideration of these challenges, this paper proposes a novel method for enhancing dynamic model accuracy by integrating multi-objective global sensitivity analysis with ACO-based parameter calibration, thereby achieving high-precision dynamic modeling and performance improvement for heavy-duty servo press transmission systems. This method first establishes a comprehensive dynamic model incorporating gravity, friction, counterbalance, and stamping process forces. Subsequently, the Sobol method is employed to identify the key parameter subset that exerts a decisive influence on model accuracy. Building on this, a parameter calibration model is formulated with the dual objectives of minimizing torque prediction error and peak error, which is then efficiently solved using an ant colony optimization algorithm. Finally, the effectiveness of the proposed method in enhancing model prediction accuracy and ensuring safe, stable servo motor operation is validated on a 25,000 kN servo press.
2. Dynamic Modeling of Transmission System
2.1. Mechanical Configuration of Servo Press Transmission Mechanism
Heavy-duty servo presses typically employ a mechanical configuration comprising servo motors, reduction gear pairs, multi-link mechanisms, slide, and balance system. The design of this configuration directly determines the stamping quality and production efficiency of automotive body panels. In this study, a self-developed eight-bar mechanism is adopted in the heavy-duty servo press. Through the combination of multiple linkages, this eight-bar mechanism achieves superior motion characteristics compared to the traditional crank-slide mechanism. Specifically, the eight-bar mechanism provides quasi-constant velocity during the working stroke, thereby enhancing forming quality, while exhibiting high-speed characteristics during the return stroke, thus effectively improving production efficiency. Consequently, it is particularly suitable for precision stamping processes with higher requirements for both quality and efficiency.
Figure 1 illustrates the mechanical configuration of the heavy-duty servo press transmission system investigated in this study, consisting of 1—servo motor, 2—reduction gear pair, 3—eccentric wheel, 4—eight-bar mechanism, 5—slide (connected to the guide pillar, not shown in Figure 1). Its operating principle is as follows: Two servo motors (1) synchronously drive a two-stage reduction gear pair (2); the eccentric wheels (3) fixed to the final-stage gear transmit the rotational motion to four sets of eight-bar mechanism (4). Through kinematic conversion by the linkage system, the rotational motion of servo motor (1) is ultimately transformed into the linear reciprocating motion of slide (5), thereby executing the stamping operation.
In the transmission system, components such as motor shafts, couplings, reduction gears, and eccentric wheels perform fixed-axis rotational motion. The dynamic characteristics of these components primarily manifest as rotational inertia effects about a fixed axe and can be directly calculated based on moment of inertia, transmission ratio, and friction models. By contrast, the motion of the eight-bar mechanism involves not only significant inertial effects, but also comprehensive influences from multi complex factors such as joint friction and external loads, exhibiting highly nonlinear and strongly coupled dynamic behaviors. Consequently, developing a high-precision dynamics model of the eight-bar mechanism is essential for optimizing the overall dynamic performance.
2.2. Dynamic Modeling of Eight-bar Mechanism
The schematic diagram of the eight-bar mechanism is shown in Figure 2. This mechanism primarily comprises the frame (O and D), crank 1, link 2, link 3, triangular link 4, link 5, link 6, link 7, and slide 8, wherein crank 1 and link 2 are integrated as a single component named the eccentric wheel mentioned above. All links are interconnected by nine revolute joints and one prismatic joint, forming a closed kinematic chain. Typically actuated by a servo motor driving the input crank, the mechanism enables a flexible and controllable stamping process through the coordinated motion of the linkage system.
A generalized coordinate system for the eight-bar mechanism is established using the reference point coordinate method, with the center of mass of each moving link selected as the reference point. The coordinates of any point on a link in the generalized coordinate system can be obtained through rotation matrix transformation of its local coordinates, with the rotation matrix defined as:
The generalized coordinate vector for each moving link is defined as ,where ; and are the coordinates of the center of mass of -th link in the generalized coordinates system , respectively; and is the angular displacement of -th link relative to the positive axis, with the counterclockwise direction defined as positive.
Therefore, the generalized coordinates of the eight-bar mechanism are
Based on the geometric constraint method and utilizing the coordinate transformation relationship given in Eq. (1), a total of 21 position constraint equations can be stablished according to the connection conditions of the nine revolute joints and one prismatic joint, along with one driving constraint. The constraint equations are expressed as follows:
In the equations, is the dimensions of -th link; is the distance between the center of mass of -th link and its reference hinge point; , and are the orientation angles of the triangular link 4, with respect to its center of mass; and are the coordinate components of hinge point D; and is the prescribed crank angular displacement function as a function of time .
First-order differentiation of Equation (3) is taken concerning time, and the velocity constraint equation is achieved.
where is the Jacobian matrix of the constrain equations, defined as ; is the generalized velocity vector; is partial derivation of the constraint equation with respect to time , given by ; and is the right-hand side term of the velocity constraint equation.
Differentiating Equation (3) twice with respect time yields the acceleration constraint equation.
In the equation, is the acceleration vector; is the second partial derivative of the constraint equation with respect to the generalized coordinates ; is the second partial derivative of the constraint equation with respect to time , given by ; and is the right-hand side term of the acceleration constraint equation.
In the acceleration constraint equation, the right-hand side of Equation (5) fully incorporates all inertial force effects within the mechanism. Specifically, the term reflects the centrifugal inertial forces resulting from the rotation of components and the motion of their centers of mass. The combined term describes the Coriolis forces in the system. Meanwhile, the term characterizes the equivalent inertial force generated by the acceleration and deceleration of the servo motor-driven crank. This term serves as a key element linking the dynamic input of the servo motor to the inertial response of the mechanism, effectively capturing the dynamic behavior of the servo drive system under non-uniform operating conditions.
Based on the Lagrange multiplier method, the rigid-body dynamics equation of the eight-bar mechanism is established as follows:
Among this, is mass matrix of system; is Lagrange multiplier; and is generalized extern force with regard to system.
The system mass matrix can be expressed as:
where is the mass of -th link, and is the rational inertia of -th link.
Combining Equation (5) and Equation (6) and applying the Baumgarte stabilization method, the rigid-body dynamics equation of the eight-bar mechanism is obtained as:
where and are correction parameters of the Baumgarte stabilization method [18], typically chosen as positive real numbers in the range ; and , which penalizes the velocity and position constraint violations respectively to improve numerical stability during solution.
2.3. Generalized External Forces and Friction Modeling
In the dynamics model of the heavy-duty servo press eight-bar mechanism, the generalized external forces are the key factor driving the system motion and overcoming various resistances. Accurate modeling of these forces is critical for predicting the system's dynamic response, energy distribution, and the servo motor torque. In the stamping process, the general external forces primarily consist of four components: gravitational forces of links, friction in kinematic joints, slide balance force, and stamping process loads, which are projected onto the generalized coordinate space through the system's geometric configuration and kinematic relationships, collectively constituting the complete set of generalized external forces acting on the system.
2.3.1. Gravitational Force
The gravitational forces of links can be derived by differentiating the potential energy function with respect to the generalized coordinates. As gravity exclusively influences the generalized force components in the direction, the gravitational sub-vector acting on the center of mass of -th link can be expressed as:
where is the gravitational acceleration.
2.3.2. Friction Modeling
The frictional forces in kinematic joints exert significant influence on servo motor torque and cannot be neglected. In this study, the Coulomb-viscous friction model is adopted to model the revolute joints and prismatic joints in the eight-bar mechanism. For revolute joints, the friction torque always opposes the relative motion, acting opposite to the direction of relative angular velocity, and can be expressed as:
where is the friction torque at the -th revolute joint; is the friction coefficient of the revolute joint; is the radius of plain bearing of -th revolute joint; is the norm of the normal constraint force vector, obtained from the corresponding component of the Lagrange multiplier . is the viscous damping coefficient of the revolute joint; is the relative angular velocity between the two connected links at the -th revolute joint, calculated from the generalized velocity vector ; is the set of revolute joints in the eight-bar mechanism, , the revolute joint connecting three links can be decomposed into two revolute joints and ; and is the sign function.
Based on the principle of virtual work, the friction torques of the revolute joints are mapped into the generalized coordinates to establish the corresponding generalized external force vector , expressed as follows:
where represents the Jacobian row vector of -th revolute joint, .
For the prismatic joint formed by the slide and guide rail in the eight-bar mechanism, the sliding friction force is formulated as:
where is the sliding friction force exerted by the guide rail on the slide, acting opposite to slide’s velocity; is the friction coefficient of the prismatic joint; is the norm of the normal constraint force vector, which can also be obtained from the corresponding component of the Lagrange multiplier ; is the viscous damping coefficient of the prismatic joint; and is the generalized velocity of the slide.
2.3.3. Slide Balance Force
The slide balance force is primarily utilized to balance the gravity of all moving components, including the linkage mechanism, guiding pillar, slide, height adjustment, upper die and auxiliary devices. It effectively suppresses sudden load variations on the servo motor, reduces impact and wear in the kinematic pairs, and thereby improves the dynamic response and operational reliability of the servo press. This balance force is generated by a pneumatic balance cylinder system, with its direction of action parallel to the slide's motion and always pointing toward the positive Y-axis. The magnitude of the balance force is a function of the slide displacement, and its theoretical formula is shown in Equation (13).
In the formula, the pressure fluctuation coefficient is determined by the following formulas.
In the formulas, is the balance force directing acting on the slide; is the number of balance cylinders; is the absolute pressure of the air supply; is the effective cross-sectional area of a single balance cylinder; is the compression ration of the air; represents the slide rated stroke; means the instantaneous slide displacement (with the bottom dead center(BDC), defined as zero); and is the volume of the air tank.
2.3.4. Stamping Process Force
The stamping process force is defined as the deformation resistance that must be overcome when the slide causes plastic deformation of the sheet metal through the upper die. The force acts on the slide in the same direction as the balance force, but exhibits a staged characteristic, being generated only within the stamping stroke from die-sheet contact to BDC. The stamping process force can be defined as:
In the formula, is the stamping process force, and its magnitude is related to the slide displacement ; and is the slide displacement when the die contacts the sheet metal.
2.3.5. Generalized External Force Integration
Following the establishment of the mathematical models for gravity, joint friction, balance force and stamping process force, it is necessary to integrate these models to form a complete system dynamic input vector. Based on the principle of virtual work, all external forces are mapped into the generalized coordinates, developing the generalized external force vector , which is defined as the sum of the individual components:
where is the gravity of the system, assembled from the gravity sub-vectors ; , and are applied directly to the generalized coordinate of the slide.
This generalized external force completely describes the various external forces acting on the heavy-duty servo press during the stamping process, providing accurate input conditions for system dynamics analysis.
2.4. Servo Motor Drive Torque Modeling
Based on the dynamics model established previously, this section further develops a theoretical formula to predict the servo motor's output torque, providing a foundation for subsequent parameter identification.
According to the constrained dynamics model established by Lagrange equations, the Lagrange multiplier represents the generalized driving torque required to maintain the predefined crank motion , and this multiplier is obtained by solving the constrained dynamics equations. Concurrently, the servo motor output torque must also overcome the inertial effects in the reduction gears. By considering the factors, the formula of the servo motor output torque is established as follows:
In the formula, is the output torque of the servo motor; is the reduction gear ratio, ; is the total efficiency of the reduction system, which accounts for both the electromagnetic conversion efficiency of the servo motor and the mechanical efficiency of the reduction gear; and is the total moment of inertia equivalent to the motor shaft, including the rotational inertia of the servo motor shaft, coupling, two-stage reduction gear pairs, and other rotating components.
Formula (16) establishes a quantitative relationship between the system dynamic response and the servo motor driving torque, wherein the efficiency term represented through a sign function , precisely characterizes the system energy transmission behavior under driving () and braking () operational states.
3. Sensitivity Analysis and Identification of Dynamics Parameters
3.1. Definition and Classification of Theoretical Design Parameters
The dynamics model of the heavy-duty servo press transmission system established above contains multiple types of parameters. To investigate the dynamic influence of the parameters on the servo motor torque, these parameters are classified into four categories: the reduction gear system parameters, the mechanism dimensions and their mass-inertia parameters, the friction characteristic parameters, and the balance coefficients.
The key parameters of the reduction gear system mainly comprise the equivalent moment of inertia of the reduction gears and the total efficiency. Table 1 presents the theoretically calculated values of the equivalent moment of inertia and total efficiency for the reduction gear system.
The dimensions and mass-inertia parameters of the eight-bar linkage mechanism are shown in Table 2. The link parameters , which critically determine slide motion accuracy, have been guaranteed through high-precision machining. The remaining parameters, including the center-of-mass distances, masses, and moments of inertia, are obtained from theoretical calculations based on the components' 3D models.
As the servo press transmission mechanism operates under heavy-duty conditions with significant forces on each kinematic pair, revolute joints are designed with thin-oil-lubricated plain bearings and prismatic joint (guide rail and slide) with grease lubrication to ensure operational stability and durability. The empirical values of friction characteristic parameters and radius of plain bearings are listed in Table 3.
This study proposes the balance coefficient to optimize energy efficiency and drive load under steady-state operation. Defined as the ratio of counterweight mass to rated load, it is expressed as:
In this formula, the balance coefficient falls within the range of 1.0 to 1.3, with a conventional value of 1.15.
3.2. Sobol Global Sensitivity Analysis and Response Function Definition
3.2.1. Sobol Method for Global Sensitivity
The Sobol method is a variance-based global sensitivity analysis approach, widely used to quantify the contribution of individual input parameters to uncertainty in model output [19,20]. This method calculates the first-order and total-effect indices to reflect the independent influence of individual parameters and the combined effects arising from their interactions with other parameters, respectively. Let the model output be , where is a vector comprising input parameters. The model output can then be decomposed as follows:
In this formula, is the constant term ,representing the mean of model output; denotes the i-th input parameter; is the first-order effect term, representing the variation in model output caused solely by changes in parameter ; is the second-order effect term, characterizing the variation in model output resulting from the interaction between parameters and ; is the n-th order effect term, encompassing the interactive effects among all parameters.
Based on this decomposition, the total variance of the model output can be expressed as Eq. (19).
where denotes the total variance of model output; is the variance contributed by the independent effect of parameter; is the variance contributed by the interaction between parameters and ; and is the variance contributed by the total effect of all parameters.
Subsequently, the first-order effect index and the total-effect index are given as follows:
where denotes all parameters except .
3.2.2. Definition of Response Function
In the servo press transmission mechanism, certain structural parameters, such as the geometric dimensions of components () and plain bearing dimensions are directly guaranteed by machining precision, their influence on system dynamic performance is negligible; consequently, they are excluded from the sensitivity analysis. This study focuses on 28 parameters determined through theoretical calculation or empirical estimation, including the equivalent moment of inertia of the reduction system , the total efficiency of the reduction system , distance to the component's center of mass , the mass of -th link , the rational inertia of -th link , the friction coefficient of the revolute joint ,the friction coefficient of the prismatic joint , the viscous damping coefficient of the revolute joint , the viscous damping coefficient of the prismatic joint , and balance coefficient . These parameters may deviate from the theoretical design values during actual operation, thereby significantly affecting output torque characteristics of the servo motor
To quantitatively evaluate the influence of each parameter on servo motor torque characteristics, the global sensitivity analysis using the Sobol method is conducted on the 28 parameters. Given that the servo motor output torque response exhibits strong nonlinear characteristics, a single evaluation metric is insufficient to comprehensively capture all parameter effects; therefore, four response functions are defined to construct a multi-dimensional evaluation framework.
The root mean square error (RMSE) function is employed to evaluate the influence of parameters on torque predicting accuracy, as described by the following formula. This function calculates the RMSE between the predicted and reference torque over a complete work cycle to identify critical parameters.
where is the number of sampling points, taken as , i.e., one data point is sampled every 1° in one working cycle; is the value of the predicted torque curve generated with varied parameters at the crank angle ; and is the value of the reference torque curve constructed based on theoretical design parameters at the crank angle .
An transient overload risk index, termed Peak Ratio (PR), is formulated as a key response function . This function, by quantifying the relative deviation between predicted and baseline peak torques, is specifically designed to isolate and capture the contribution of each parameter to transient overload risk. Its expression is
To assess the system's thermal performance, a thermal limit index, termed TL, is formulated as a primary response function . This metric, which directly correlates with the servo motor's heat generation, is specifically employed to evaluate the influence of transmission system parameters on the overall thermal loading. Its expression is:
where is the cycle time.
The work index evaluates the influence of transmission system parameters on energy conversion efficiency by calculating the total work output of the servo motor in one working cycle. Its expression is
where is the predefined crank angular velocity.
3.3. Sensitivity Analysis Results and Key Parameter Identification
During the sensitivity analysis, the variation range for most parameters was set from 70% to 130% of their theoretical design values. Specific ranges were assigned to the following parameters: , , , and . Monte Carlo sampling was performed in the parameter space using the Sobol sequence to construct two independent sample matrices A and B, and an intermediate matrix C generated via column substitution. Each sample was sequentially submitted to the system dynamics model to obtain the corresponding output response, thereby calculating the first-order and total-effect indices for each parameter. Based on a sample convergence analysis, a sample size of 2000 was determined to ensure the statistical reliability of the sensitivity analysis results.
The results of the global sensitivity analysis demonstrate a strong dependence of parameter sensitivity on the selected response function. Among the 28 transmission system parameters considered, only 7 parameters exhibit significant influence across the four response functions, characterized by a total-effect index , while the total-effect indices of the remaining 21 parameters are all below 0.01, indicating that their effects on the dynamic behavior of the transmission system can be negligible. As shown in Figure 3a, which includes only parameters with a total-effect index , the response function is predominantly governed by a distinct set of parameters. Specifically, the total efficiency of the reduction system (), the balance coefficient (), and the friction coefficient of the revolute joint (), constitute the core set of sensitive parameters, with their cumulative contribution accounting for 90.5% of the total-effect indices from all parameters. However, the total-effect index for the slide equivalent mass is merely 0.063 in this -based analysis. This finding underscores that relying solely on the response function for parameters identification would significantly underestimate the influence of inertial parameters such as parameter on the system's dynamic characteristics, which could compromise the model’s predictive capabilities for transient dynamic behavior.
The introduction of the response function significantly reconfigures the parameter sensitivity spectrum, as illustrated in Figure 3b. Parameters ηgear (STi = 0.645) and ψ (STi = 0.298) remain the two most influential factors in the -based analysis. Specifically, the total-effect index of experiences a slight decrease, whereas that of increases substantially, underscoring its critical role in the formation of peak torque. Compared with the results obtained from the -based analysis, another notable shift is observed for the parameters and (the equivalent moment of inertia of the reduction system). Their total-effect indices increase markedly from 0.063 and 0.03 to 0.173 and 0.144, respectively, thereby establishing them as the third and fourth most influential parameters, subordinate only to parameters and . This shift is attributed to the inertia forces and torques generated by parameters and during rapid acceleration and deceleration phases, which scale with the crank angular acceleration and thus dominate the peak load torque. In addition, the total-effect index of the prismatic joint friction coefficient rises from 0.027 to 0.074, enhancing the influence of velocity-dependent friction on torque spike modulation. In contrast, the total-effect index of the parameter decreases significantly from 0.153 in the -based analysis to 0.052 in the -based analysis. Despite this reduction, parameter continues to exert a relatively strong influence. A direct comparison between Figure 3a and Figure 3b reveals a fundamental shift in parameter dominance: the -based analysis identifies only three parameters exhibiting strong sensitivity, namely (), (), and (), whereas the -based analysis reveals four influential parameters, namely (), (), () and (), with a notable change in the composition of the dominant parameter set. Consequently, the sensitivity analysis omitting the function may yield a model that accurately predicts average torque but fails to reliably capture transient overload risk. This deficiency could lead to underestimated safety margins for crank acceleration in motion planning, potentially resulting in servo motor overcurrent faults or mechanical shock in the transmission system.
The sensitivity analysis results for the two response functions and are presented in Figure 3c and Figure 3d, respectively. As shown in Figure 3c, the -based analysis identifies a core set of four sensitive parameters: (), (), () and (). This parameter set collectively accounts for 92.5% of the total-effect indices from all parameters. Notably, the first-order sensitivity indices for these four parameters are consistently higher than their corresponding total-effect indices, and their interaction effects are calculated to be negative. This pattern suggests the presence of nonlinear saturation or canceling effects among these parameters concerning response. In the -based analysis, shown in Figure 3d, the parameter exhibits a dominant total-effect index (), substantially exceeding that of all other parameters. The parameter () also presents considerable importance for energy consumption, second only to the parameter . Together with the prismatic joint friction coefficient (), these three parameters contribute 92.5% of the total-effect indices from all parameters, identifying them as the primary dissipation terms for system energy consumption aside from the useful stamping work. Specifically, these energy dissipation terms primarily manifest as frictional losses in the gear pairs of the reduction system, as well as in the revolute and prismatic joints of the linkage mechanism. This analysis thus provides a clear direction for optimizing the system's mechanical efficiency. In contrast, the parameter , while exhibiting high sensitivity in the other three response functions, shows a markedly reduced total-effect index of 0.063 in the -based analysis, aligns with its theoretical role as a conservative force, which should theoretically yield zero network over one working cycle. The minimal associated energy loss is therefore attributable solely to its coupling with non-conservative friction terms.
To develop a high-precision dynamics model of the transmission system, this study conducted a systematic global sensitivity analysis to evaluate key parameters across four response functions: torque prediction accuracy (), transient overload risk assessment (), thermal limit () and work output (). The results of the sensitivity analysis reveal a distinct and complementary distribution of parameter sensitivities. The parameter consistently exhibited the highest sensitivity across all four functions, with a minimum total-effect index of 0.421. The parameter ranked as the second most influential in the -based, -based and .-based analysis Meanwhile, parameter showed considerable influence in the -based and .-based analysis, with total-effect indices exceeding 0.1 in both cases. The effects of parameters and were predominantly concentrated in the -based analysis, which characterizes transient overload risk, where their indices were substantially higher than those in other functions. Although the parameter displayed relatively low sensitivity in the -based, -based and .-based analysis, it demonstrated notable sensitivity in -based analysis. To concurrently enhance model performance in torque prediction accuracy and transient overload risk assessment, the functions and were selected as the core decision functions. A screening criterion was thus established: a parameter must have a total-effect index greater than 0.05 in at least one core function, and its sensitivity trends across all four functions must be comprehensively evaluated. Based on this criterion, six key parameters with global influence on the system’s dynamic performance were identified: , , , , , and . This parameter set comprehensively covers multidimensional performance objectives, including torque prediction accuracy, transient overload risk, thermal management, and energy efficiency, thereby laying a solid parametric foundation for establishing a high-precision and highly reliable dynamics model of the transmission system.
3.4. Parameter Calibration Model
The results of the global sensitivity analysis presented in Section 3.3 demonstrate that the identified key parameters exert a decisive influence on the dynamic performance of the transmission system. To construct a high-precision dynamics model, the accurate calibration of these key parameters is essential. This study selects the torque prediction accuracy function and the transient overload risk assessment function as the calibration objectives based on the following justification: the function serves as a core metric for evaluating the model average torque fidelity in one working cycle, directly determining the fundamental accuracy of the dynamics model; whereas the function is critical for predicting the dynamic safety boundary of the transmission system under extreme operating conditions, fulfilling an essential function in assessing the transient overload risk of the servo motor. Accordingly, the parameter calibration problem is formulated as a multi-objective optimization problem aimed at simultaneously minimizing these two objectives.
The calibration parameter variables are defined as follows:
The vector form of this multi-objective optimization problem is expressed as:
where represents the root mean square error between the predicted and measured torque in one working cycle; denotes the relative error between the predicted and measured peak torque; , and are the lower and upper bounds of the feasible domain for each calibration parameter, respectively, consistent with the parameter ranges in the global sensitivity analysis.
To reformulate this multi-objective problem, the weighted sum method is employed, transforming it into a single composite objective function:
where, and are normalization values introduced to eliminate dimensional effects, calculated from Equations (22) and (23) using the predicted torque () based on the theoretical design parameters, and the measured torque (); is a weighting coefficient, that quantifies the trade-off preference between total accuracy and transient peak accuracy, with adopted in this study based on preliminary analyses.
By solving this optimization problem, the optimal parameter set can be obtained, thereby significantly improving the accuracy of the servo press dynamics model.
4. Experimental Verification and Engineering Application
4.1. Experiment Design for Model Calibration
To validate the proposed model and its associated parameter calibration methodology, experiments were conducted on a 25,000 kN heavy-duty servo press (Figure 4), developed by Tianjin Heavy Industry Co., Ltd. of CFHI Group. This servo press, integrated with three 10,000 kN mechanical presses, forms an automated stamping line dedicated to the high-precision forming of large automotive panels. The press's capacity for controllable slide motion significantly enhances the overall stamping quality. This stamping line has been successfully deployed in industrial applications for over six months, demonstrating robust and stable performance. Consequently, its stabilized transmission system provides a highly reliable platform for the validation experiments.
In the established dynamics model of the transmission system, the stamping process force, a time-varying load arising from the nonlinear plastic deformation of the sheet metal and dynamic contact phenomena, cannot be directly or precisely measured in real-time. Therefore, this study proposes an indirect loading and parameter identification strategy utilizing a CNC servo cushion. This integrated system applies a precisely controlled, constant ejection force to equivalently simulate the actual stamping load on the transmission system. The validity of this approach is demonstrated in three key aspects: first, a precisely controlled constant ejection force applied by the servo cushion effectively simulates the complex stamping process load, providing a quantifiable loading condition for parameter identification; second, the pre-acceleration function of the servo cushion actively suppresses impact effects caused by velocity differences at the moment of upper and lower die contact, ensuring consistency between the computational conditions of the dynamics model and the actual working conditions; third, by optimizing the slide motion trajectory and achieving continuous stable operation, repeatable experimental conditions are created for data acquisition. The experimental procedure is executed as follows:
(1) Set the ejection force of the servo cushion to 5,000 kN and the ejection displacement to 300 mm;
(2) Based on the preset ejection force and displacement, optimize the slide motion trajectory and control the servo press to operate continuously with this trajectory to complete the striking action on the cushion;
(3) Synchronously collect the torque data of the servo motor during the actual stamping process;
(4) Use the measured torque as input, and solve the parameter calibration model using an optimization algorithm to inversely identify the true values of the transmission system.
4.2. Calibration Results and Analysis
To validate the accuracy of the dynamics model and obtain high-precision transmission system parameters, this section employs an improved ant colony optimization algorithm to calibrate six key dynamics parameters (), which were identified by global sensitivity analysis. The calibration is conducted based on the experimental strategy described in Section 4.1. The core parameter settings of the algorithm are as follows: the number of ants is 50, the maximum number of iterations is 100, the elite ant quantity coefficient is 2, the pheromone importance factor is 1.0, the heuristic factor importance is 2.0, the pheromone evaporation coefficient is adaptively adjusted within the interval [0.1, 0.9], and the pheromone intensity is 100.
Upon completion of calibration, to quantitatively evaluate the enhancement in model prediction accuracy attributed to parameter calibration, a comparative analysis was first conducted for three curves over one working cycle: the measured torque of the servo motor (denoted as ), the predicted torque calculated based on the theoretical design parameters (denoted as ), and the predicted torque calculated based on the calibrated parameters (denoted as ). The results are presented in Figure 5.
As illustrated in Figure 5, all three torque curves (, , and ) exhibit consistent trends throughout the entire stamping cycle. However, the curve demonstrates a prominent sharp-peak torque at the moment of upper - lower die contact (near a crank angle of approximately 71°). This abrupt change is induced by rigid impact, which is an inherent characteristic of the stamping process and does not undermine the validity of parameter calibration. Notably, comparative analysis reveals that the agreement between and is significantly superior to that between and . To quantitatively characterize this enhancement, the RMSE and peak error of and relative to were calculated separately. The results indicate that the RMSE of reaches 1366.9 N·m, with a peak error of 3139.3 N·m; whereas, the RMSE of is drastically reduced to 277.7 N·m, and the peak error drops to 856.3 N·m, with the reduction rates being 79.7% and 72.7%, respectively. This demonstrates that the calibrated dynamics model attains substantial improvements in the accuracy of predicting both the mean torque levels and extreme loading conditions.
Accurate identification of transmission system parameters is a prerequisite for high-precision prediction in the dynamics model. Table 4 presents a detailed list of the theoretical design values, calibrated values and their respective relative errors for six key dynamics parameters. It is clearly observed that varying degrees of discrepancies exist between the theoretical and calibrated values for all parameters, which directly accounts for the previously described deviations in torque prediction accuracy. A specific analysis reveals that friction-related parameters exhibit the most significant errors. The total efficiency of the reduction system, , is closely related to the frictional losses within the gear pair. The deviation of its theoretical value (typically manifesting as an overestimation of efficiency) likely originates from simplified assumptions regarding internal friction mechanisms, such as gear meshing and bearing losses, in the initial design. These assumptions failed to adequately reflect energy losses under actual operating conditions. Concurrently, the theoretical values of the friction coefficients for the revolute and prismatic joints are clearly set with larger safety factors, reflecting conservative considerations during the initial design phase regarding frictional uncertainties in actual operation (e.g., lubrication conditions, surface wear, and load variations). Furthermore, the theoretical values of inertia parameters are generally underestimated, with relative errors of -7.1% and -10.2%, respectively. This indicates that during the initial design stage's three-dimensional modeling for calculating mass and rotational inertia, potential model simplifications or a neglect of mass contributions from certain auxiliary components (such as mold connectors, lubrication lines, sensors, and other small rotating or moving parts) might have occurred. The deviation of the balance coefficient (with a relative error of 8.5%) is also associated with the conservative safety factors adopted in the initial design.
Utilizing Equation (24), the thermal limit values for the torque curves , , and , which represent the effective torque of the servo motor, are determined as 13195.4 N·m, 12432.9 N·m, and 12265.8 N·m, respectively, where the error of relative to is 7.6% and the error of relative to is substantially reduced to 1.4% This significantly enhances the prediction accuracy of the servo motor's effective torque, thereby providing a more reliable guarantee for the safe operation of the servo motor.
In summary, this section successfully achieves the calibration of critical dynamics parameters for the transmission system by combining experimental investigations with an optimization algorithm. The results reveal that the initial theoretical design parameters exhibit significant deviations from the actual system, which are primarily attributed to conservative safety margins, simplified empirical formulations, and inadequate consideration of ancillary components. After calibration, both the RMSE and peak error of the model's predicted torque are reduced by approximately 70%. Concurrently, the effective torque prediction error of the servo motor significantly decreases from 7.6% to 1.4%. These substantial improvements collectively validate the accuracy and effectiveness of the dynamics model and the parameter calibration method developed in this study, thereby laying a robust foundation for subsequent control optimization, performance evaluation, and system design based on the high-precision dynamics model.
4.3. Engineering Application
This study applies the high-precision dynamics model obtained through experimental calibration to the 25,000 kN heavy-duty servo press to enhance the production rate of automotive body panels. Based on the motion trajectory planning and optimization method for heavy-duty servo presses proposed in literatures [21,22], a typical automotive body panel—the door outer panel—is selected as a case study for comparative production rate optimization analysis using both theoretical design parameters and calibrated parameters. Under identical stamping process parameters and predefined motion trajectory, the dynamic load torque curve of the servo motor calculated based on the theoretical parameters exhibits significant peaks during acceleration and deceleration phases, persistently exceeding the motor’s 10% safety margin, as illustrated in Figure 6. To ensure safe operation of the servo motor, a conservative angular acceleration constraint strategy must be adopted, consequently compromising the production rate. In contrast, the torque curve calculated using the calibrated parameters effectively suppresses the overall amplitude, with all operating points stabilizing within the safety margin boundary while simultaneously maximizing utilization of the available margin, indicating more effective exploitation of torque capacity. This substantial reduction in torque demand consequently removes excessive restrictions on acceleration.
Figure 7 further presents the angular velocity and angular acceleration profiles of the servo motor under both parameter configurations. The results demonstrate that, benefitting from the accurate characterization of actual dynamic behavior by the high-precision dynamic model, the servo motor can execute higher angular accelerations during the idle stroke phases, thereby completing more rapid acceleration-deceleration cycles and fully exploiting the torque potential of the servo motor. Conversely, the motion trajectory based on theoretical design parameters, constrained by conservative load estimations, suffers from suppressed acceleration capability and fails to fully release the servo motor's performance potential. Ultimately, the enhancement in dynamic performance translates directly into a tangible improvement in production rate. Experiments confirmed that the stamping production rate for the door outer panel increased from 11.4 to 11.6 parts per minute, representing an increase of 1.7%. Based on an annual production schedule of 6,000 hours, this translates to an additional annual output of 72,000 parts per production line. This technology exhibits excellent portability and can be extended to the entire series of heavy-duty servo presses ranging from 10,000 to 25,000 kN, promising substantial economic benefits. This case study demonstrates that the integration of a high-precision dynamics model into the engineering practice of heavy-duty servo presses not only enables accurate identification of critical dynamics parameters but also effectively unlocks dormant equipment potential by eliminating overly conservative design constraints, thereby establishing a theoretical and engineering foundation for refined performance management of equipment within the context of intelligent manufacturing
5. Conclusions
This study establishes a comprehensive technical framework of dynamic modeling, global sensitivity analysis, parameter calibration, and engineering verification, which systematically addresses the uncertainty in dynamic parameters of heavy-duty servo presses. It achieves simultaneous improvements in both the accuracy of the dynamic model and the production rate, with experimental results validating the effectiveness of the proposed method. The main conclusions are as follows:
(1) A nonlinear dynamic model of the servo press transmission system was developed by integrating multi-physics generalized external forces, systematically incorporating gravity, friction, balance forces, and stamping process loads consistent with actual production conditions. This model accurately captures the coupling mechanisms among various physical fields, providing a reliable dynamic foundation for subsequent parameter calibration.
(2) Based on the Sobol global sensitivity analysis method, a four-dimensional response function system encompassing torque accuracy, transient overload, thermal load, and work output was constructed to reveal the differentiation patterns of parameter sensitivity in multi-dimensional performance space. The results indicate that the total efficiency of the reduction system represents the most globally sensitive parameter, the balance coefficient exhibits significant influence across multiple performance dimensions, the friction coefficients of revolute joints and prismatic joints dominate torque and energy predictions, while the equivalent mass of the slide and the equivalent moment of inertia of the reduction system are predominantly influential in transient overload risk assessment. This framework successfully identified six critical parameters from an original 28-dimensional parameter space, reducing the computational complexity of calibration by two orders of magnitude.
(3) The ant colony optimization algorithm was employed to calibrate the key parameter set, significantly enhancing the model's prediction accuracy. After calibration, the root mean square error of torque prediction decreased from 1366.9 N·m to 277.7 N·m (a reduction of 79.7%), the peak error was reduced by 72.7%, and the prediction error of the servo motor's effective torque dropped from 7.6% to 1.4%. This verifies the high accuracy and reliability of the model in predicting both average torque and extreme load conditions.
(4) The high-fidelity dynamic model was applied to optimize the production tact of a 25,000 kN servo press for automotive side panel stamping, achieving trajectory optimization based on safety boundary approaching. The production tact increased from 11.4 to 11.6 parts per minute (a 1.7% improvement), resulting in an annual production capacity increase of 72,000 parts per line, thereby demonstrating significant economic benefits. This case study confirms the engineering value of the proposed methodology in unlocking equipment performance potential while ensuring operational safety.
Author Contributions
Conceptualization, J.L. and S.M.; methodology, J.L. and T.L.; writing— original draft preparation, J.L.; writing—review and editing, J.L.; supervision, Z.W. and B.L. All authors have read and agreed to the published version of the manuscript.
Funding
This research was funded by the Liaoning Provincial Science and Technology Program Joint Plan (Natural Science Foundation-General Program), grant number 2024-MSLH-007.
Institutional Review Board Statement
Not applicable.
Informed Consent Statement
Not applicable.
Data Availability Statement
The data used to support the findings of this study are included within the article.
Conflicts of Interest
The authors declare no conflicts of interest.
References
- Gao, J.Z.; Zhao, S.D.; Jiang, F.; Du, W.; Zheng, Z.H. A novel hollow two-sided output PMSM integrated with mechanical planetary gear: a solution for drive and transmission system of servo press. IEEE-ASME Transactions On Mechatronics 2022, 27(5), 3076–86. [Google Scholar] [CrossRef]
- Li, Q.; Li, H.M.; Gao, J.B.; Xu, Y.L.; Rodriguez, J.; Kennel, R. Nonlinear-disturbance-observer-based model-predictive control for servo press drive. IEEE Transactions On Industrial Electronics 2024, 71(8), 8448–58. [Google Scholar] [CrossRef]
- He, Y.Z.; Luo, X.; Wang, X.S. Research and simulation analysis of fuzzy intelligent control system algorithm for a servo precision press. Applied Sciences-Basel 2024, 14(15). [Google Scholar] [CrossRef]
- Olaizola, J.; Esteban, E.; Trinidad, J.; Iturrospe, A.; Galdos, L.; Abete, J.M.; De, A.E.S. Integral design and manufacturing methodology of a reduced-scale servo press. IEEE-ASME Transactions On Mechatronics 2021, 26(5), 2418–28. [Google Scholar] [CrossRef]
- Li, Q.; Lv, Y.; Kennel, R.; Rodriguez, J. Semiclosed loop based on predictive current control for spmsm drives during servo stamping. IEEE Transactions On Power Electronics 2024, 39(9), 11430–40. [Google Scholar] [CrossRef]
- Prasad, K.; Gupta, A.; Krishnaswamy, H.; Chakkingal, U.; Banerjee, D.K.; Lee, M.G. Does friction contribute to formability improvement using servo press. Friction 2023, 11(5), 820–35. [Google Scholar] [CrossRef]
- Gao, J.Z.; Zhao, S.D.; Li, J.X.; Jiang, F.; Du, W.; Zheng, Z.H.; Feng, Z.Y. A novel main drive system for the servo press: combination of integrated motor and symmetrically toggle booster mechanism. Journal of Manufacturing Science and Technology 2022, 37, 596–612. [Google Scholar] [CrossRef]
- Liu, Y.X.; Shu, Y.W.; Hu, W.T.; Zhao, X.H.; Xu, Z.C. Active vibration control of a mechanical servo high-speed fine-blanking press. Strojniski Vestnik-Journal of Mechanical Engineering 2021, 67, 445–57. [Google Scholar] [CrossRef]
- Chen, X.L.; Gao, S.; Wang, T. Experimental verification of dynamic behavior for multi-link press mechanism with 2D revolute joint considering dry friction clearances and lubricated clearances. Nonlinear Dynamics 2022, 109(2), 707–29. [Google Scholar] [CrossRef]
- Robert, O.J.; Thomas, R.; Michael, B.; Christian, J.; Friedrich, B. Expanding the forming limits of DP780 by adjusting ram slide motions on a mechanical servo press. Procedia CIRP 2025, 134, 503–507. [Google Scholar] [CrossRef]
- Olaizola, J.; Bouganis, C.S.; De, A.E.S.; Iturrospe, A.; Abete, J.M. Real-time servo press force estimation based on dual particle filter. IEEE TransactionsIndustrial Electronics 2020, 67(5), 4088–97. [Google Scholar] [CrossRef]
- Wang, J.; Wang, Y.; Wu, K.; Ni, J.; Zheng, H.; Sun, Y. Electromechanical coupling dynamic modeling and dynamic response analysis of servo press. International Journal of Non-Linear Mechanics 2025, 173, 104712. [Google Scholar] [CrossRef]
- Halicioglu, R.; Dulger, L.C.; Bozdana, A.T. Modeling, design, and implementation of a servo press for metal-forming applica-tion. Int J Adv Manuf Technol. 2017, 91, 2689–2700. [Google Scholar] [CrossRef]
- Zhai, H.; Zhang, Y.J.; Song, Z.A.; Zang, C.Y.; Zhang, Q.L.; Lv, P.; Li, J.J. The influence of dynamic characteristics of six-bar linkage mechanical press transmission system on the accuracy of slide. Materials Research Proceedings 2024, 44, 41–51. [Google Scholar]
- Cheng, Y.Y.; Li, W.W.; Chen, M.F.; Chen, Y. Research on optimization design of six-rod main transmission mechanism of Adams warm forging servo press. Forging & Stamping Technology 2020, 45, 112–116. [Google Scholar]
- Xu, T.; Xia, Q.X.; Long, J.C.; Long, X.B. A study on multi-domain modeling and simulation of precision high-speed servo nu-merical control punching press. In Proceedings of the Institution of Mechanical Engineers Part I Journal of Systems and Control Engi-neering, 2018. [Google Scholar]
- Li, J.; Wang, Z.; Song, Q.Y. Parameter calibration of main transmission system for heavy-duty servo press. Forming & Stamping Technology 2022, 12, 148–153. [Google Scholar]
- Jiang, S.; Chen, X. Test study and nonlinear dynamic analysis of planar multi-link mechanism with compound clearances. Eur J Mech A Solids 2021, 88, 104260. [Google Scholar] [CrossRef]
- Zhou, J.; GoodAll, R.; Ren, L. Influences of car body vertical flexibility on ride quality of passenger railway vehicles. Proceedings of the Institution of Mechanical Engineers, Part F: Journal of Rail and Rapid Transit. 2009, 223, 461−471. [Google Scholar] [CrossRef]
- Wang, Q.; Li, H.Y.; Lu, L. Global sensitivity analysis of Earth-Moon transfer orbit parameters based on sobol method. International Journal of Aerospace Engineering 2022, 6587890. [Google Scholar] [CrossRef]
- Song, Q.Y.; Guo, B.F.; Li, J. Drawing motion profile planning and optimizing for heavy servo press. Int J Adv Manuf Technol. 2013, 69, 2819–2831. [Google Scholar]
- Guo, W.Z.; He, J.; Yue, Y. A new type of controllable mechanical press: motion control and experiment validation. J Manufac Sci Eng Trans ASME 2005, 127, 731–742. [Google Scholar] [CrossRef]
Figure 1.
Mechanical configuration of the servo press transmission system.
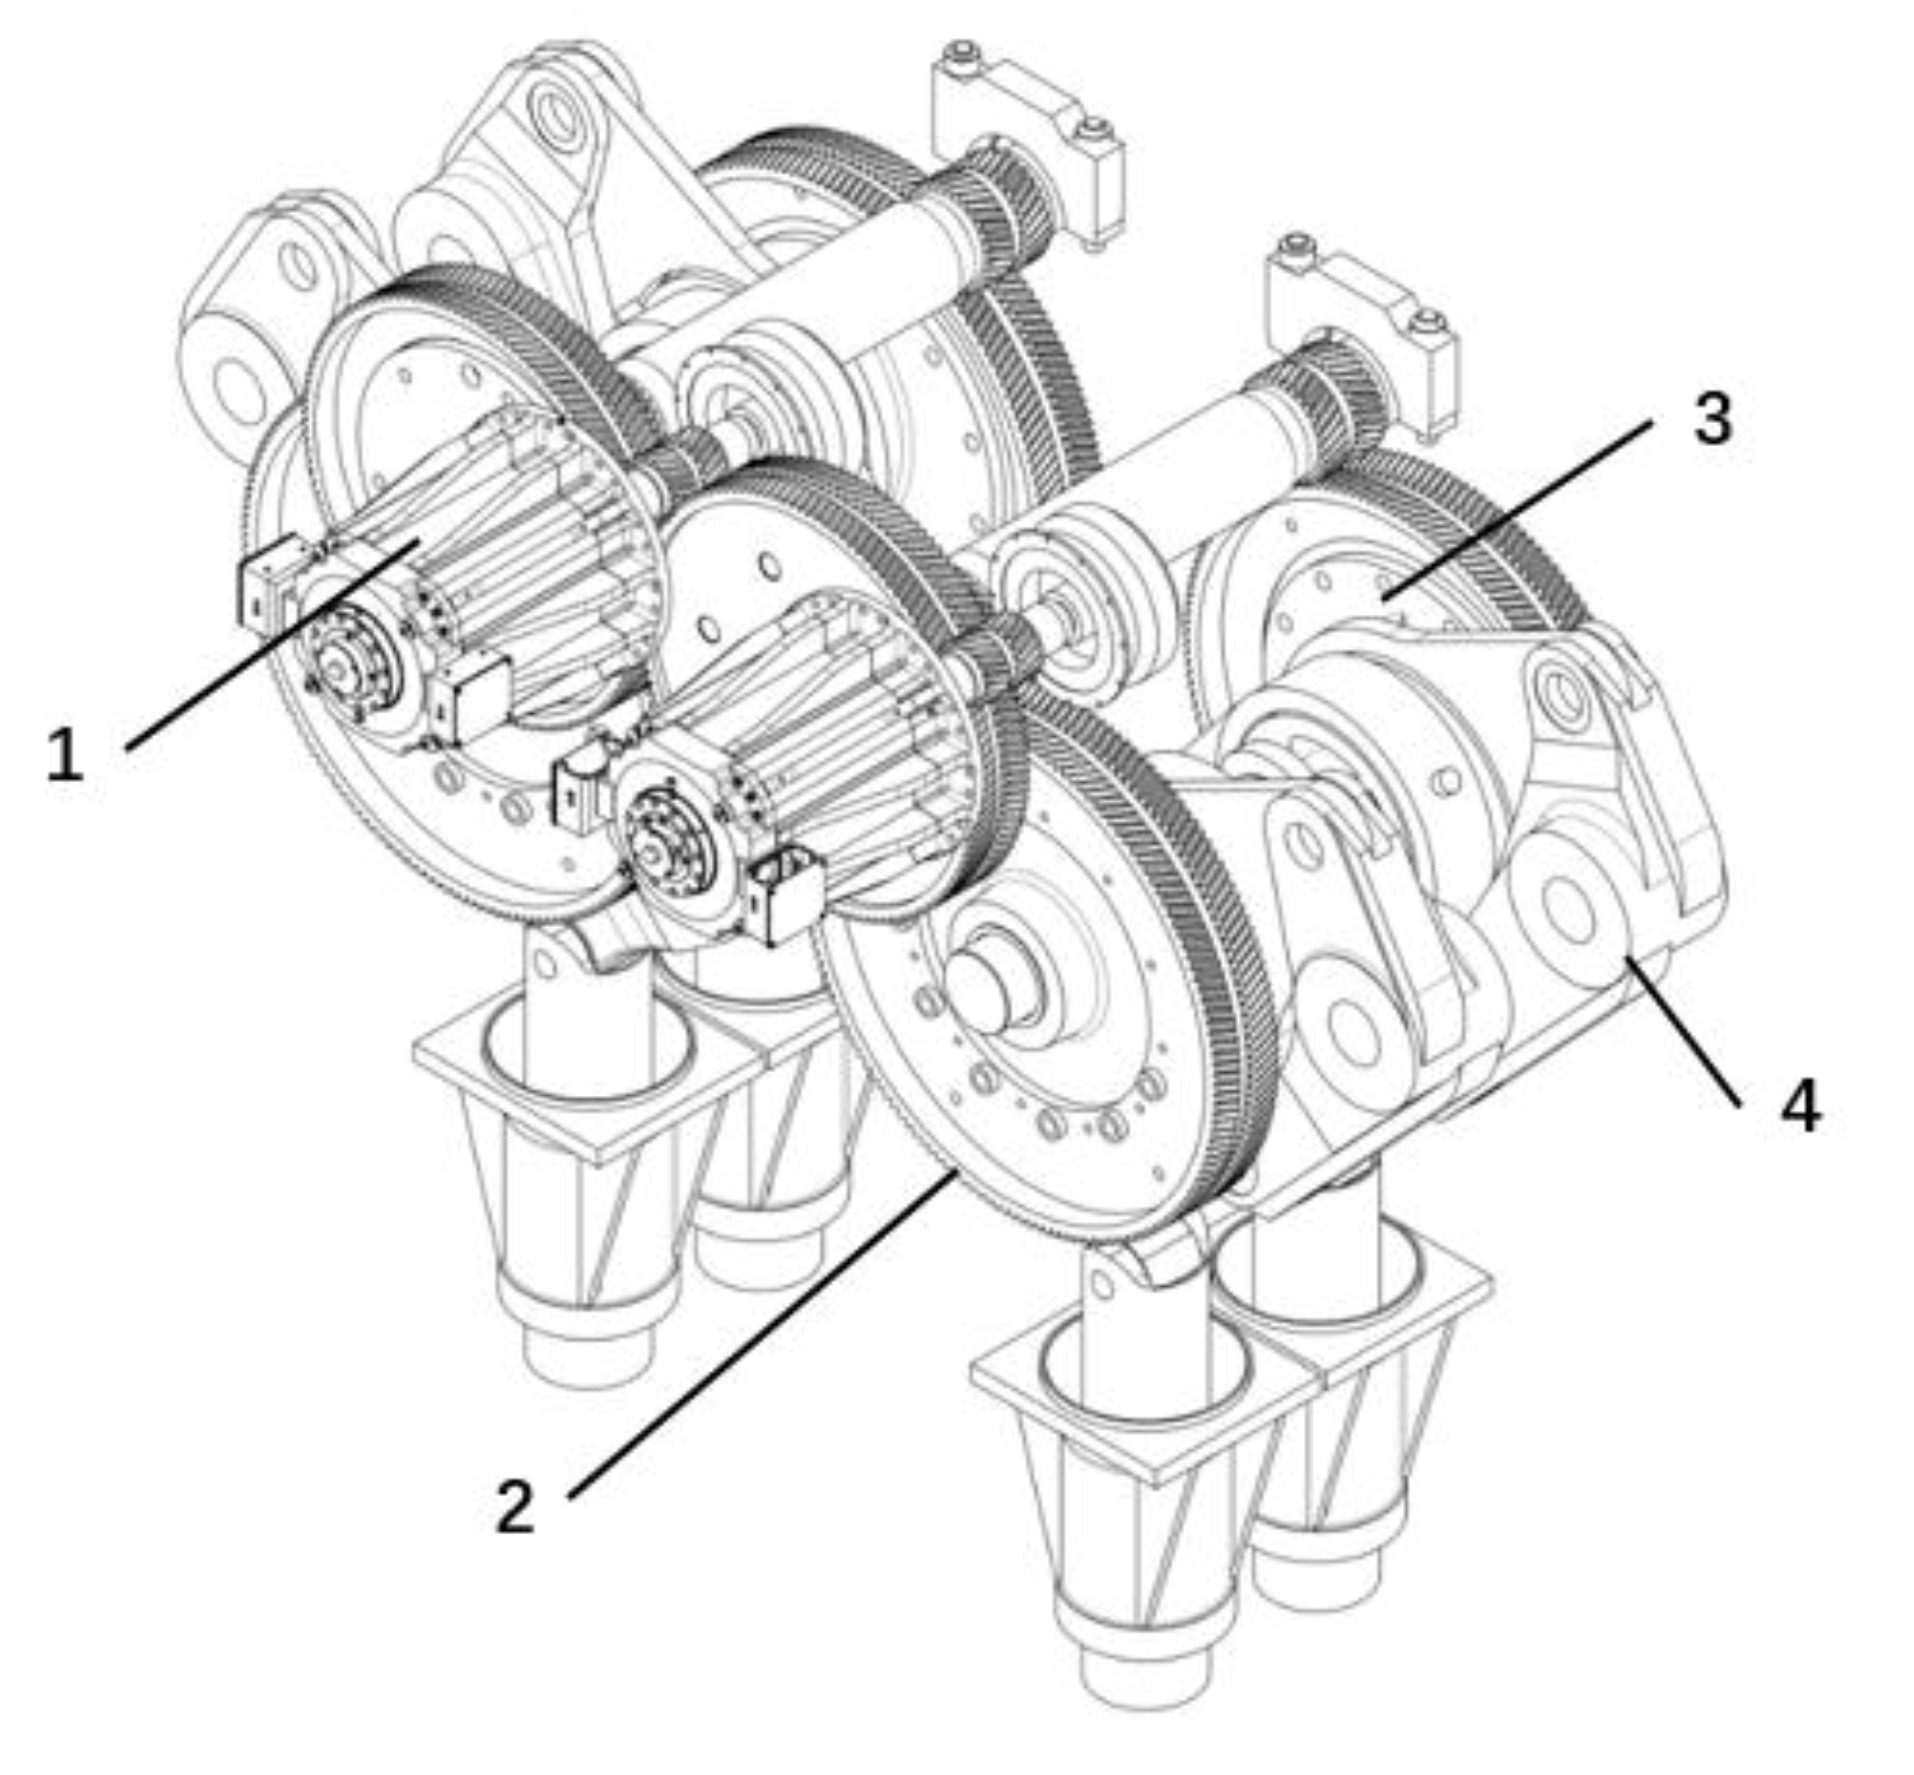
Figure 2.
Schematic diagram of the eight-bar mechanism.
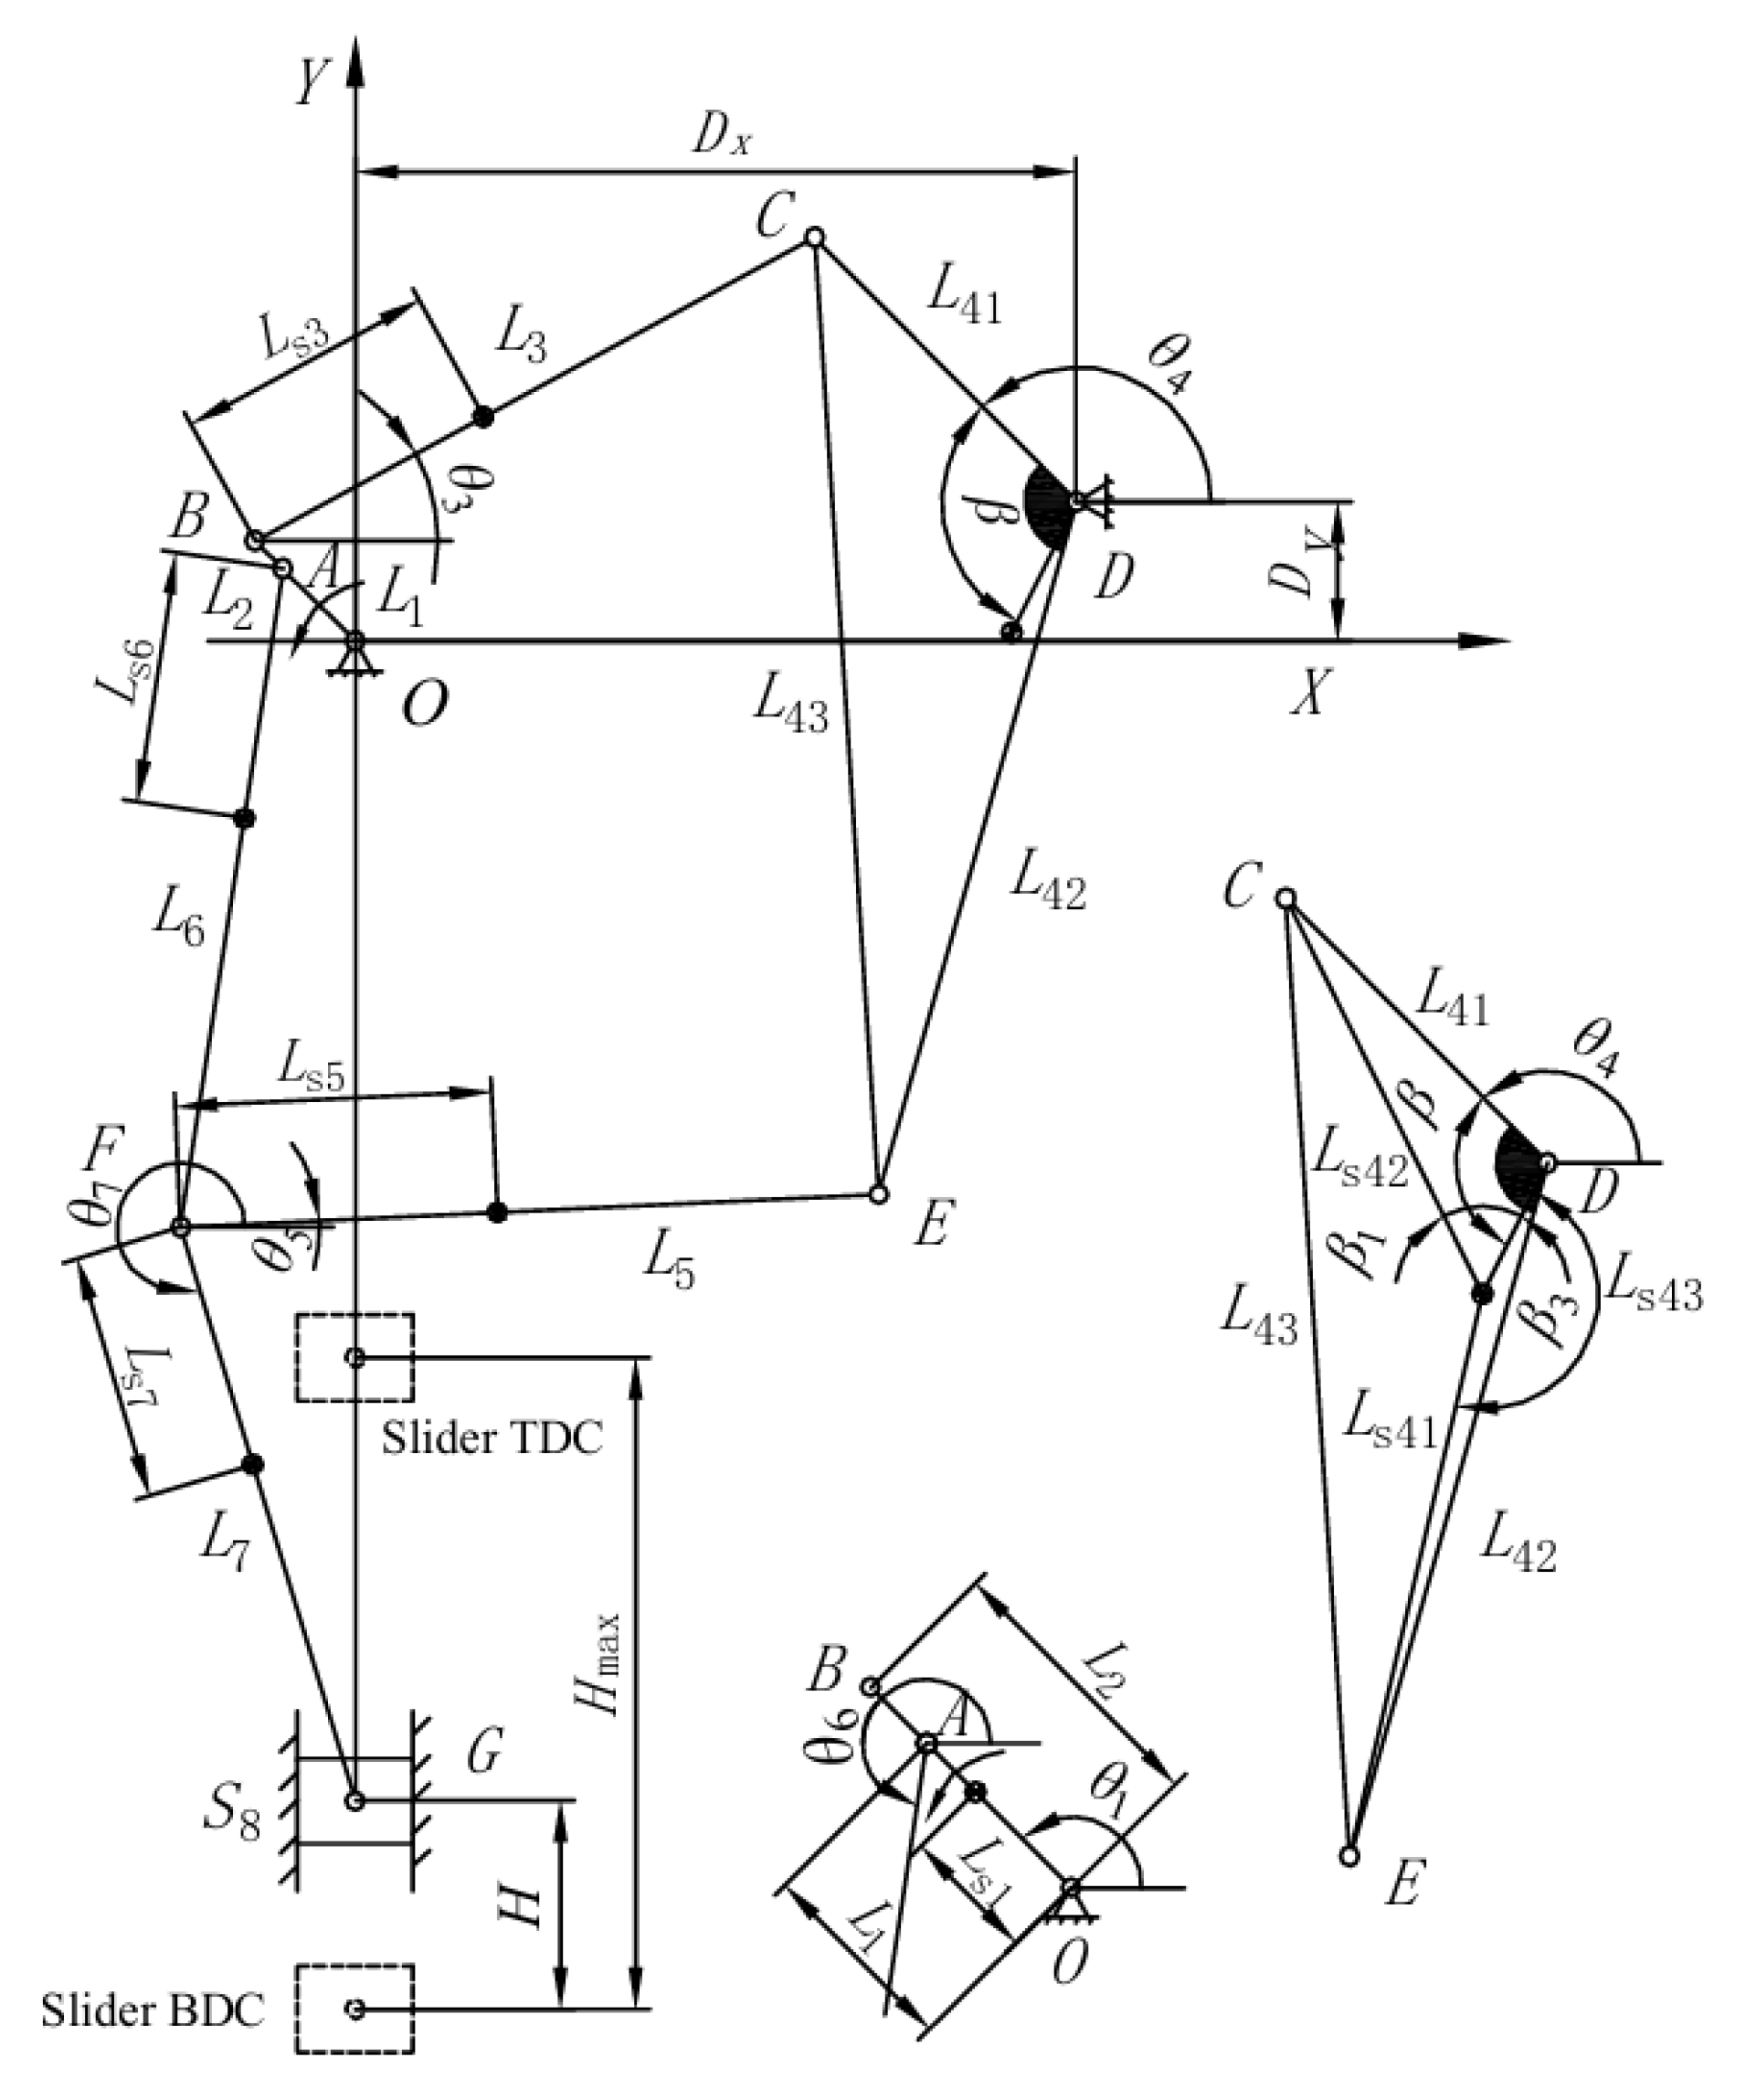
Figure 3.
Sobol sensitivity indices based on the (a) torque prediction accuracy response function , (b) transient overload risk assessment response function , (c) thermal limit response function , and (d) work response function .
Figure 3.
Sobol sensitivity indices based on the (a) torque prediction accuracy response function , (b) transient overload risk assessment response function , (c) thermal limit response function , and (d) work response function .
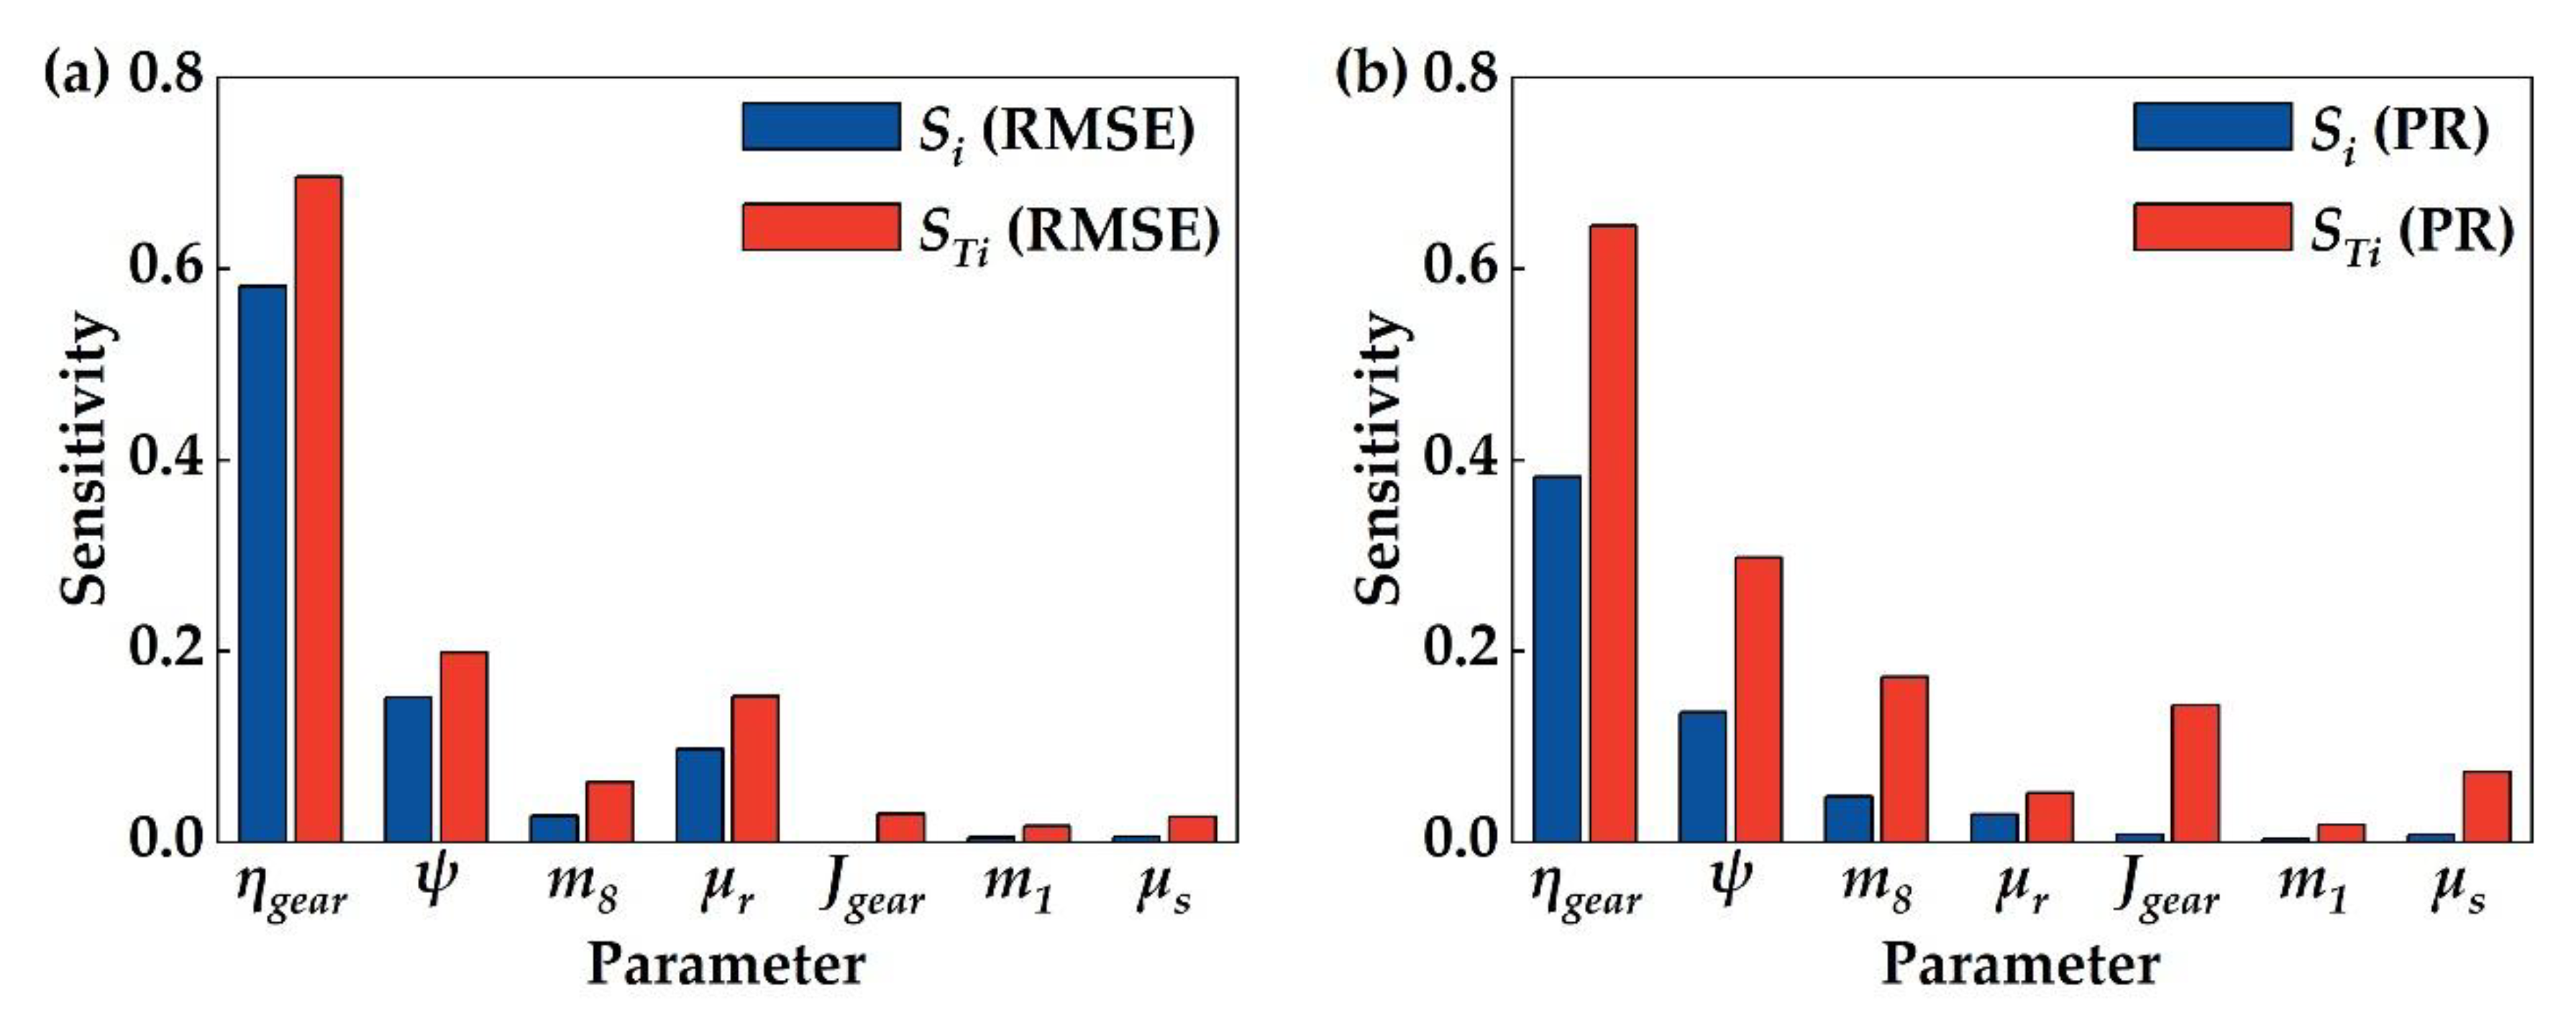
Figure 4.
An automated stamping line for automotive panels comprising one 25,000 kN heavy-duty servo press and three 10,000 kN mechanical presses.
Figure 4.
An automated stamping line for automotive panels comprising one 25,000 kN heavy-duty servo press and three 10,000 kN mechanical presses.
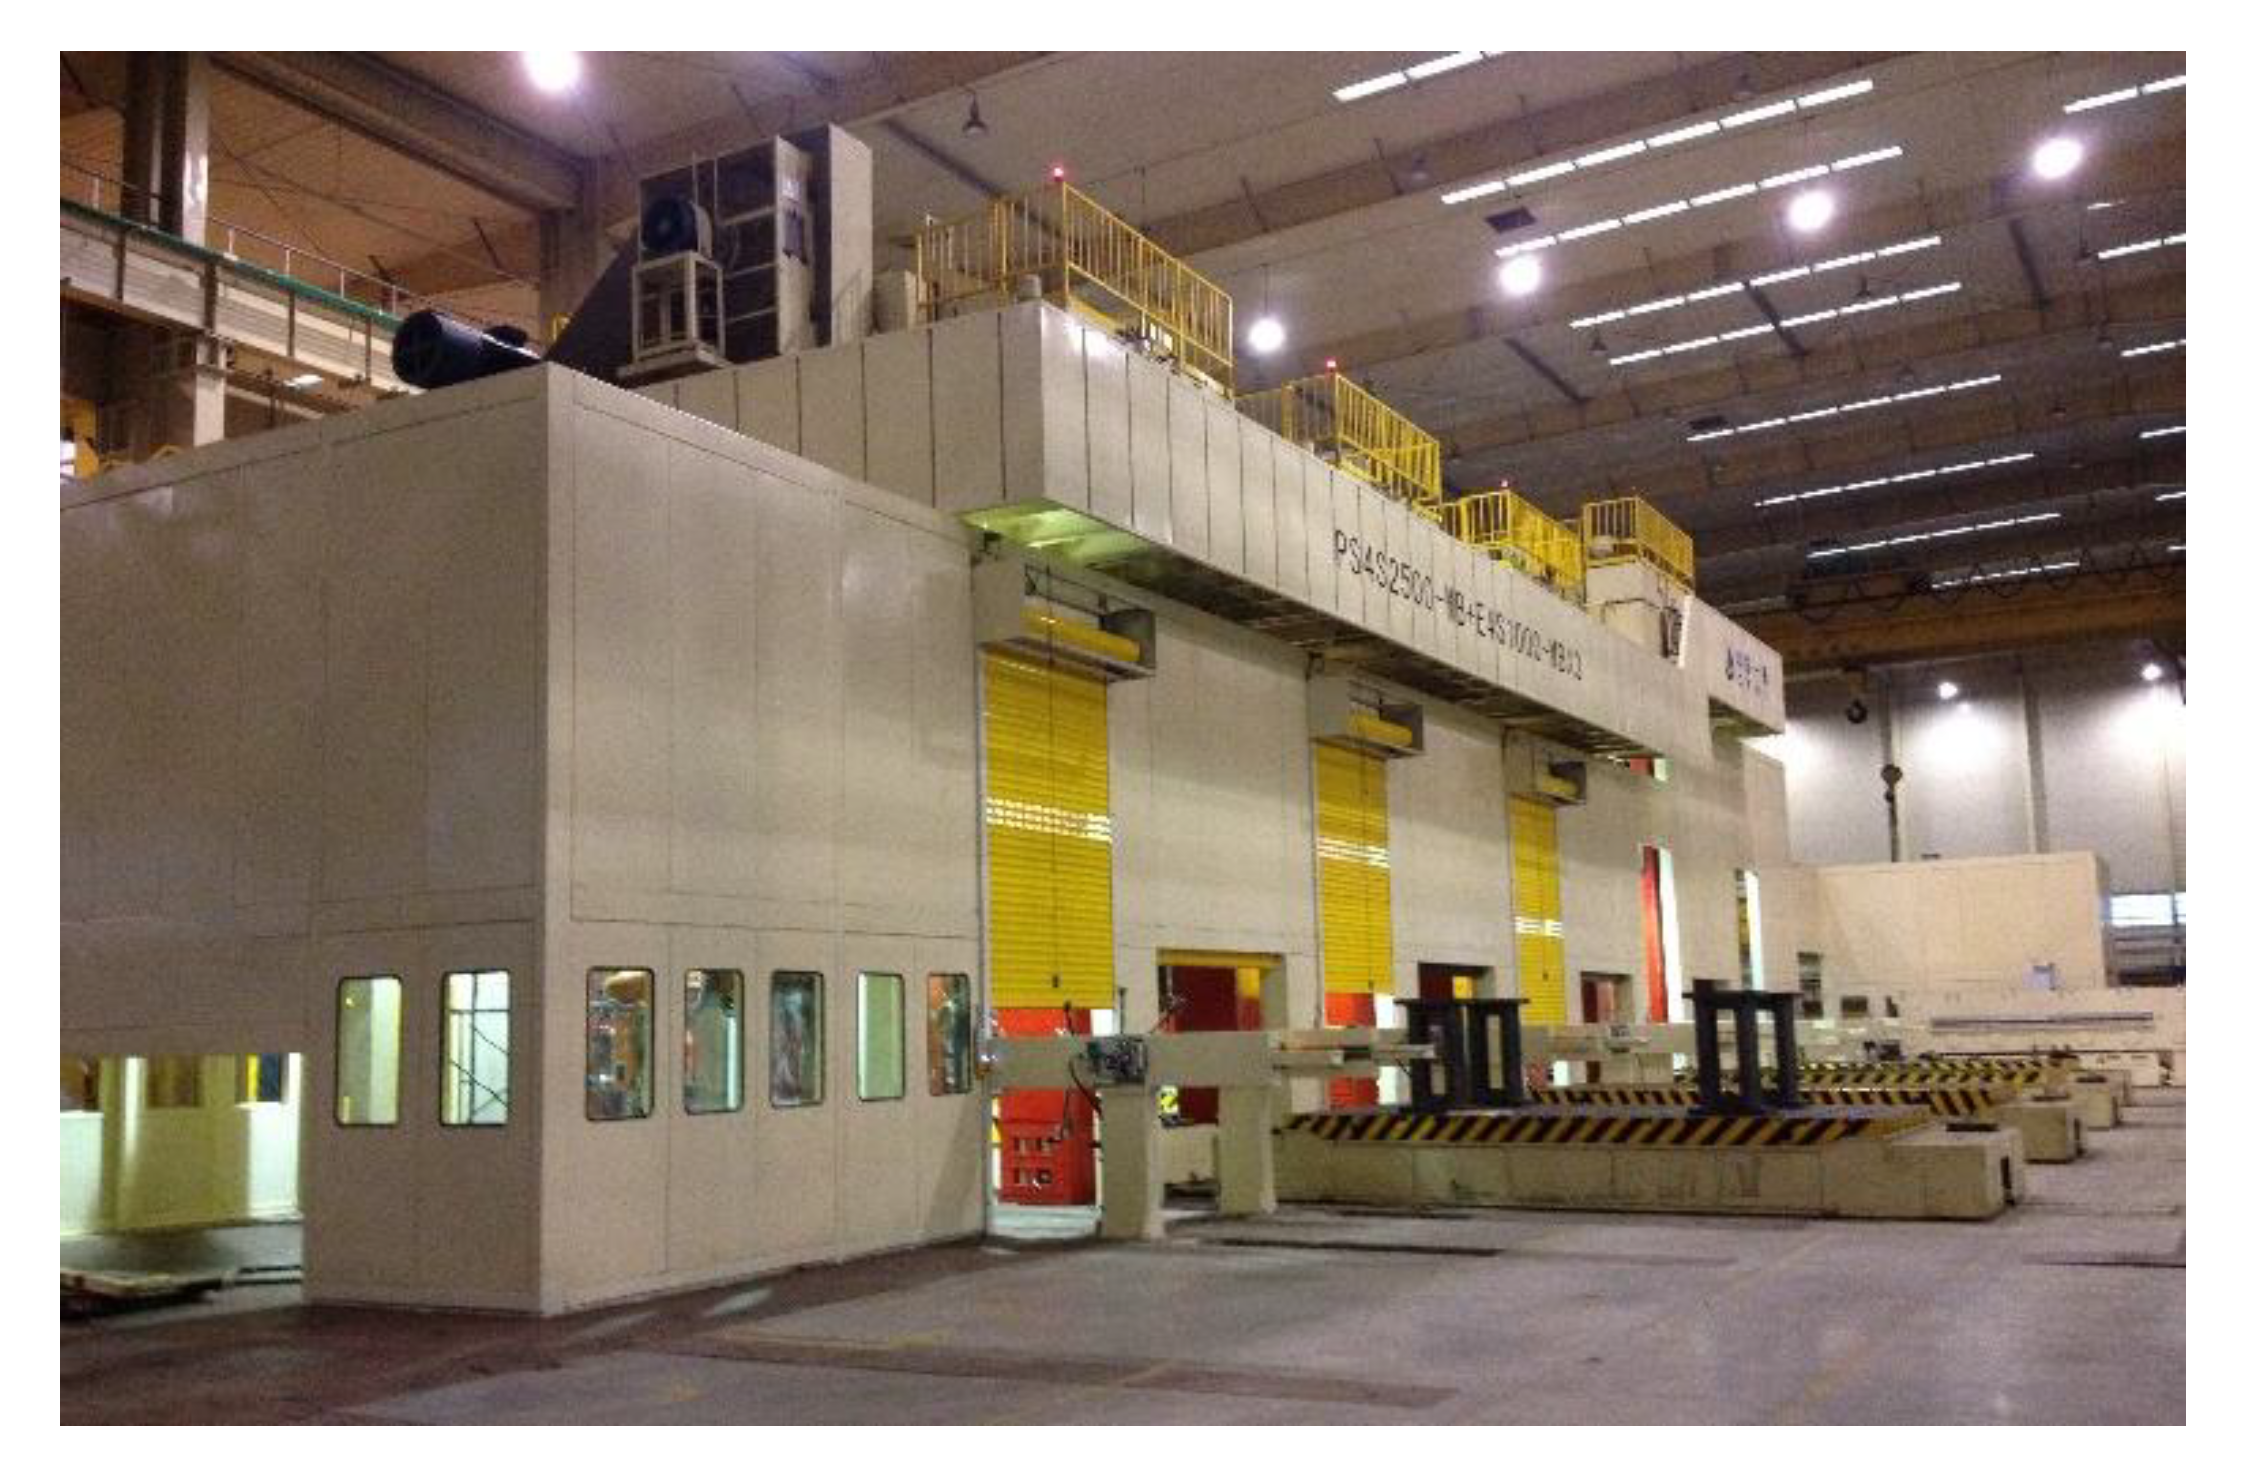
Figure 5.
Comparison of servo motor torques in one working cycle.
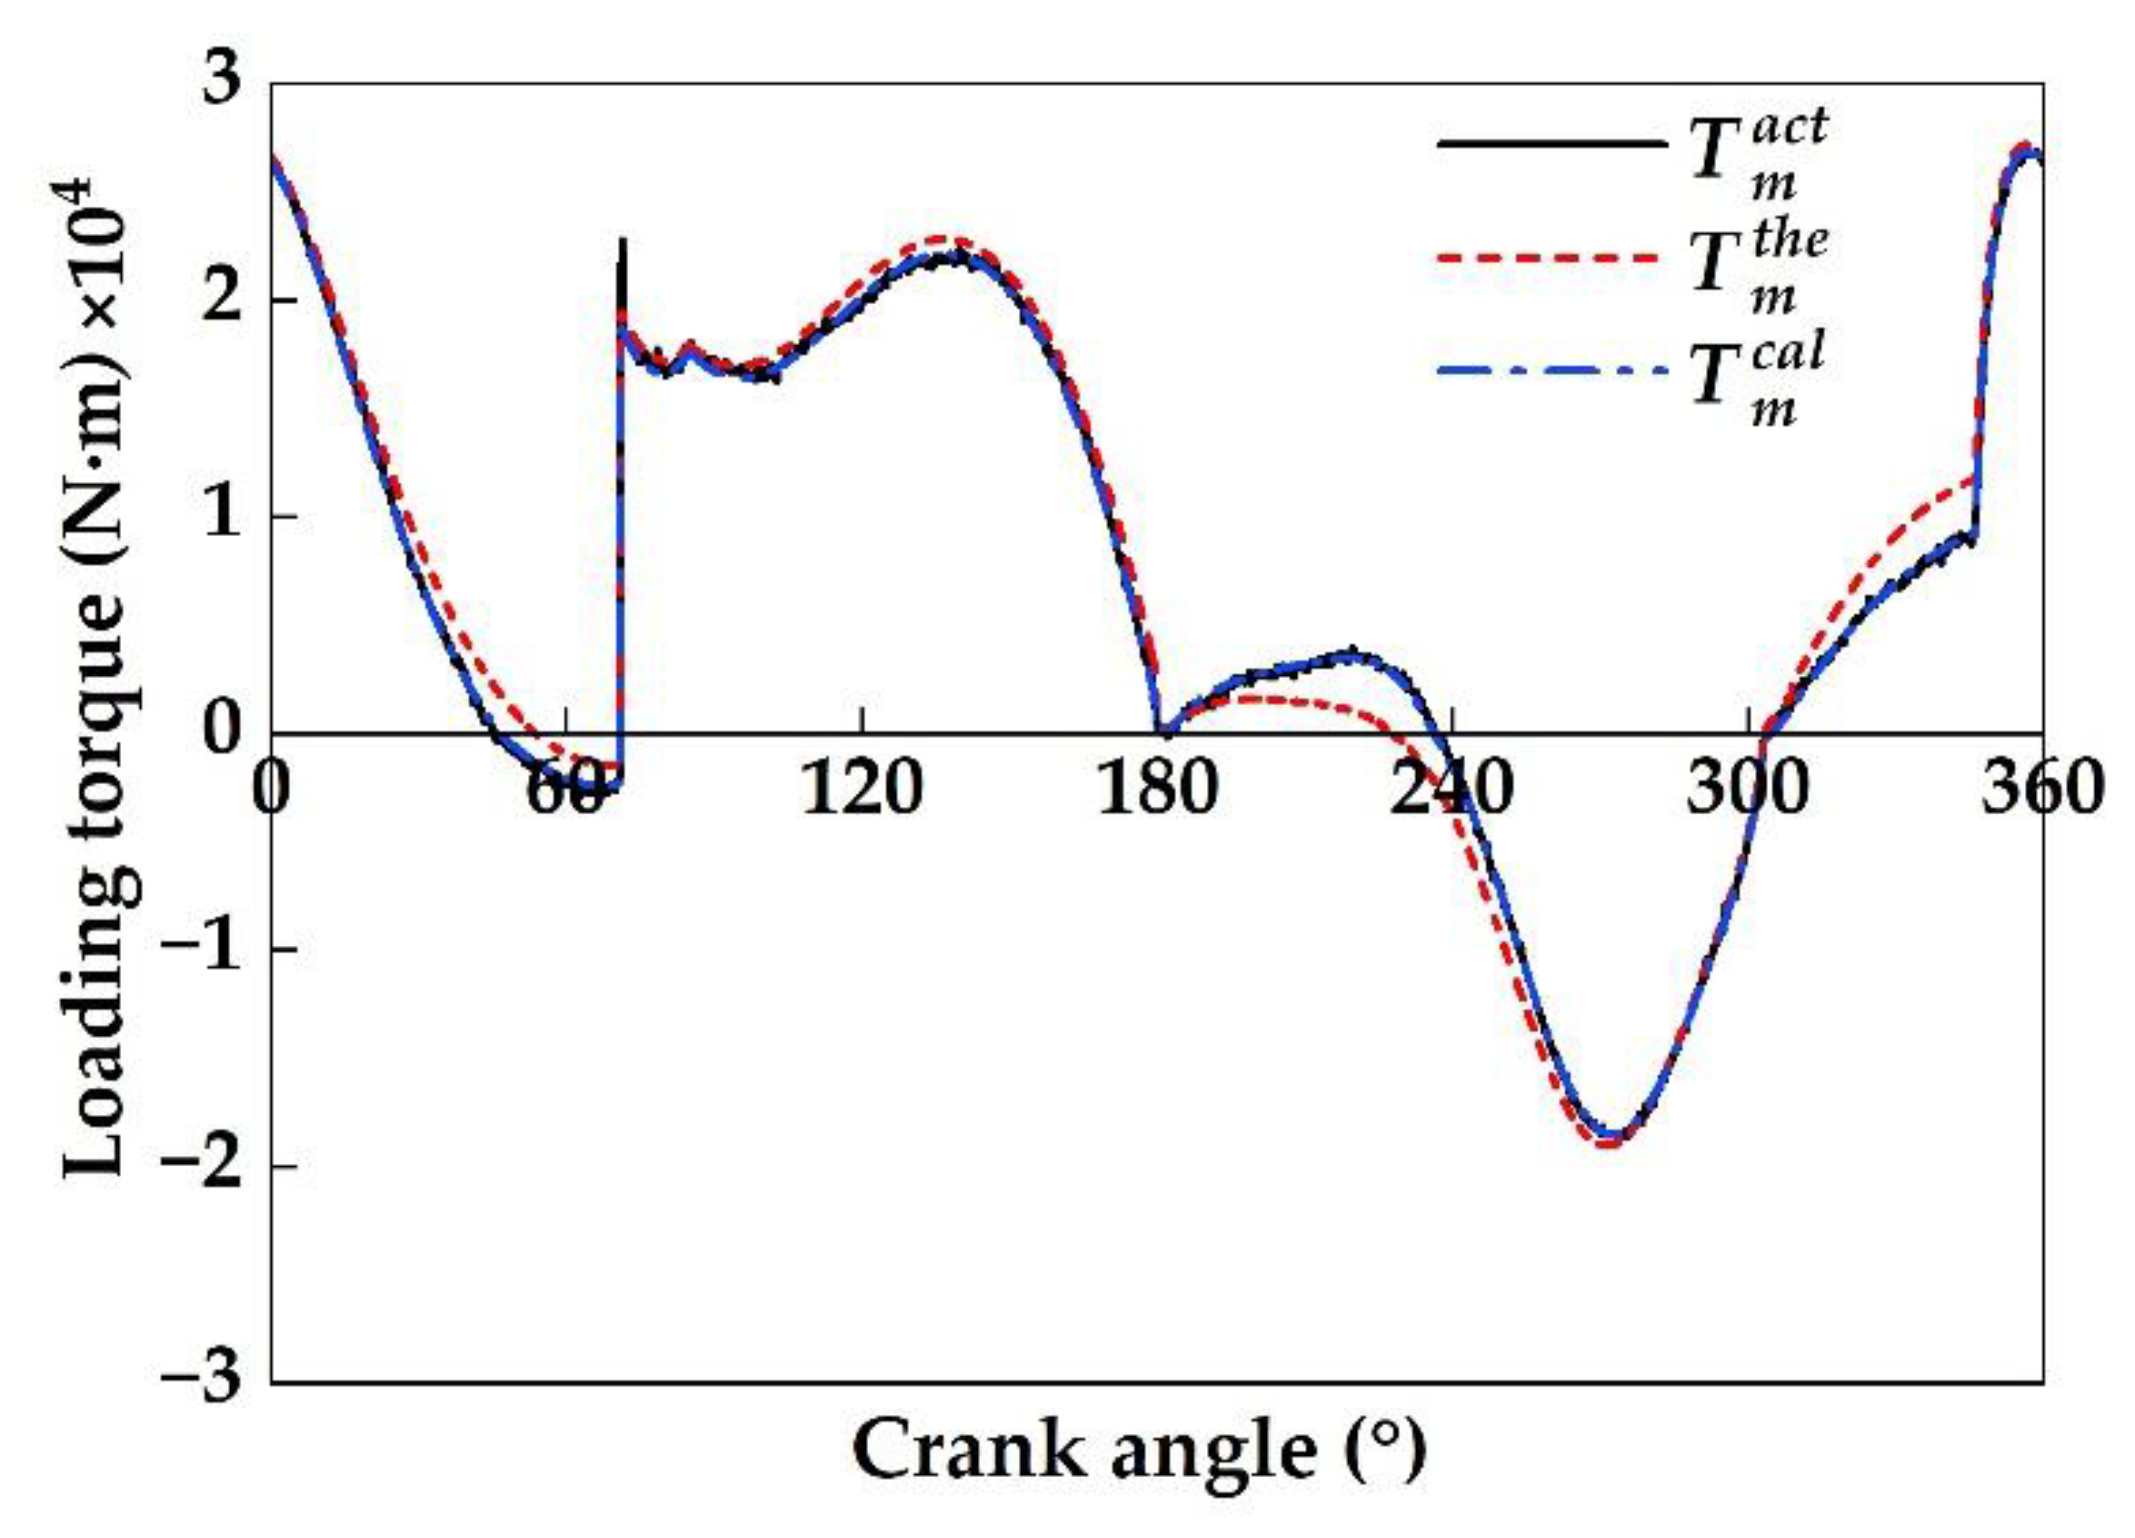
Figure 6.
Comparison of dynamic torque and thermal limit of servo motor based on theoretical and calibrated parameters
Figure 6.
Comparison of dynamic torque and thermal limit of servo motor based on theoretical and calibrated parameters
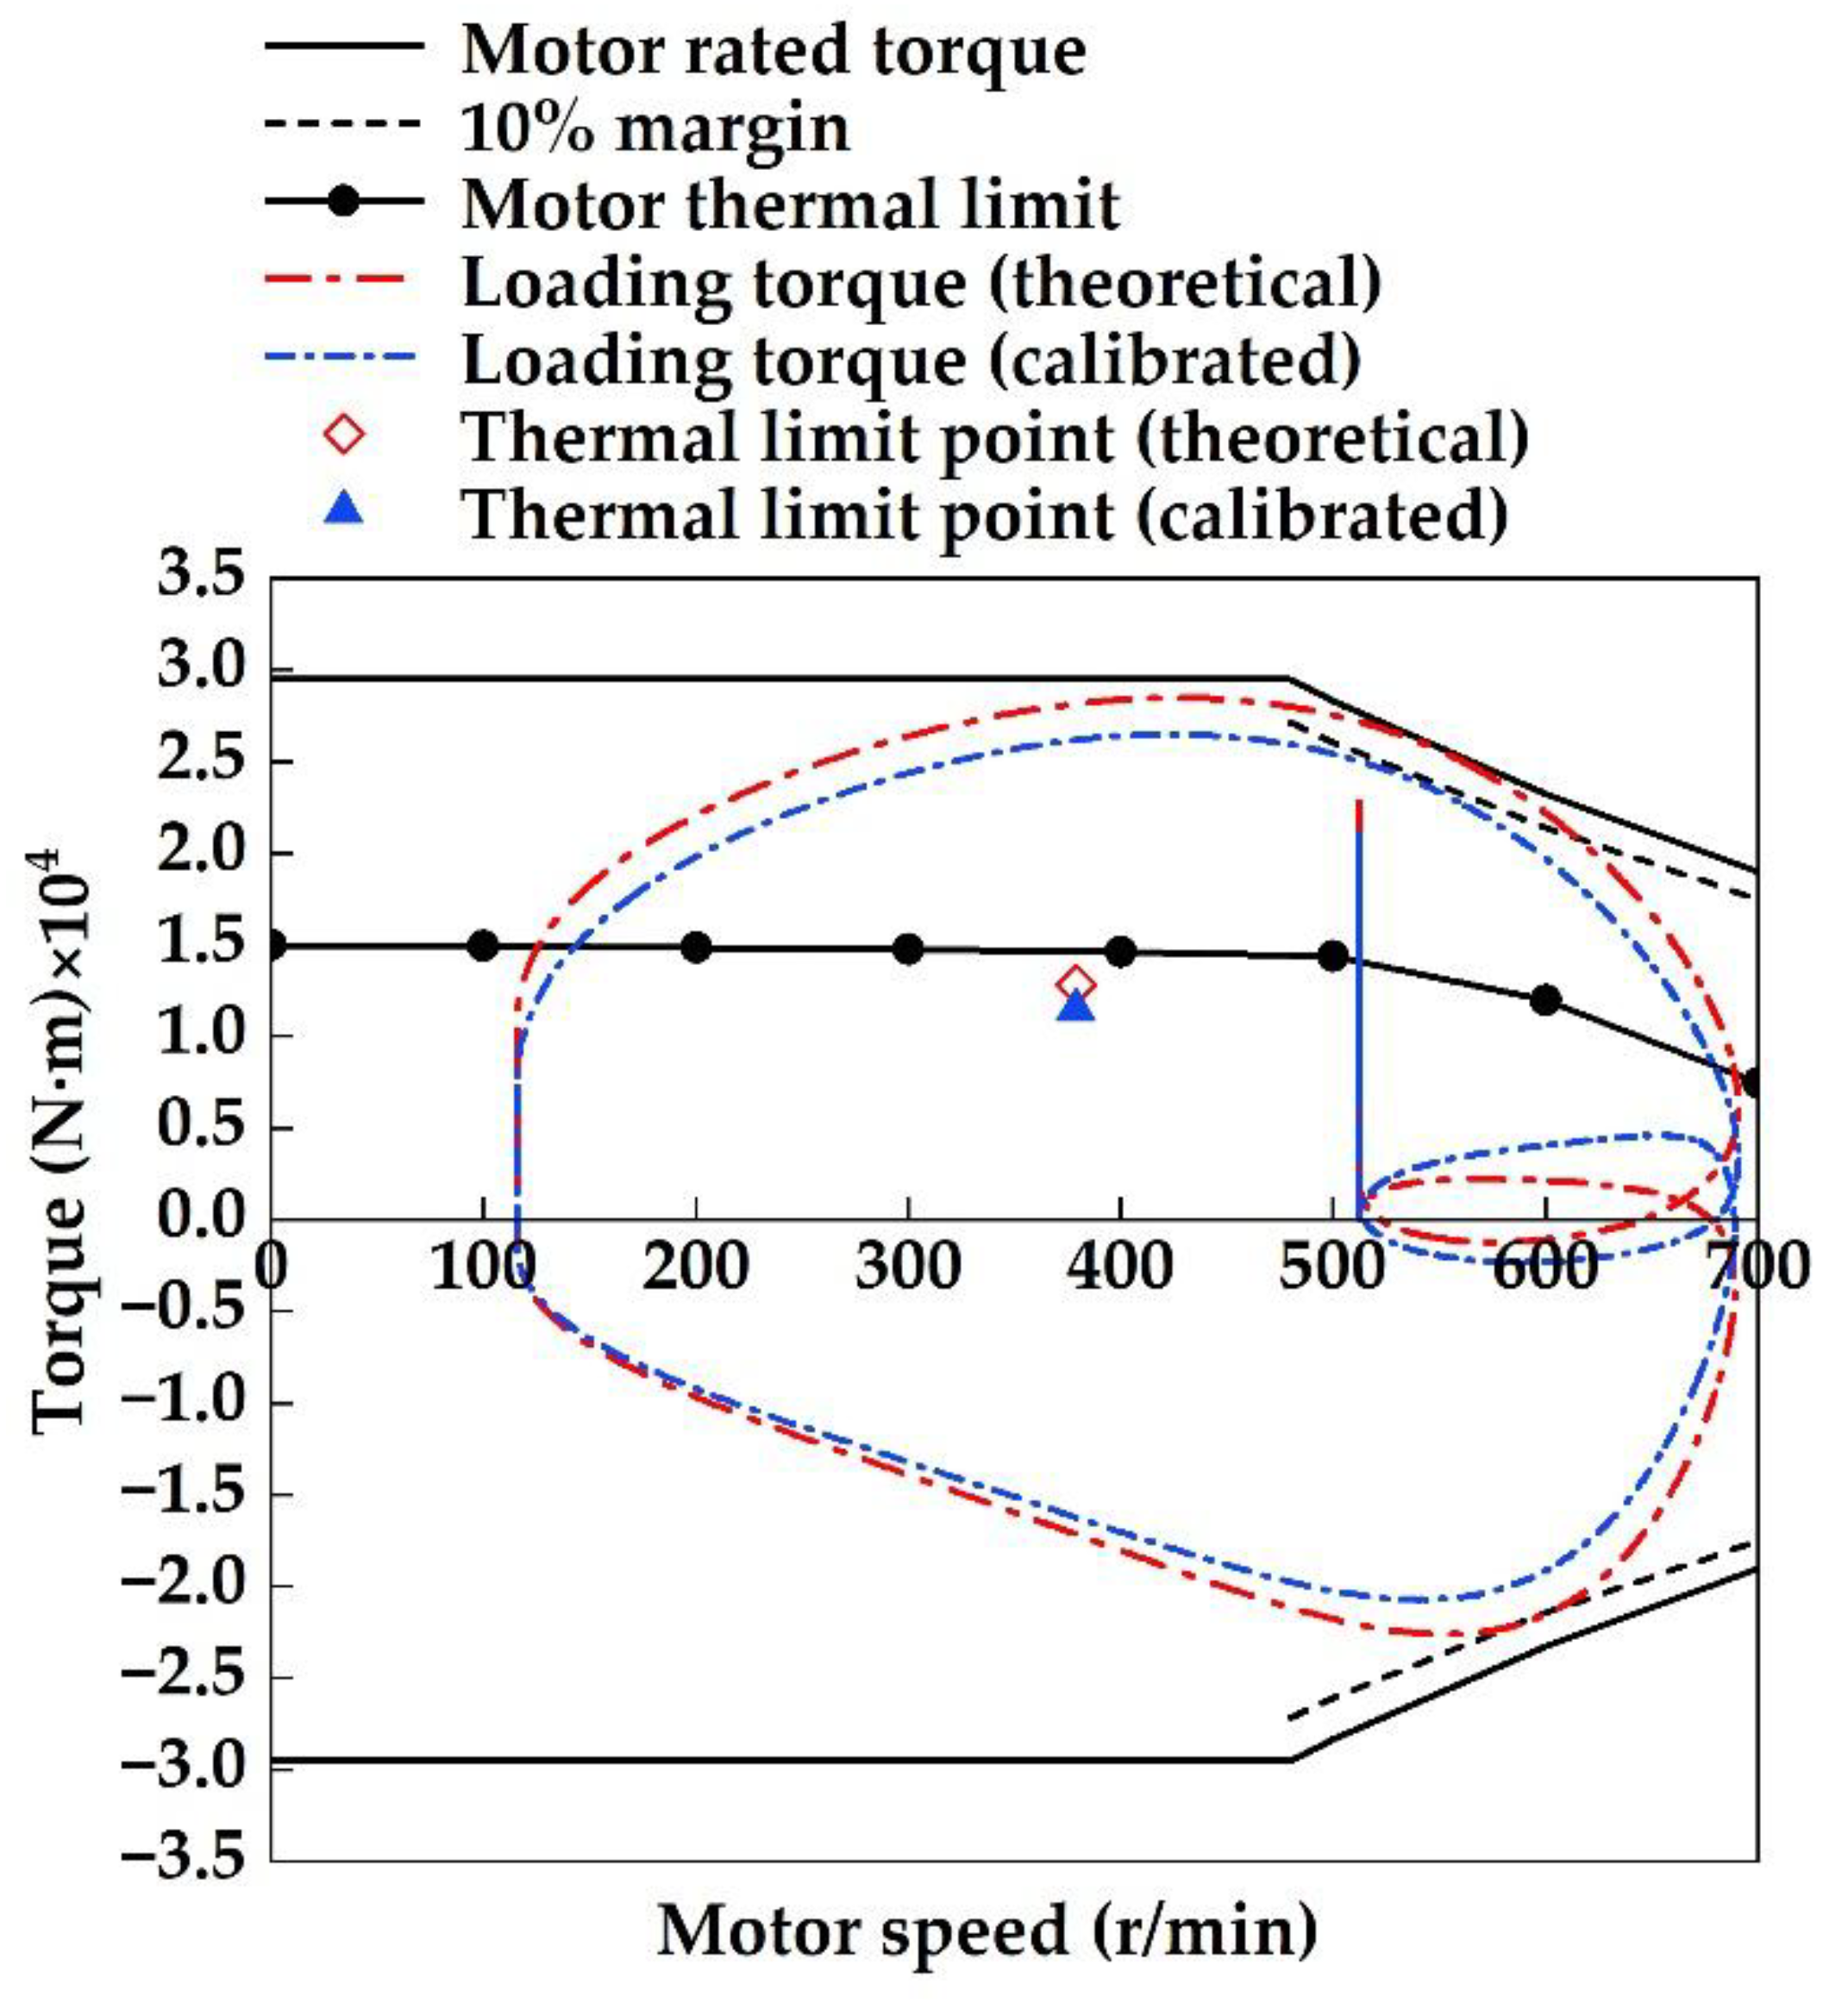
Figure 7.
Angular velocity and angular acceleration profiles of the servo motor under both parameter configurations.
Figure 7.
Angular velocity and angular acceleration profiles of the servo motor under both parameter configurations.
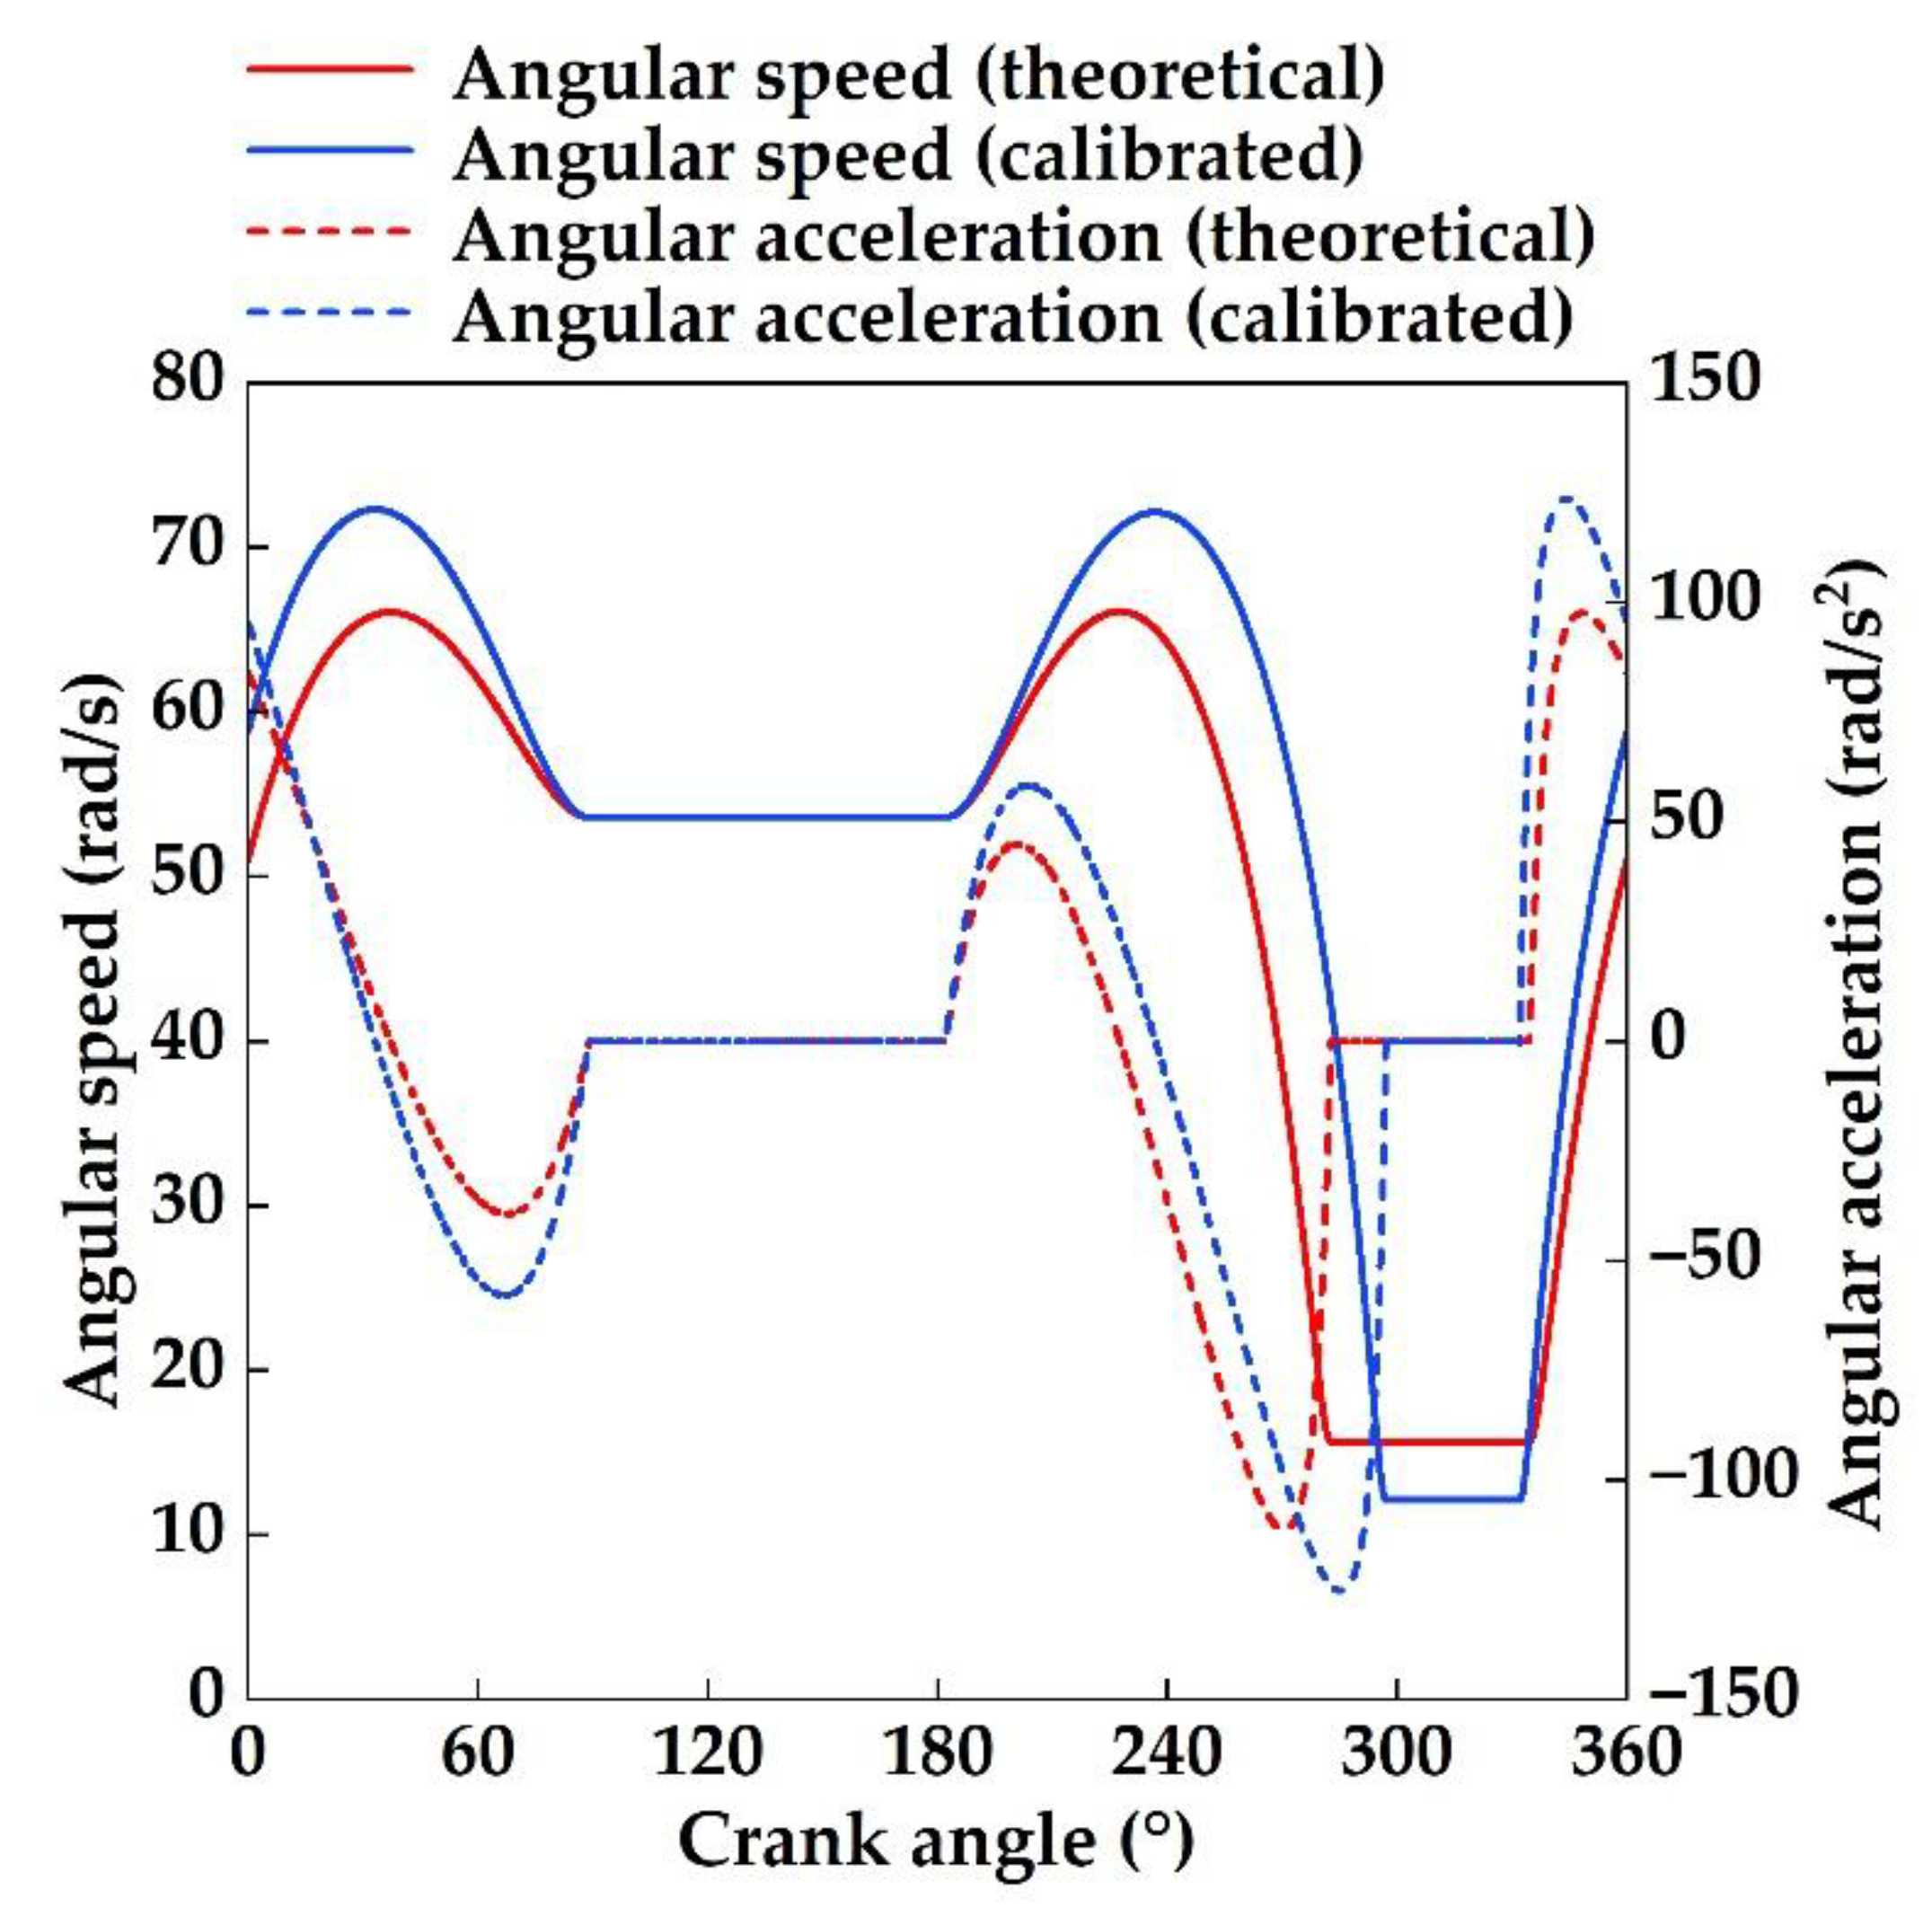

Table 1.
Parameters of the reduction gear system.
| Parameter | ParameterValue |
| (kg·m2) | 54.4 |
| 0.917 |
Table 2.
Geometric and mass-inertial parameters of the eight-bar mechanism.
| Component | Length (m) | Distance (m) | Mass(kg) | Moment of Inertia (kg·m2) |
| Link 1 | ||||
| Link 2 | ||||
| Link 3 | ||||
| Link 4 | ||||
| Link 5 | ||||
| Link 6 | ||||
| Link 7 | ||||
| Slide 8 | ||||
| Frame | ||||
| ° | ° | ° |
Table 3.
Frictional properties of kinematic pairs and radius of plain bearings.
| Parameter | Symbol | ParameterValue |
| Friction coefficient of revolute joint | 0.028 | |
| Viscous damping coefficient of revolute joint (m·s/rad) | 2.5 | |
| Friction coefficient of slide joint | 0.12 | |
| Viscous damping coefficient of slide joint (N·s/m) | 3000 | |
| Inner radius of bearing at joint O (m) | 0.18 | |
| Inner radius of bearing at joint A (m) | 0.4925 | |
| Inner radius of bearing at joint B (m) | 0.595 | |
| Inner radius of bearing at joint C (m) | 0.1 | |
| Inner radius of bearing at joint D (m) | 0.14 | |
| Inner radius of bearing at joint E (m) | 0.09 | |
| Inner radius of bearing at joint F1 (m) | 0.175 | |
| Inner radius of bearing at joint F2 (m) | 0.175 | |
| Inner radius of bearing at joint G (m) | 0.06 |
Table 4.
Calibrated parameters and relative errors of the transmission system.
| Parameter | Theoretical Value | CalibratedValue | Relative Error (%) |
| 0.917 | 0.842 | 8.9 | |
| 1.15 | 1.06 | 8.5 | |
| 0.028 | 0.012 | 133.3 | |
| 30595 | 32940 | -7.1 | |
| 54.4 | 60.6 | -10.2 | |
| 0.12 | 0.085 | 41.2 |
Disclaimer/Publisher’s Note: The statements, opinions and data contained in all publications are solely those of the individual author(s) and contributor(s) and not of MDPI and/or the editor(s). MDPI and/or the editor(s) disclaim responsibility for any injury to people or property resulting from any ideas, methods, instructions or instructions referred to in the content. |
© 2025 by the authors. Licensee MDPI, Basel, Switzerland. This article is an open access article distributed under the terms and conditions of the Creative Commons Attribution (CC BY) license (http://creativecommons.org/licenses/by/4.0/).
Copyright: This open access article is published under a Creative Commons CC BY 4.0 license, which permit the free download, distribution, and reuse, provided that the author and preprint are cited in any reuse.


