
Submitted:
11 December 2025
Posted:
12 December 2025
You are already at the latest version
Abstract
The design of aircraft components is a complex process that must simultaneously ac-count for environmental impact, manufacturability, cost and structural performance to meet modern regulatory requirements and sustainability objectives. When these factors are integrated from the early design stages, the approach transcends traditional eco-design and becomes a genuinely sustainability-oriented design methodology. This study proposes a sustainability-driven design framework for aircraft components and demonstrates its application to a fuselage panel consisting of a curved skin, four frames, seven stringers, and twenty-four clips. The design variables investigated in-clude the material selection, joining methods, and subcomponent thicknesses. The de-sign space is constructed through a combinatorial generation process coupled with compatibility and feasibility constraints. Sustainability criteria are evaluated using a combination of parametric Life Cycle Assessment (LCA) and Life Cycle Costing (LCC) regression models, parametric Finite Element Analysis (FEA), and Random Forest surrogate modeling trained on a stratified set of simulation results. Two methodolog-ical pathways are introduced: 1. Cluster-based optimization, involving customized clustering followed by multi-criteria decision-making (MCDM) within each cluster. 2. Global optimization, performed across the full decision matrix using Pareto front analysis and MCDM techniques. A stability analysis of five objective-weighting methods and four normalization techniques is conducted to identify the most robust methodological configuration. The results—based on a full cradle-to-grave assessment that includes the use phase over a 30-year A319 aircraft operational lifetime—show that the thermoplastic CFRP panel joined by welding emerges as the most sustainable design alternative.
Keywords:
sustainability assessment
; life cycle assessment (LCA)
; life cycle costing (LCC)
; finite element analysis (FEA)
; surrogate modeling
; multi-criteria decision-making (MCDM)
; R-TOPSIS
; Pareto optimization
; clustering analysis
; aircraft fuselage panel
1. Introduction
Carbon-fiber-reinforced polymers (CFRPs) are increasingly used in aircraft structures because they offer exceptional strength-to-weight ratios, corrosion resistance, and design flexibility compared with traditional metallic alloys [1]. Their reduced weight directly lowers fuel consumption and CO2 emissions over an aircraft’s lifetime, making them a key enabler of more sustainable aviation. CFRPs also have superior fatigue and corrosion performance, which extends structural service life and reduces maintenance frequency, material waste, and downtime. Although their end-of-life recyclability remains a challenge, ongoing advances in composite recycling and reuse are improving the sustainability profile of CFRP-intensive aircraft. Overall, the adoption of CFRPs significantly contributes to greener, more energy-efficient airframes while encouraging the development of circular-economy practices in aerospace materials [1].
The integration of sustainability into engineering design has advanced substantially over the past three decades. The origins of Eco-Design can be traced to the broader family of “Design for X” methodologies that emerged in the late twentieth century. In the 1990s, Design for Environment (DfE) was introduced as one of the first systematic approaches to incorporating ecological considerations into product development [2]. Building on these early practices, Eco-Design sought to reduce environmental impacts through product-level improvements but remained primarily focused on ecological aspects. Karlsson and Luttropp [2] explicitly distinguish Eco-Design from sustainable design, emphasizing that sustainability-oriented design must additionally account for economic and social dimensions.
In aerospace, early applications of sustainability-related design methodologies focused primarily on narrow objectives. Kassapoglou [3,4,5] performed cost–performance optimization of fuselage structures using analytical panel models, cost functions, and optimization algorithms to investigate weight–cost trade-offs. Corvino et al. [6] applied genetic algorithms to the multi-objective optimization of stiffened composite panels, addressing both structural weight and life cycle cost. At the aircraft level, Iemma et al. [7] developed the FRIDA toolbox, which integrates aerodynamic, structural, aeroelastic, acoustic, and financial models with Particle Swarm Optimization (PSO) and Non-Dominated Sorting Genetic Algorithm II (NSGA-II). Similarly, Jimenez and Mavris [8] used surrogate modeling and NSGA-II to evaluate 91 candidate technologies for a Boeing 777-200 baseline, examining trade-offs involving fuel burn, NOx emissions, and noise.
While these studies emphasized performance and cost trade-offs, more recent research has integrated Life cycle assessment (LCA) to capture environmental dimensions [9,10]. Atescan-Yuksek et al. [11] compared aluminum and CFRP wing panels, accounting for manufacturing and end-of-life processes, and showed that CFRPs surpass aluminum only after sufficiently long use phases. At the system level, Pollet et al. [12] incorporated a generic LCA module into FAST-OAD, a conceptual aircraft design tool, whereas Parolin et al. [13] developed a streamlined Python-based framework using ReCiPe 2008 and Ecoinvent 3.6 for early-stage design scenario evaluation. Collectively, these contributions span detailed component-level LCAs to simplified methodologies tailored for preliminary design and rapid decision making.
In parallel, Multi-Criteria Decision-Making (MCDM) methods have gained significant traction as complementary tools for balancing diverse sustainability criteria. Emovon and Oghenenyerov [14] reviewed 55 MCDM studies, highlighting the prevalence of hybrid approaches such as Analytic Hierarchy Process–Technique for Order Preference by Similarity to Ideal Solution (AHP–TOPSIS) and VIKOR and noting that cost is often treated as the dominant criterion. Junaid et al. [15] applied AHP–TOPSIS to rank polymers for a UAV inlet duct, while Malefaki et al. [16] evaluated 4,487 hat-stiffened panel alternatives across five sustainability pillars using multiple MCDM techniques, validating their findings through correlation and sensitivity analyses. Along similar lines, Anagnostopoulou et al. [17] developed a sustainability assessment framework for fuselage panels that integrates cradle-to-grave LCA, Life cycle costing (LCC), and Finite Element Analysis (FEA) with MCDM tools and a range of objective weighting methods, including Standard Deviation (SD), Coefficient of Variation (COV), Entropy, CRiteria Importance Through Intercriteria Correlation (CRITIC), and MEthod based on the Removal Effects of Criteria (MEREC). Their framework also incorporated ranking-stability analysis, with thermoplastic CFRP consistently emerging as one of the most sustainable configurations. Filippatos et al. [18] further advanced sustainability-driven methodologies for stiffened composite panels. Their framework embedded five sustainability pillars—performance, cost, environmental impact, circularity, and social impact—within the conceptual design phase. It was later extended to compare pristine versus recycled CFRPs and subsequently consolidated into a sustainability index capable of accounting for multiple operational scenarios (e.g., kerosene vs. hydrogen use phases), revealing how material choices interact with different propulsion and mission contexts. At the same time, new computational strategies—particularly machine learning and topology optimization—have been explored to support sustainability-oriented design. Zhang et al. [19] combined neural network surrogate models, NSGA-III, and entropy–TOPSIS to optimize composite panel designs, whereas Kundu and Zhang [20] introduced a multi-material topology optimization framework that integrates performance, cost, and environmental considerations, enabling the substitution of low-stress regions with eco-friendly biomaterials such as bamboo. Beyond component-level analyses, system-wide sustainability perspectives have also evolved. Raihan [21] reviewed policies and technologies for aviation decarbonization, covering sustainable aviation fuels (SAFs), electric and hydrogen propulsion, lightweight composite structures, and modernization of Air Traffic Management (ATM). This broader vision aligns with major European research efforts: following Clean Sky and Clean Sky 2, Horizon Europe now supports large-scale demonstrators—including FASTER-H2, H2ELIOS, and ACAP—focused on hydrogen propulsion, cryogenic storage, and eco-designed fuselage structures, all pointing toward the Paris Agreement’s 2050 net-zero aviation target [22].
Overall, the existing literature demonstrates a clear evolution from early Eco-Design approaches toward fully sustainability-oriented optimization, integrating environmental, economic, and structural considerations. Aircraft subsystems—such as fuselage panels, wings, and pressurized tanks—have frequently served as benchmark cases, enabling the connection of optimization, machine learning, and decision-support tools with emerging climate targets and policy requirements. Despite this progress, most studies remain limited in scope, relying on relatively small design spaces or addressing only isolated aspects of sustainability. Comprehensive frameworks that simultaneously incorporate LCA, LCC, structural performance, and MCDM remain scarce, and the use of regression-based LCA/LCC acceleration combined with machine-learning surrogates for structural metrics is still largely unexplored. Addressing these gaps, the present study proposes a fully data-driven sustainability optimization framework and applies it to a large design space of more than 25,000 fuselage panel alternatives.
2. Technological Problem
This study focuses on optimizing the sustainability performance of a fuselage panel by integrating environmental, economic, and structural criteria into the design process. The proposed approach enables sustainability-driven optimization of the panel, using material selection, joining method, and thickness as the main design variables. The objective is to evaluate multiple design configurations and identify those that most effectively meet the sustainability goals. By incorporating all criteria within a unified assessment framework, the study systematically explores the design space, highlights the trade-offs among the different sustainability pillars, and identifies the most balanced and sustainable panel configurations.
2.1. Panel Configuration and Design Variables
The analyzed fuselage panel corresponds to the configuration defined in [17], where its geometry, subcomponent layout, and material candidates were originally established (Figure 1). In the present work, the same configuration is retained to ensure consistency, while the focus is shifted toward sustainability-oriented optimization. The optimization considers three key design variables: (a) the material assigned to each subcomponent, (b) the joining method between the skin and stiffeners, and (c) the thicknesses of the skin, stiffeners, and frames. The candidate options associated with each design variable are summarized in Table 1.
3. Optimization Framework
Building on the panel configuration and design variables introduced in Section 2, the proposed methodology establishes a structured framework for sustainability-driven optimization. Environmental, economic, and structural performance metrics are integrated into a consistent multi-criteria assessment process supported by both simulation-based and regression-based analyses. As illustrated in Figure 2, the methodology follows a sequence of interconnected steps that collectively support the sustainability optimization process, including:
- construction of the decision matrix,
- multi-criteria evaluation through normalization, weighting, and ranking, and
- the optimization phase, implemented through two complementary paths (Path A and Path B).
To ensure a comprehensive exploration of the design space, two complementary optimization paths are defined. Path A employs customized clustering based on environmental, cost, and structural performance characteristics, followed by Pareto filtering and R-TOPSIS—a robust variant of TOPSIS—to rank the alternatives within each cluster and identify representative top-performing designs. Path B applies Pareto filtering to the complete decision matrix and subsequently performs R-TOPSIS using objective weighting methods (e.g., SD, CRITIC, Entropy, MEREC) to determine the globally top-ranked sustainable alternatives. Together, these two paths capture both localized and global optima, offering deeper insight into the trade-offs among sustainability pillars.
4. Construction of Decision Matrix
The construction of the decision matrix constitutes the first step of the proposed sustainability-driven optimization framework. Each row of the matrix corresponds to a feasible design alternative for the fuselage panel, defined by specific combinations of discrete (material and joining method) and continuous (thickness) design variables. The columns represent the evaluation criteria—environmental, economic, and structural performance indicators—derived from parametric LCA, LCC, and FEA. Unlike the previous study, which evaluated only nine predefined panel variants, the present work systematically enumerates the full feasible design space of 25,410 alternatives while accounting for material-compatibility and manufacturing constraints. The subsections below describe the design variables, the constraints applied, and the combinatorial procedure used to construct this comprehensive decision matrix.
4.1. Design Space Definition
The design space definition involves the identification of all feasible combinations of discrete and continuous design variables that characterize the fuselage panel configuration under material-compatibility and manufacturing constraints. Each design alternative represents a unique combination of material selections, joining method, and component thicknesses, forming the foundation for constructing the decision matrix.
Design variables classification. The design variables can be partitioned into two categories:
where represents discrete variables and represents continuous variables.
Discrete design variables. The discrete variables encompass material selection and joining method choices:
where:
where TS stands for thermoset CFRP and TP stands for thermoplastic CFRP.
Continuous design variables. The continuous variables represent component thicknesses:
where
For computational tractability, the continuous variables are discretized with step size ∆t = 0.1 mm, resulting in:
4.2. Constraint Analysis
Constraints on material compatibility and joining methods significantly reduce the design space. These constraints are necessary to ensure manufacturing feasibility and structural integrity.
Material compatibility constraints. Material selection is governed by compatibility rules that prevent infeasible combinations across subcomponents.
For aluminum configurations, both Al2024 and Al7075 can be freely combined, forming the aluminum configuration space:
where S represents the set of valid material combinations.
For composite configurations, homogeneity across all subcomponents is required to ensure manufacturing and thermal compatibility. The corresponding feasible sets are defined as
Each composite system permits only one material combination:
The complete set of valid material combinations is:
Since these sets are mutually exclusive, the total cardinality is:
Joining method constraints. The joining method selection depends on material system compatibility requirements. Aluminum configurations support both welding and bonding methods as described by Eq. (22). The thermoset composites are limited to bonding only due to their cross-linked molecular structure as described by Eq. (23). Thermoplastic composites support both welding and bonding methods as described by Eq. (24).
The constraint interaction between materials and joining methods can be expressed as:
4.3. Combinatorial Analysis
This section presents the systematic enumeration of all feasible design alternatives by combining the discrete and continuous design variables. The number of valid discrete configurations is obtained as the sum of all material–joining combinations corresponding to each material family, while the number of continuous configurations results from the product of the discretized thickness domains. Multiplying these two quantities yields the complete feasible design space cardinality. The detailed expressions and computed values are given in Eq. (26)-(29). The outcome of this analysis confirms that, under the defined material-compatibility and joining-method constraints, the total number of feasible panel configurations equals to 25,410.
where is the design space.
4.4. Validation
To validate the theoretical calculations, the complete design space was generated and analyzed using a MATLAB-based enumeration procedure. The resulting dataset contains exactly 25,410 design alternatives, fully confirming the theoretical estimates. Table 2 lists the distribution of alternatives across the different material families, while Table 3 summarizes their distribution with respect to the available joining methods.
4.4.1. Constraint Compliance Verification
Material compatibility verification. The analysis of the dataset confirms perfect compliance with material compatibility constraints:
- Aluminum configurations: All 16 possible Al2024/Al7075 across the four components are present, each appearing in exactly 1,452 instances.
- TS configurations: Only the homogeneous combination (TS-TS-TS-TS) appears, with exactly 7,126 instances.
- Aluminum configurations: Only the homogeneous combination (TP-TP-TP-TP) appears, with exactly 1,452 instances.
Joining method constraint verification. The joining method constraints are perfectly satisfied:
- Aluminum: Both metal welding and bonding are present in equal proportions (11,616 instances each).
- TS: Only bonding is allowed and present (726 instances).
- TP: Both TP welding and bonding are present in equal proportions (726 instances each).
4.4.2. Proof of Completeness
This section gives formal mathematical proof that our enumeration method finds all possible design options without missing any or repeating any.
Proof of exhaustiveness. Let be the set of all feasible design alternatives as per the constraints defined in Section 2. We must show that our enumeration method produces precisely . Taking into account any feasible design alternative , by definition we have that
- The material combination must be in .
- The joining method must be compatible with the material family .
- The thickness values must lie within the specified bounds and discretization grid.
Our enumeration procedure systematically generates:
- All 18 valid material combinations in .
- All compatible joining methods for each material combination.
- All discretized thickness combinations in .
Since the procedure considers every possible combination satisfying the constraints, it generates all elements of . Therefore, the enumeration is exhaustive.
Uniqueness proof. We need to prove that our enumeration procedure generates each feasible design alternative exactly once. The enumeration follows a systematic nested loop structure:
| for each material combination do |
| for each compatible joining method do |
| for each do |
| for each do |
| for each do |
| Generate design alternative |
| end for |
| end for |
| end for |
| end for |
| end for |
Since each design alternative is uniquely identified by its complete tuple of design variable values, and the nested loop structure ensures that each unique tuple is generated exactly once, no duplicates can occur.
4.4.3. Computational Complexity Analysis
Algorithmic complexity. The enumeration algorithm exhibits linear time complexity with respect to the total number of feasible combinations generated. For a design space with:
- material types per component
- components
- maximum joining methods per material family
- discretization levels for thickness variable the worst-case time complexity is:
For our specific problem instance:
4.4.4. Implications for optimization
The systematic enumeration of the complete feasible design space has significant implications for the subsequent optimization procedure.
Design space coverage. The enumeration ensures:
- Completeness: No feasible design alternative is excluded.
- Uniform sampling: The discretization provides uniform coverage of the continuous variable space.
- Constraint satisfaction: All generated alternatives are guaranteed to satisfy manufacturing and compatibility constraints.
Optimization strategy implications. With 25,410 pre-generated feasible alternatives, the optimization problem transforms from
- Constrained continuous-discrete optimization with expensive constraint evaluation
- To: Unconstrained discrete selection from a pre-verified design space
This transformation enables
- Rapid multi-criteria evaluation of all alternatives
- Guaranteed constraint satisfaction
- Comprehensive Pareto frontier generation
4.5. Sustainability Criteria
The sustainability assessment of the fuselage panel considers nine criteria encompassing all three pillars of sustainability: environmental, economic, and structural performance. These criteria are listed in Table 4. Together, they capture the environmental burden, lifecycle cost, and mechanical efficiency of each design alternative. All criteria are formulated such that lower values indicate better performance, with the exception of the performance indicator (specific stiffness), which is to be maximized. A detailed description of the environmental, cost, and performance criteria, along with the methods used to calculate them, is provided in the following subsections.
4.5.1. Environmental Criteria
The environmental criteria were calculated through a parametric LCA conducted in SimaPro software (Ecoinvent 3 library), with panel mass serving as the varying parameter, in accordance with the ISO 14040 [23] and ISO 14044 [24] standards. The inventory data used are identical to those employed in our previous work [17], with the exception of the end-of-life modelling. In this study, the end-of-life stage assumes 100% recycling for aluminum alloy components and 100% landfill for composite components. The analysis follows a cradle-to-grave approach, with the use phase quantified as the amount of kerosene required to transport the panel during the 30-year lifetime of an A319 aircraft [25].
The following environmental impact criteria were considered:
- Human Health (DALYs — Disability-Adjusted Life Years)) (C1)
- Ecosystems (species·year) (C2)
- Resource Scarcity (USD 2013) (C3)
- Global Warming Potential (kg CO2-eq) (C4)
The environmental indicators were calculated using the ReCiPe 2016 Endpoint (H) V1.08 and IPCC 2021 GWP100 V1.02 methods available in SimaPro.
Because it would be computationally inefficient to perform full LCAs for all 25,410 panel configurations, the parametric LCA and LCC analyses revealed a linear relationship between each sustainability criterion and the panel mass. This finding enabled the development of regression functions using mass as the independent variable. Separate regression functions were derived for each material–sub-part combination (16 in total), while the joining method between the stringers and the skin was treated as constant, as its geometric parameters do not vary across configurations. The environmental impact of each complete panel was then obtained by aggregating the contributions of its individual sub-parts.
4.5.2. Cost Criteria
For the cost criteria, a parametric LCC analysis was implemented in SimaPro, covering all lifecycle cost categories:
- Material Cost (C5)
- Energy Cost (C6)
- Use Cost (C7)
- End-of-Life (EoL) Cost (C8)
Regression functions were likewise established for these eight criteria, resulting in a total of 128 regression models (8 criteria × 16 material–sub-part combinations). These functions enable the estimation of environmental and economic impacts for every feasible panel configuration within the decision matrix.
4.5.3. Performance Criterion
The structural performance of each fuselage panel configuration was assessed using its axial specific stiffness (stiffness-to-mass ratio), selected as the representative performance criterion (C9). This metric captures the panel’s load-bearing efficiency and its global response under axial compression. To evaluate specific stiffness across the large design space with manageable computational cost, a two-stage methodology was employed. First, a series of parametric finite element (FE) simulations was conducted using ANSYS Mechanical. Then, a machine-learning-based surrogate model was developed to approximate the FE responses, enabling rapid prediction of the performance metric for new design configurations.
A parametric FE model of the stiffened fuselage panel was developed in ANSYS Mechanical to simulate its longitudinal compressive response. The panel was modeled using 3D solid elements (8- and 20-noded), with boundary conditions applied to reproduce a realistic axial loading scenario. In principle, each design alternative—defined by a unique combination of materials, joining method, and subcomponent thicknesses—would need to be simulated individually to determine its specific stiffness. However, performing FE analyses for all 25,410 configurations would be computationally infeasible. To address this, a representative subset of 5,000 designs was selected from the full design space using a stratified sampling technique implemented in MATLAB R2024a. These 5,000 cases were then analyzed parametrically in ANSYS, providing the reference data needed for training the surrogate model.
To estimate the axial stiffness of the remaining configurations without performing additional FE analyses, a surrogate modeling approach was employed. A custom Python script automated the preprocessing, execution, and extraction of simulation results for the 5,000 analyzed designs. The surrogate model was constructed using a Random Forest regression algorithm, trained on the dataset generated to capture the nonlinear relationships between the design variables and the resulting stiffness response. The dataset was randomly divided into training (80%) and testing (20%) subsets to enable independent validation of the model. The predictive accuracy and goodness of fit of the surrogate model are presented and discussed in Section 5.
4.6. Normalization Methods
As a preliminary step to the weighting and ranking procedures, normalization was applied to convert all criterion values into dimensionless and comparable forms. Because the nine criteria differ in scale and include both benefit-type and cost-type attributes, an appropriate normalization approach is essential. To address these variations, four normalization methods were evaluated in this study: Vector normalization, Z-score normalization, Min–Max normalization, and Linear normalization, as summarized in Table 5.
4.7. Objective Weighting Methods
To objectively determine the relative importance of the nine criteria, five data-driven weighting techniques were applied: Entropy, CRITIC, MEREC, SD, and COV. Each method captures distinct characteristics of the decision matrix and thereby offers complementary insights into data dispersion and inter-criteria relationships. The mathematical formulations used in this study follow the definitions provided in [17] and are based on the foundational works summarized in Table 6.
In this study, these methods were further applied to an expanded dataset comprising 25,410 design alternatives, and their performance was assessed through a stability analysis to identify the most balanced and consistent weighting approach. The weighting method demonstrating the highest level of consistency and robustness was subsequently adopted for the final R-TOPSIS evaluation and the clustering-based decision mapping stages.
4.8. Stability Analysis of Normalization and Weighting Methods
To evaluate the robustness of normalization and objective weighting methods, a stability analysis was performed to identify which method combinations yield the most consistent weighting outcomes under perturbations of the normalized data.
For each normalization method, the five objective weighting techniques were tested using the complete dataset of 25,410 design alternatives. Perturbations were introduced within the range with a step size of 0.01, resulting in 25 distinct perturbation levels. At each perturbation level, 1,000 Monte Carlo simulations were conducted, totaling 25,000 experiments to ensure statistical robustness.
For every weighting method and perturbation level , a stability score was calculated as:
where denotes the mean relative change in the criterion weights due to the perturbation. The closer is to 1, the higher the stability of the corresponding weighting method under the given normalization scheme.
Finally, for each normalization method, an overall stability index was obtained by averaging the individual stability scores across all weighting methods and perturbation levels. This process enabled a systematic comparison of the normalization–weighting combinations based on their sensitivity to input uncertainty.
4.9. Multi-Criteria Decision Making Process – R-TOPSIS
R-TOPSIS was employed to rank the alternative panel designs according to their overall sustainability performance. This algorithm retains the basic logic of TOPSIS while addressing rank-reversal issues by introducing a domain-based normalization, ensuring that the ideal reference points remain fixed for both benefit- and cost-type criteria.
The algorithm requires:
- a decision matrix ;
- a vector of criteria weights , where and ; and
- a sub-domain of real numbers , where , where and note the minimum and maximum feasible values of each criterion
Step 1: Normalization of decision matrix
Step 2: Weighting of normalized matrix
Step 3: Ideal solutions
The positive (PIS) and negative (NIS) ideal solutions are established as:
Step 4: Calculation of the distances of each alternative in relation to the ideal solutions
Step 6: Closeness coefficient and ranking
The alternatives are ranked in descending order of Ci ; higher values indicate superior sustainability performance.
In this study, R-TOPSIS was applied at two distinct stages of the sustainability-driven decision framework:
-
Path A – Cluster-based optimization:Following customized clustering and Pareto filtering, R-TOPSIS was executed within each cluster to rank the non-dominated designs and identify the top sustainable representatives of each group.
-
Path B – Global optimization:After the global Pareto filtering, R-TOPSIS was applied to the entire decision matrix to derive a unified ranking of the top-performing designs across all clusters.
4.10. Pareto-Based Optimization
Pareto-based optimization was implemented in MATLAB to identify the subset of non-dominated design alternatives across sustainability objectives. In multi-objective optimization problems, widely used in engineering design and sustainability assessment , an alternative is defined as non-dominated if no other alternative satisfies for all criteria j and for at least one j, where denotes the value of the j-th sustainability criterion for alternative . The resulting Pareto front represents the set of solutions that achieve an optimal balance among conflicting objectives, capturing the intrinsic trade-offs between sustainability pillars. Within the proposed framework, Pareto filtering serves as an intermediate reduction stage: in Path A, it is applied within each sustainability cluster to retain locally optimal designs, whereas in Path B, it is applied to the complete decision matrix to identify globally optimal configurations.
4.11. Clustering-Based Optimization – Customized Clustering
To support localized sustainability optimization, a customized clustering approach was developed in MATLAB to classify the 25,410 alternative panel designs according to their sustainability characteristics. This step enables the exploration of trade-offs within groups of designs that exhibit similar environmental, cost, and performance behavior, offering a complementary perspective to the global optimization pathway. The analysis was conducted on the normalized decision matrix to ensure comparability across criteria. The nine sustainability criteria were aggregated into three categories—Environmental, Cost, and Performance—by averaging the normalized values within each group. For each design, a composite indicator was then computed for each category and assigned to one of three qualitative levels (Low, Medium, High) using the first (Q1) and third (Q3) quartiles as thresholds. Combining the three category-specific levels produced a set of sustainability clusters, each representing a unique Environmental–Cost–Performance configuration (e.g., Low–Medium–High). This clustering framework structures the design space into coherent groups of alternatives exhibiting similar sustainability profiles, thereby forming the basis for the subsequent Pareto filtering and R-TOPSIS ranking performed within each cluster.
5. Results
5.1. Computation of Sustainability Criteria
5.1.1. Design Space
After defining the design space by enumerating all feasible combinations, it was found that approximately 91% of the valid configurations correspond to aluminum panels, while the remaining ones consist of TP and TS panels, as illustrated in Figure 3.
5.1.2. Environmental and Cost Regression Functions
Parametric LCA and LCC analyses were conducted for ten mass values, obtained by multiplying the reference panel mass by incremental factors with a step of 0.5. A linear relationship was observed between the panel mass and all evaluated criteria. Indicatively, Figure 4(a) presents the results for the skin component made of Al7075, considering the ten mass cases and the three damage categories of the ReCiPe 2016 Endpoint (H) V1.11 / World (2010) H/A method, which correspond to the three environmental criteria adopted in this study. The analogous results for the cost criteria, derived using the same parametric approach, are shown in Figure 4(b). In both sets of diagrams, a clear linear dependency on mass is observed. For the environmental results, the three criteria differ in units and magnitude ranges, making them not directly comparable. In contrast, the cost results—expressed in common units (EUR2024)—are directly comparable and reveal that the use-phase cost dominates the total life cycle cost, whereas the material, energy, and end-of-life costs contribute only marginally.
A total of 128 regression functions were developed in the form , corresponding to the eight sustainability criteria and the sixteen material–sub-part combinations (8 criteria × 16 combinations). These linear models enable the estimation of the environmental and economic impacts for every feasible panel configuration included in the decision matrix.
Let the criterion value be denoted as:
- Ck,i,j, where refers to the criterion,
- i ∈ {skin, stiffener, frame, clip} refers to the panel’s sub-part, and
- j ∈ {Al2024, Al7075, TS-CFRP, TP-CFRP} refers to the material used
Each sub-part term represents the contribution of that component type and includes the total mass of all identical sub-parts within the panel (one skin, four frames, seven stiffeners, and twenty-four clips). The total criterion value for one complete panel design is then obtained as:
The coefficients a and b of the linear relationships for each criterion and sub-part are listed in Table 7. All corresponding criteria values were computed in MATLAB using the derived equations, forming a decision matrix of 25,410 design alternatives, which was subsequently exported to Excel.
5.1.3. Performance Criterion Results
The structural performance of the panel, expressed as its axial stiffness, was predicted using the combined finite element and surrogate modeling approach described in Section 4. The Random Forest model achieved excellent predictive accuracy, with a coefficient of determination between the predicted and simulated stiffness values as shown in Figure 5.
The predicted stiffness values for all 25,410 design alternatives were subsequently combined with the corresponding panel masses to calculate the specific stiffness, which populated the performance criterion (C9) column of the decision matrix employed in the sustainability assessment.
5.2. Stability Analysis of Normalization and Weighting Methods
5.2.1. Effect of Normalization on Stability
The stability results reveal clear differences among the normalization methods. Across all weighting techniques, Z-score and Min–Max normalization exhibit the highest overall robustness against data perturbations (Figure 6). The average stability scores (Table 8) confirm that Z-score normalization achieved the best performance (), closely followed by Min–Max (). The Linear Norm method also demonstrated stable and satisfactory behavior (), indicating good robustness despite slightly lower values. In contrast, Vector Norm showed a substantially lower stability score (). Overall, these results highlight the superior consistency of Z-score and Min–Max normalization, with Linear Norm also performing reliably under data perturbations.
5.2.2. Comparison of Weighting-Method Stability Under the Most Robust Normalization Techniques
To further interpret the results, the behavior of the weighting methods was examined under the three most stable normalization schemes, Z-score, Min–Max, and Linear. As shown in Figure 7, the stability curves under Z-score normalization (Figure 7a) remain nearly flat across all perturbation levels, confirming the high resilience of all weighting methods except Entropy. Under Min–Max normalization (Figure 7b), the MEREC and SD methods demonstrate the most stable responses, while Entropy again shows higher sensitivity to noise. Under Linear normalization, the stability behavior of the weighting methods changes compared to the Z-score and Min–Max cases (Figure 7c). Although the stability scores for all methods except Entropy remain within the relatively high range of 0.9–1.0 up to a perturbation level of approximately 0.20, a gradual decrease is observed as noise increases. Entropy is the only method that falls below this range, showing higher sensitivity to data variation, while MEREC consistently maintains the highest stability across all perturbation levels, confirming its robustness even under increased perturbation.
5.2.3. Comparison of Weighting-Method Behavior Through Weight Dispersion
The dispersion of the computed weights (Table 9) further highlights the variability among the five objective weighting methods. The MEREC method exhibited the most bal-anced distribution of weights (max/min = 1.2097), closely followed by SD (max/min = 1.3375) and CRITIC (max/min = 4.5293). In contrast, the COV method showed a markedly uneven distribution (max/min = 6.8613), while Entropy produced the most polarized set of weights (max/min = 20.17), indicating strong dominance by the performance (specific stiffness) and end-of-life cost criteria. Overall, the results confirm that MEREC, and secondarily SD, ensure the most balanced and stable weighting behavior, whereas Entropy amplifies dis-parities and concentrates importance on a limited number of criteria.
5.3. Optimization Results - Paths A and B
5.3.1. Path A: Cluster-Based Optimization
Within Path A of the analysis framework, the decision matrix was first normalized using the Z-score method, previously identified as the most stable normalization approach. This step was performed prior to clustering to ensure comparability across criteria and to enable a consistent grouping of the design alternatives. Customized clustering was then applied to classify the 25,410 panel configurations according to their sustainability characteristics. Each design was categorized along the three sustainability dimensions—Environmental, Cost, and Performance—each discretized into three qualitative levels (Low, Medium, High). It is important to clarify that the term High refers to a desirable direction: high environmental performance indicates low impact, high cost performance reflects low life-cycle cost, and high performance denotes greater specific stiffness.
As shown in Table 10, twenty-two of the twenty-seven possible Environmental–Cost–Performance combinations were populated, demonstrating that nearly the entire sustainability design space was covered. Only five combinations remained empty based on the applied quartile-based thresholds. Notably, a High–High–High cluster was also formed, indicating that a subset of configurations achieved simultaneously high environmental, economic, and structural performance.
Pareto filtering was then applied within each populated cluster to retain only the non-dominated alternatives, thereby identifying the most sustainable solutions within each localized sustainability region. This step resulted in a substantial reduction of the initial design set, confirming the filtering efficiency and demonstrating the effectiveness of the proposed framework. The number of total and non-dominated alternatives per cluster is reported in Table 10.
To visualize the outcome of the Pareto filtering, 3D Pareto front plots were generated for each sustainability cluster, illustrating the relationships among the Environmental, Cost, and Performance scores. In these plots, the non-dominated designs are highlighted in red, delineating the frontier of optimal trade-offs within each cluster. Figure 8 presents the results for Cluster 13 (CID_13), corresponding to the Medium Environment–Medium Cost–Medium Performance category. Two distinct regions are visible within the plotted space, indicating that design alternatives classified as medium do not uniformly populate the entire mid-range of sustainability performance. Instead, the distribution reveals sustainability gradients and sub-group behavior within the cluster.
Finally, R-TOPSIS was applied within each cluster to determine the top-ranked sustainable alternative, using equal weighting of the criteria. Equal weighting was selected because, in Path A, the goal is to characterize the design space and identify the most representative solution within each sustainability profile, rather than impose externally defined priorities. This keeps the ranking consistent with the cluster’s inherent sustainability characteristics.
Table 11 reports the configuration of the highest-ranked design in each cluster, including the selected material for every subcomponent, the joining method, and the optimized thickness values for the skin, stiffeners, and frames.
The R-TOPSIS ranking results reveal consistent trends in material and manufacturing preferences across sustainability clusters. The frequent appearance of aluminum-based configurations—particularly combinations of Al2024 and Al7075—is attributed primarily to the aluminum dominance of the design space (≈ 91%) rather than to inherently superior sustainability performance. These metallic designs are mostly located in clusters with balanced or intermediate sustainability levels, reflecting the well-established compromise between specific stiffness and cost within the metallic family.
In contrast, thermoplastic composite (TP-CFRP) configurations emerge in the High Environment–High Cost–High Performance cluster (CID = 26), illustrating their high specific stiffness and reduced mass, which translate into lower use-phase fuel consumption despite higher manufacturing complexity.
At the opposite end of the spectrum, the Low Environment–Low Cost–Low Performance cluster (CID = 0) comprises aluminum panels joined by bonding. These represent the least sustainable alternatives due to increased mass—which elevates use-phase environmental and cost impacts—as well as the additional adhesive mass and material cost associated with bonding. In environmental and economic modeling, welding contributed only through joining energy, whereas bonding introduced adhesive consumption, increasing both weight and material cost.
Regarding joining strategies more broadly, both welding and bonding appear among top-ranked alternatives; however, their influence is restricted to environmental and cost performance, as joining methods were assumed not to affect structural stiffness in the present study. Welding is more prevalent in clusters displaying higher sustainability efficiency, whereas bonding is associated with medium or mixed profiles. Across all clusters, optimized sub-component thicknesses fall within a narrow range (1.5–2.8 mm), indicating a strong convergence towards lightweight yet structurally capable solutions.
Overall, the R-TOPSIS results effectively capture the trade-offs among material families, joining techniques, and geometric parameters, showing how the distribution of feasible solutions in the design space shapes the sustainability profile of top-ranked configurations.
5.3.2. Path B: Global Optimization
Path B applies Pareto filtering to the complete decision matrix, followed by R-TOPSIS ranking of the resulting non-dominated solutions. In this stage, the Linear normalization method was selected, as it demonstrated stability comparable to Z-score and Min–Max, while ensuring consistent scaling for the subsequent objective-weighting procedures. Among the weighting techniques, MEREC was chosen for the R-TOPSIS evaluation because it provided the most balanced weight distribution (lowest Max/Min ratio) and exhibited identical stability trends under all three normalization schemes, as illustrated in Figure 6.
The Pareto filtering step drastically reduced the design space—from 25,410 initial configurations to only 97 non-dominated alternatives (0.38%)—indicating strong trade-offs among environmental, cost, and structural performance criteria. R-TOPSIS was then applied to this reduced set to identify the globally most sustainable panel designs.
The five highest-ranked configurations, representing the optimal compromise across sustainability pillars, are presented in Table 12, along with their associated material selections, joining method, and optimized thickness distributions.
The five most sustainable panel configurations identified by R-TOPSIS are presented in Table 12. All top-ranked designs consist of TP CFRPs joined via TP welding, with only small variations in the subcomponent thicknesses. This outcome is consistent with expectations, as TP CFRPs exhibit the lowest density among the candidate materials—a decisive advantage when the use phase is included in the assessment. Because aircraft fuel consumption is directly proportional to structural mass, lightweight materials provide clear environmental and cost benefits throughout the operational lifetime.
It is also important to note that the best designs have thickness values close to the lower bounds of the examined range, rather than strictly the smallest possible ones. This shows that, although both the environmental and cost criteria, as well as specific stiffness, depend on mass, the thicknesses of several sub-components affect stiffness differently, resulting in a more complex combined influence. As a result, the top-ranked designs represent a balance between weight reduction and structural stiffness, rather than simply minimizing thickness.
Finally, the frequent selection of welding over bonding aligns with the regression-based trends reported in Section 5.1.2 (Table 7), where welded joints consistently demonstrated lower environmental and cost impacts.
6. Conclusions
This study addressed the challenge of integrating environmental, economic, and structural performance criteria into the sustainability-oriented optimization of an aircraft fuselage panel. A large design space of 25,410 feasible configurations was constructed by combining materials, joining methods, and thickness parameters, and evaluated using parametric LCA, Life Cycle Costing LCC, and FEA. The proposed workflow established a unified computational framework that links high-fidelity simulations, data-driven modeling, and multi-criteria decision-making to identify the most sustainable design alternatives.
The system boundaries—defined as cradle-to-grave and including the use phase—played a pivotal role in shaping the outcomes. Since fuel consumption during aircraft operation is directly proportional to component mass, the inclusion of the use phase amplified the sustainability benefit of lightweight materials across environmental, economic, and performance criteria. As a result, the findings are highly dependent on the scope and assumptions of the study; altering the system boundaries or weighting the use-phase differently could shift the relative ranking of the optimal solutions.
Equally crucial is the definition of the design space. Material compatibility constraints, joining-method feasibility, and allowable thickness ranges directly influence the credibility and relevance of the optimization results. Robust definition of these limits is essential to ensure that the resulting solutions remain realistic, manufacturable, and meaningful from an industrial perspective.
From a computational perspective, significant efficiency was achieved through the integration of surrogate modeling. A Python-automated workflow enabled the simulation of 5,000 representative designs, while a Random Forest surrogate model predicted the stiffness of the remaining configurations with very high accuracy (R2 ≈ 0.999). This approach reduced simulation cost dramatically without compromising precision, demonstrating scalability for even larger structural design problems.
The multi-criteria assessment revealed sensitivity to normalization and weighting strategies. Z-score, Min–Max, and Linear normalization exhibited similarly high stability. Among weighting methods, MEREC displayed consistent performance across all normalization schemes and produced the most balanced weight distribution—suitable for holistic sustainability evaluation. More dispersed weighting schemes may be preferable when prioritizing a particular dimension of sustainability.
The two optimization paths developed in this work serve complementary decision-making roles. Path A, incorporating Z-score normalization, customized clustering, intra-cluster Pareto filtering, and R-TOPSIS with equal weights, provided a detailed mapping of the sustainability landscape. It revealed 22 active clusters, spanning from High–High–High to Low–Low–Low, thus capturing the full spectrum of trade-offs between environmental, economic, and structural performance. Path B, based on global Pareto filtering followed by R-TOPSIS using Linear normalization with MEREC weighting, performed a global optimization of the full design matrix. The Pareto stage reduced the design space from 25,410 alternatives to 97 non-dominated configurations (0.38%), from which the five most sustainable solutions were identified—all thermoplastic composite panels with TP welding—confirming the dominant role of mass minimization when use-phase impacts are included.
In summary, the proposed framework successfully integrates environmental, economic, and structural objectives into a coherent and scalable sustainability-driven design methodology. The complementary outputs of Path A and Path B provide both localized cluster-level insights and global optimization capability, enabling decision-makers to explore trade-offs, quantify benefits, and select the most sustainable fuselage panel configurations with confidence.
Author Contributions
Conceptualization, A.A, D.S., and K.T.; methodology, A.A, D.S., I.S. and K.T.; software, A.A and I.S.; formal analysis, A.A and I.S.; investigation, A.A. D.S.,I.S., and K.T; resources, K.T.; data curation, A.A, D..S., I.S. and K.T.; writing—original draft preparation, A.A, D.S., I..S., and K.T., ID.S.; writing—review and editing, K.T.; visualization, A.A., D.S., and K.T.; supervision, K.T.; project administration, K.T.; funding acquisition, K.T. All authors have read and agreed to the published version of the manuscript.
Funding
The work described in this paper has been financially supported by the Clean Aviation project FASTER-H2 (Project: 101101978). The views and opinions expressed in the paper are those of the author(s) only and do not necessarily reflect those of the European Union or Clean Aviation Joint Undertaking.
Data Availability Statement
The authors declare that the data supporting the findings of this study are available within the paper.
Conflicts of Interest
The authors declare no conflicts of interest.
Abbreviations
The following abbreviations are used in this manuscript:
| MCDM | Multi-Criteria Decision-Making |
| CFRP | Carbon Fiber-Reinforced Polymer |
| LCA | Lifecycle Analysis |
| LCC | Lifecycle Costing |
| R-TOPSIS | Robust Technique for Order of Preference by Similarity to Ideal Solution |
| EU | European Union |
| 3D | Three Dimensional |
| Al2024 | Aluminum 2024 |
| Al7075 | Aluminum 7075 |
| TS | Thermosetting |
| TP | Thermoplastic |
| ISO | International Organization for Standardization |
| DALYs | Disability Adjusted Life Years |
| IPCC | Intergovernmental Panel on Climate Change |
| GWP | Global Warming Potential |
| H | Hierarchist |
| CO2 | Carbon Dioxide |
| EoL | End of Life |
| FEA | Finite Element Analysis |
| FE | Finite Element |
| USD | United States Dollar |
| SD | Standard Deviation |
| COV | Coefficient of Variance |
| CRITIC | Criteria Importance Through Inter-Criteria Correlation |
| MEREC | Method Based on the Removal Effects of Criteria |
| TOPSIS | Technique for Order Preference by Similarity to Ideal |
| PIS | Positive Ideal Solution |
| NIS | Negative Ideal Solution |
| Max | Maximum |
| Min | Minimum |
| DFE | Design For Environment |
| NSGA | Non-Dominated Sorting Genetic Algorithm |
| AHP | Analytic Hierarchy Process |
| SAF | Sustainable Alternative Fuel |
| ATM | Air Traffic Management |
| PSO | Particle Swarm Optimization |
| UD | Unidirectional |
References
- Revolutionizing Aircraft Materials and Processes; Pantelakis, S., Tserpes, K., Eds.; Springer International Publishing: Cham, 2020; ISBN 978-3-030-35345-2. [Google Scholar]
- Karlsson, R.; Luttropp, C. EcoDesign: What’s Happening? An Overview of the Subject Area of EcoDesign and of the Papers in This Special Issue. J. Clean. Prod. 2006, 14, 1291–1298. [Google Scholar] [CrossRef]
- Kassapoglou, C. Simultaneous Cost and Weight Minimization of Composite-Stiffened Panels under Compression and Shear. Compos. Part Appl. Sci. Manuf. 1997, 28, 419–435. [Google Scholar] [CrossRef]
- Kassapoglou, C. Minimum Cost and Weight Design of Fuselage Frames Part A: Design Constraints and Manufacturing Process Characteristics. 1999.
- Kassapoglou, C. Kassapoglou, C. Minimum Cost and Weight Design of Fuselage Frames Part B: Cost Considerations, Optimization, and Resultsଝ. 1999.
- Corvino, M.; Iuspa, L.; Riccio, A.; Scaramuzzino, F. Weight and Cost Oriented Multi-Objective Optimisation of Impact Damage Resistant Stiffened Composite Panels. Comput. Struct. 2009, 87, 1033–1042. [Google Scholar] [CrossRef]
- Iemma, U.; Pisi Vitagliano, F.; Centracchio, F. Multi-Objective Design Optimization of Sustainable Commercial a-Ircraft: Performance and Costs. Int. J. Sustain. Eng. 2017, 10, 147–157. [Google Scholar] [CrossRef]
- Jimenez, H.; Mavris, D. Pareto-Optimal Aircraft Technology Study for Environmental Benefits with Multi-Objective Optimization. J. Aircr. 2017, 54, 1860–1876. [Google Scholar] [CrossRef]
- Vogiantzi, C.; Tserpes, K. On the Definition, Assessment, and Enhancement of Circular Economy across Various Industrial Sectors: A Literature Review and Recent Findings. Sustainability 2023, 15, 16532. [Google Scholar] [CrossRef]
- Vogiantzi, C.; Tserpes, K. A Comparative Environmental and Economic Analysis of Carbon Fiber-Reinforced Polymer Recycling Processes Using Life Cycle Assessment and Life Cycle Costing. J. Compos. Sci. 2025, 9, 39. [Google Scholar] [CrossRef]
- Atescan-Yuksek, Y.; Mills, A.; Ayre, D.; Koziol, K.; Salonitis, K. Comparative Life Cycle Assessment of Aluminium and CFRP Composites: The Case of Aerospace Manufacturing. Int. J. Adv. Manuf. Technol. 2024, 131, 4345–4357. [Google Scholar] [CrossRef]
- Pollet, F.; Lutz, F.; Planès, T.; Delbecq, S.; Budinger, M. A Generic Life Cycle Assessment Tool for Overall Aircraft Design. Appl. Energy 2025, 399, 126514. [Google Scholar] [CrossRef]
- Parolin, G.; Borges, A.T.; Santos, L.C.C.; Borille, A.V. A Tool for Aircraft Eco-Design Based on Streamlined Life Cycle Assessment and Uncertainty Analysis. Procedia CIRP 2021, 98, 565–570. [Google Scholar] [CrossRef]
- Emovon, I.; Oghenenyerovwho, O.S. Application of MCDM Method in Material Selection for Optimal Design: A Review. Results Mater. 2020, 7, 100115. [Google Scholar] [CrossRef]
- Junaid, M.; Zaman, U.K.U.; Naseem, A.; Ahmad, Y.; Aqeel, A.B. Material Selection in Additive Manufacturing for Aerospace Applications Using Multi-Criteria Decision Making. MATEC Web Conf. 2024, 398, 01012. [Google Scholar] [CrossRef]
- Malefaki, S.; Markatos, D.; Filippatos, A.; Pantelakis, S. A Comparative Analysis of Multi-Criteria Decision-Making Methods and Normalization Techniques in Holistic Sustainability Assessment for Engineering Applications. Aerospace 2025, 12, 100. [Google Scholar] [CrossRef]
- Anagnostopoulou, A.; Sotiropoulos, D.; Tserpes, K. A Robust Sustainability Assessment Methodology for Aircraft Parts: Application to a Fuselage Panel. Sustainability 2025, 17, 3299. [Google Scholar] [CrossRef]
- Filippatos, A.; Markatos, D.; Tzortzinis, G.; Abhyankar, K.; Malefaki, S.; Gude, M.; Pantelakis, S. Sustainability-Driven Design of Aircraft Composite Components. Aerospace 2024, 11, 86. [Google Scholar] [CrossRef]
- Zhang, T.; Wei, Z.; Wang, L.; Xue, Z.; Wang, S.; Wang, P.; Qi, B.; Yue, Z. Multi-Objective Optimization of Composite Stiffened Panels for Mass and Buckling Load Using PNN-NSGA-III Algorithm and TOPSIS Method. Thin-Walled Struct. 2025, 209, 112878. [Google Scholar] [CrossRef]
- Kundu, R.D.; Zhang, X.S. Sustainability-Oriented Multimaterial Topology Optimization: Designing Efficient Structures Incorporating Environmental Effects. Struct. Multidiscip. Optim. 2025, 68, 17. [Google Scholar] [CrossRef]
- Raihan, A. Sustainable Aviation: A Critical Review of Policies, Technologies, and Future Pathways. J. Air Transp. Res. Soc. 2025, 5, 100080. [Google Scholar] [CrossRef]
- 2050 Long-Term Strategy - European Commission. Available online: https://climate.ec.europa.eu/eu-action/climate-strategies-targets/2050-long-term-strategy_en (accessed on 4 September 2025).
- ISO 14040:2006; EnvironmentalManagement—Life Cycle Assessment—Principles and Framework. ISO: Geneva, Switzerland, 2006.
- ISO 14044; Environmental Management—Life Cycle Assessment—Requirements and Guidelines. ISO: Geneva, Switzerland, 2006.
- Liu, Z. LIFE CYCLE ASSESSMENT OF COMPOSITES AND ALUMINIUM USE IN AIRCRAFT SYSTEMS.
- 38. Zelený, M. Multiple Criteria Decision Making: McGraw-Hill Series in Quantitative Methods for Management; McGraw-Hill Book: New York, 1982; ISBN 978-0-07-072795-3. [Google Scholar]
- 40. Hwang, C.-L.; Yoon, K. Multiple Attribute Decision Making: Lecture Notes in Economics and Mathematical Systems; Vol. 186. Springer Berlin Heidelberg: Berlin, Heidelberg,: Berlin, Heidelberg, 1981; ISBN ISBN 978-3-540-10558-9. [Google Scholar]
- Diakoulaki, D.; Mavrotas, G.; Papayannakis, L. Determining Objective Weights in Multiple Criteria Problems: The Critic Method. Comput. Oper. Res. 1995, 22, 763–770. [Google Scholar] [CrossRef]
- Keshavarz-Ghorabaee, M.; Amiri, M.; Zavadskas, E.K.; Turskis, Z.; Antucheviciene, J. Determination of Objective Weights Using a New Method Based on the Removal Effects of Criteria (MEREC). Symmetry 2021, 13, 525. [Google Scholar] [CrossRef]
- Keshavarz-Ghorabaee, M. Assessment of Distribution Center Locations Using a Multi-Expert Subjective–Objective Decision-Making Approach. Sci. Rep. 2021, 11, 19461. [Google Scholar] [CrossRef] [PubMed]
- Wang, Y.-M.; Luo, Y. Integration of Correlations with Standard Deviations for Determining Attribute Weights in Multiple Attribute Decision Making. Math. Comput. Model. 2010, 51, 1–12. [Google Scholar] [CrossRef]
Figure 1.
Sketch of the panel.
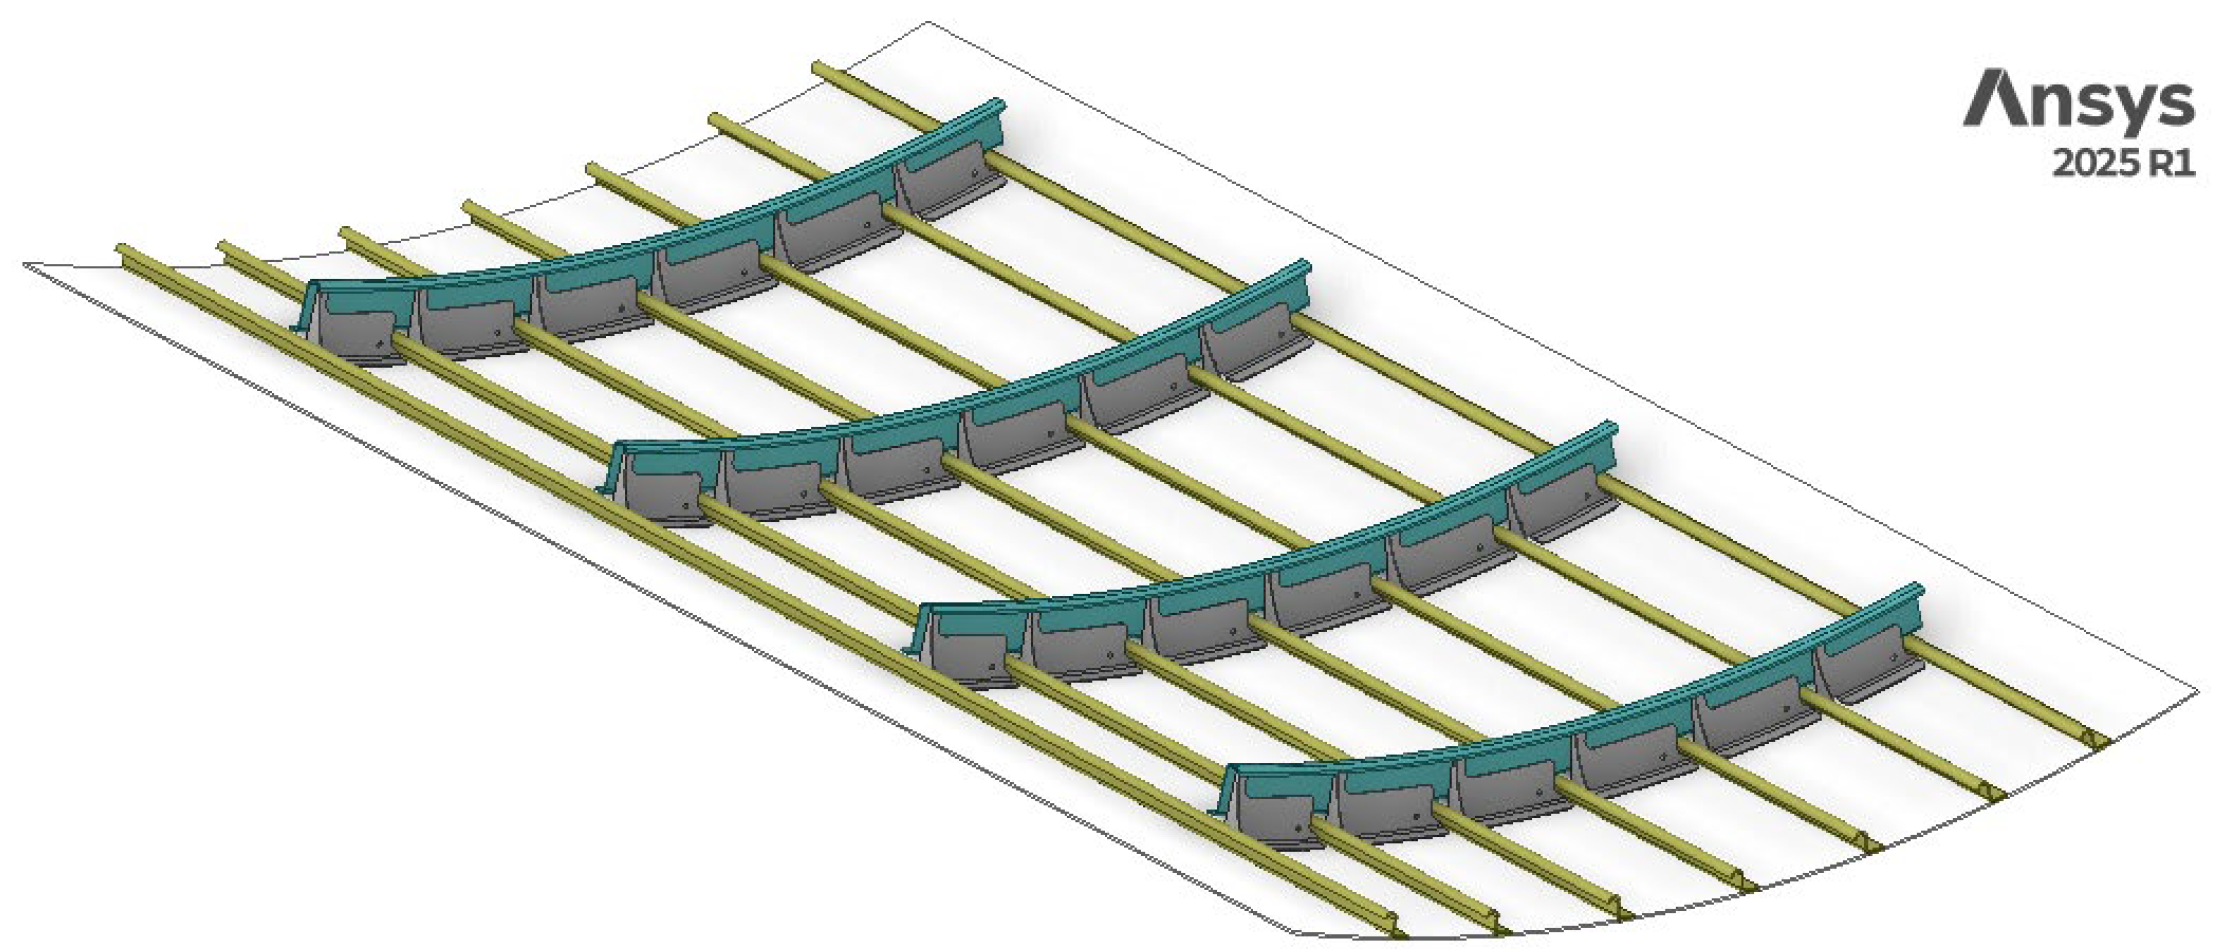
Figure 2.
The sustainability-driven optimization framework. Path A includes all steps while Path B does not include the Customized Clustering step.
Figure 2.
The sustainability-driven optimization framework. Path A includes all steps while Path B does not include the Customized Clustering step.
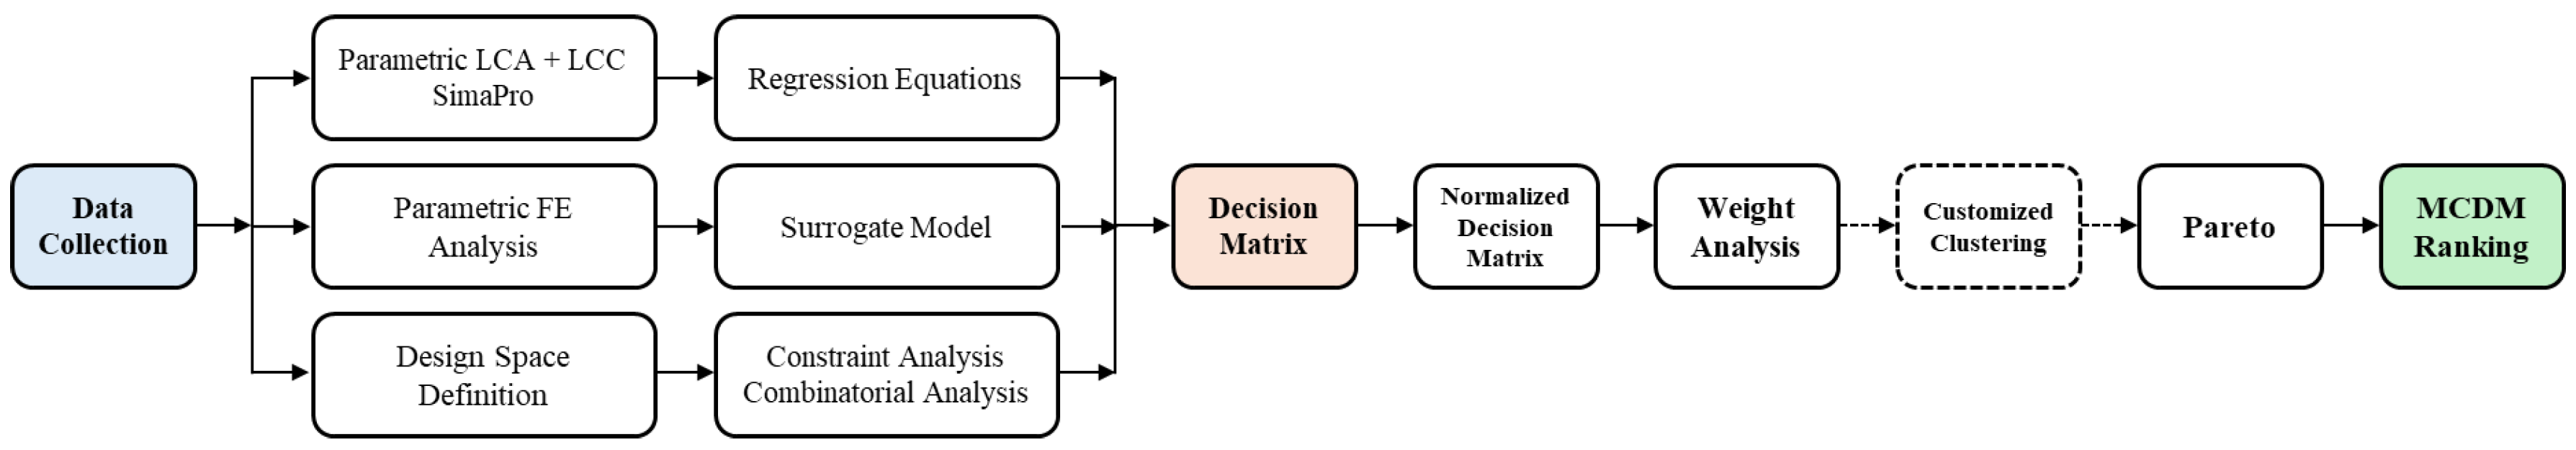
Figure 3.
Final design space showing the distribution of feasible material–joining combinations.
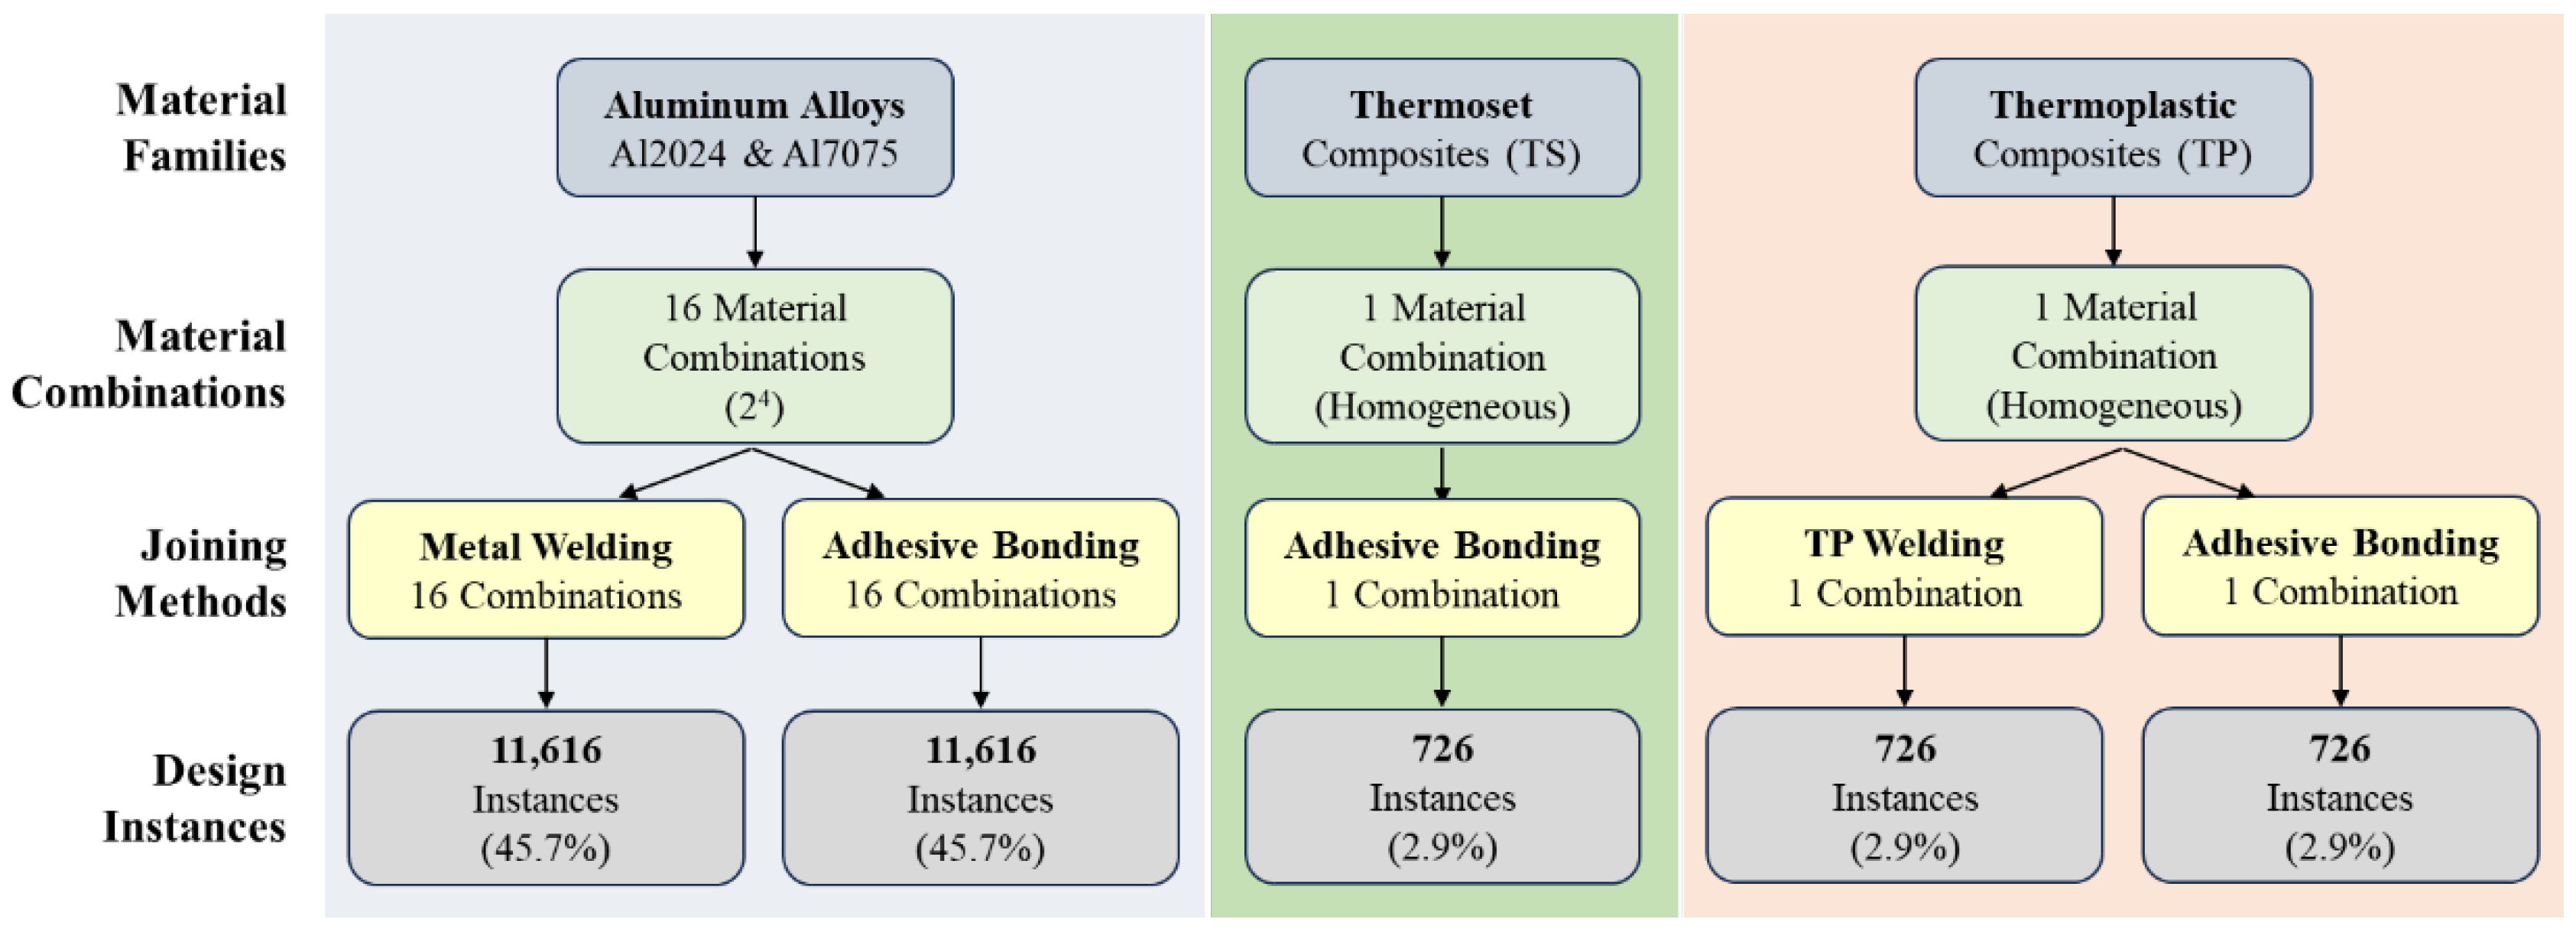
Figure 4.
(a) Environmental impacts of the Al7075 skin subcomponent for increasing mass values. (b) Parametric LCC results of the Al7075 skin subcomponent for increasing mass values.
Figure 4.
(a) Environmental impacts of the Al7075 skin subcomponent for increasing mass values. (b) Parametric LCC results of the Al7075 skin subcomponent for increasing mass values.
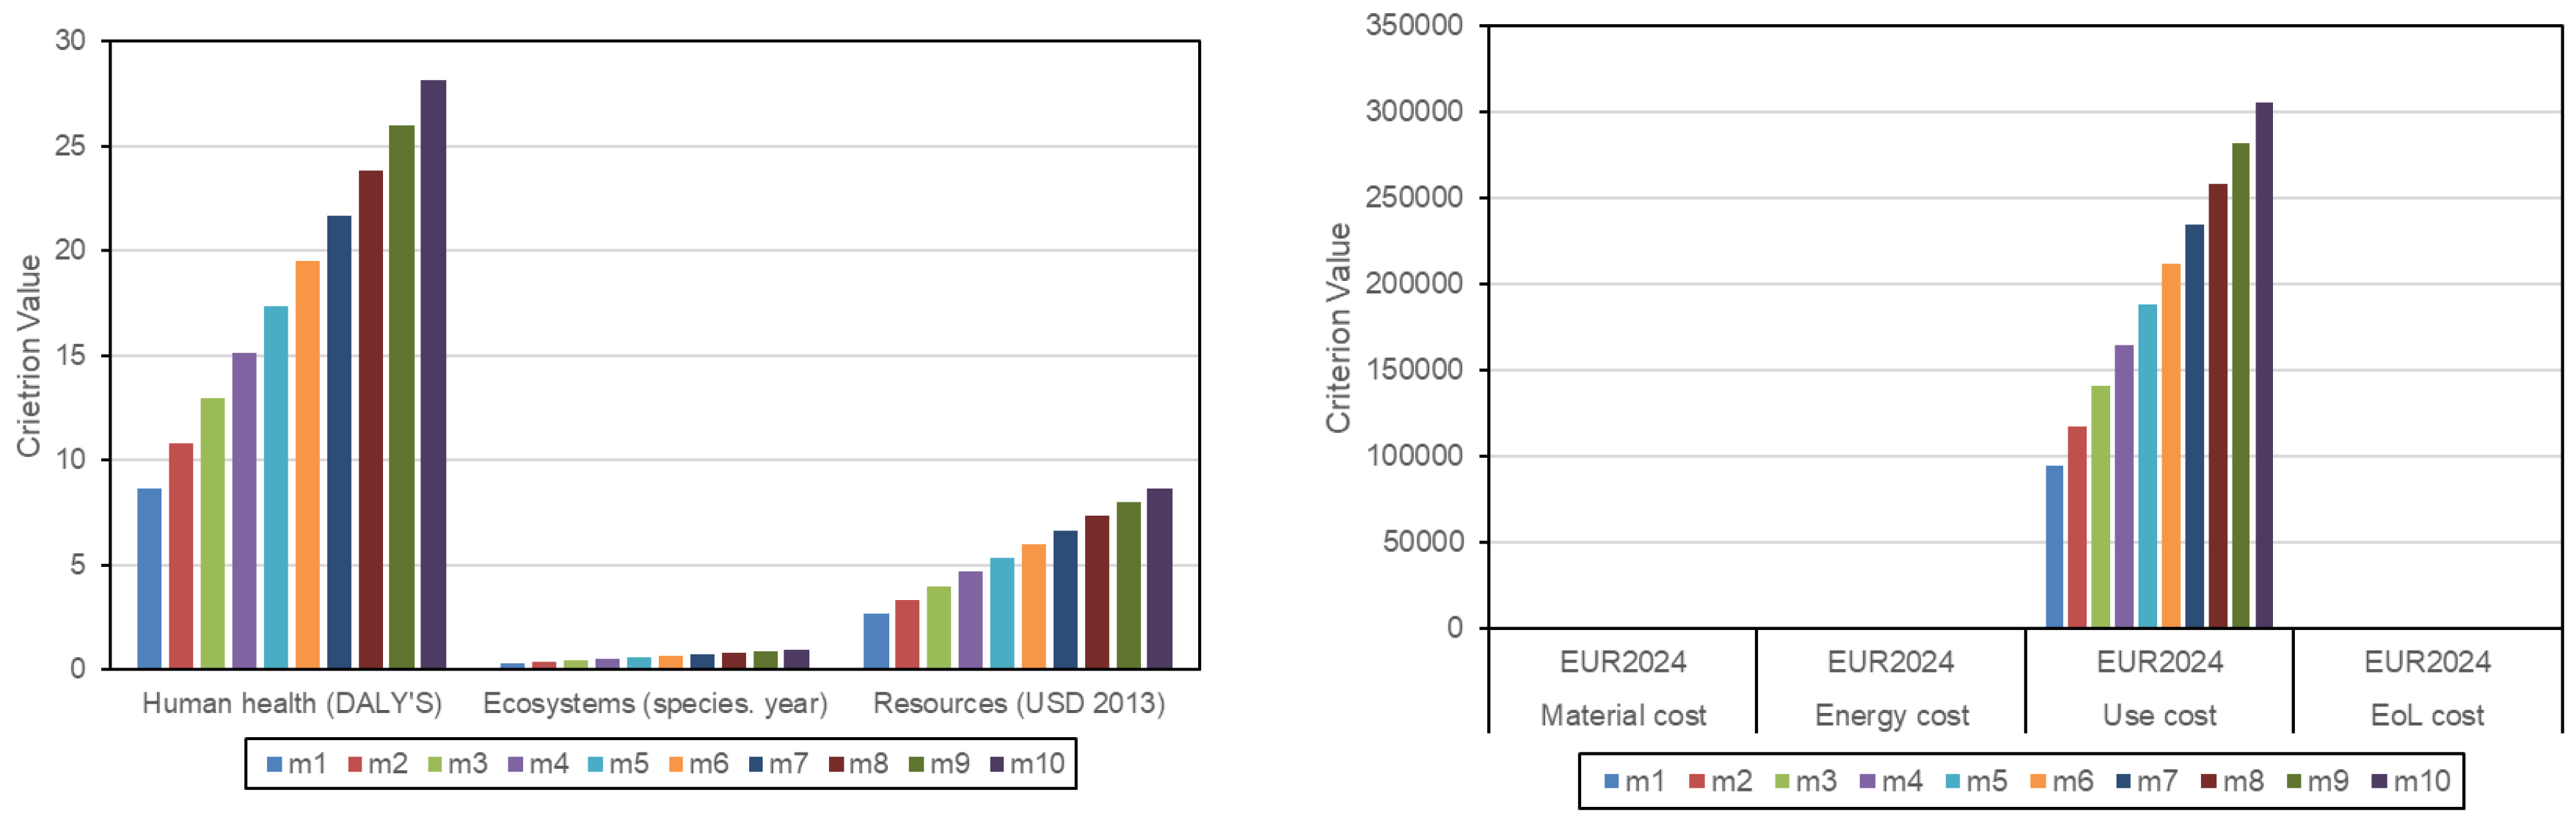
Figure 5.
Predicted vs. actual axial stiffness values obtained from the Random Forest surrogate model.
Figure 5.
Predicted vs. actual axial stiffness values obtained from the Random Forest surrogate model.
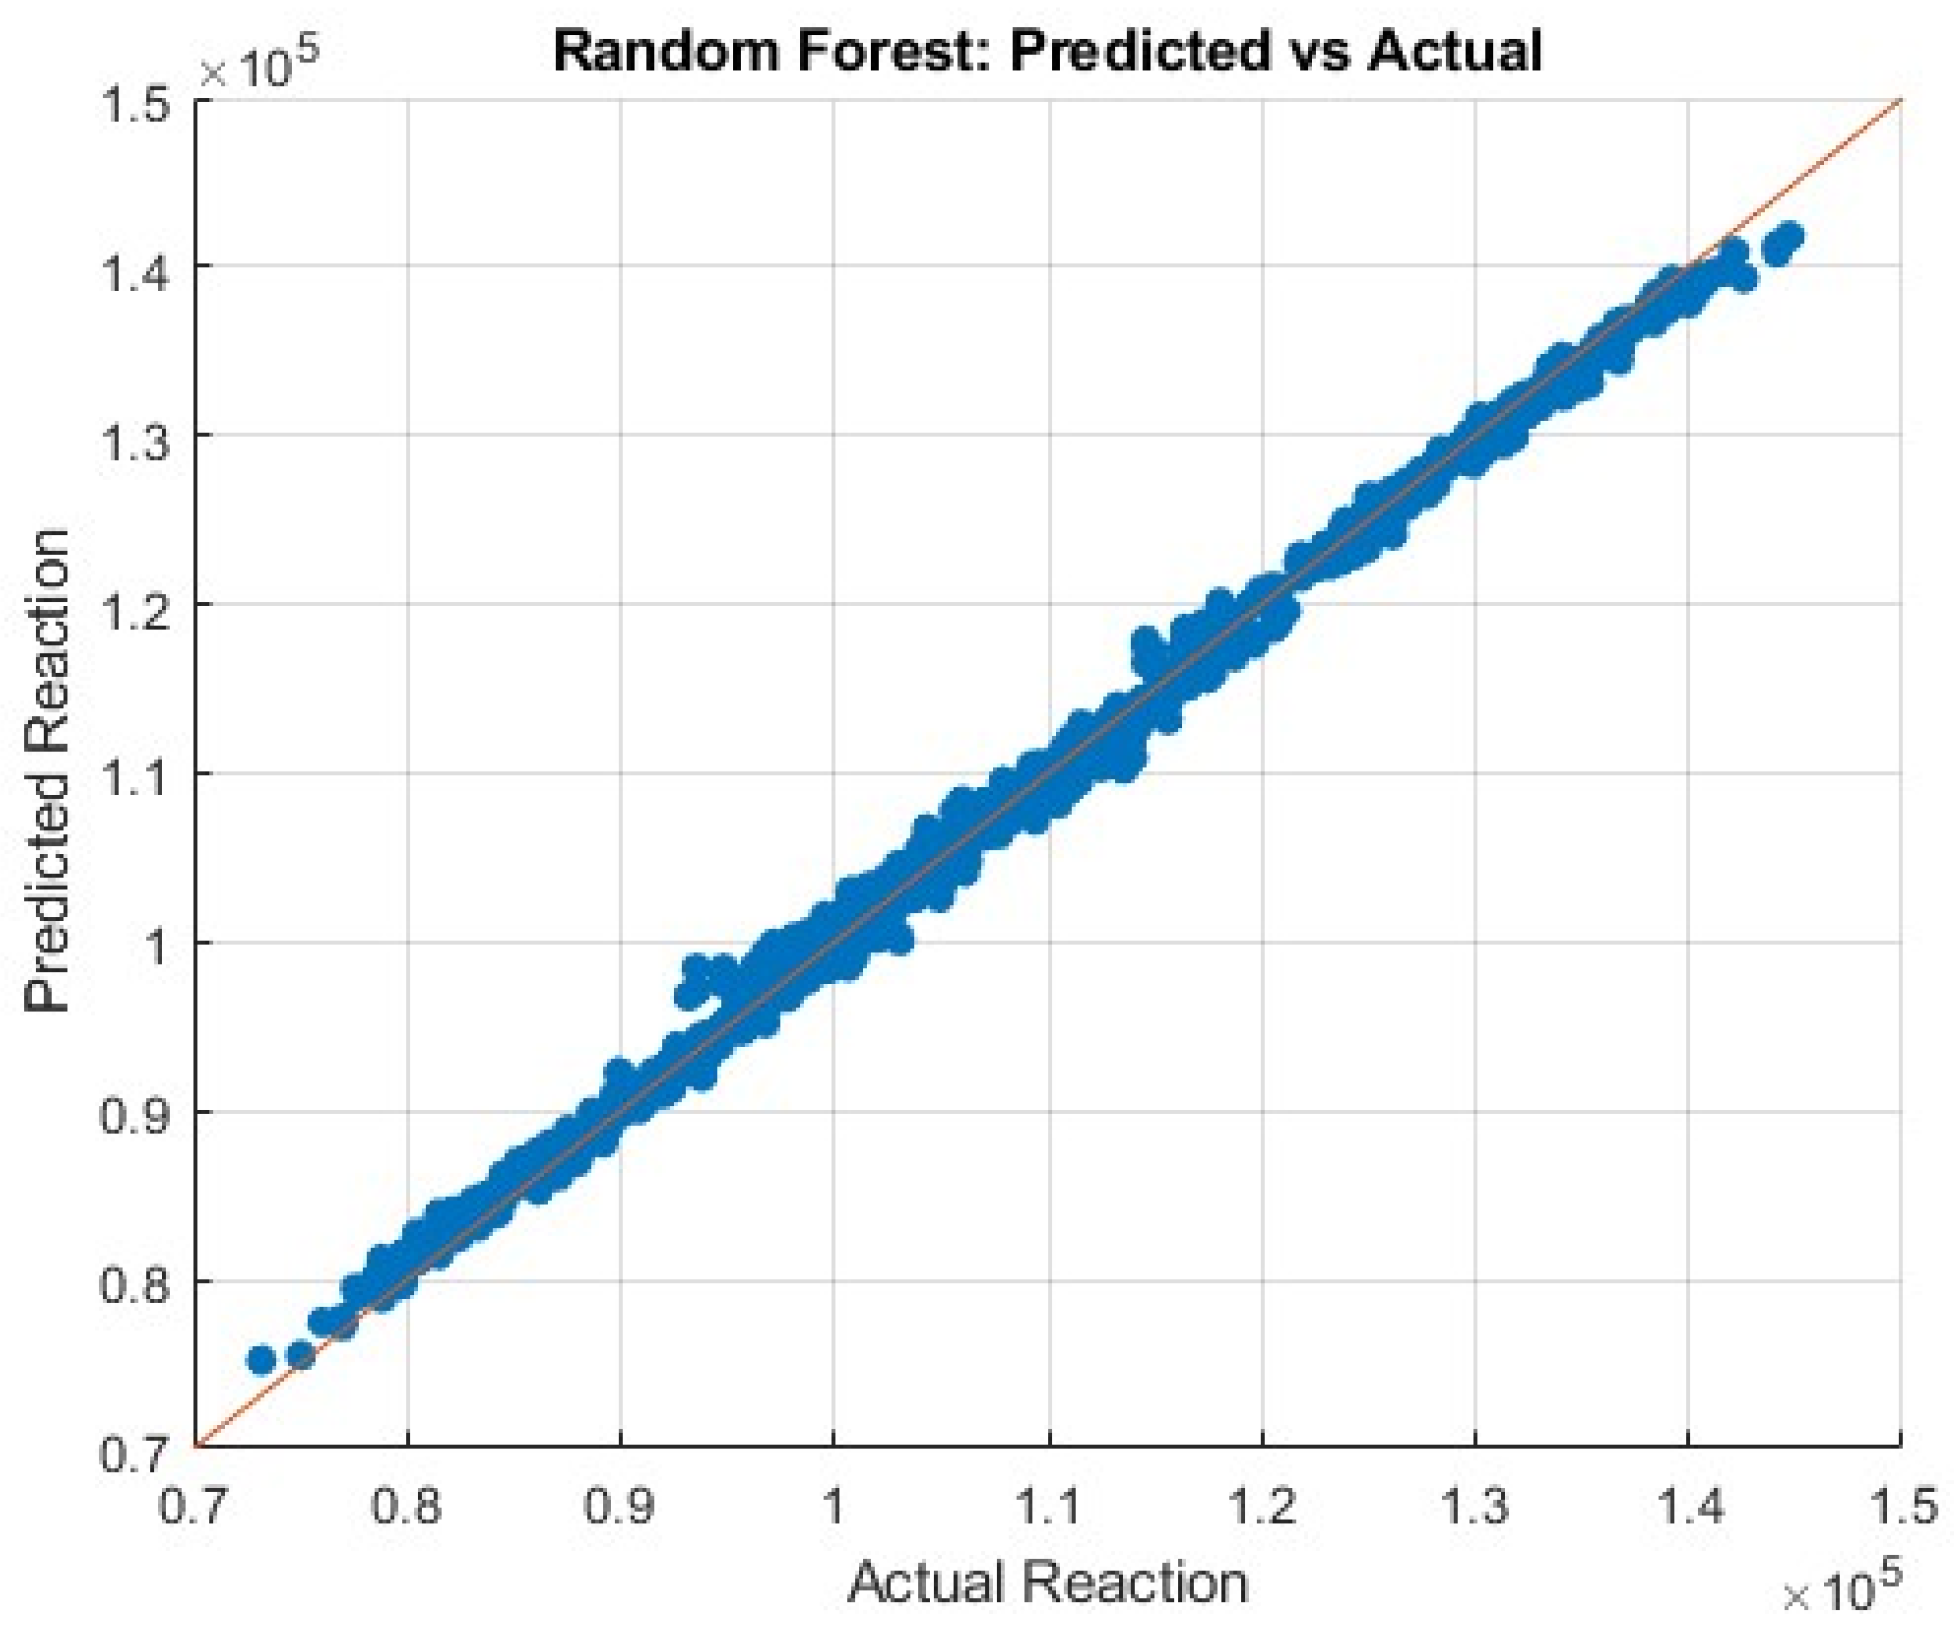
Figure 6.
Stability of Objective Weighting Methods (Entropy, Critic, SD, COV, MEREC) under different normalization methods (Vector, Z-score, Min-Max, Linear).
Figure 6.
Stability of Objective Weighting Methods (Entropy, Critic, SD, COV, MEREC) under different normalization methods (Vector, Z-score, Min-Max, Linear).
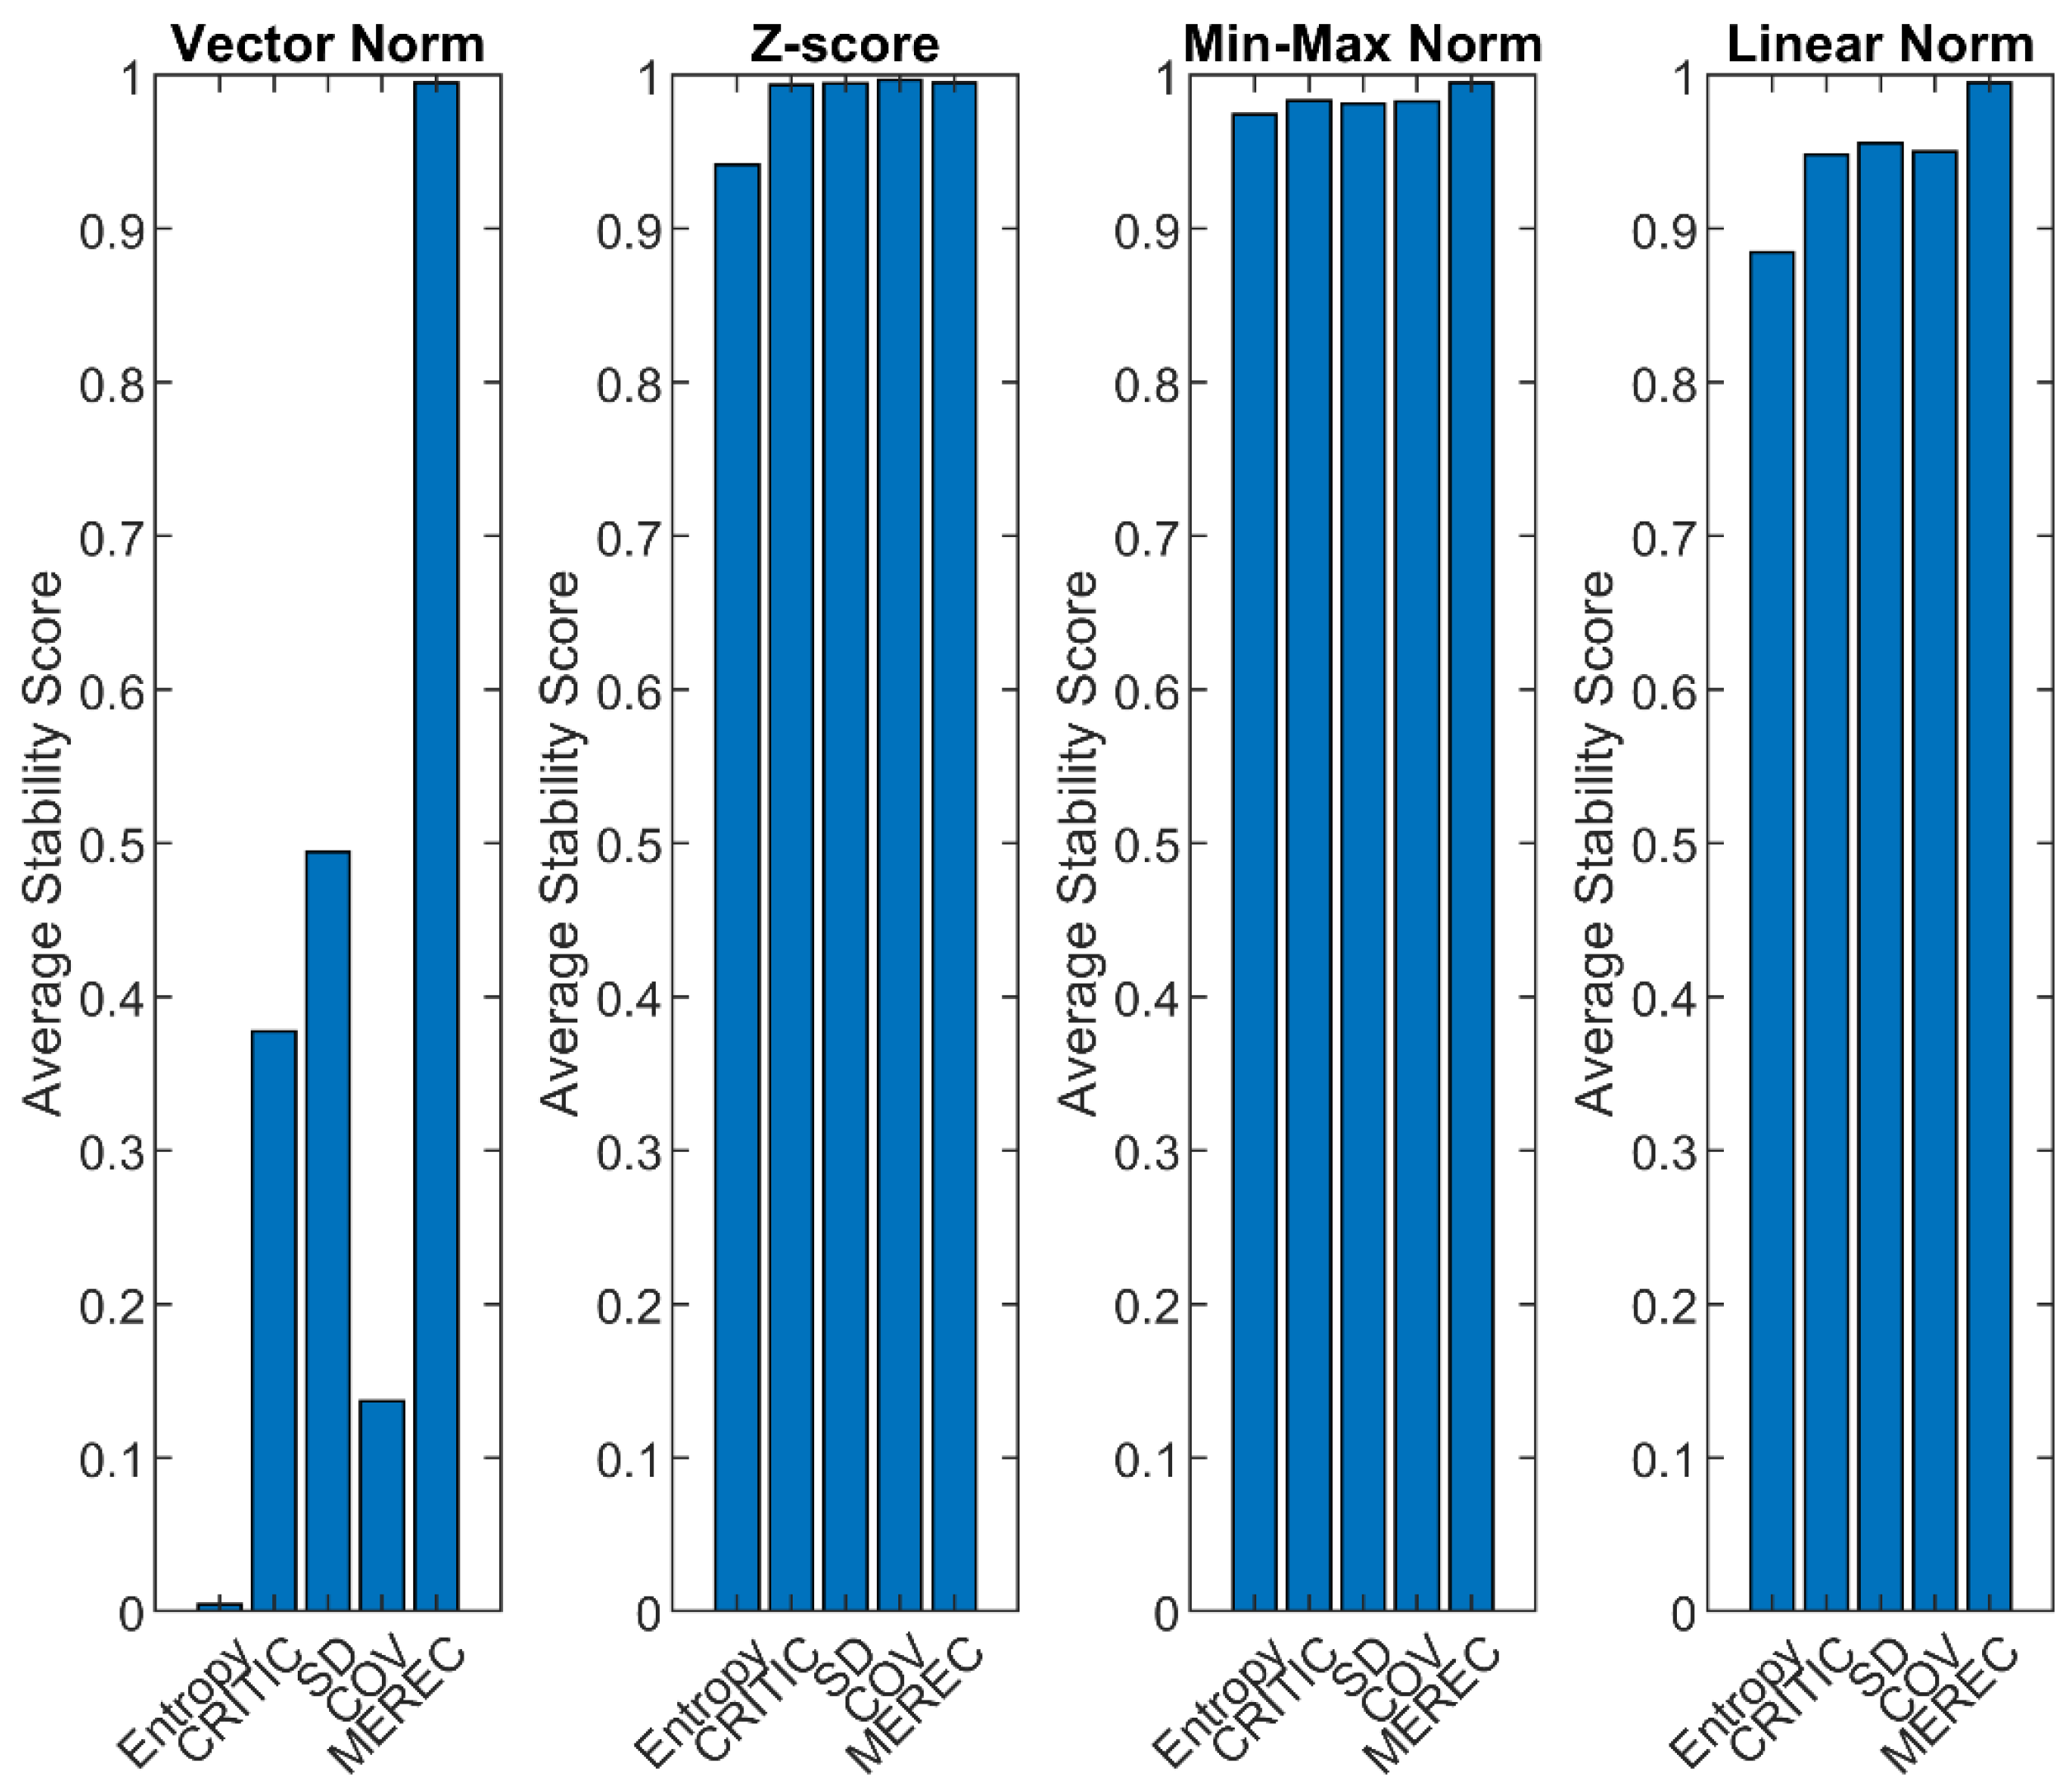
Figure 7.
(a) Stability scores under Z-score normalization across different perturbation levels, (b) Stability scores under Min–Max normalization across different perturbation levels, and (c) Stability scores under Linear normalization across different perturbation levels.
Figure 7.
(a) Stability scores under Z-score normalization across different perturbation levels, (b) Stability scores under Min–Max normalization across different perturbation levels, and (c) Stability scores under Linear normalization across different perturbation levels.

Figure 8.
Three-dimensional Pareto front for Cluster 13 (CID_13) showing all design alternatives (gray) and the non-dominated Pareto-optimal solutions (red) across the Environmental, Cost, and Performance scores.
Figure 8.
Three-dimensional Pareto front for Cluster 13 (CID_13) showing all design alternatives (gray) and the non-dominated Pareto-optimal solutions (red) across the Environmental, Cost, and Performance scores.
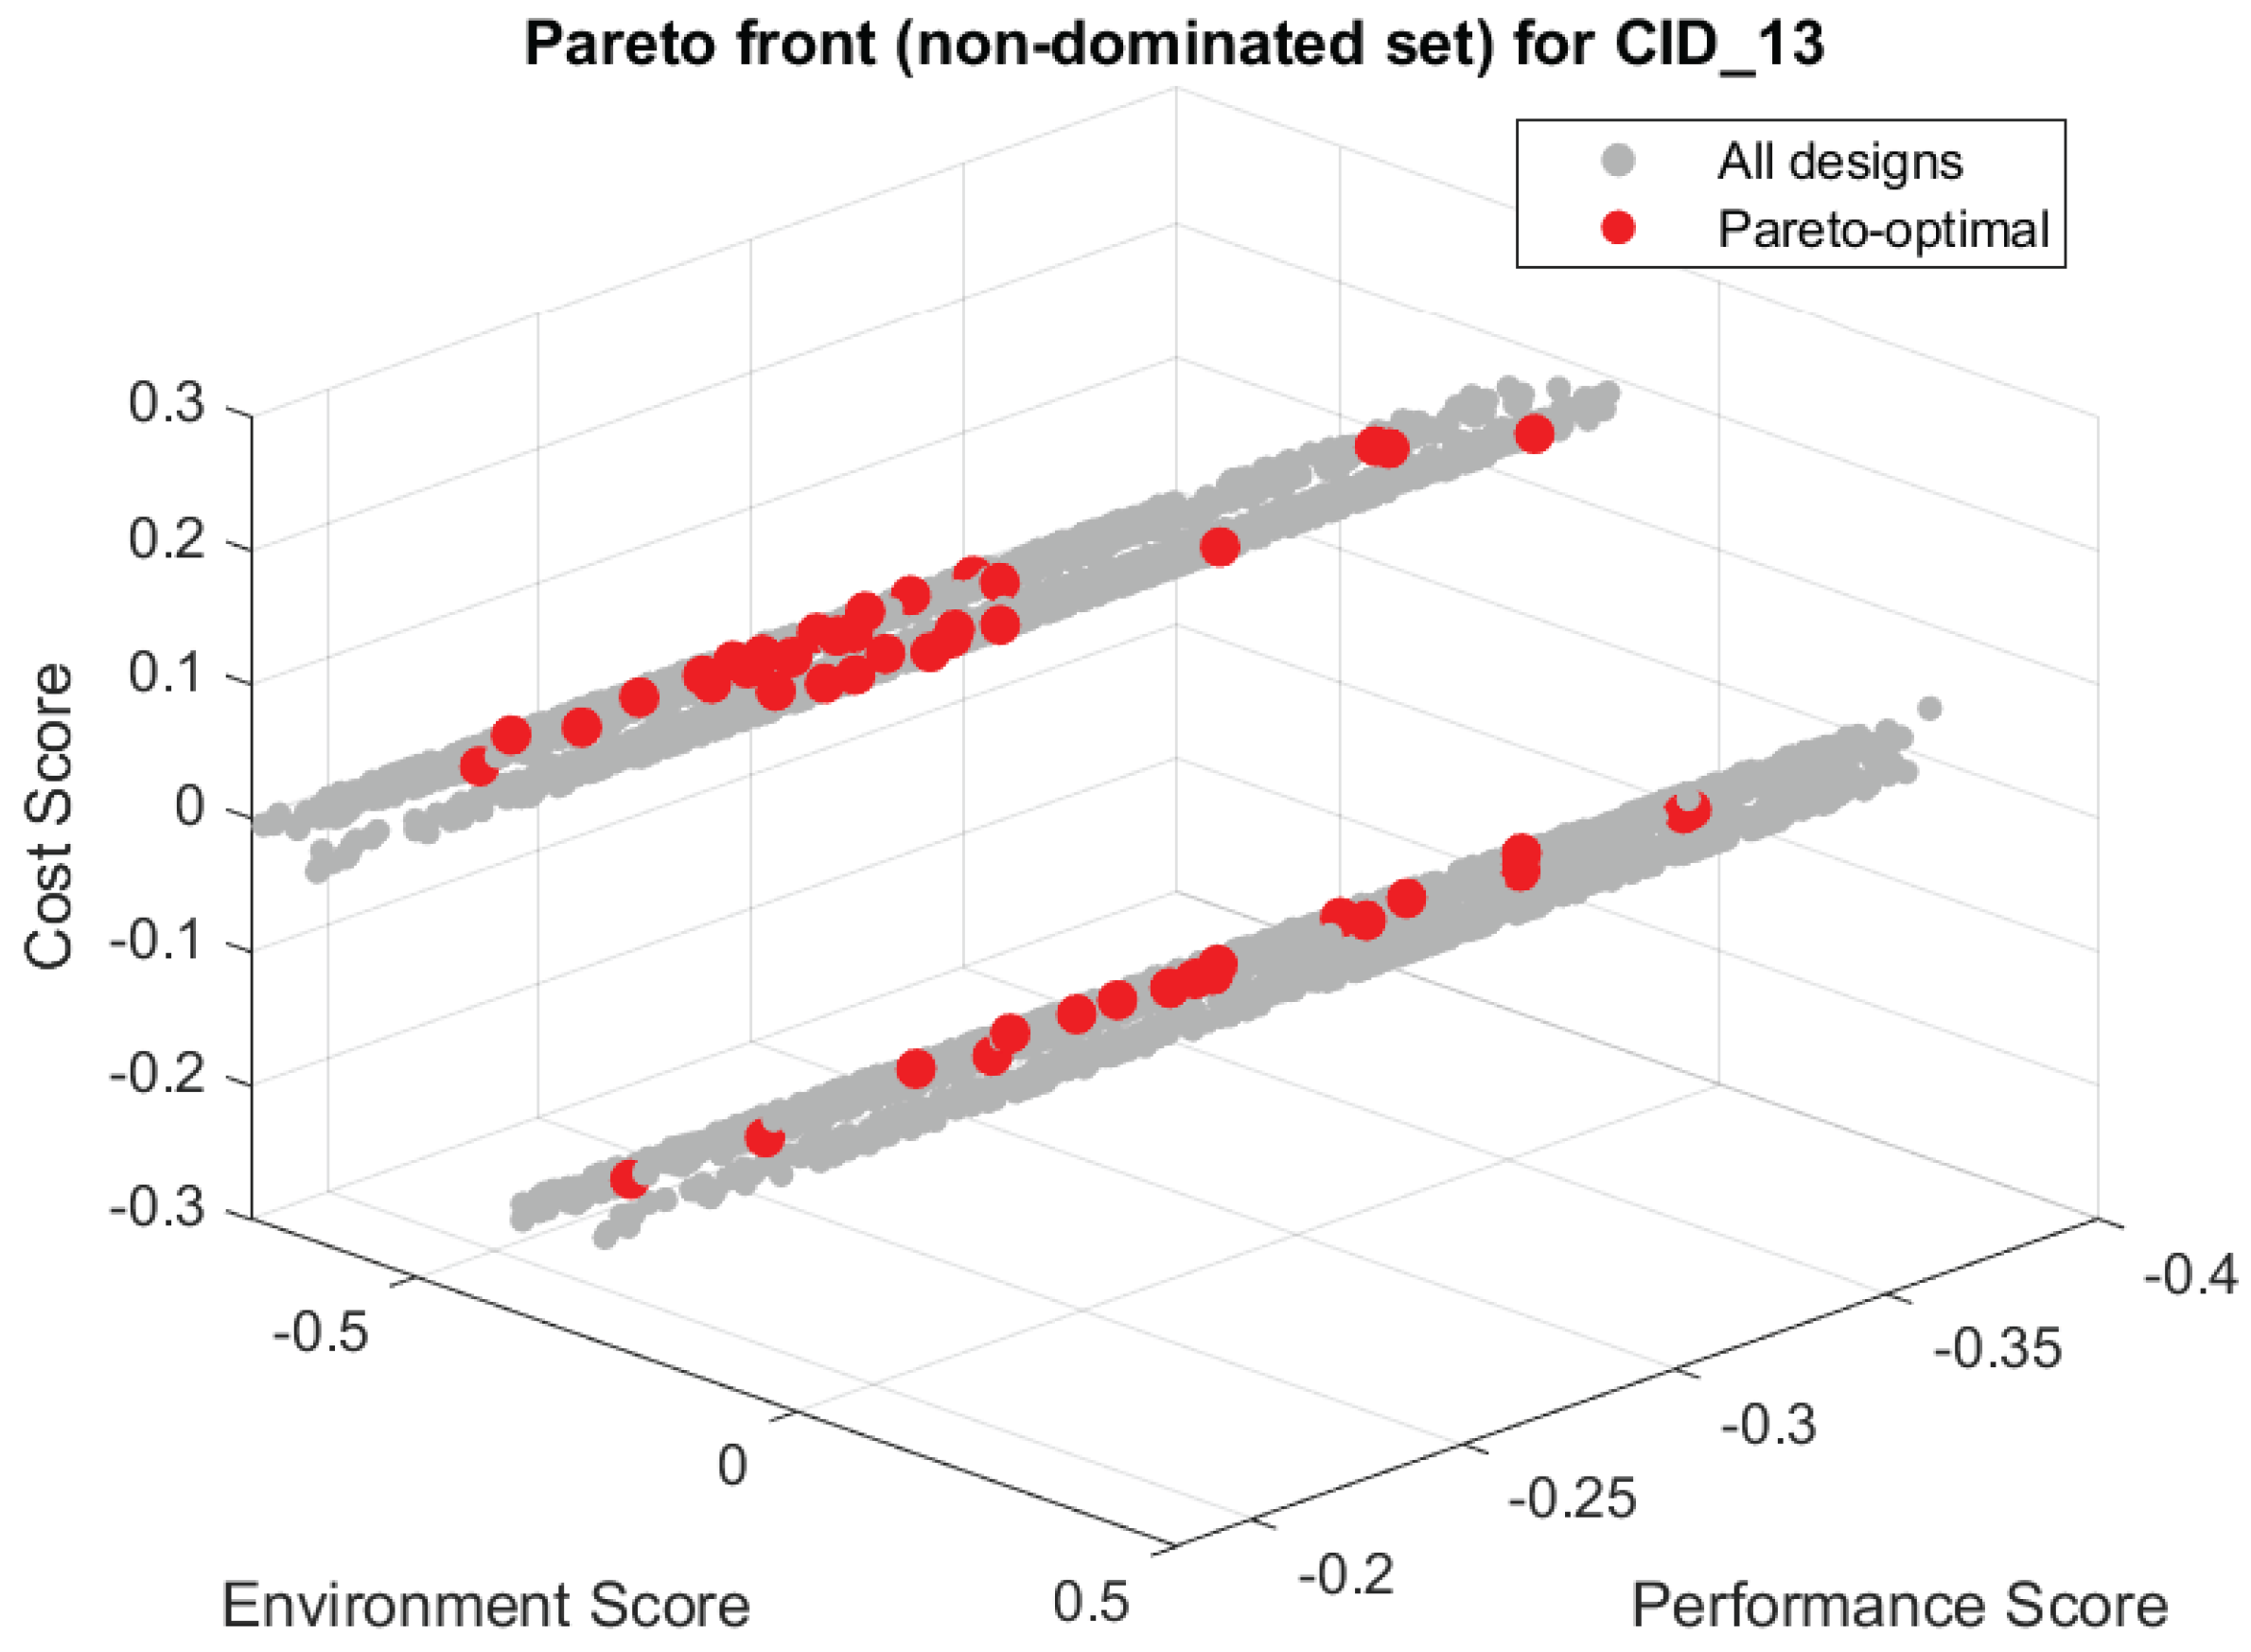

Table 1.
Design variables selected for the optimization.
| Design Variable | Description | Type | Options |
|---|---|---|---|
| Material | Specifies the material type of each sub-component | Discrete | Al2024, Al7075, TP-CFRP woven fabric, TS-CFRP UD fabric |
| Joining Method | Defines the connection between skin and stiffeners | Discrete | Bonding, Welding |
| Thickness | Sets the thickness of skin, stiffeners and frames | Continuous | Skin: 2.0–3.0 mm; Stiffener: 1.5–2.5 mm; Frame: 1.5–2.0 mm |
Table 2.
Distribution of design alternatives by material family.
| Material family | Discrete combination |
Per combination instances | Total instances |
|---|---|---|---|
| Aluminum (Al2024/Al7075) | 32 | 726 | 23,232 |
| Thermoset (TS) | 1 | 726 | 726 |
| Thermoplastic (TP) | 2 | 726 | 1,452 |
| Total | 35 | 726 | 25,410 |
Table 3.
Distribution of joining methods by material type.
| Material family | Expected | Actual |
|---|---|---|
| Aluminum + Metal Welding | 11,616 | 11,616 |
| Aluminum + Bonding | 11,616 | 11,616 |
| TS + Bonding | 726 | 726 |
| TP + TP Welding | 726 | 726 |
| TP + Bonding | 726 | 726 |
| Total | 25,410 | 25,410 |
Table 4.
The sustainability criteria used in the panel optimization, grouped by environmental, cost, and performance categories.
Table 4.
The sustainability criteria used in the panel optimization, grouped by environmental, cost, and performance categories.
| Criteria | Description | Category |
|---|---|---|
| C1 | Human Health (DALY’s) | Environment |
| C2 | Ecosystems (species. Year) | Environment |
| C3 | Resources (USD 2013) | Environment |
| C4 | Global Warming Potential (kg CO2) | Environment |
| C5 | Material Cost | Cost |
| C6 | Energy Cost | Cost |
| C7 | Use Cost | Cost |
| C8 | EoL Cost | Cost |
| C9 | Specific Stiffness | Performance |
Table 5.
The normalization methods and their characteristics. is the value of the decision matrix that belongs to the design and to the criterion .
Table 5.
The normalization methods and their characteristics. is the value of the decision matrix that belongs to the design and to the criterion .
| Method | Benefit criteria (max) | Cost criteria (min) | Description |
|---|---|---|---|
| Vector Normalization | Transforms using Euclidean norm, with cost criteria inverted | ||
| Linear Scale | Scales relative to maximum for benefits and minimum for costs | ||
| Z-score | Standardizes each criterion based on its mean (μ) and standard deviation (σ), converting all to a comparable scale centered at zero. | ||
| Min-Max | Scales to [0,1] range with appropriate direction |
Table 6.
The objective weighting methods and their main principles.
| Method | Underlying principle | Key aspect captured |
|---|---|---|
| Entropy | Measures the degree of disorder or information diversity of each criterion [26,27] | Information content / contrast among alternatives |
| CRITIC | Considers both the standard deviation of each criterion and its correlation with the others [28] | Conflict and contrast intensity |
| MEREC | Evaluates the impact of removing each criterion on the overall performance score [29,30] | Marginal contribution of each criterion |
| SD | Uses the dispersion (standard deviation) of criterion values [26,28,31] | Variability magnitude |
| COV | Ratio of standard deviation to mean value [26] | Relative variability / coefficient of variation |
Table 7.
Regression coefficients (a, b) of the criteria (C1–C8) for each panel subcomponent and joining method.
Table 7.
Regression coefficients (a, b) of the criteria (C1–C8) for each panel subcomponent and joining method.
|
Component/ Material |
C1 | C2 | C3 | C4 | C5 | C6 | C7 | C8 | |||||||||
| a | b | a | b | a | b | a | b | a | b | a | b | a | b | a | b | ||
| Clips/Al2024 | 0.0098 | 0.0 | 2e-05 | 0.0 | 3527.4 | 2e-08 | 3231.1 | -1e-08 | 5.0 | 0.0 | 3.70 | 0.0 | 4427.9 | 2e-08 | 0.89 | 0 | |
| Clips/Al7075 | 0.0098 | -2e-10 | 2e-05 | 0.0 | 3527.3 | -3e-04 | 3527.3 | -2e-04 | 7.0 | 0.0 | 3.70 | -2e-09 | 4427.9 | 6e-05 | 0.89 | -4e-10 | |
| Clips/TP CFRP | 0.0102 | -2e-12 | 2e-05 | 0.0 | 3536.8 | -9e-07 | 3536.8 | -8e-07 | 25.7 | 0.0 | 84.59 | 0.0 | 4427.9 | -1e-06 | 0.06 | 0.0 | |
| Clips/TS CFRP | 0.0102 | -1e-12 | 2e-05 | 0.0 | 3536.6 | -4e-07 | 3536.8 | -4e-07 | 67.6 | 0.0 | 87.76 | 0.0 | 4427.9 | -5e-07 | 0.06 | 0.0 | |
| Frames/Al2024 | 0.0098 | -5e-12 | 2e-05 | 0.0 | 3527.0 | -2e-06 | 3527 | -2e-06 | 5.0 | 0.0 | 1.16 | 0.0 | 4427.9 | -2e-06 | 0.89 | 0.0 | |
| Frames/Al7075 | 0.0098 | -2e-10 | 2e-05 | 2e-12 | 3527.0 | 1e-04 | 3527 | -3e-05 | 7.0 | 0.0 | 1.16 | 1e-08 | 4427.9 | 1e-04 | 0.89 | 0.0 | |
| Frames/TP CFRP | 0.0102 | -3e-12 | 2e-05 | 0.0 | 3536.8 | -1e-06 | 3536.8 | -9e-07 | 25.7 | 0.0 | 84.60 | 0.0 | 4427.9 | -1e-06 | 0.06 | 0.0 | |
| Frames/TS CFRP | 0.0102 | 2e-12 | 2e-05 | 0.0 | 3536.6 | 9ε-07 | 3389.1 | 8e-07 | 67.6 | 0.0 | 87.76 | 0.0 | 4427.9 | 1e-06 | 0.06 | 0.0 | |
| Skin/Al2024 | 0.0098 | 0.0 | 2e-05 | 2e-18 | 3527.0 | 0.0 | 3230.4 | -385.45 | 5.0 | 0.0 | 1.14 | 0.0 | 4427.9 | 7e-10 | 0.89 | 0.0 | |
| Skin/Al7075 | 0.0098 | 0.0 | 2e-05 | -9e-12 | 3527.0 | -2e-04 | 3221.3 | -0.0012 | 7.0 | 2e-06 | 1.14 | -2e-07 | 4427.9 | -0.0066 | 0.89 | 4e-07 | |
| Skin/TP CFRP | 0.0102 | -5e-11 | 2e-05 | 0.0 | 3536.8 | 2e-05 | 3389.9 | 2e-05 | 25.7 | 0.0 | 84.60 | 4e-12 | 4427.9 | -2e-05 | 0.06 | 0.0 | |
| Skin/TS CFRP | 0.0102 | 3e-12 | 2e-05 | 0.0 | 3536.6 | 1e-06 | 3389.9 | 9e-07 | 67.6 | 2e-12 | 87.76 | 0.0 | 4427.9 | 1e-06 | 0.06 | 0.0 | |
| Stringers/Al2024 | 0.0098 | 1e-09 | 2e-05 | 1e-12 | 3527.0 | 2e-04 | 3222 | -2e-05 | 5.0 | 2e-06 | 1.16 | 0..0 | 4427.9 | -4e-04 | 0.89 | 1e-07 | |
| Stringers/Al7075 | 0.0098 | 1e-11 | 2e-05 | 0.0 | 3527.0 | 4e-06 | 3224 | 4e-06 | 7.0 | 0.0 | 1.16 | 0.0 | 4427.9 | 6e-06 | 0.89 | 0.0 | |
| Stringers/TP CFRP | 0.0102 | 0.0 | 2e-05 | 0.0 | 3536.8 | -4e-11 | 3389.9 | -3e-12 | 25.7 | 0.0 | 84.60 | 1e-12 | 4427.9 | -4e-11 | 0.06 | 0..0 | |
| Stringers/TS CFRP | 0.0102 | -6e-12 | 2e-05 | 0.0 | 3536.6 | -2e-06 | 3389.1 | -2e-06 | 67.6 | 0.0 | 87.76 | 1e-12 | 4427.9 | -3e-06 | 0.06 | 0.0 | |
| Joining method | C1 | C2 | C3 | C4 | C5 | C6 | C7 | C8 | |||||||||
| a | b | a | b | a | b | a | b | a | b | a | b | a | b | a | b | ||
| Welding | 0.0 | 0.0056 | 0.0 | 1.19e-05 | 0.0 | 2000 | 0.0 | 1830 | 0.0 | 393 | 0.0 | 0 | 0.0 | 2900 | 0.0 | 0.0 | |
| Bonding | 0.0 | 1.56e-06 | 0.0 | 4.49e-09 | 0.0 | 0.215 | 0.0 | 1.42 | 0.0 | 0.0 | 0.0 | 0.762 | 0.0 | 0.0 | 0.0 | 0.0 | |
Table 8.
Overall stability scores for the 4 normalization methods.
| Normalization method | Overall stability score |
|---|---|
| Vector Norm | 0.4016 |
| Z-score | 0.9844 |
| Min-Max | 0.9835 |
| Linear Norm | 0.9468 |
Table 9.
Criteria weights obtained by different objective weighting methods.
| Criterion | CRITIC | SD | COV | Entropy | MEREC |
|---|---|---|---|---|---|
| GWP total | 0.066464 | 0.10719 | 0.098803 | 0.086956 | 0.10914 |
| Human health total | 0.066703 | 0.10754 | 0.10008 | 0.088725 | 0.10929 |
| Ecosystems total | 0.067156 | 0.10827 | 0.10248 | 0.091588 | 0.10952 |
| Resources total | 0.067259 | 0.10836 | 0.10253 | 0.091743 | 0.10954 |
| Material cost total | 0.17912 | 0.097262 | 0.036394 | 0.016026 | 0.10429 |
| Energy cost total | 0.30103 | 0.12413 | 0.040242 | 0.023689 | 0.10563 |
| Use cost total | 0.06685 | 0.10794 | 0.10201 | 0.090798 | 0.10946 |
| EoL cost total | 0.089395 | 0.13009 | 0.16775 | 0.18718 | 0.11696 |
| Stiffness | 0.096022 | 0.10922 | 0.24971 | 0.3233 | 0.12617 |
| Max/Min | 4.5293 | 1.3375 | 6.8613 | 20.173 | 1.2097 |
Table 10.
Customized sustainability clusters, including environmental–cost–performance characteristics, total designs per cluster, and non-dominated solutions.
Table 10.
Customized sustainability clusters, including environmental–cost–performance characteristics, total designs per cluster, and non-dominated solutions.
| Cluster ID | Cluster characteristics | Designs per cluster | Non dominated designs per cluster |
|---|---|---|---|
| 0 | Low Env, Low Cost, Low Perf | 291 | 12 |
| 1 | Low Env, Low Cost, Medium Perf | 2499 | 24 |
| 2 | Low Env, Low Cost, High Perf | 1163 | 12 |
| 3 | Low Env, Medium Cost, Low Perf | 182 | 8 |
| 4 | Low Env, Medium Cost, Medium Perf | 1355 | 13 |
| 5 | Low Env, Medium Cost, High Perf | 862 | 8 |
| 9 | Medium Env, Low Cost, Low Perf | 355 | 10 |
| 10 | Medium Env, Low Cost, Medium Perf | 1135 | 14 |
| 11 | Medium Env, Low Cost, High Perf | 430 | 17 |
| 12 | Medium Env, Medium Cost, Low Perf | 2316 | 21 |
| 13 | Medium Env, Medium Cost, Medium Perf | 4498 | 47 |
| 14 | Medium Env, Medium Cost, High Perf | 1355 | 28 |
| 15 | Medium Env, High Cost, Low Perf | 1007 | 15 |
| 16 | Medium Env, High Cost, Medium Perf | 1291 | 11 |
| 17 | Medium Env, High Cost, High Perf | 319 | 12 |
| 20 | High Env, Low Cost, High Perf | 479 | 6 |
| 21 | High Env, Medium Cost, Low Perf | 872 | 11 |
| 22 | High Env, Medium Cost, Medium Perf | 692 | 15 |
| 23 | High Env, Medium Cost, High Perf | 574 | 12 |
| 24 | High Env, High Cost, Low Perf | 1329 | 10 |
| 25 | High Env, High Cost, Medium Perf | 1236 | 11 |
| 26 | High Env, High Cost, High Perf | 1170 | 9 |
Table 11.
Top-ranked alternatives obtained through R-TOPSIS within each sustainability cluster, indicating the corresponding material selections, joining methods, and optimized thickness values for the skin, stiffeners, and frames.
Table 11.
Top-ranked alternatives obtained through R-TOPSIS within each sustainability cluster, indicating the corresponding material selections, joining methods, and optimized thickness values for the skin, stiffeners, and frames.
| ID | Connection | |||||||
|---|---|---|---|---|---|---|---|---|
| 0 | Al7075 | Al2024 | Al7075 | Al7075 | Bonding | 2.6 | 2.2 | 1.8 |
| 1 | Al2024 | Al2024 | Al7075 | Al2024 | Bonding | 2.6 | 2.3 | 1.9 |
| 2 | Al2024 | Al2024 | Al2024 | Al7075 | Bonding | 2.8 | 1.9 | 1.5 |
| 3 | Al7075 | Al2024 | Al7075 | Al7075 | Metal Weld. | 2,6 | 2.4 | 1.8 |
| 4 | Al2024 | Al2024 | Al2024 | Al2024 | Metal Weld. | 2.7 | 2.3 | 1.8 |
| 5 | Al2024 | Al2024 | Al7075 | Al2024 | Metal Weld. | 2.8 | 2 | 1.8 |
| 9 | Al7075 | Al2024 | Al2024 | Al2024 | Bonding | 2.4 | 2.4 | 1.7 |
| 10 | Al7075 | Al7075 | Al7075 | Al7075 | Bonding | 2.5 | 2 | 1.7 |
| 11 | Al7075 | Al7075 | Al7075 | Al2024 | Bonding | 2.5 | 2.1 | 1.5 |
| 12 | Al2024 | Al7075 | Al2024 | Al2024 | Bonding | 2 | 2.2 | 1.8 |
| 13 | Al2024 | Al2024 | Al7075 | Al2024 | Bonding | 2.3 | 1.6 | 1.5 |
| 14 | Al2024 | Al2024 | Al7075 | Al7075 | Bonding | 2.2 | 2 | 1.5 |
| 15 | Al2024 | Al2024 | Al7075 | Al7075 | Metal Weld. | 2.1 | 2.1 | 2 |
| 16 | Al2024 | Al2024 | Al2024 | Al2024 | Metal Weld. | 2.2 | 2.1 | 1.7 |
| 17 | Al2024 | Al2024 | Al2024 | Al2024 | Metal Weld. | 2.3 | 1.9 | 1.5 |
| 20 | TS | TS | TS | TS | Bonding | 2.5 | 1.5 | 1.7 |
| 21 | Al2024 | Al7075 | Al2024 | Al7075 | Bonding | 2 | 1.5 | 1.9 |
| 22 | Al2024 | Al2024 | Al7075 | Al7075 | Bonding | 2 | 1.8 | 1.5 |
| 23 | TS | TS | TS | TS | Bonding | 2 | 16 | 1.5 |
| 24 | Al2024 | Al2024 | Al7075 | Al7075 | Metal Weld. | 2 | 1.5 | 1.6 |
| 25 | Al2024 | Al2024 | Al7075 | Al7075 | Metal Weld. | 2 | 1.7 | 1.5 |
| 26 | TP | TP | TP | TP | T, Welding | 2.1 | 1.6 | 1.5 |
Table 12.
Top five most sustainable panel configurations from the whole decision matrix using Min–Max normalization and SD weighting, showing materials, joining method, and optimized thicknesses.
Table 12.
Top five most sustainable panel configurations from the whole decision matrix using Min–Max normalization and SD weighting, showing materials, joining method, and optimized thicknesses.
| Ranking | Connection | |||||||
|---|---|---|---|---|---|---|---|---|
| 1 | TP | TP | TP | TP | TP Welding | 2 | 1.5 | 1.5 |
| 2 | TP | TP | TP | TP | TP Welding | 2 | 1.5 | 1.7 |
| 3 | TP | TP | TP | TP | TP Welding | 2 | 1.6 | 1.5 |
| 4 | TP | TP | TP | TP | TP Welding | 2.1 | 1.5 | 1.5 |
| 5 | TP | TP | TP | TP | TP Welding | 2.1 | 1.6 | 1.5 |
Disclaimer/Publisher’s Note: The statements, opinions and data contained in all publications are solely those of the individual author(s) and contributor(s) and not of MDPI and/or the editor(s). MDPI and/or the editor(s) disclaim responsibility for any injury to people or property resulting from any ideas, methods, instructions or products referred to in the content. |
© 2025 by the authors. Licensee MDPI, Basel, Switzerland. This article is an open access article distributed under the terms and conditions of the Creative Commons Attribution (CC BY) license (http://creativecommons.org/licenses/by/4.0/).
Copyright: This open access article is published under a Creative Commons CC BY 4.0 license, which permit the free download, distribution, and reuse, provided that the author and preprint are cited in any reuse.


