Submitted:
10 December 2025
Posted:
11 December 2025
You are already at the latest version
Abstract
This study presents a comprehensive data visualization–based evaluation of Singapore’s waste management performance, focusing on behavioural, industrial, and environmental dimensions. Using multi-source datasets from 2014 to 2023, the research examines key factors shaping the nation’s waste profile, including the growth of plastic waste, public participation in recycling, and the dominance of non-domestic waste sectors. Through interactive dashboards and comparative time-series analyses, the findings reveal persistent structural challenges despite strong policy initiatives and public awareness campaigns. The COVID-19 pandemic significantly influenced consumption habits, triggering a surge in single-use plastics due to food delivery dependence, while household recycling rates remained low. Industrial and imported waste volumes continued to rise, underscoring the need for upstream policy interventions. The study also quantifies energy and crude oil savings from recycling, highlighting non-ferrous metals and plastics as the most resource-efficient materials. Overall, the research underscores the importance of integrating behavioural incentives, industrial accountability, and policy innovation to achieve Singapore’s Zero Waste Masterplan and Sustainable Development Goal 12 targets.
Keywords:
Singapore waste management
; data visualization
; sustainability analytics
; zero waste
; recycling trends
; public behaviour
; plastic waste
; industrial waste
; energy conservation
; policy innovation
; environmental data analysis
; SDG 12
; circular economy
Editorial Thinking
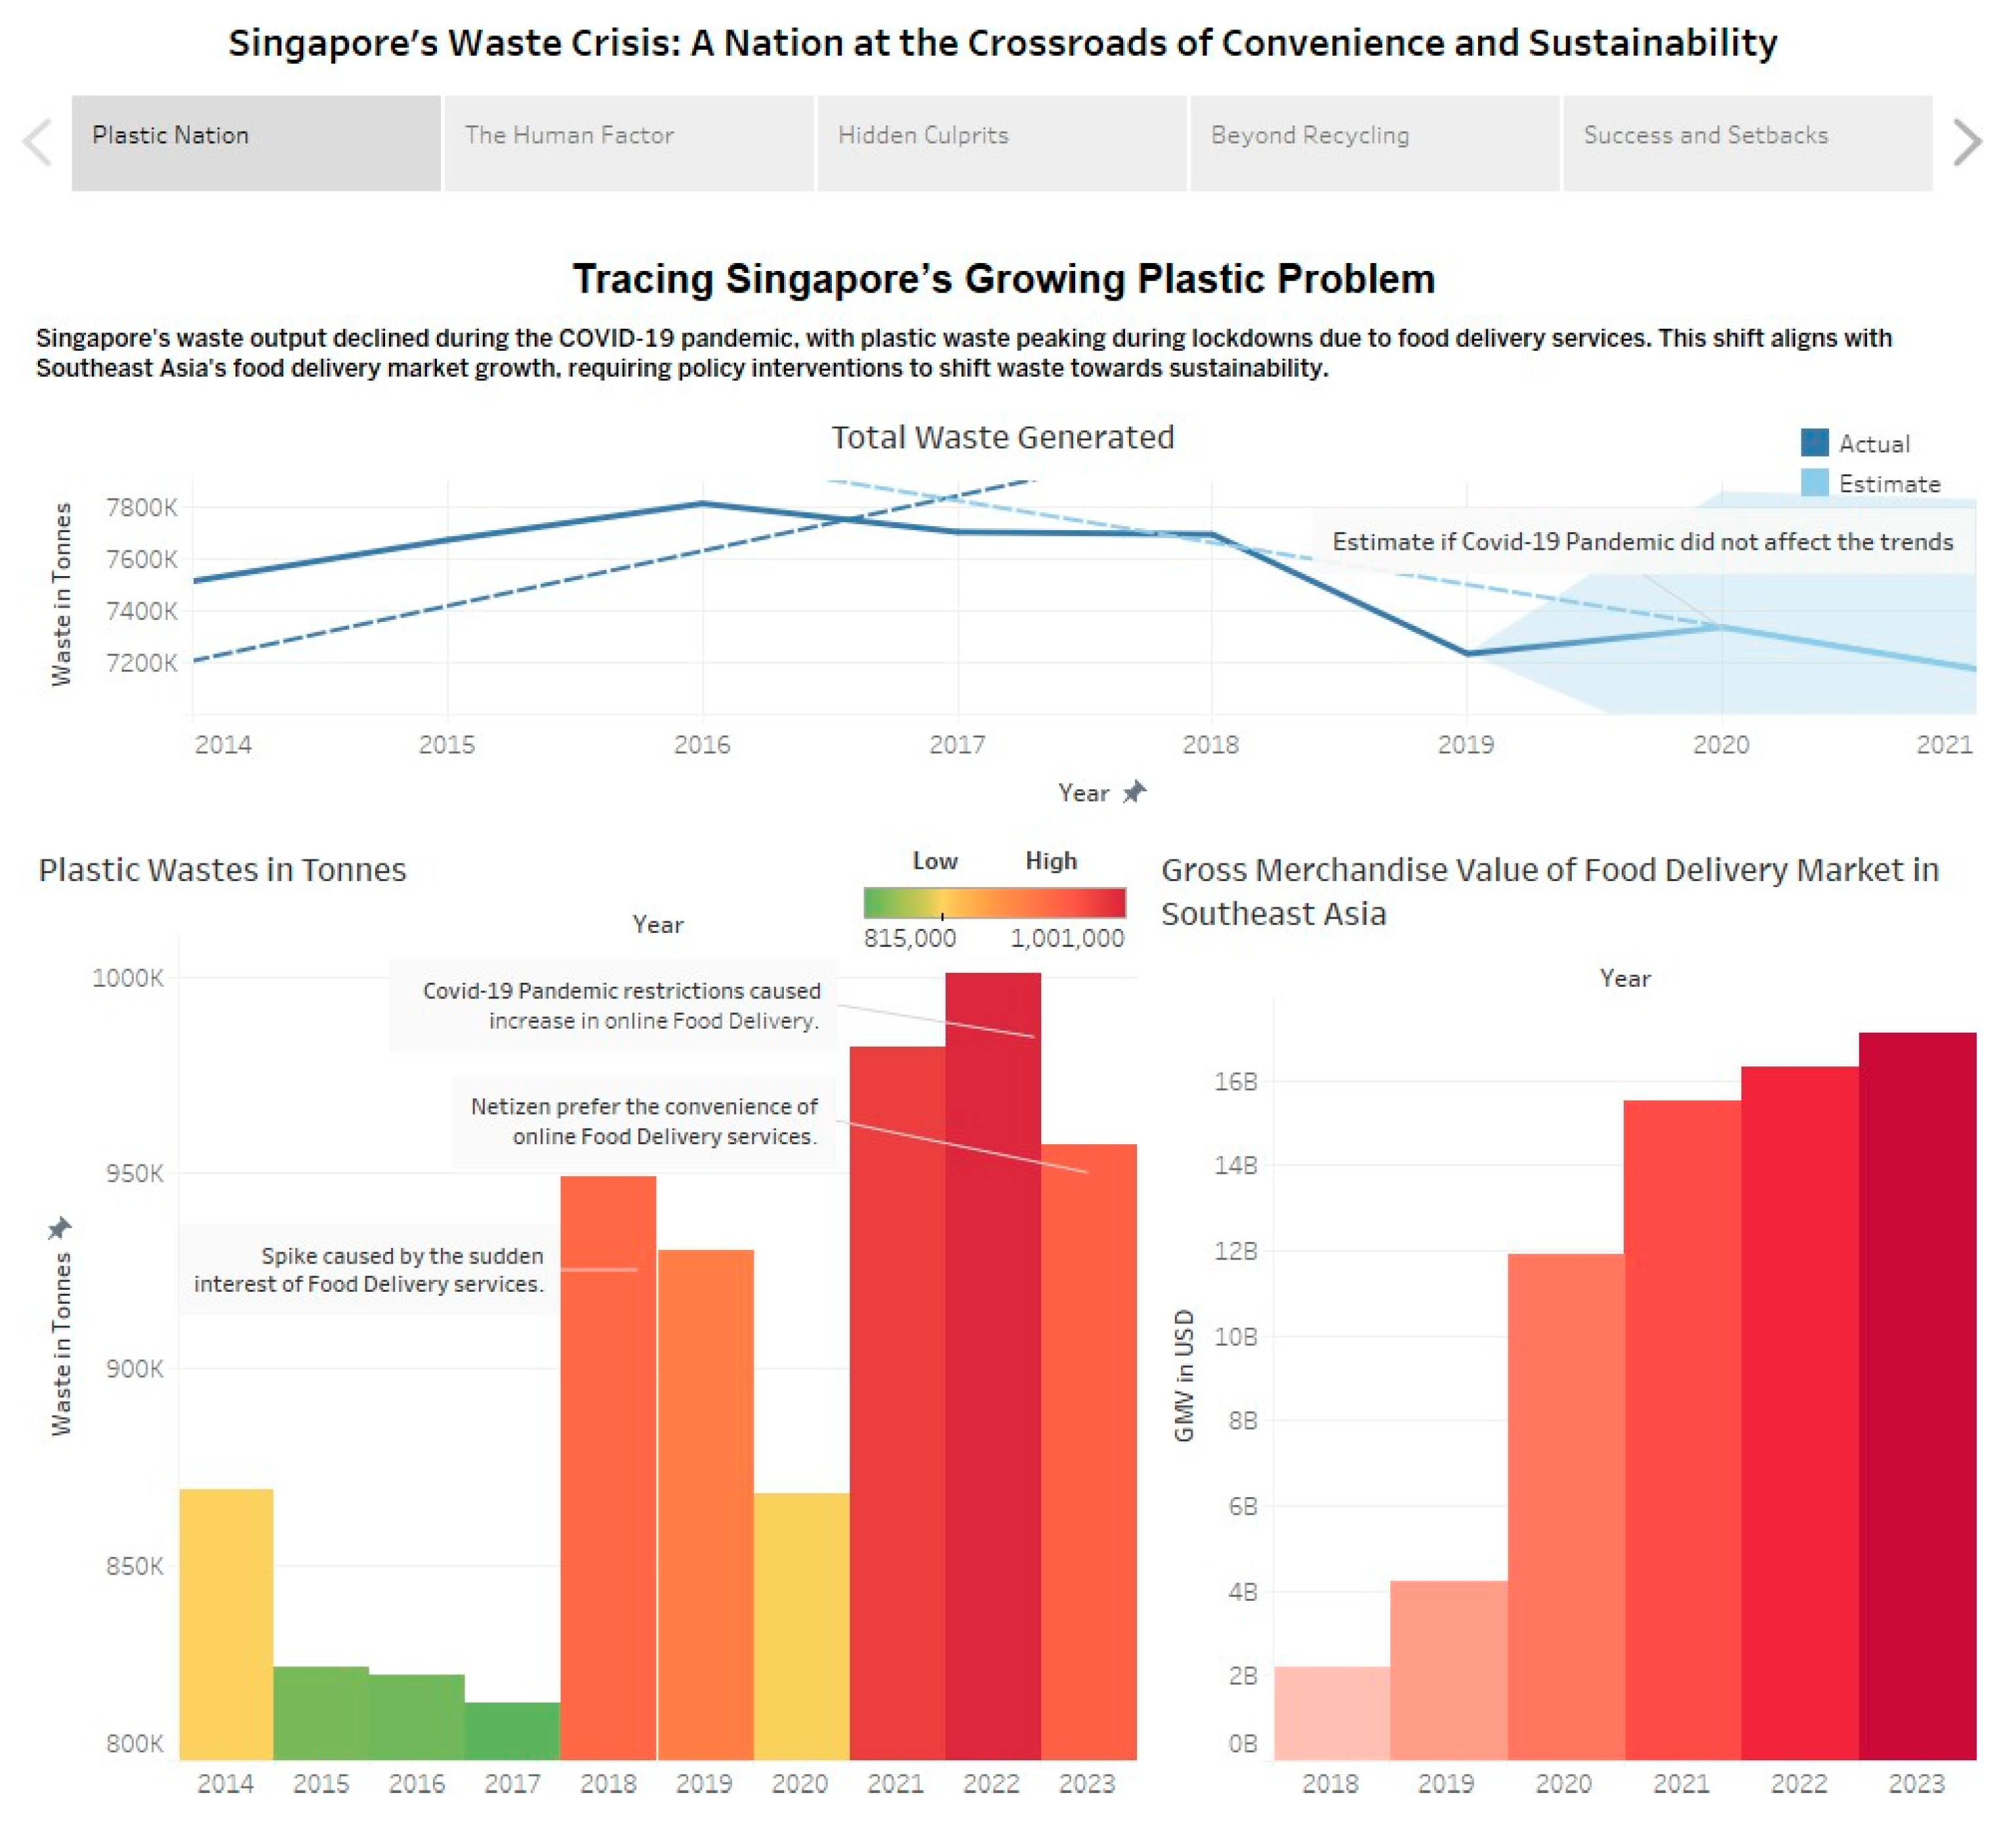
1.0. Plastic Nation: Tracing Singapore’s Growing Plastic Problem
By Sai Rama Mahalingam
1.0.1. Angle
This discussion extends beyond correct plastic usage and recycling, linking domestic behavioural changes to regional economic shifts. The line and bar charts highlight the increase in plastic usage during the pandemic and the transformation of Singapore's trash landscape as individuals increasingly reliant on food delivery services. The visualizations illustrate the subtle rise in the nation's dependence on plastic due to consumer convenience and e-commerce, by comparing local waste statistics with Southeast Asia's Gross Merchandise Value (GMV) for food delivery services.
1.0.2. Framing
This editorial examines the impact of the pandemic on Singapore's waste patterns from 2014 to 2023, including both actual and projected figures. The timeline enables readers to compare the stability before to the epidemic with the current instability, particularly around single-use plastics.
The narrative not only emphasizes Singapore's efforts but also situates them within the broader context of the food delivery sector in Southeast Asia. The GMV bar chart demonstrates rapid sector growth which explains the surges in local plastic waste. The time and geographical links indicate that Singapore's waste issues are increasingly connected with worldwide trade and consumer platforms, necessitating collaborative efforts and regulatory frameworks among nations.
1.0.3. Focus: Beyond Our Bin: Tracing the Plastic Trail
The visualizations indicate that, beginning in 2018, total waste decreased, primarily due to pandemic-related slowdowns. Nevertheless, plastic waste significantly increased throughout that period. The bar graph of plastic garbage indicates a significant increase starting in 2018, with even greater peaks observed between 2020 and 2022. The remarks identify the COVID-19 lockdowns and the societal shift towards digital convenience as significant influences. Despite the relaxation of restrictions since 2021, a significant quantity of plastic waste persists, indicating that behavioural changes may be lasting.
The final chart backs up this claim by illustrating that the GMV of the Southeast Asian food delivery sector nearly doubled from 2020 to 2023. The plastic issue in Singapore extends beyond domestic concerns as it is also linked to economic shifts and consumer technology utilization. To mitigate its reliance on plastic, the government must employ regulatory mechanisms such as innovative sustainable packaging, guidelines for food service, and behavioural changes.
1.1. The Human Factor: How Public Behavior Shapes Waste Trends
By Sivamuganthan Mohana Dass
1.1.1. Angle
Public behaviour and perception plays a vital role in influencing Singapore's development towards a sustainable future. Based on multiple studies carried out between 2018 to 2024, it is clear that while Singapore has developed numerous strategies and implemented a wide range of sustainable initiatives and awareness campaigns, public participation still falls short of fully matching these efforts. Despite widespread awareness, consistent adoption of sustainable habits is still developing. This highlights the critical impact of everyday choices on the nation’s overall sustainability goals.
1.1.2. Framing
This analysis is based on recent survey responses and graphical data that collectively expose both the incentives that drive sustainable habits and the barriers that hinder them. The key factors analysed include: convenience, economic motivations, environmental concern, and the presence of supportive infrastructure. The data indicates a mixed trajectory where there is steady progress such as increased recycling of plastic bottles and rising expectations for eco-friendly business practices, showing that substantial behavioural gaps persist. The rare usage of reusable bags and low recycling rate can also be identified based on the survey responses. By framing the data in this dual light of motivators and obstacles, the section underscores the complexity of fostering public commitment to sustainability.
1.1.3. Focus: Bridging the Intention–Action Gap in Public Sustainability Behavior
Despite surveys indicating increased public awareness, the actual behaviors in Singapore show a persistent gap between intention and action. Although many individuals in Singapore acknowledge the importance of recycling, reducing waste and supporting eco-friendly initiatives, these values are not consistently translated into habitual behaviour.
The data indicates that practical considerations such as convenience and tangible incentives often have a stronger influence on individual actions than environmental concern alone. Most individuals are more motivated to engage in recycling or trash reduction initiatives when systems are readily accessible or when they obtain immediate advantages. This indicates that logistical and psychological drivers frequently overshadow intrinsic motivations. Ultimately, closing the gap between intention and action calls for targeted measures that address these behavioural barriers.
1.2. Hidden Culprits: Industries Behind Singapore’s Waste Burden
By Addy Arif Bin Mahathir
1.2.1. Angle
Although Singapore's trash discourse mostly focuses on household accountability and individual recycling practices. This section employs a mix of pie charts, and bar charts to elucidate the primary contributors to Singapore's waste load. The national waste discourse often focuses on home accountability, although the visual representations will deliberately highlight sector-specific analyses, underscoring the preeminent contribution of industrial and commercial waste to the nation's total waste production.
1.2.2. Framing
This editorial is based on a decade-long data range (2014–2023) obtained from Singapore’s National Environment Agency (NEA). This timeframe was chosen to include pre-pandemic standards, the COVID-19 disruption phase, and subsequent recovery patterns, allowing a thorough comprehension of waste dynamics throughout time.
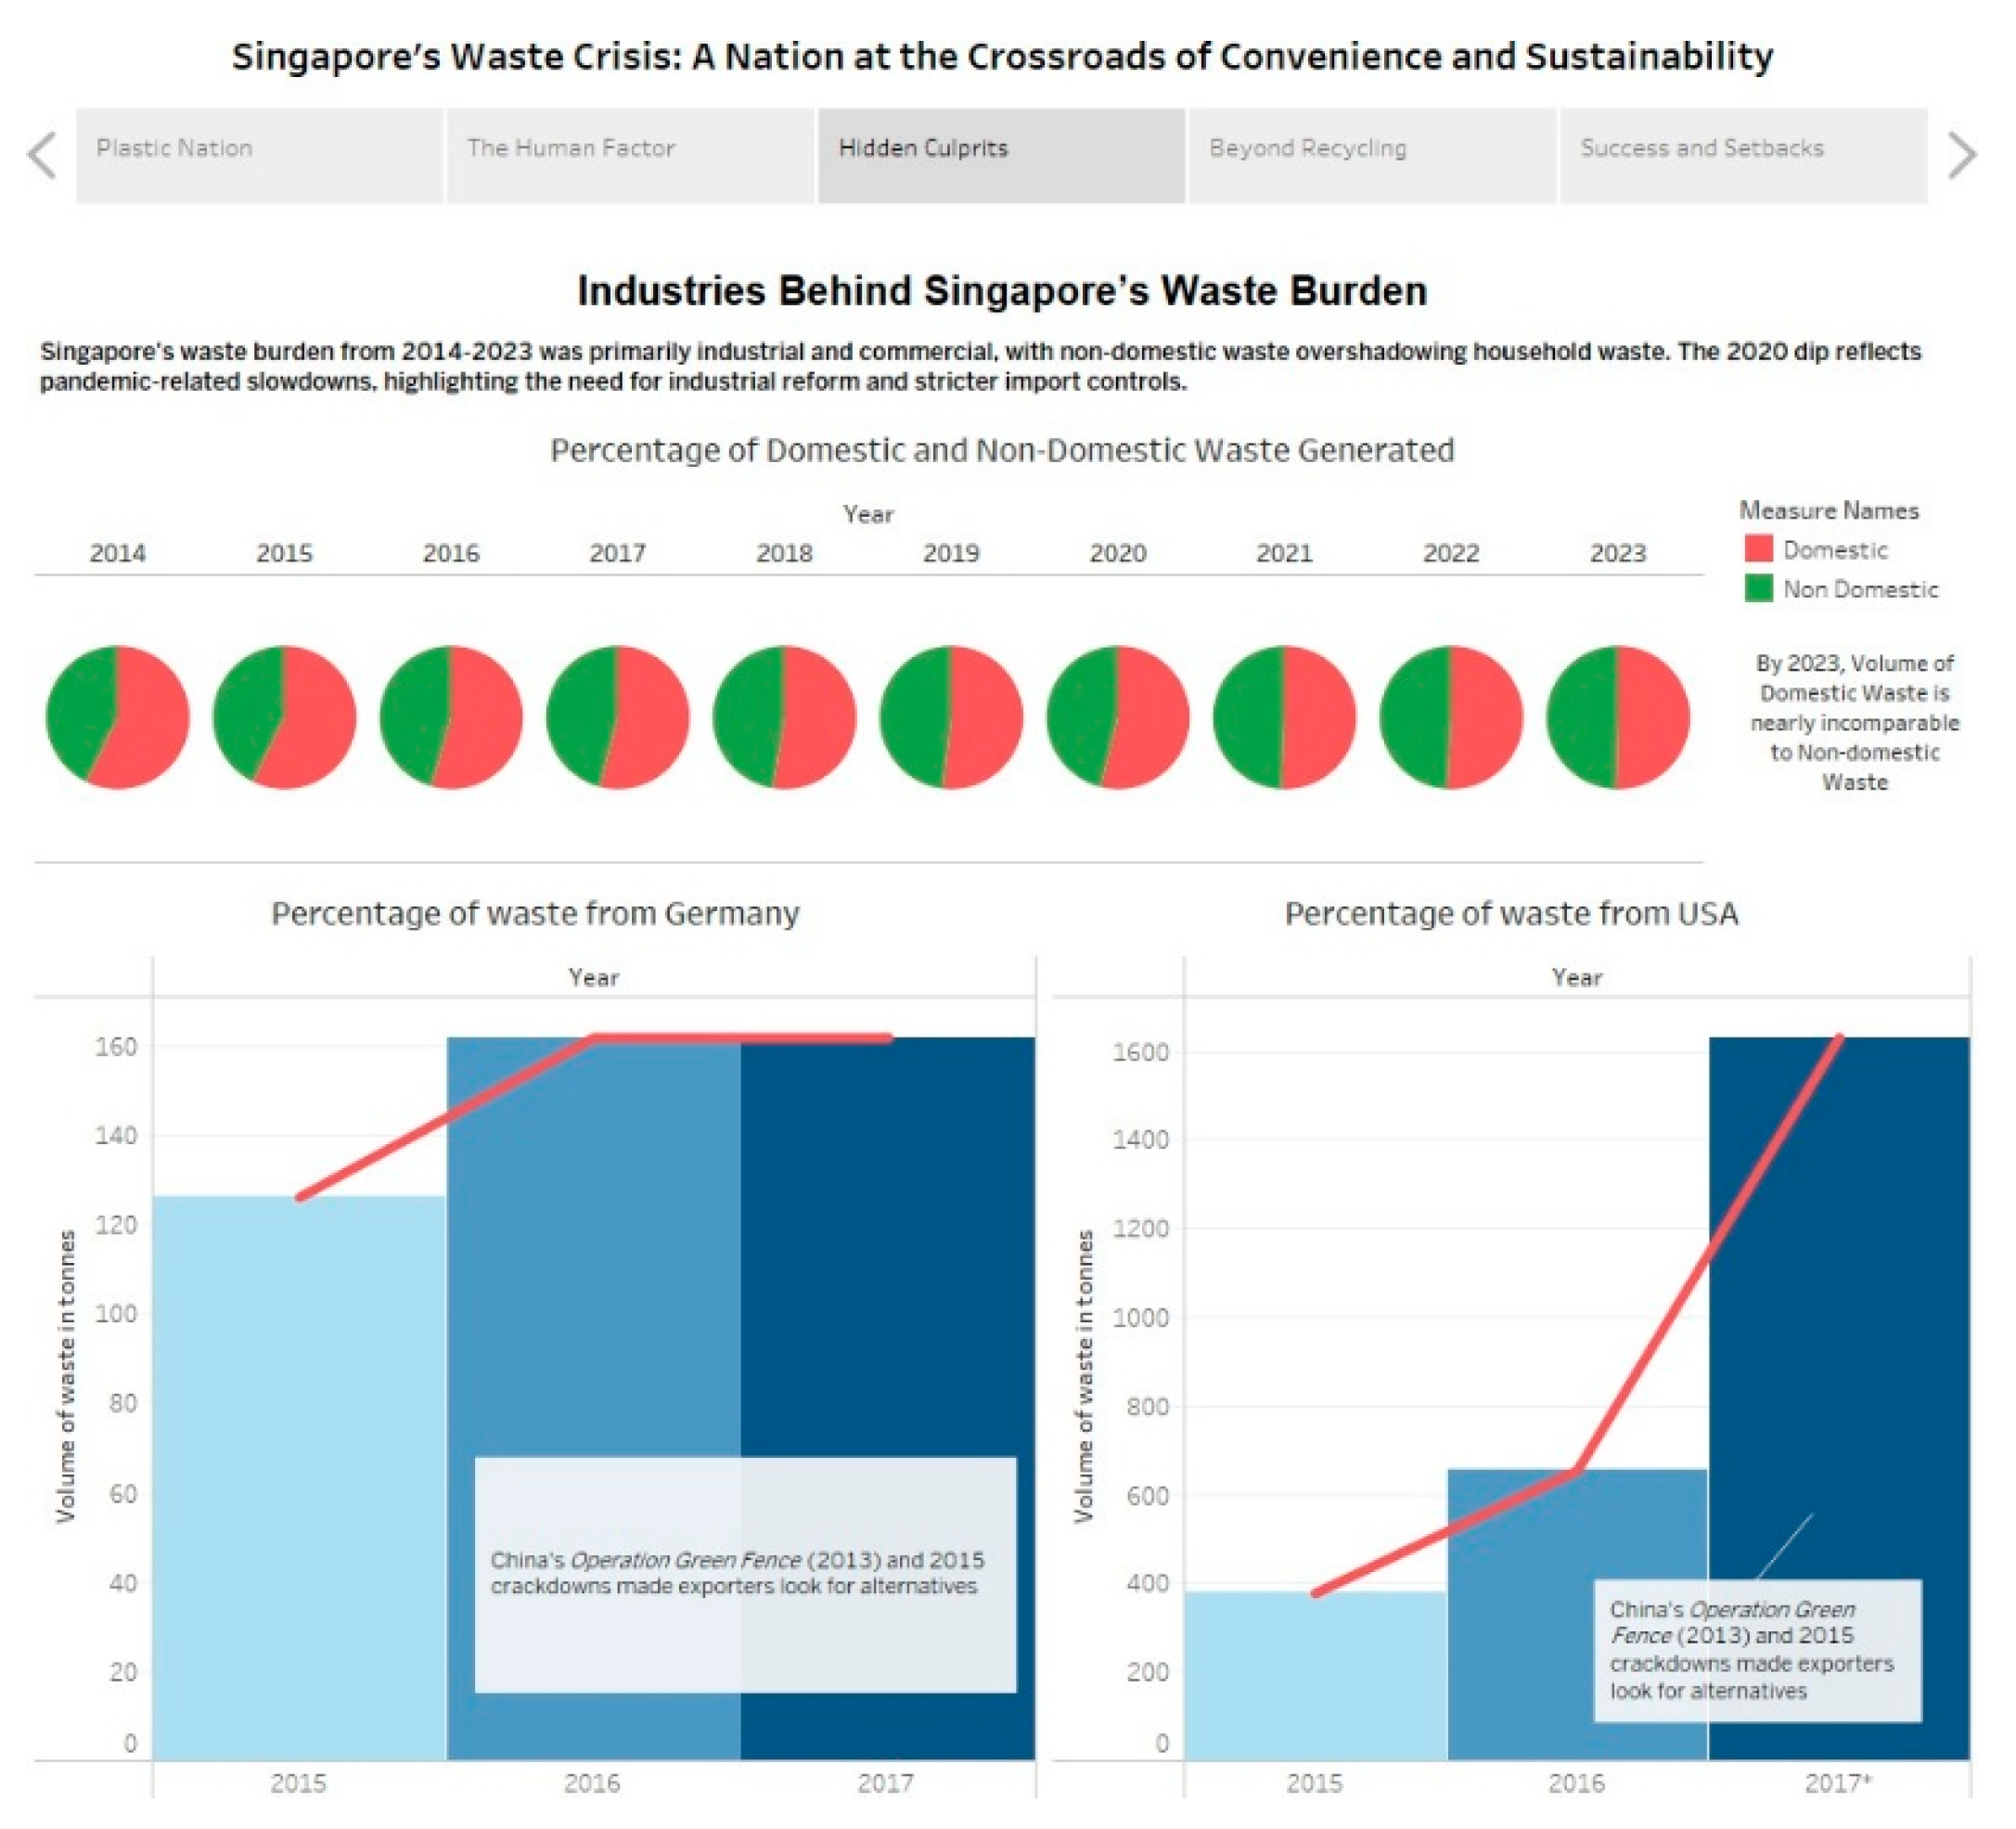
The editorial highlights structural trends by categorising the data into domestic and non-domestic sources, rather than focussing only on individual behaviour. The incorporation of garbage import data from Germany and the USA, along with annotations about China’s Operation Green Fence, broadens the analysis beyond Singapore, situating it within a more extensive geopolitical framework of evolving global waste movements. This perspective enables the audience to see waste as not just a national concern but also as a transnational repercussion of international policies and trade practices.
1.2.3. Focus: Non-Domestic Waste: The Predominant Contributor
The visualisations clearly indicate that non-domestic garbage has persistently comprised the bulk of Singapore’s trash production over the last decade. This pattern persists consistently, even throughout the 2020 COVID-19 lockdown, which somewhat reduced industrial production but failed to rectify the fundamental imbalance. The pie charts illustrate this difference, with non-domestic waste taking over more of the distribution each year shown. The following commentary emphasises that residential waste is practically unparalleled in volume, indicating that public messages and initiatives focused only on household recycling may overlook the broader objective.
Furthermore, the increase in garbage imports from Germany (2015–2017) and the USA (2017 onwards) is graphically correlated with China's import limits, highlighting Singapore's role as an unintentional recipient of diverted global waste. These features establish Singapore as both a producer and consumer of trash, underscoring the need for not just individual behavioural modifications, but also comprehensive governmental changes aimed at industry regulations and import restrictions.
1.3. Beyond Recycling: Rethinking Waste Through Energy and Oil Savings
By Noor Ul Amin
1.3.1. Angle
The core angle of this analysis can be framed as:
“Do all recycled materials provide equal returns - in terms of energy and crude oil savings -, or do some offer significantly better value than others?”
While it is widely known that recycling uses less energy and crude oil than producing new materials, less attention is paid to the variation of amounts saved across different material categories This analysis challenges the assumption that all recycling delivers similar environmental benefits.
Using a combination of bar charts and treemaps, the visualization (Figure 4) compares the energy and crude oil saved per metric kilo tonnes (1000 tonnes is a metric ton) of recycled material. It reveals that some materials generate far greater returns in terms of crude oil and energy savings than others and highlights what these materials are. The aim is to highlight these differences so appropriate policies can be made accordingly.
1.3.2. Framing
This editorial is based upon a study conducted spanning a 3-year window period consisting of consecutive years 2018, 2019, and 2020. There are a few reasons behind choosing this particular time frame.
Firstly, there is the issue of Limited access to post-2020 records due to government policies (the government often keeps such data private) and there is the issue of language barriers as the data is sometimes stored in other languages, in Singapore’s case it can be in Chinese, which makes it hard for a non-Chinese speaking researcher to access and utilize it.
Secondly, the window period takes into account the Covid-19 pandemic period, a recent event which left a significant impact on every sector of the world with disruptions. We will be taking into account the effects of Covid-19 pandemic as well by using this window period.
The visualization is interactive allowing users to filter the data by Year and material type (including the top N ,where ‘N’ is a user entered number, categories of waste produced in a year) and simultaneously examine changes in crude oil and energy savings from recycling materials. While the top waste categories remain constant throughout the 3 years, the analysis’ primary focus is not on the waste volume but on what is saved through recycling each material. The visual’s framing is less on output of recycling materials of different categories and more on the impact - they have on the environment - of recycling them to encourage the audience to evaluate their recycling practices and reform them accordingly.
1.3.3. Focus: Energy and Crude Oil Saved from Recycling waste Items
The visuals clearly indicate that not all materials save an equal amount of energy and that non-ferrous metals save the highest amount of energy and crude oil per metric kilo ton recycled. We see this pattern being consistent throughout all the three years from 2018 till 2020 (the year when Covid-19 Pandemic struck. Despite bringing lots of business to a slowdown) and some ,to a complete halt, worldwide, the waste patterns stayed constant in Singapore. Non-ferrous metals still had the lead. This was despite the fact that non-ferrous metals were not even in the Top 5 categories of waste generated which in turn indicates that their strategic value is often easily overlooked in conventional recycling frameworks that cater towards more common categories of materials to be recycled.
This insight is of great value towards policy making as it reveals there is a significant financial and environmental incentive for the country to recycle non-ferrous metals as they save the highest amount of crude oil and energy when recycled. Promoting the recycling of material such as non-ferrous metals will reduce the national energy consumption, lower crude oil use (and therefore its imports) and in turn ease pressure on public budgets. The saved money can be invested onto other waste management initiatives.
1.4. Singapore’s Path to Zero Waste: Successes and Setbacks
By Priyanshu Das
1.4.1. Angle
This editorial examines the progress of Singapore towards the national aim of achieving Zero Waste by 2035, which is observed through a set of time-series line charts (with shaded focus bands) and a comparative stacked bar chart. Combining overall recycling rates, volumes of total waste, household, and national performance levels into different but coordinated visuals, we will be able to see in a direct way how policy efforts, community participation, and external shocks have influenced the outcome of systems on the one hand and our performance on the other.
1.4.2. Framing
We chose the number of total waste produced between 2003 and 2023 and the amount of waste that was recycled between 2014 and 2023 to create phase-wise visual images that are clear. The first chart follows the national recycling rate within the decade, the second demonstrates the total amount of waste within two decades, and the third one draws the comparison between household involvement and the national average within the stagnation period. This framing provides us with the opportunity to identify three major suspense lines, using early momentum, mid-term plateau, and the new gaps, alongside ensuring that each visual has a clear message on both the macro and the micro levels, within the most important policy milestones.
1.4.3. Focus: 2009–2013 – A Period of Momentum
The shaded bands on our recycling and waste-volume charts between 2009 and 2013 are marks on recycling activities, in that the recycling rates increased up to 60% and the overall volumes of waste were slowing down. These images support the influence of well-organized initiatives, including the National Recycling Programme, the increased infrastructure of collection, and corporate collaborations that were converted into accelerated innovative outcomes. The callouts at the turning points in years support how policy, investments in infrastructure, and community engagement led to tangible improvements in the country in terms of waste management.
1.4.4. Focus: 2018–2023 – Stagnation and Setbacks
Conversely, the charts of 2018 to 2023 point to a disturbing stagnation: recycles levels stayed level and household rates stayed below 15%, although the system-wide average was above 50%. Dual-axis and stack-bar graphs emphasize that there was no continuation of the momentum of the previous years, and marks in 2020 show how the COVID-19 pandemic caused a short-term decline in total waste, which was followed by an upward trend of volumes and rates. This bout of stagnation shows that unless we can generate new policy innovation, tailored incentives, and more closely tie national priorities and national curriculum, and national practices, the systems that have powered ahead in the past can run out of steam.
2. Data Representation
2.1. Tracing Singapore’s Growing Plastic Problem
By Sai Rama Mahalingam
Figure 1.
Tracing Singapore’s Growing Plastic Problem Dashboard.
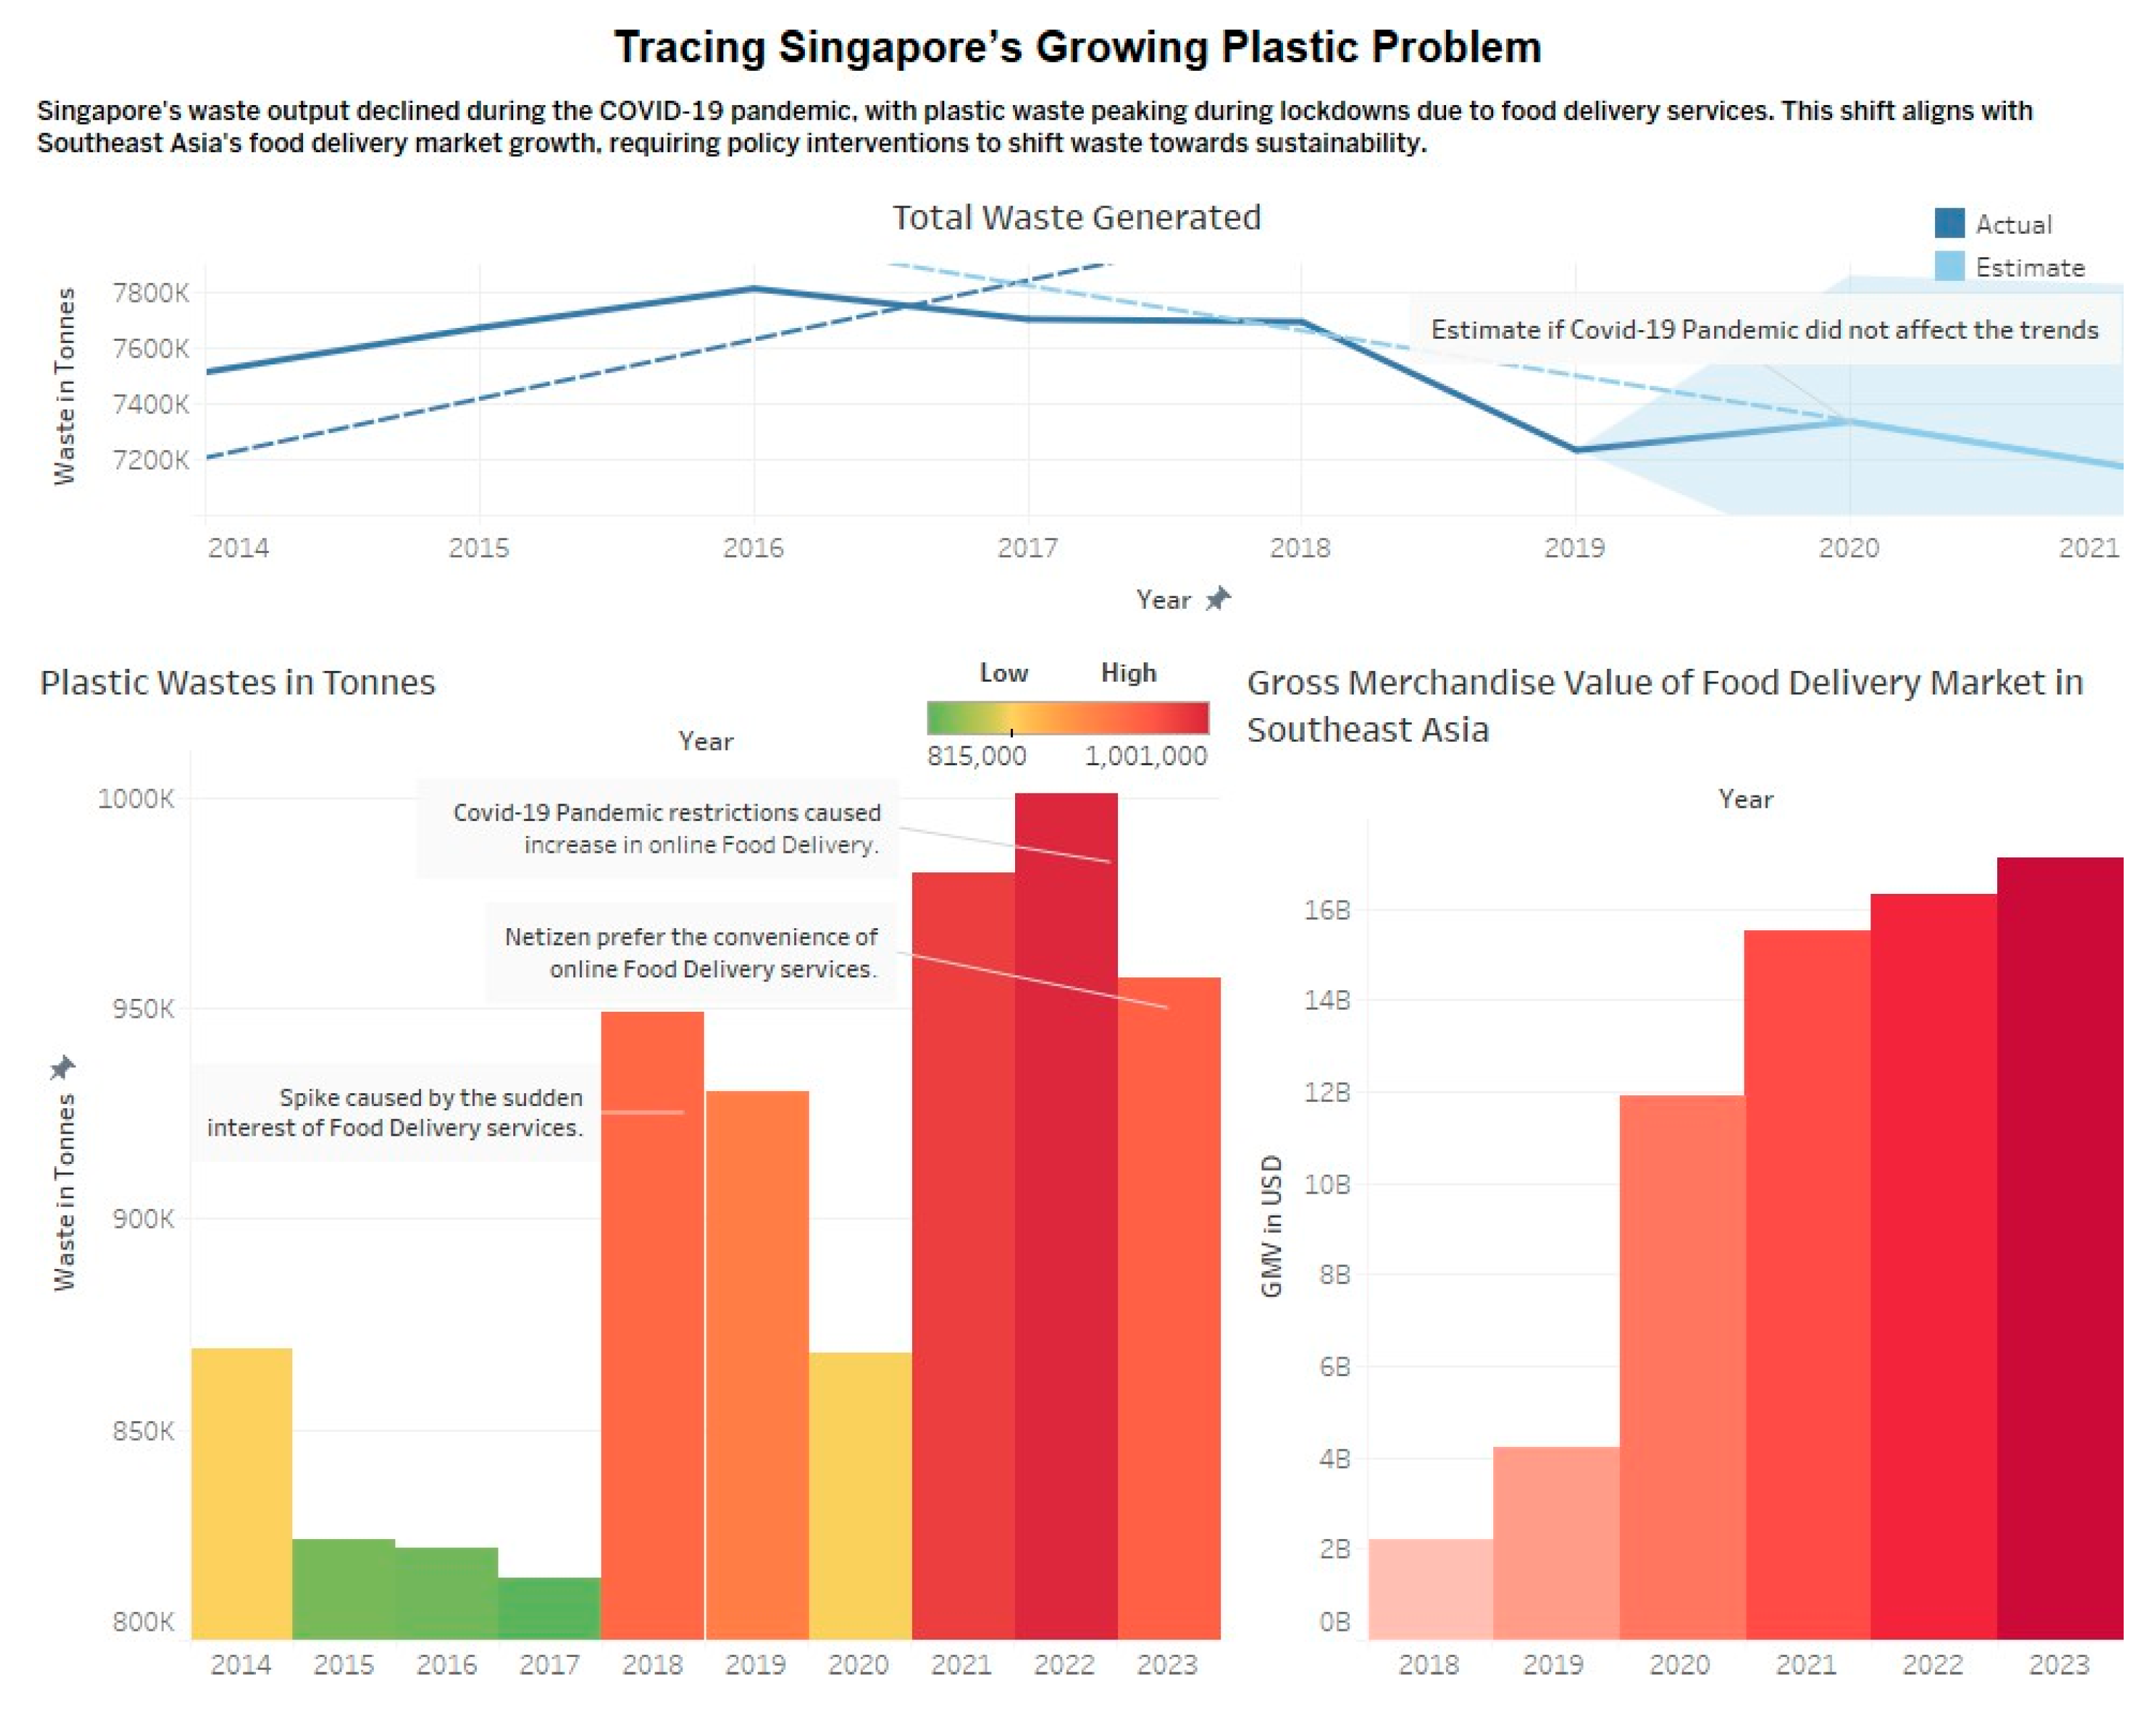
The “Tracing Singapore’s Growing Plastic Problem" dashboard shows an extensive investigation on Singapore's growing plastic waste issue. The line chart illustrates the fluctuations in total waste generation in Singapore. The left bar chart shows only the plastic waste generated while the right bar chart shows the GMV of the Food Delivery Market in the whole of Southeast Asia. The dashboard displays the level of influence plastic waste has on total waste generation and where it originates from.
2.1.1. Interactivity
The dashboard's layout is intentionally static and non-interactive, which helps with user understanding. The linear narrative from national waste patterns to plastic-specific quantities and eventually to the economics of localized food delivery defines the subject without requiring any effort from the user. The first graphic illustrates the projected and actual waste trajectory, serving as an inbuilt counterfactual analysis that provides information without interactive toggles. The visual shifts throughout the panels, reflecting overall trends in waste and rises in plastic consumption due to the epidemic, are logical. Maintaining a consistent time range (2014–2023) for all the graphics ensures their seamless integration.
2.1.2. Annotation
Annotation is properly utilized to contextualize fluctuations and spikes in waste generation. The commentary in the plastic waste graphic effectively correlates individual behaviours with the data presented. Annotations such as "Spike caused by the sudden interest of Food Delivery services" elucidate the source of the spike while conserving space on the chart. Similarly, the GMV chart leaves out any annotations intentionally, allowing the value's exponential increase to convey its significance independently. The header annotations, particularly in the upper chart ("Estimate if the Covid-19 Pandemic did not influence the trends"), underscore significant disparities and prompt contemplation of their comparisons.
2.1.3. Colour
The colours are used clearly, consistently, and effectively. The blue gradients in the upper illustration promote the distinction between actual and projected trends. This highlights the hypothetical nature of the dashed line. The bar chart depicting plastic waste illustrates increasing levels of waste, shifting from green to red. Saturation and warmth indicate the severity of the situation. The GMV bars employ a red spectrum that expands to illustrate market growth, resulting in visually harmonious panels. These colour palettes are aesthetically appealing and provide a functional purpose by directing attention to significant data elements.
2.1.4. Composition
The dashboard's design follows a top-down, left-to-right reading pattern, enhancing the clarity of the narrative. The analysis begins with a comprehensive overview of total trash generation, subsequently narrowing its emphasis to patterns in plastic waste, and eventually linking these trends to broader shifts in the regional market. Visual space, alignment, and uniform scaling enhances the reading experience, while legends and axis labels are deliberately positioned to prevent clutter. The overall design has a distinct narrative objective and a harmonious structure that enables readers to effortlessly trace the reasoning from cause to effect to underlying motivation.
2.2. The Human Factor: How Public Behaviour Shapes Waste Trends
By Sivamuganthan Mohana Dass
Figure 2.
How Public Behaviour Shapes Waste Trends Dashboard.
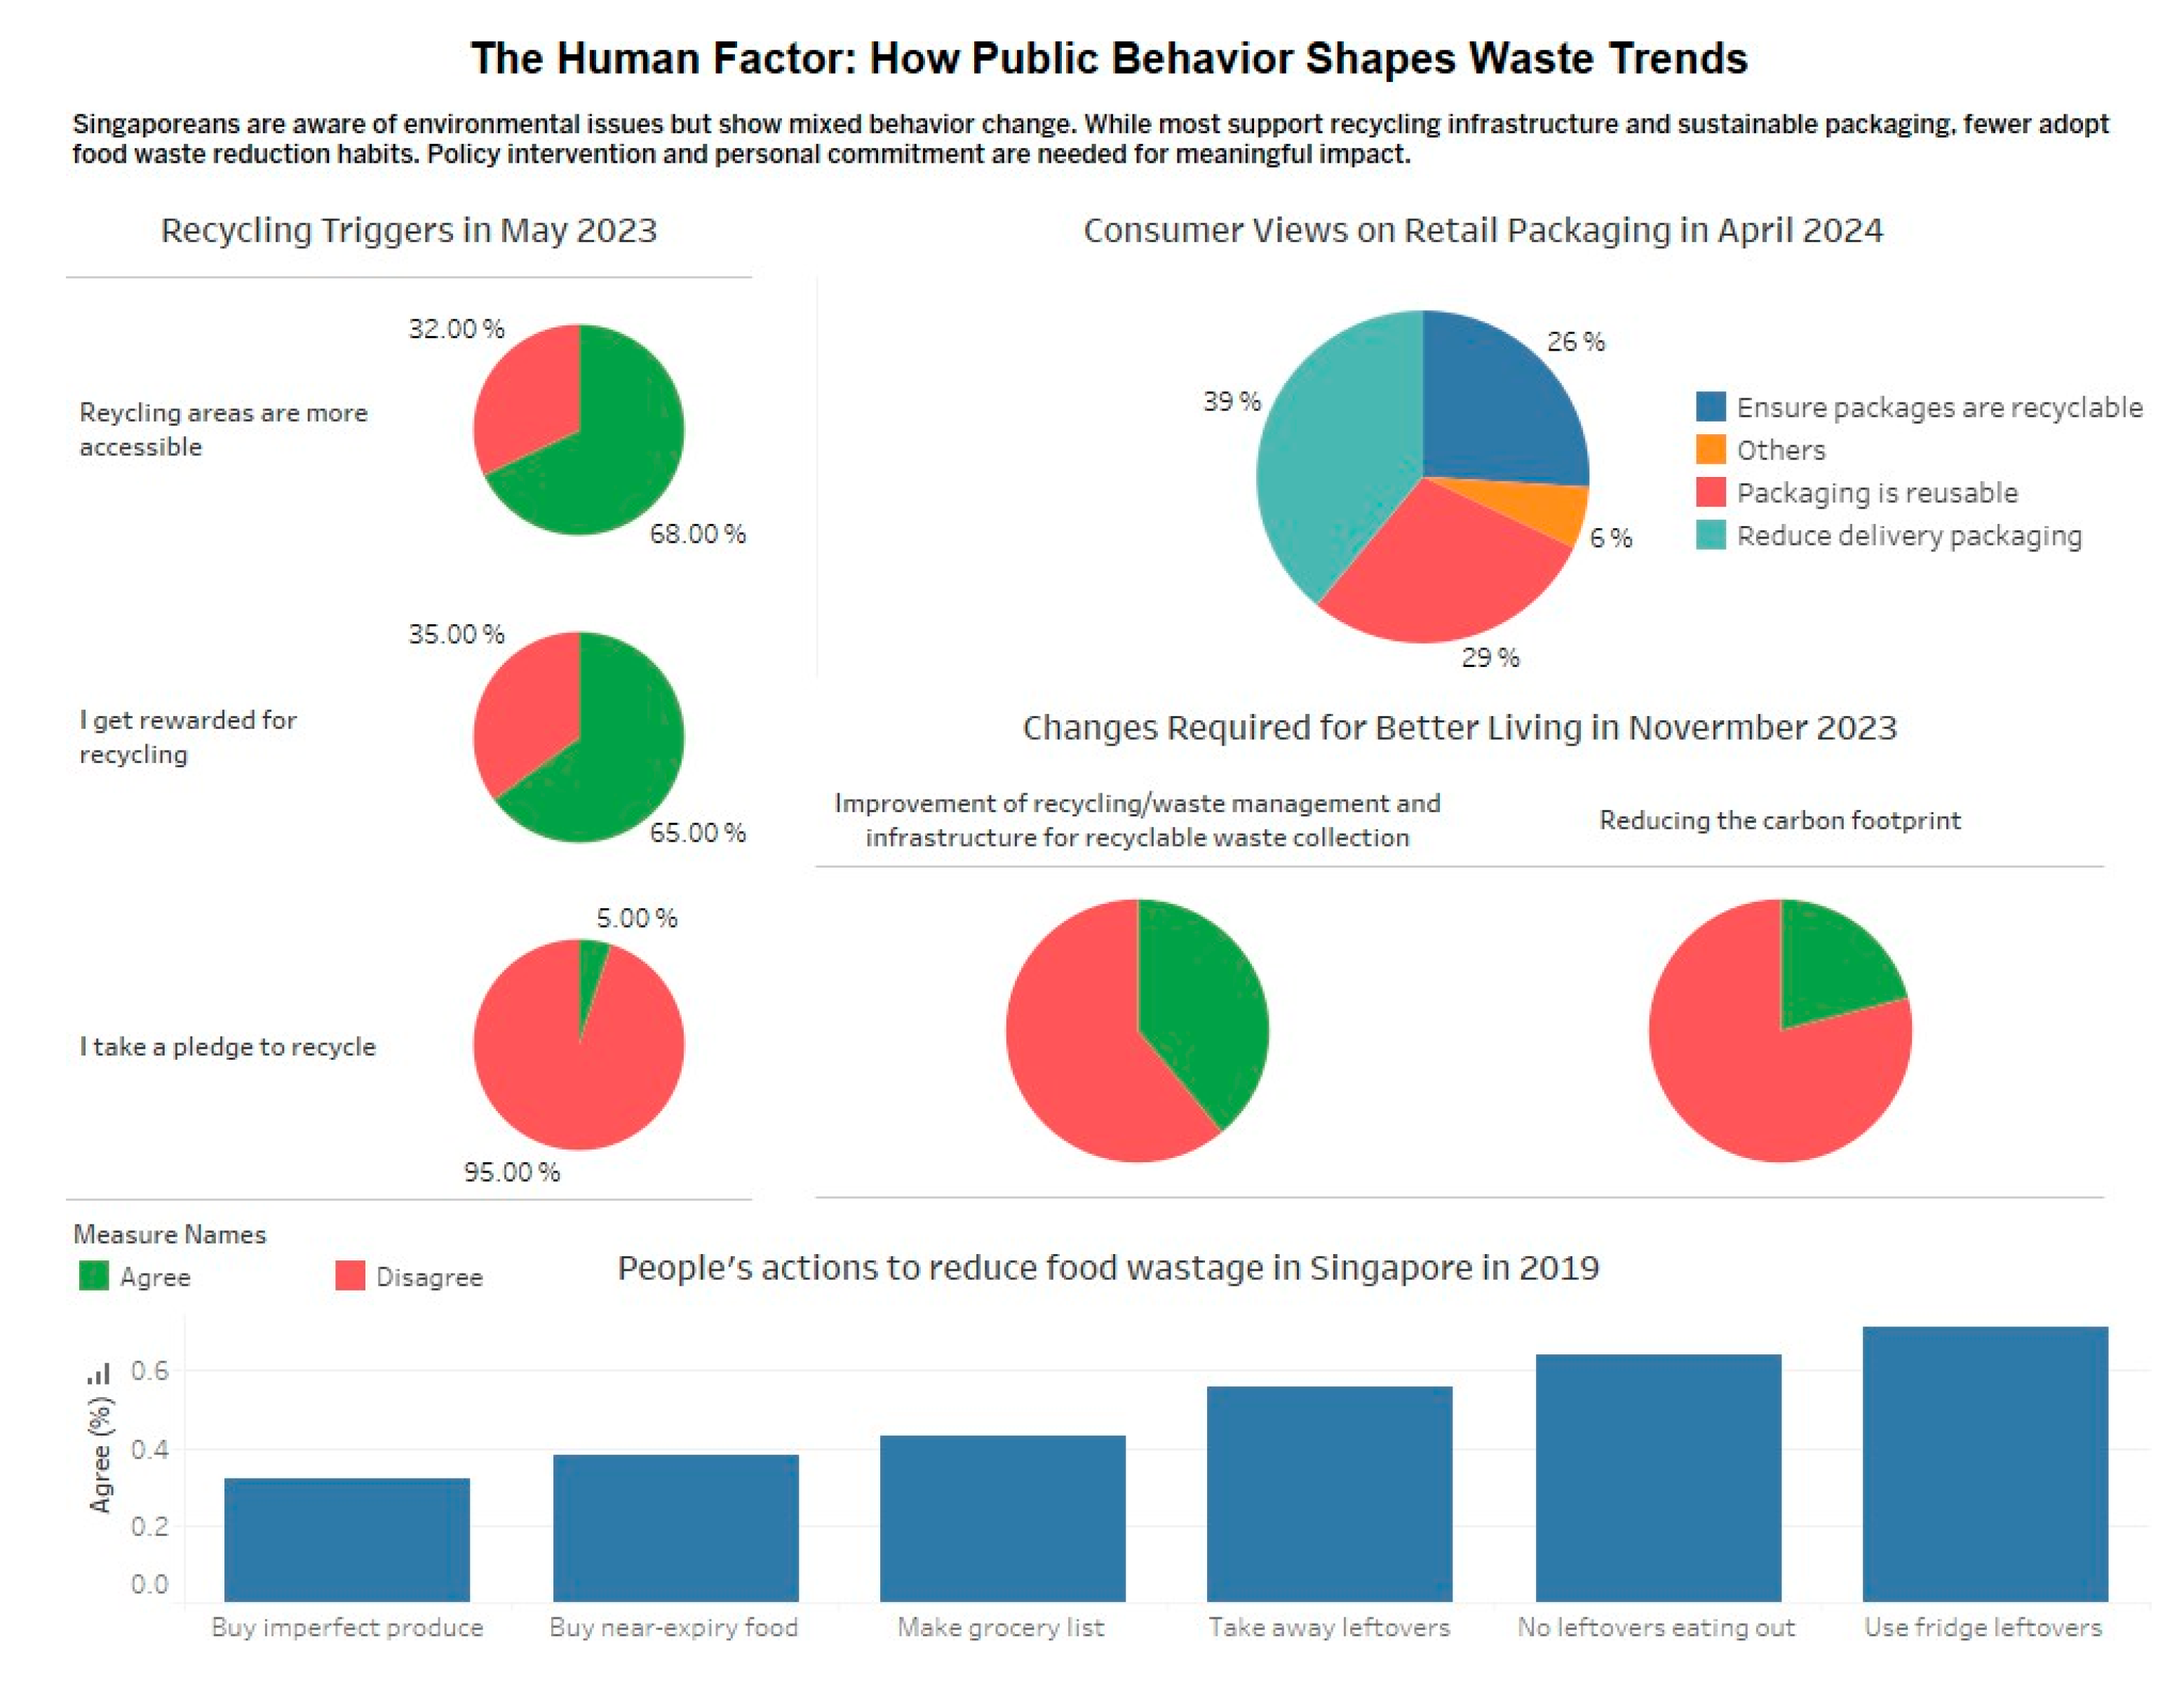
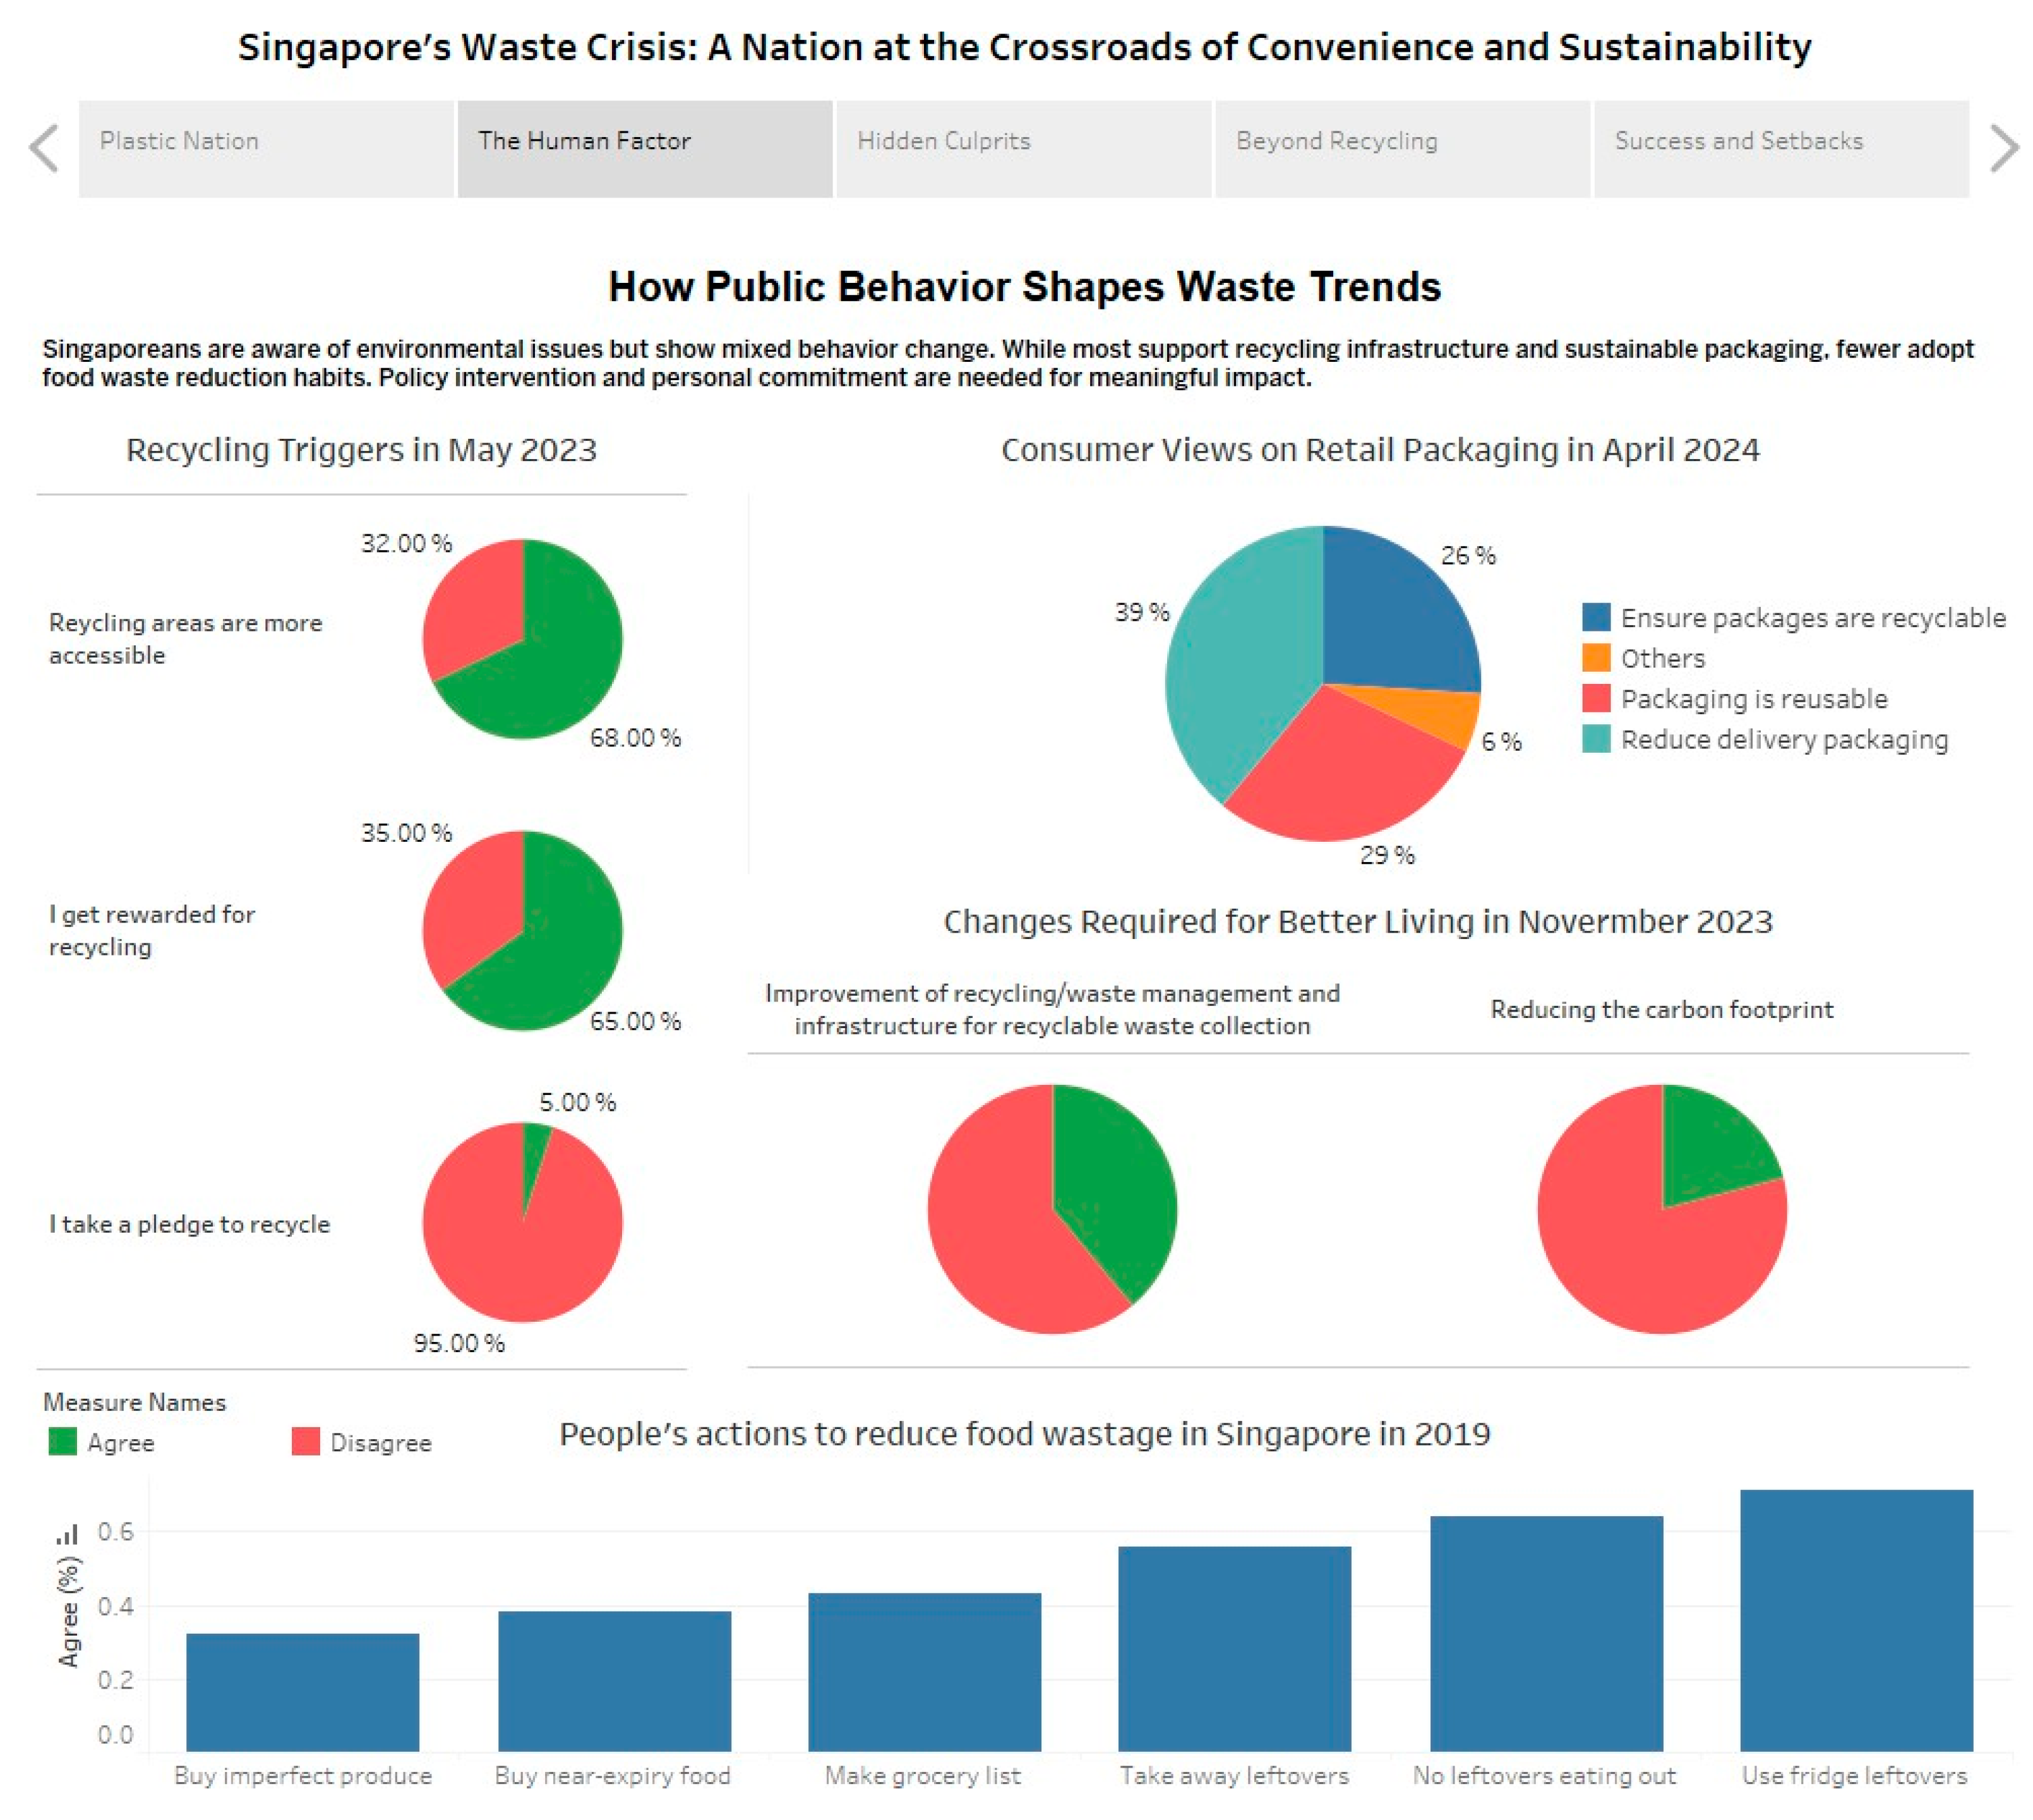
The “Human Factor: How Public Behaviour Shapes Waste Trends” dashboard presents a comprehensive exploration of how individual choices and societal attitudes drive Singapore’s waste landscape. The visuals employ pie charts, bar graphs, and organised narratives to highlight the mixed nature of public commitment to sustainability incorporating factors such as convenience and incentives alongside erratic practices in recycling and food waste mitigation. This dashboard depicts waste not only as a structural or industrial concern but also as an obvious consequence of daily decisions, highlighting the essential importance of behavioural change alongside policy initiatives to guide Singapore towards a more sustainable future.
2.2.1. Interactivity
This dashboard adopts a static yet a detailed and curated layout which facilitates a straightforward exploration of how public attitudes and behaviours influence waste trends in Singapore. Unlike other dashboards that have interactive elements, the intentional lack of interaction in this design is a distinct advantage. It guides viewers through a coherent storyline without distractions. The sequence moves from the factors of recycling to perceptions of packaging focusing on recyclable packaging, then to infrastructural needs, before concluding with household food waste reduction actions. This organised flow enables the audience to comprehend complex behavioural patterns effortlessly.
2.2.2. Annotation
Annotations play a crucial role in this dashboard as it effectively grounds the visuals in broader behavioural insights. The primary title and subtitle provide immediate thematic orientation, emphasising the dual importance of policy intervention and personal commitment. The labels on the pie chart including particular percentage annotations regarding recycling motivators or retail packaging expectations, provide an accurate, contextual comprehension at a glance. The text block on the other hand encapsulates essential behavioural patterns, linking diverse actions such as recycling motivators and food waste practices into a unified narrative. This approach enhances the interpretation without overwhelming the visual field.
2.2.3. Colour
The colour usage across the dashboard is consistent, purposeful and improves cognitive clarity. Shades of green and red distinctly denote agreement and disagreement respectively in behavioural responses. This approach effectively highlights contrasts in attitudes toward recycling incentives and food waste practices. The multi colour pie chart for retail packaging choices clearly separates consumer priorities, while remaining balanced and easy to interpret. The muted background ensures that the emotion-driven colour choices are vividly shown, effectively directing attention to behavioural proportions and mitigating visual fatigue.
2.2.4. Composition
The dashboard is structured in a logical sequence that enhances user comprehension with each visual. The discussion begins with basic motivators affecting recycling, progresses to consumer perceptions of packaging, subsequently tackles overarching infrastructure requirements, and ultimately analyses specific home behaviours about food waste. This top-to-bottom, left-to-right flow aligns with natural reading patterns, ensuring that viewers build their comprehension layer by layer.
Uniform spacing, aligned chart titles, and consistent sizing access the visuals create a refined and professional aesthetic. Legends and labels are concise and unobtrusive, enabling the spectator to stay focused on the central narrative without unnecessary visual interruptions. This structured composition highlights the dashboard’s effectiveness in translating complex behavioural data into accessible, impactful insights.
2.3. Industries Behind Singapore’s Waste Burden
By Addy Arif Bin Mahathir
Figure 3.
Industries Behind Singapore’s Waste Burden Dashboard.
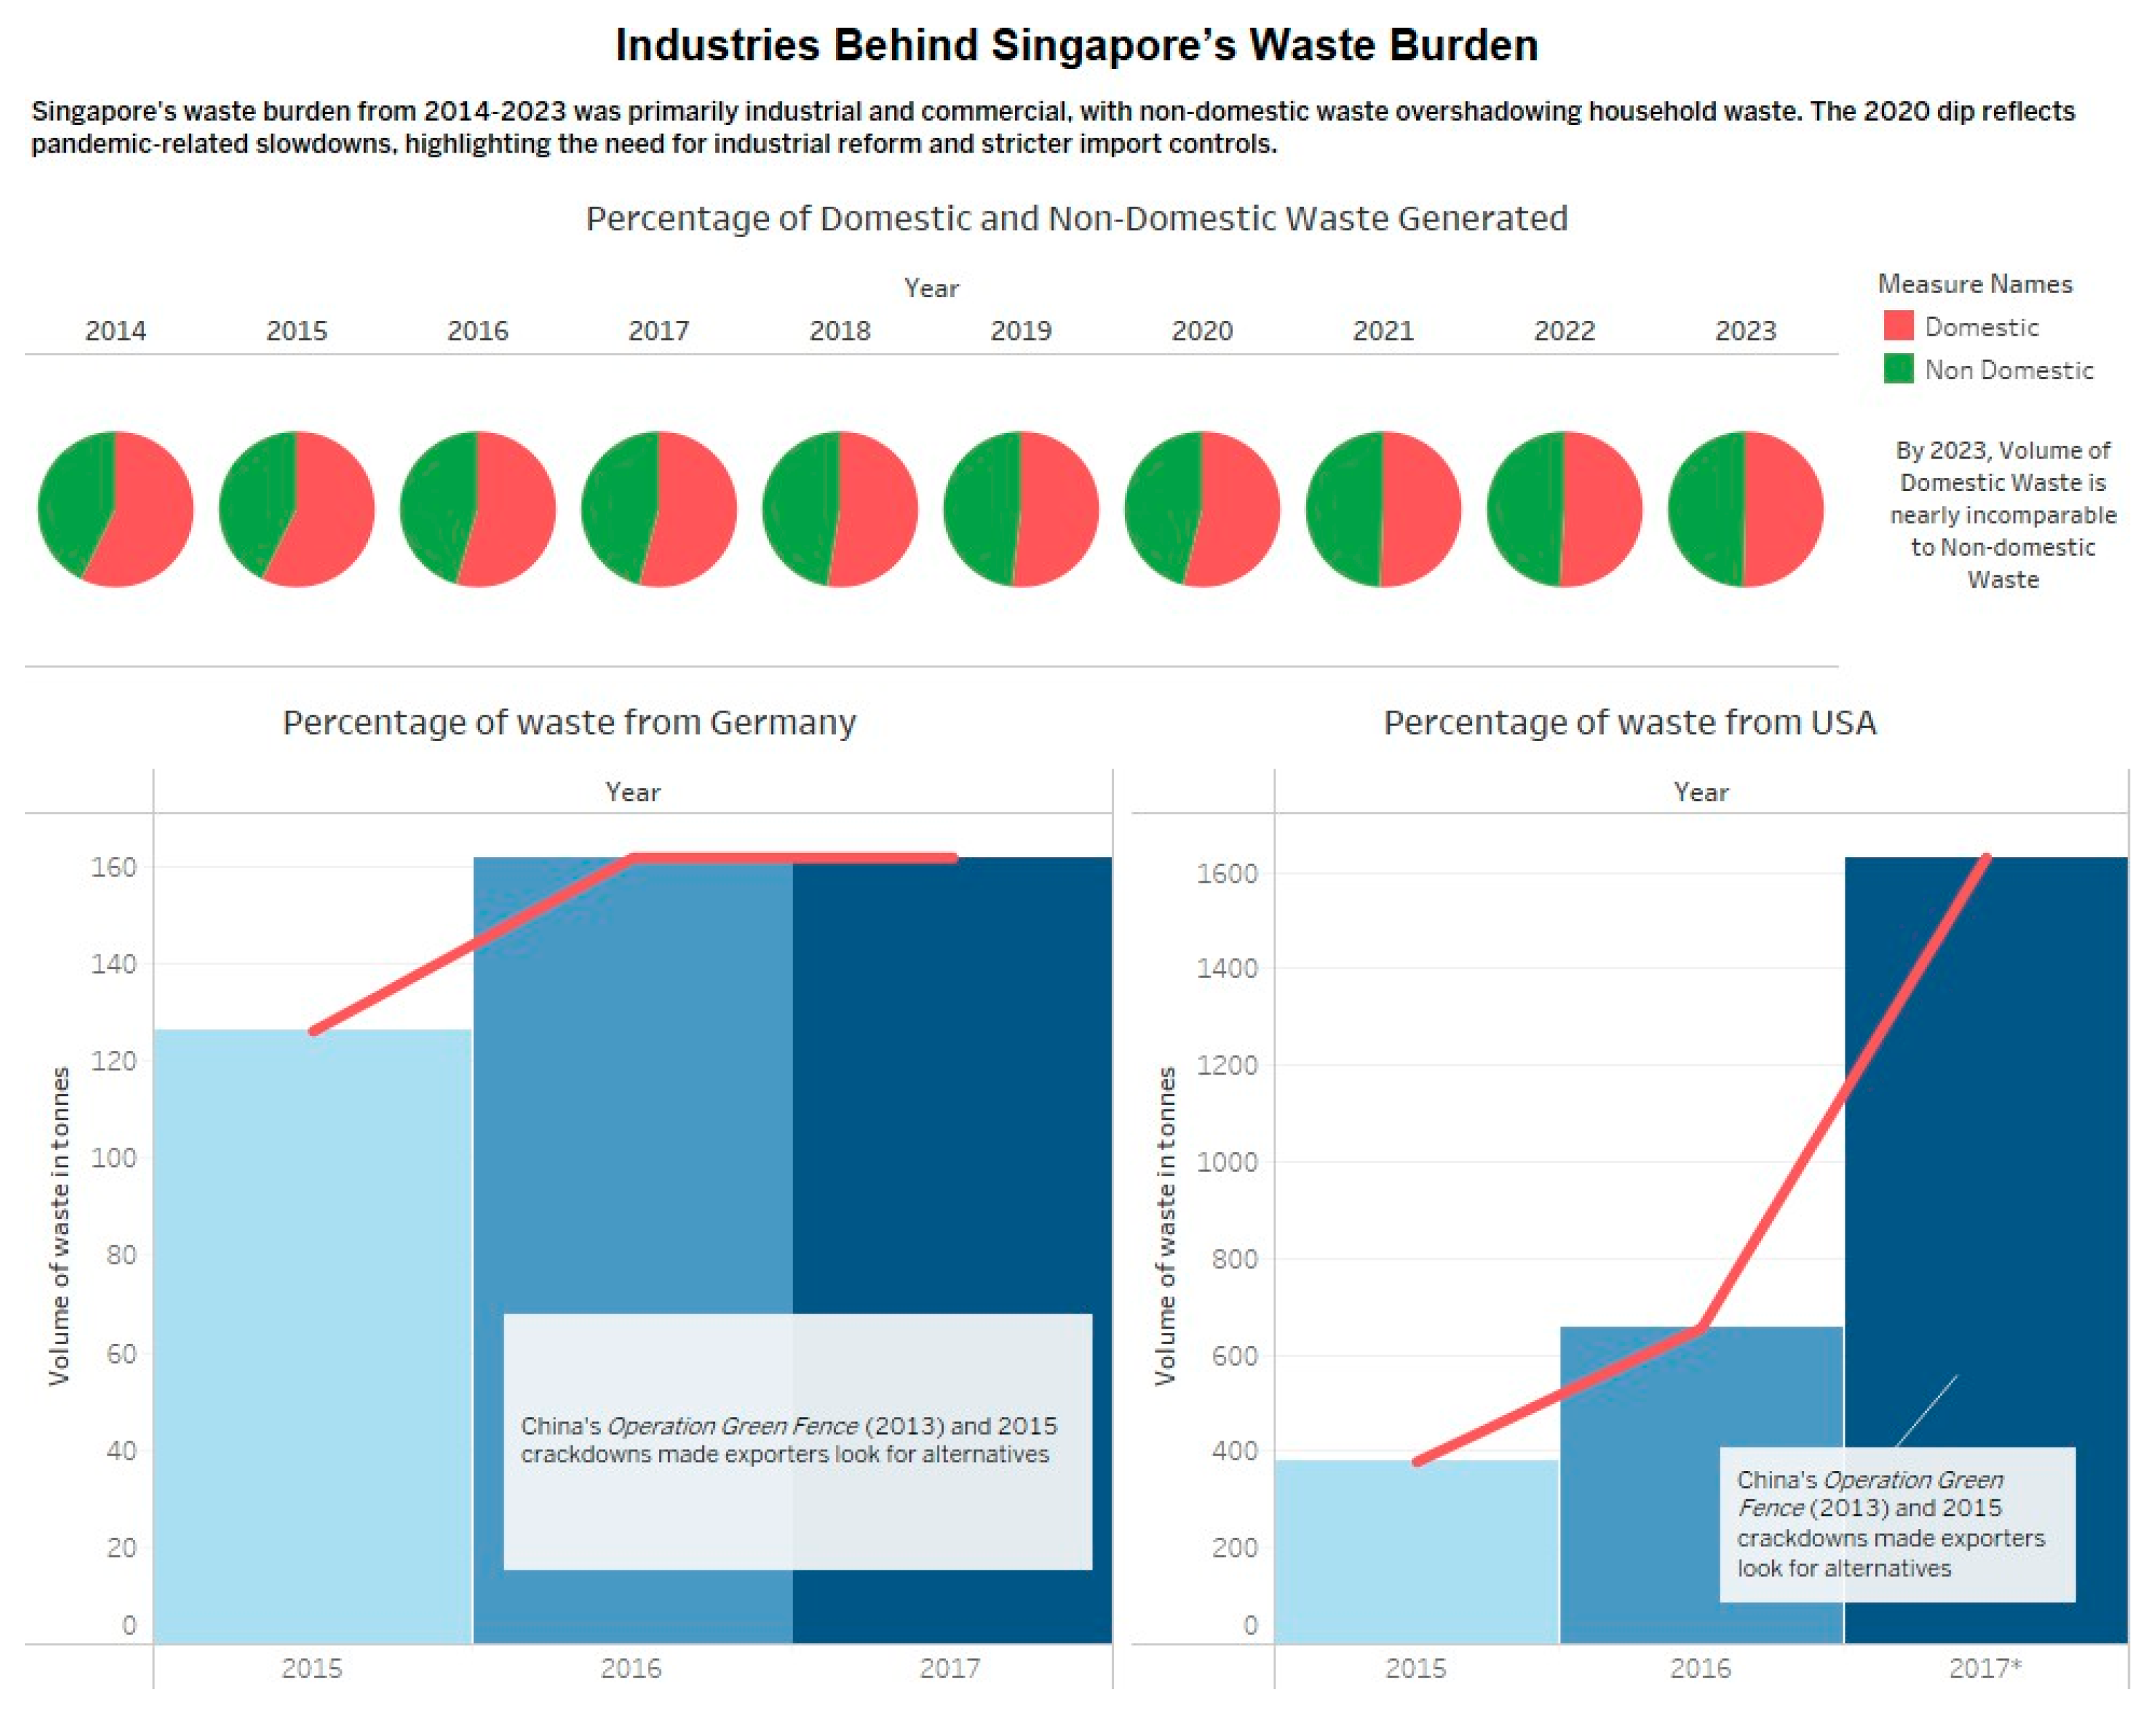
The “Industries Behind Singapore’s Waste Burden" dashboard offers an extensive investigation on Singapore's industrial waste issue. The pie charts illustrate the increasing prevalence of non-domestic garbage. Dual bar-line combination charts for Germany and the USA illustrate the impact of global policy changes on local results, emphasising the underlying cause. The dashboard illustrates a narrative of changing responsibility and growing industrial influence.
2.3.1. Interactivity
The dashboard's fixed structure is a purposeful and efficient design decision that enhances clarity without requiring user involvement. The graphic sequence is organised from national trash levels to source-specific breakdowns and worldwide contributions, allowing the story to progress logically and intuitively. The evolution of visuals from pie charts to country-specific import timelines, facilitates viewer comprehension without necessitating further input or navigation. The use of uniform data classifications throughout a defined 10-year period (2014–2023) enhances this clarity. Each visual is meticulously framed and annotated to preemptively address probable user enquiries, rendering further filters or dynamic controls redundant.
The dashboard offers a concentrated, guided experience that clearly highlights the primary conclusion that non-domestic waste is the principal contributor to Singapore’s waste volume. In this scenario, the absence of interactivity is not a constraint but an advantage, providing a simplified, distraction-free experience that emphasises on the understanding and narrative impact.
2.3.2. Annotation
The annotation feature is a significant strength of this dashboard. Strategic captions provide crucial context without outshining the visuals. Country-specific annotations (“China’s Operation Green Fence”) provide geopolitical insights, directly linking global trash policy to local consequences. These annotations are both useful and strategically positioned to improve user understanding. Additionally, the chart titles use statement-style wording that underscores the central narrative.
2.3.3. Colour
The dashboard employs colour in a clear, consistent, and extremely effective manner. It used colour purposefully to differentiate data categories. Red (non-domestic) and green (domestic) waste are consistently used throughout the pie charts, ensuring categorical uniformity. The blue hues used in the import charts (Germany and USA) distinguish temporal volumes and superimpose line graphs without inducing ambiguity. The use of ornamental or excessive hues is absent, and the palette improves readability across all chart types. Colour saturation is used naturally to direct attention and convey intensity, especially in charts depicting rising foreign garbage imports.
2.3.4. Composition
The structure adheres to a top-down narrative arc. It begins with patterns in yearly percentage distributions of domestic vs non-domestic trash, and concludes with charts illustrating the global sources of industrial waste at a micro level. This hierarchical structure maintains narrative clarity and cognitive strain, leading the observer progressively deeper into the tale. Visual space, alignment, and uniform scaling enhances the reading experience, while legends and axis labels are deliberately positioned to prevent clutter. The entire structure exemplifies a competent visual organisation.
2.4. Rethinking Waste Through Energy and Oil Savings
By Noor Ul Amin
Figure 4.
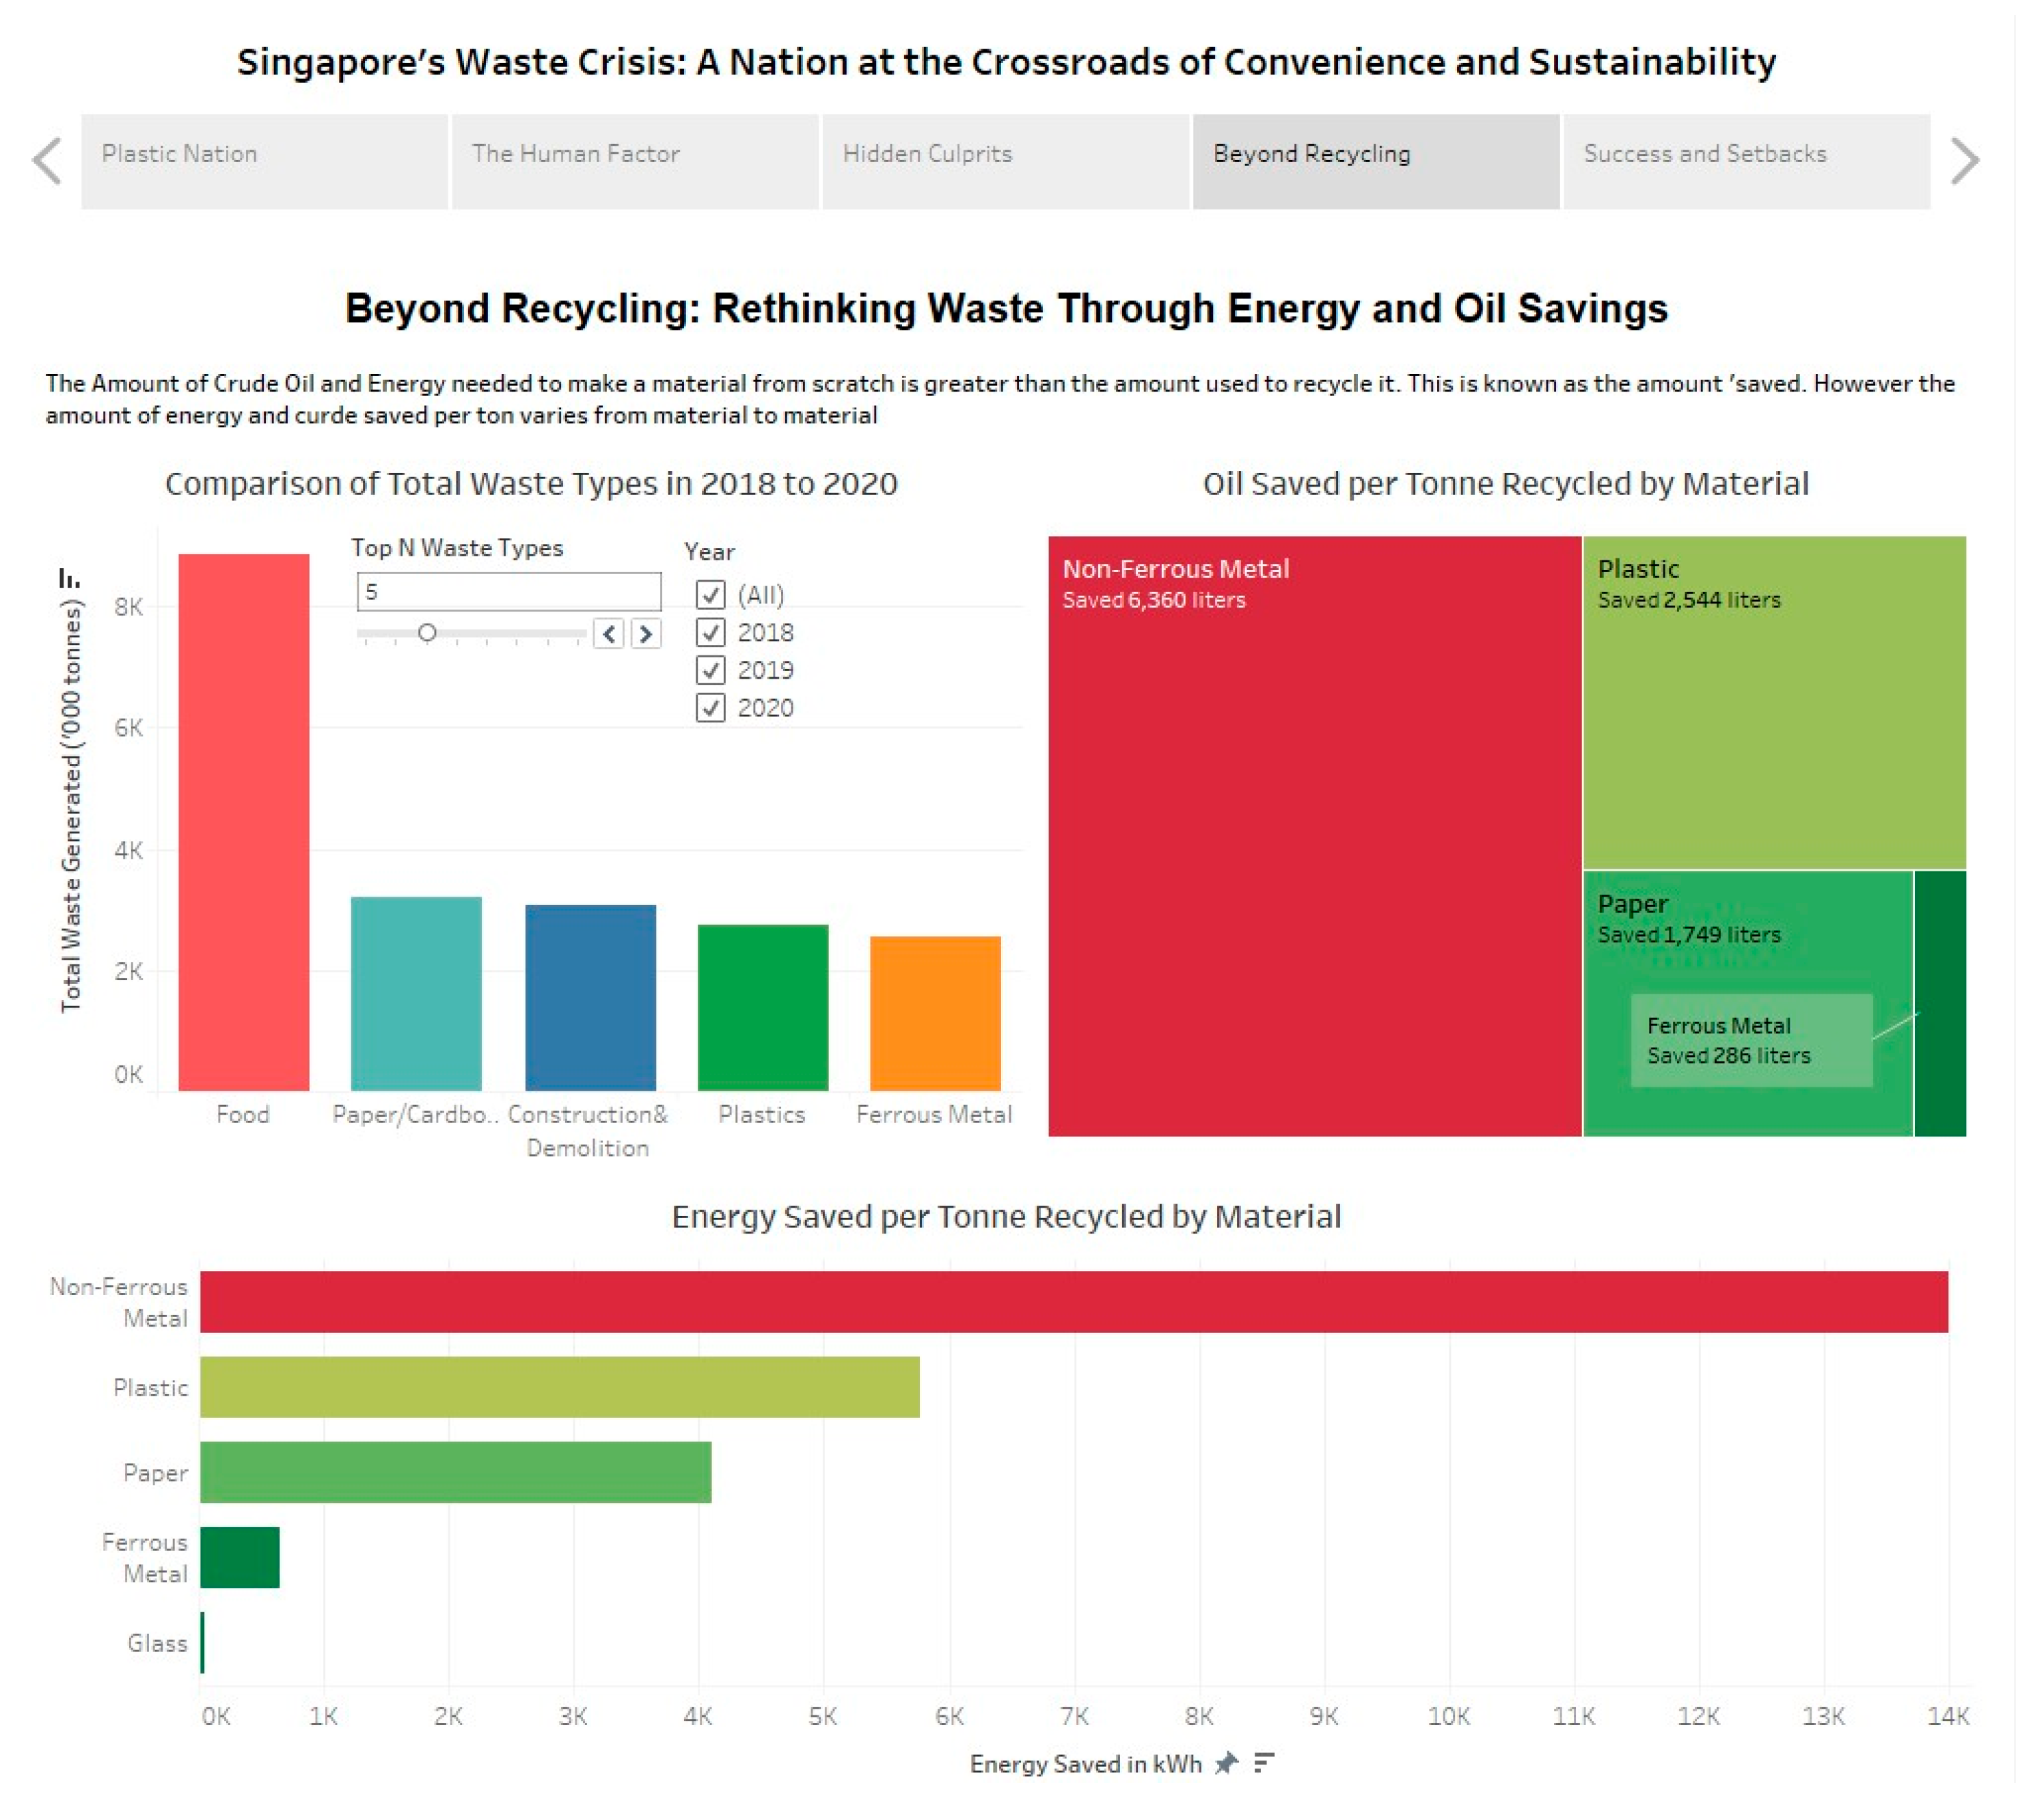
Rethinking Waste Through Energy and Oil Savings Dashboard.
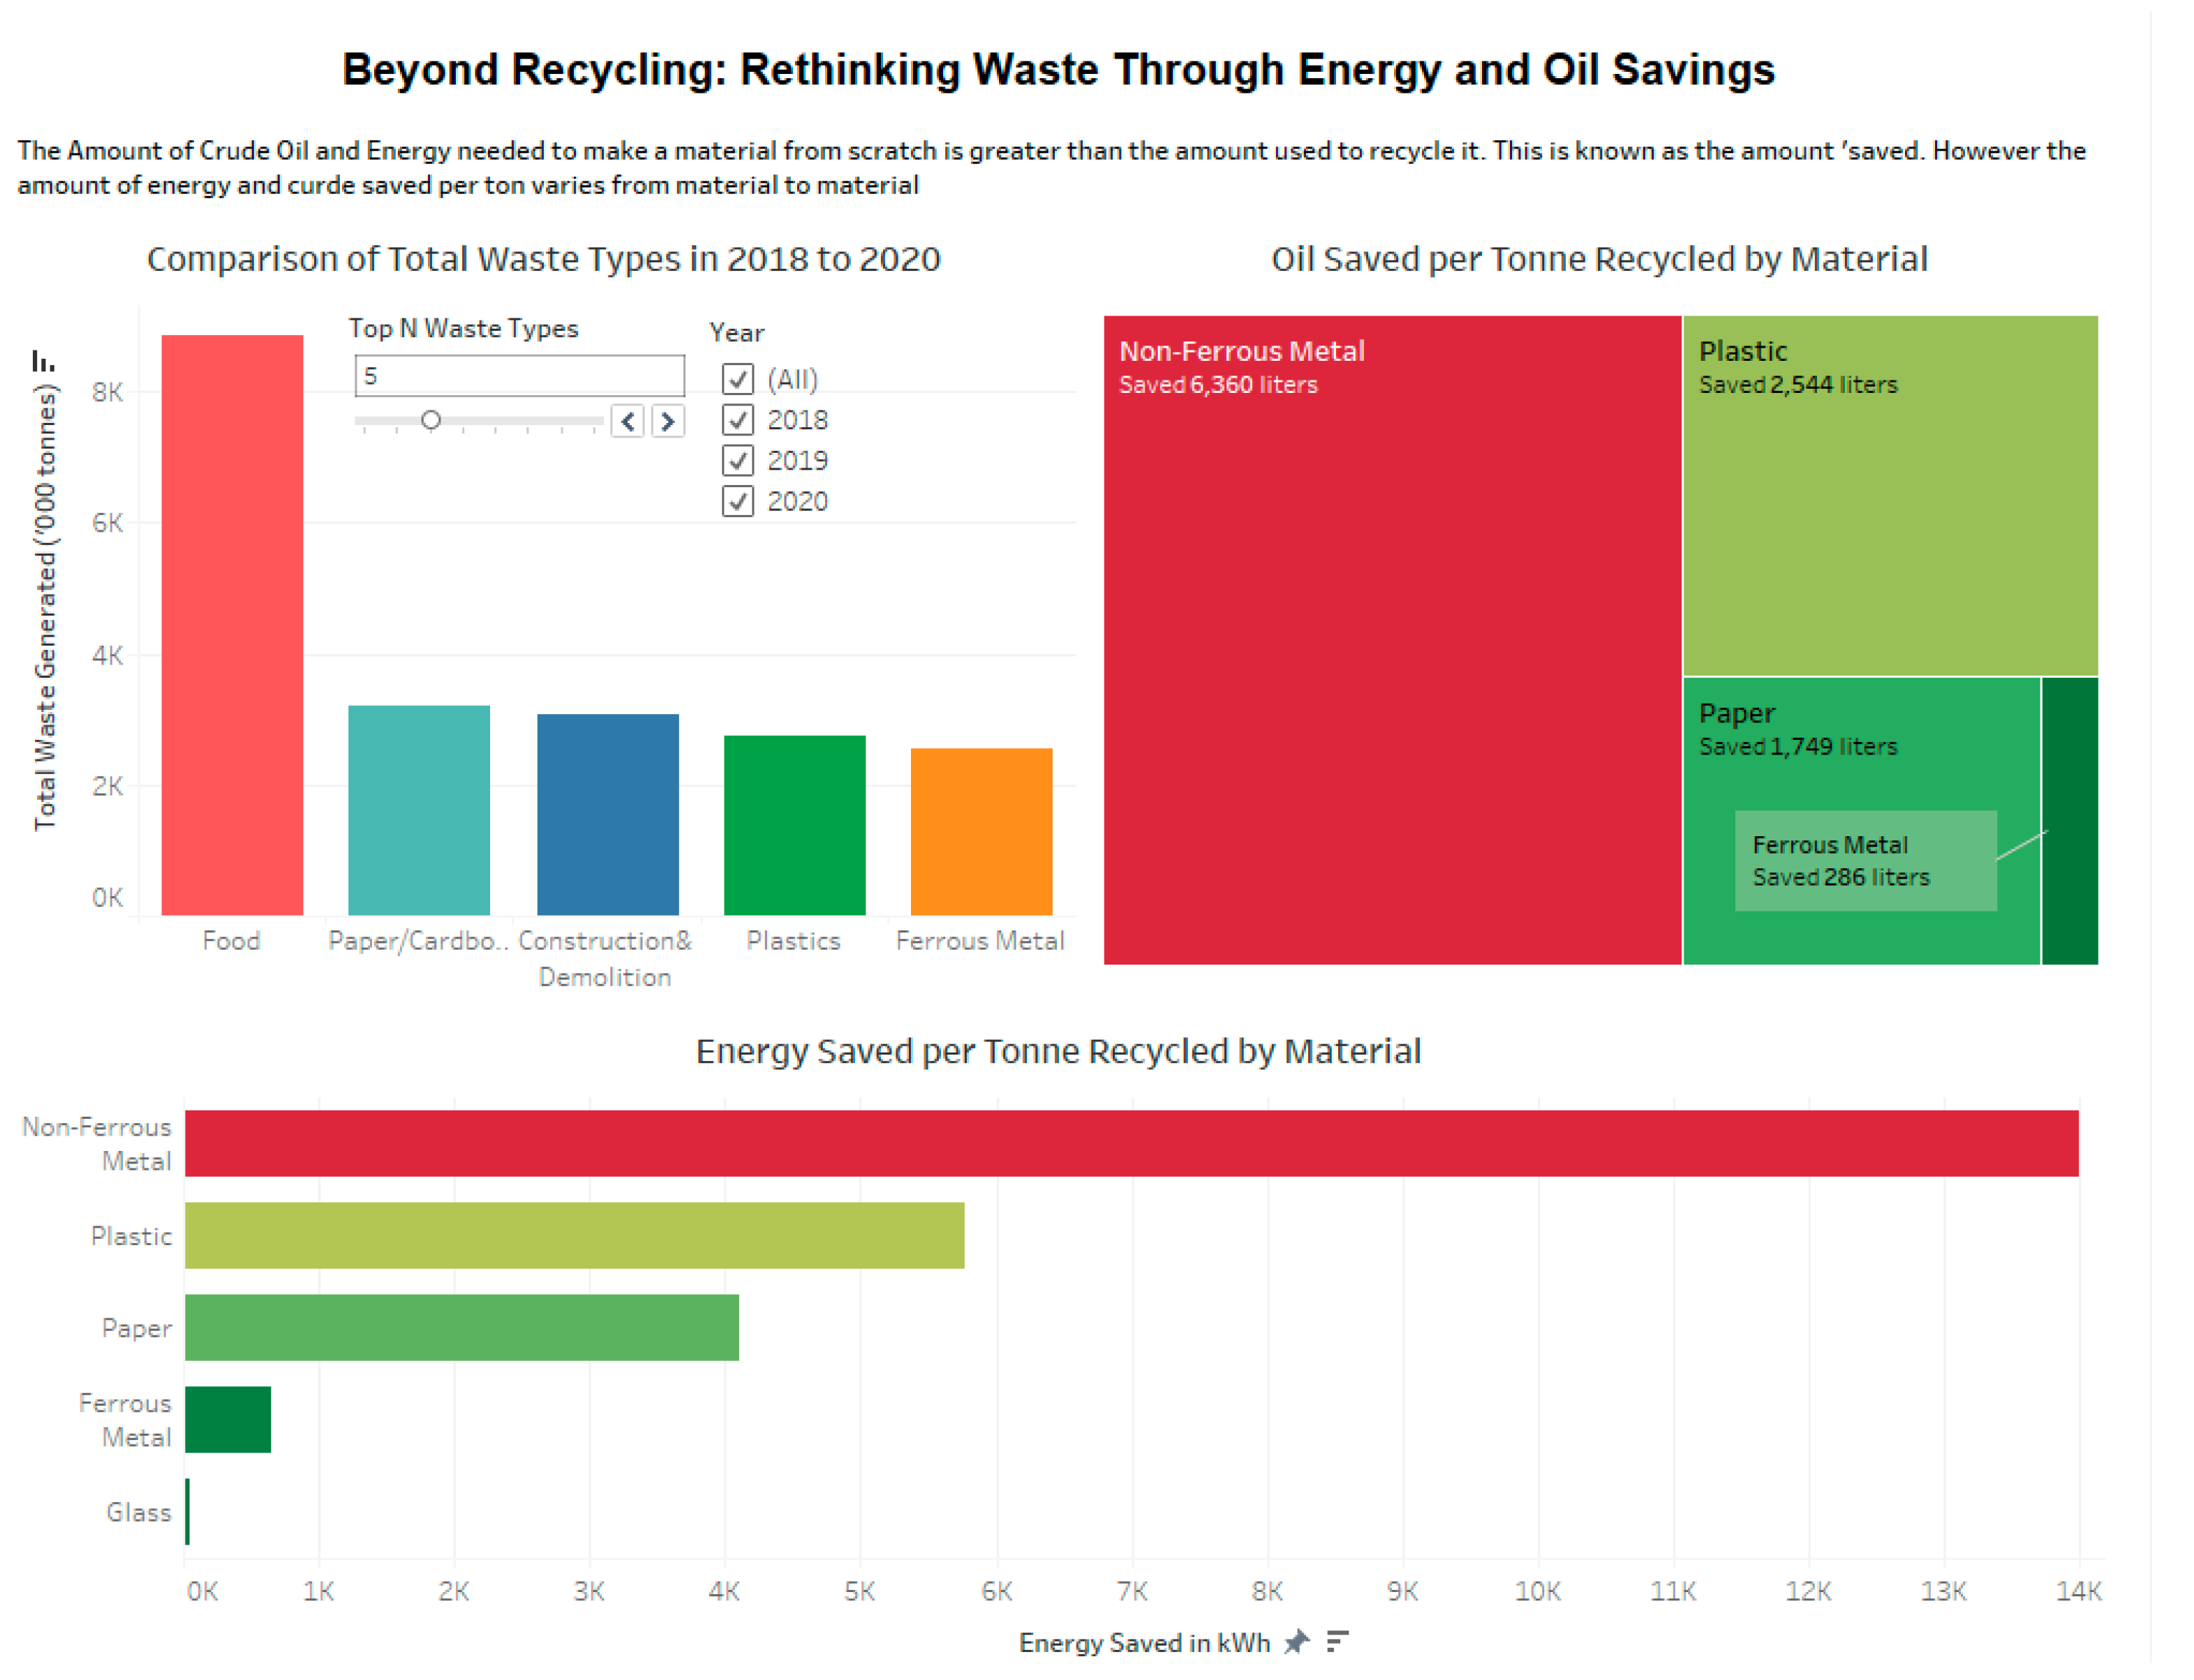
The ‘Beyond Recycling: Rethinking Waste Through Energy and Oil Savings’ dashboard offers an extensive look on the topic of crude oil and energy that Singapore saves for each category of waste it recycles. Below the title is a simple definition of what is meant by ‘saved’ in the sense of recycling (i.e. the amount of energy and crude used to make a product from scratch is more than what is used to recycle it from the waste). The vertical bar chart illustrates the total amount of waste generated by category (in metric kilo tonnes). The Map Chart illustrates the amount of crude oil saved (in litres) and the horizontal bar chart below represents the energy saved (in kWh) for the same materials when they are recycled.
2.4.1. Interactivity
The dashboard’s fixed design structure is purposefully made to enhance clarity and promote efficient decision making without user involvement. The dashboard allows users to interact with the data by ‘playing around’ with the filters. The purpose behind this is to help the users understand the trends and patterns by themselves instead of showing them static data visualization. This interactive visualization allows them to choose any year within the timeframe (2018, 2019, and 2020) as well as any number (provided it is even and greater than 0) of Top ‘N’ waste types to get the results they desire (i.e. the results they have interest in). It is a way of appealing to their curiosity and ensuring they do not lose interest in the visualization. Often audiences lose interest in a visualization that looks too ‘complicated’ for them so to prevent this, the interactive feature can be utilized to boost user engagement.
2.4.2. Annotation
The dashboard visualizations largely do not make use of annotations. This is because the data is dynamic instead of static: the feature that allows the users to get their desired results by applying custom filters on the data selection. Additionally, annotations would get in the way of the results and thus, making interpretation complex for the audience.
Furthermore, much of the visualizations are very clear and straight to the point; allowing the viewer to make their own conclusions and interpretations on the spot. Hence, there is not much need for assistant tools like annotations.
The slight exception is the annotation in the treemap chart for ‘Ferrous Metal’. The portion for it is very small; to give the audience details on how much crude oil recycling Ferrous Metals saves, it is necessary to use assistant tools such as captions or annotations (of which the latter have been chosen). Had this annotation not been there it would have confused or misled the audience regarding the amount of crude oil saved by recycling Ferrous Metals. The annotations provide them with a good idea of the amount saved without difficulty.
2.4.3. Colour
The dashboard employs colors in a clear and consistent manner to facilitate audiences' understanding; the color assigned to each category stays the same, no matter the year and ‘N’ number is chosen. For example if ‘Non-Ferrous Metal’ is red on the treemap chart then it will continue to be represented with red color regardless of what value of ‘N’ and year is. This is done on purpose to effectively distinguish different data categories from each other in each of the three visualisations.
In each visualisation, the color scheme for categories can be different. For instance, ‘Ferrous-Metal’ is orange in the vertical bar chart, dark green in the treemap chart and the horizontal bar chart. However, no two categories have the same color. As an example, in the treemap chart, ‘Non-Ferrous Metal’ is red and no other data category is red. This is done to ensure the viewers do not confuse one category with another just because they happened to have the same color.
The colors used are known as ‘warm colors’. They enhance readability on the background they are used on. The variation of colors used is selected on purpose to attract the viewer’s attention as their eyes will find them relaxing. Warm colors are also known to evoke emotions like excitement which can help the audience focus more on the visuals on topics that require emphasis.
2.4.4. Composition
The dashboard consists of 3 charts of which the first row contains two (vertical bar chart and treemap chart) and the bottom row contains one (horizontal bar chart). The dashboard adheres to the top-down narrative arc. It begins with a general breakdown of Singapore’s waste by category of material, then progresses to the amount of crude oil saved per material recycled and concludes with the amount of energy saved by the same materials. The purpose of this structure is to maintain narrative clarity and allow the user to progressively go into detail beginning with the simplest chart (the waste breakdown by category) so that they understand the whole dashboard better. The visual space given, the uniform scales and the alignment of the visualizations are all done to make it look organized and clean and prevent details and visuals from getting jumbled.
Axis titles are used to facilitate understanding of categories depicted in the visualizations and the treemap chart also uses data labels. Care has been taken to ensure the dashboard is cluttered up with so many details and visuals to the point it gets overwhelming. As such it can be argued the dashboard is an example of competent and organised data visualisation
2.5. Singapore’s Path to Zero Waste
By Priyanshu Das
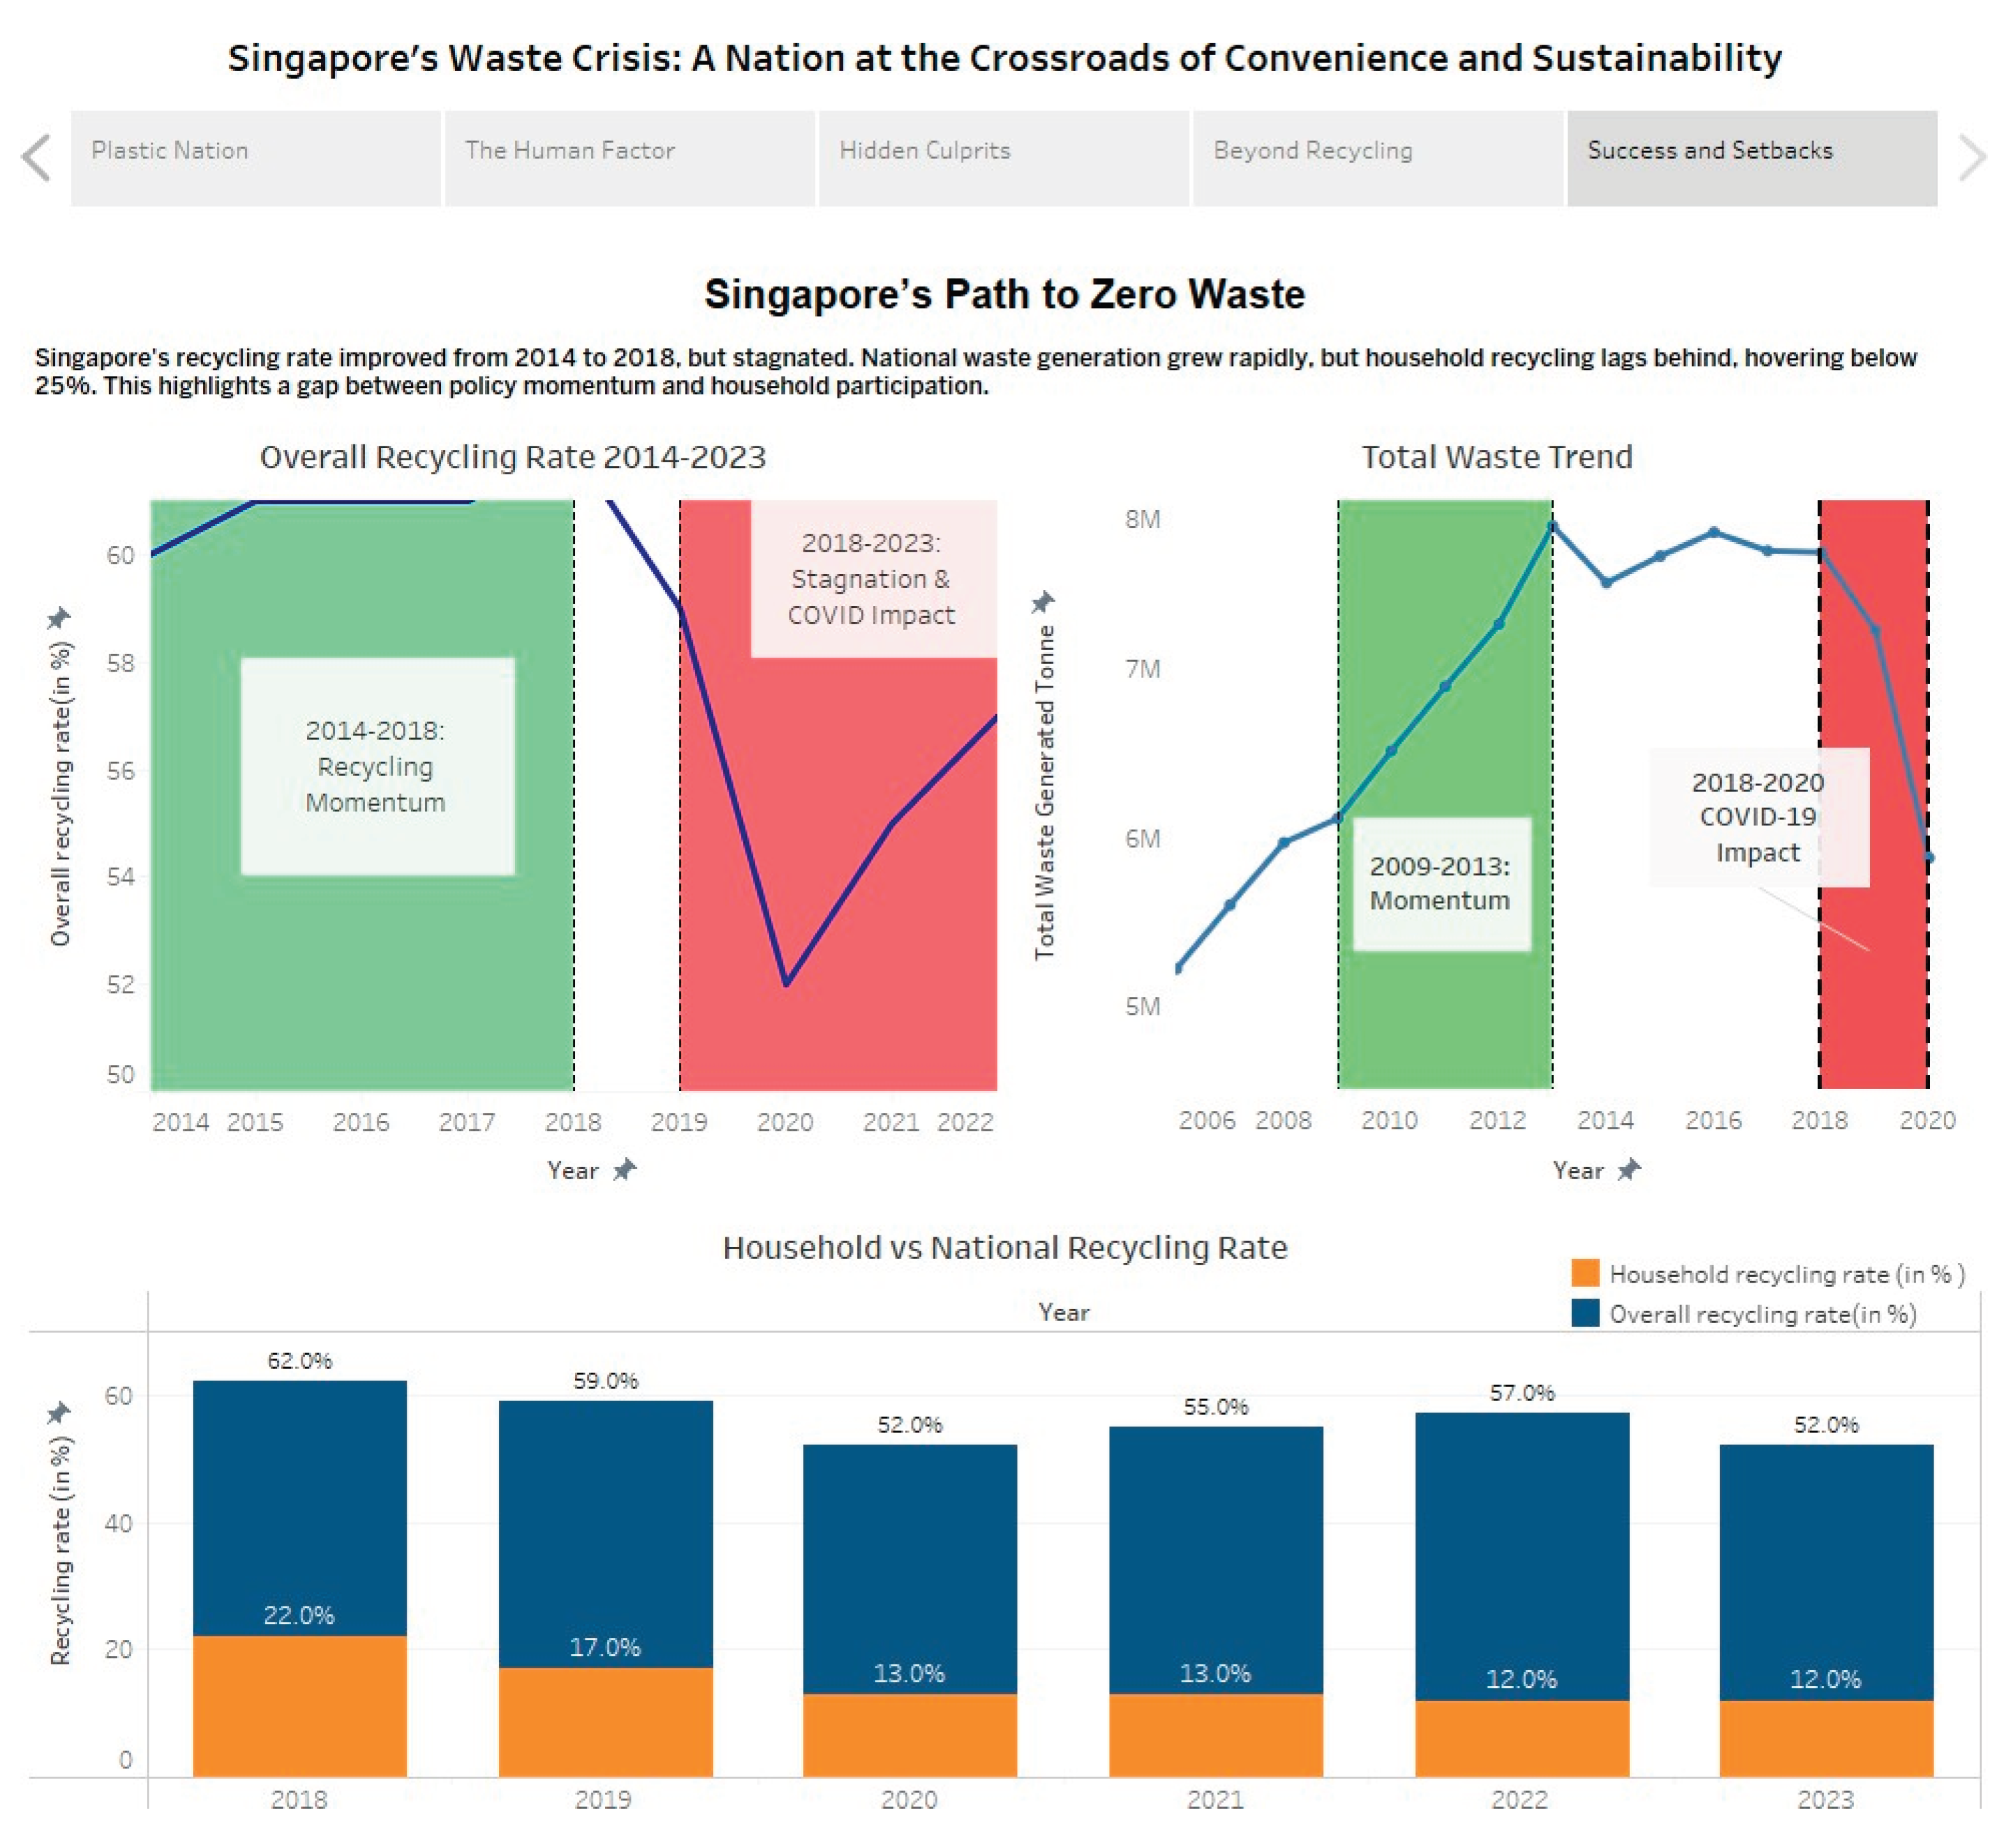
Figure 5.
Successes and Setbacks Dashboard.
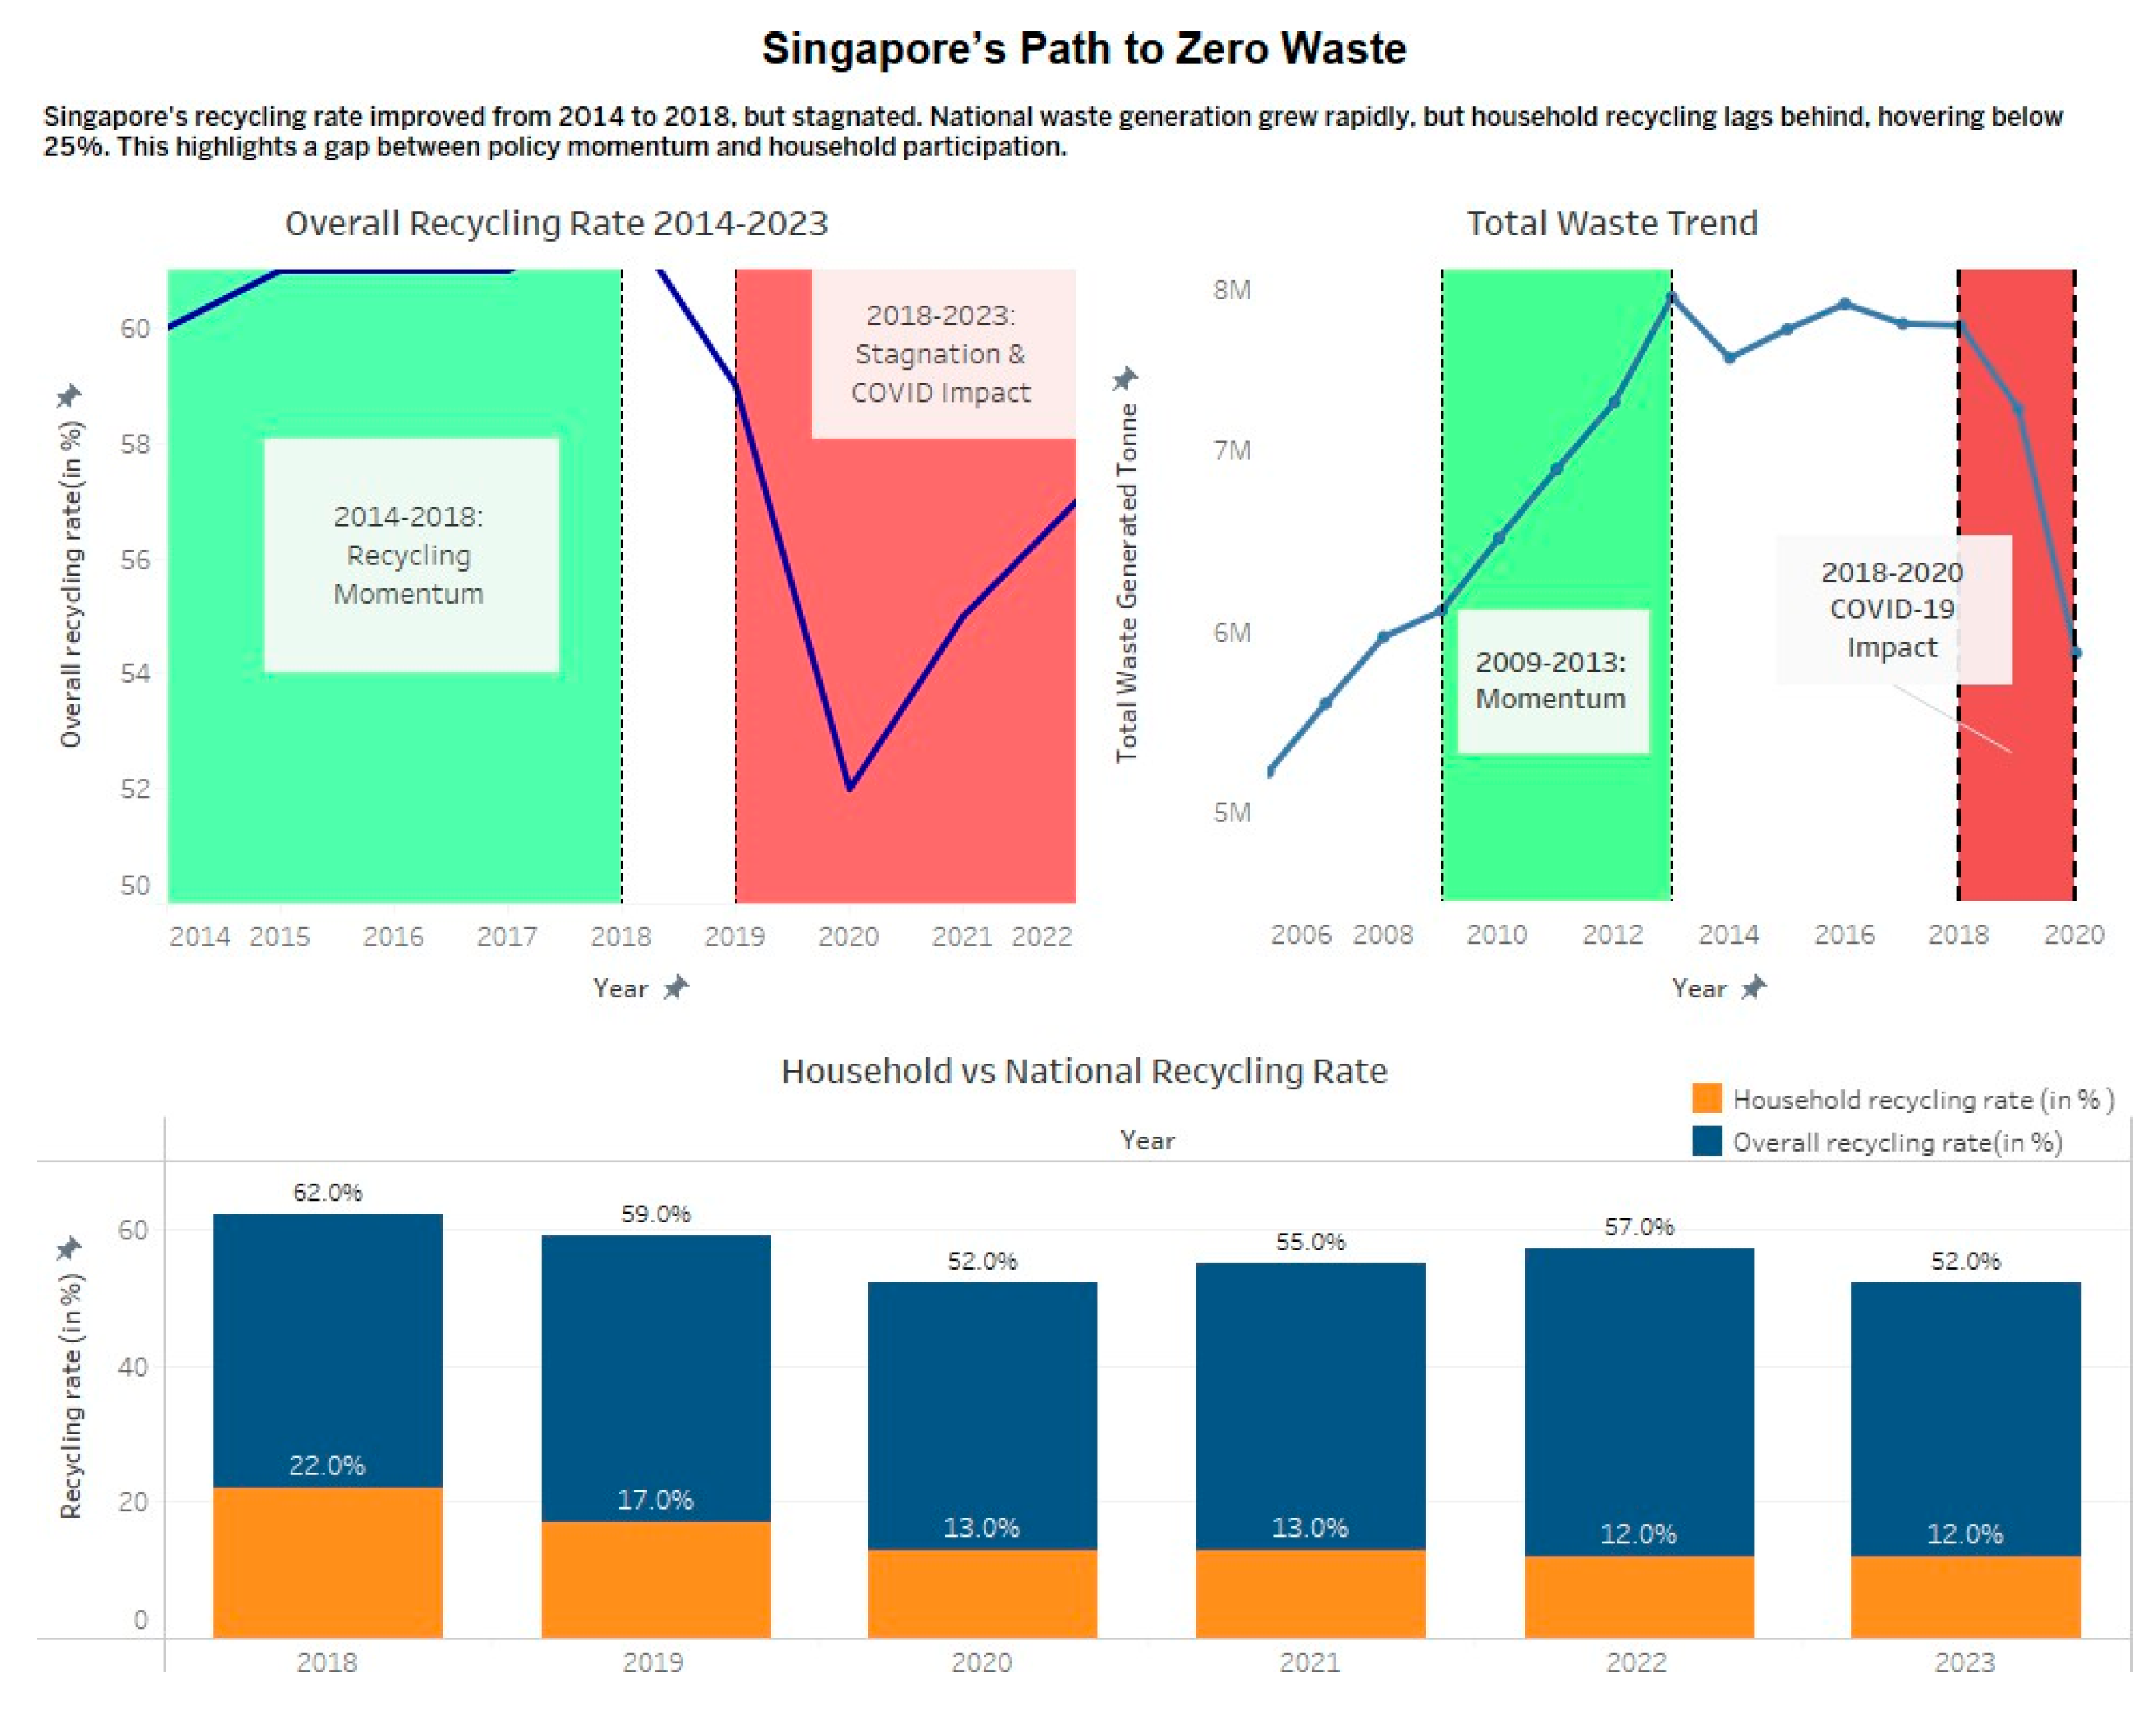
The Singapore Path to Zero Waste dashboard is a concise tale of plateau and progress. The first line chart indicates that the recycling rate increased in level by more than 58% in 2014 to a peak of over 62% as of 2018, before it flattened up. The second line chart explains the amount of waste, which shot to a high level of almost eight million tonnes in 2014, then stabilized. The stacked bar shows that the household recycling level has been consistently hovering between 12%-13 % despite the national rate being well over 50%. The combination of these three visuals demonstrates an early payoff, mid-term consolidation, and a new necessity of converting policy into daily practice to achieve zero waste by 2035.
2.5.1. Interactivity
The dashboard offers a guided no-filter experience that smoothly leads viewers through two decades of waste data in Singapore. Calculating the values leaving the year range set at a constant set of two years 2003-2023 (or 2014-2023, depending on the rate of recycling) we eliminate a necessity to select a year range in a drop-down list or with the help of a checkbox, leaving the story to be told in a well-defined scenario. This fixed representation is enhanced with an interactive tooltip to provide extremely precise values and percentages, so it is not necessary to break flows to investigate specifics. Lack of controls is a conscious decision: it does not distract the attention from the story of momentum and stagnation, turning the dashboard into a self-service data explorer.
2.5.2. Annotation
The charts are pre-marked to point out the critical points of the editorial. The 2014-2018 momentum and 2018-2023 plateau are, in the Overall Recycling Rate line chart, framed by two semi-transparent colored bands (green, red), and callouts 2014 (Momentum start), and 2018 ( Plateau begins) help instantly recall the changes. This kind of thinking is reflected in the Total Waste Trend as well: light gray bands indicate 2009-2013 momentum with a label of “2009-2013 Momentum” to 2009, and dark gray bands indicate 2018-2020 stagnation with a label of “COVID-19 impact” to 2018. Our Household vs National stacked-bar chart both annotates data labels on each segment, showing the exact percentage share pointing to the widest disparity in national and household rates. These captions are those that preempt audience inquiries and are capable of anchoring every image to our narrative as an editor.
2.5.3. Colour
Intentional use of colours helps to support meaning throughout the dashboard. Recycling rates by country are shown using deep blue, and the performance of households is shown using warm orange color with an intuitive connection drawn between the behavior at the system level and individual level. The deep blue line for both the line charts is used to illustrate the overall volumes of waste and recycling rate, giving neutrality to the coloured emphasis. The green and red focus bands are quite intentionally dimmed (20-30 % opaque) in order to attract attention but not dominate the main lines of data. Uniformity is the key: every color has an identical semantic range in each of the charts, so it is obvious to viewers at once what green signifies (positive momentum), red (challenge), blue (system metrics), and orange (household engagement).
2.5.4. Composition
The three charts are organized into a two-grid with the first two time-series line charts separated side by side at the top and the comparative stacked-bar chart taking up the entire width below them. This layout is an immediate indicator of how the first row gives the system-level picture (top recycling rates and total waste output), and the second chart a household-level counterpart. The three are aligned on a common axis of Year, and so the eye of a spectator will flow effortlessly in time, left-right, and then downwards. The title of each chart is written immediately above the plot area and in the same font size, whereas legends (when they are necessary) are fitted to the upper-right corners so as not to overlap the data. They are well spaced with ample white space between plots so that they are not overcrowded, and margins are also consistent both up and down and across. There are annotations and shaded concentration bars overlaid inside each chart, never extending into the gutter space, which provides a good border and assists in producing each picture flow as a part of a bigger picture. This organized write-up takes the viewer through national propulsion, then the waste production pattern, and onto the gap in household participation to beef up the narrative line in a distraction-free flow.
3.0. Storytelling
3.1. Plastic Nation
Singapore’s waste output declined during the COVID-19 pandemic, with plastic waste peaking during lockdowns due to food delivery services. This shift aligns with Southeast Asia’s food delivery market growth, requiring policy interventions to shift waste towards sustainability.
Figure 6.
Plastic Nation Story Point.
3.1.1. Pandemic Disruptions Alter Waste Trajectories
The top line graph illustrates Singapore's total garbage production from 2014 to 2021, comparing actual figures with projected trends with the assumption that the COVID-19 outbreak did not happen. The estimated data indicates that total garbage showed a consistent increase from 2014 to 2018. Beginning in 2019, real trash values significantly diverge from estimates, experiencing a considerable decline in 2020 and 2021.
Figure 7.
Total Waste Generated.

This variation can be directly associated with the global pandemic, which modified economic activities and reduced specific kinds of industrial and commercial waste. However, the significant decline in total trash hides a critical trend which is the simultaneous increase in plastic waste associated with changes in consumer behaviour, especially within the food service industry.
3.1.2. Plastic Waste Peaks with Food Delivery Boom
The second picture, a bar graph entitled Singapore Plastic Waste in Tonnes, highlights the divergence of plastic-specific waste from the overall drop. Although overall trash decreased, plastic waste surged to abnormal levels in 2021 and 2022 which corresponds with pandemic-induced lockdowns and a significant increase in online food delivery services.
Figure 8.
Plastic Wastes in Tonnes.
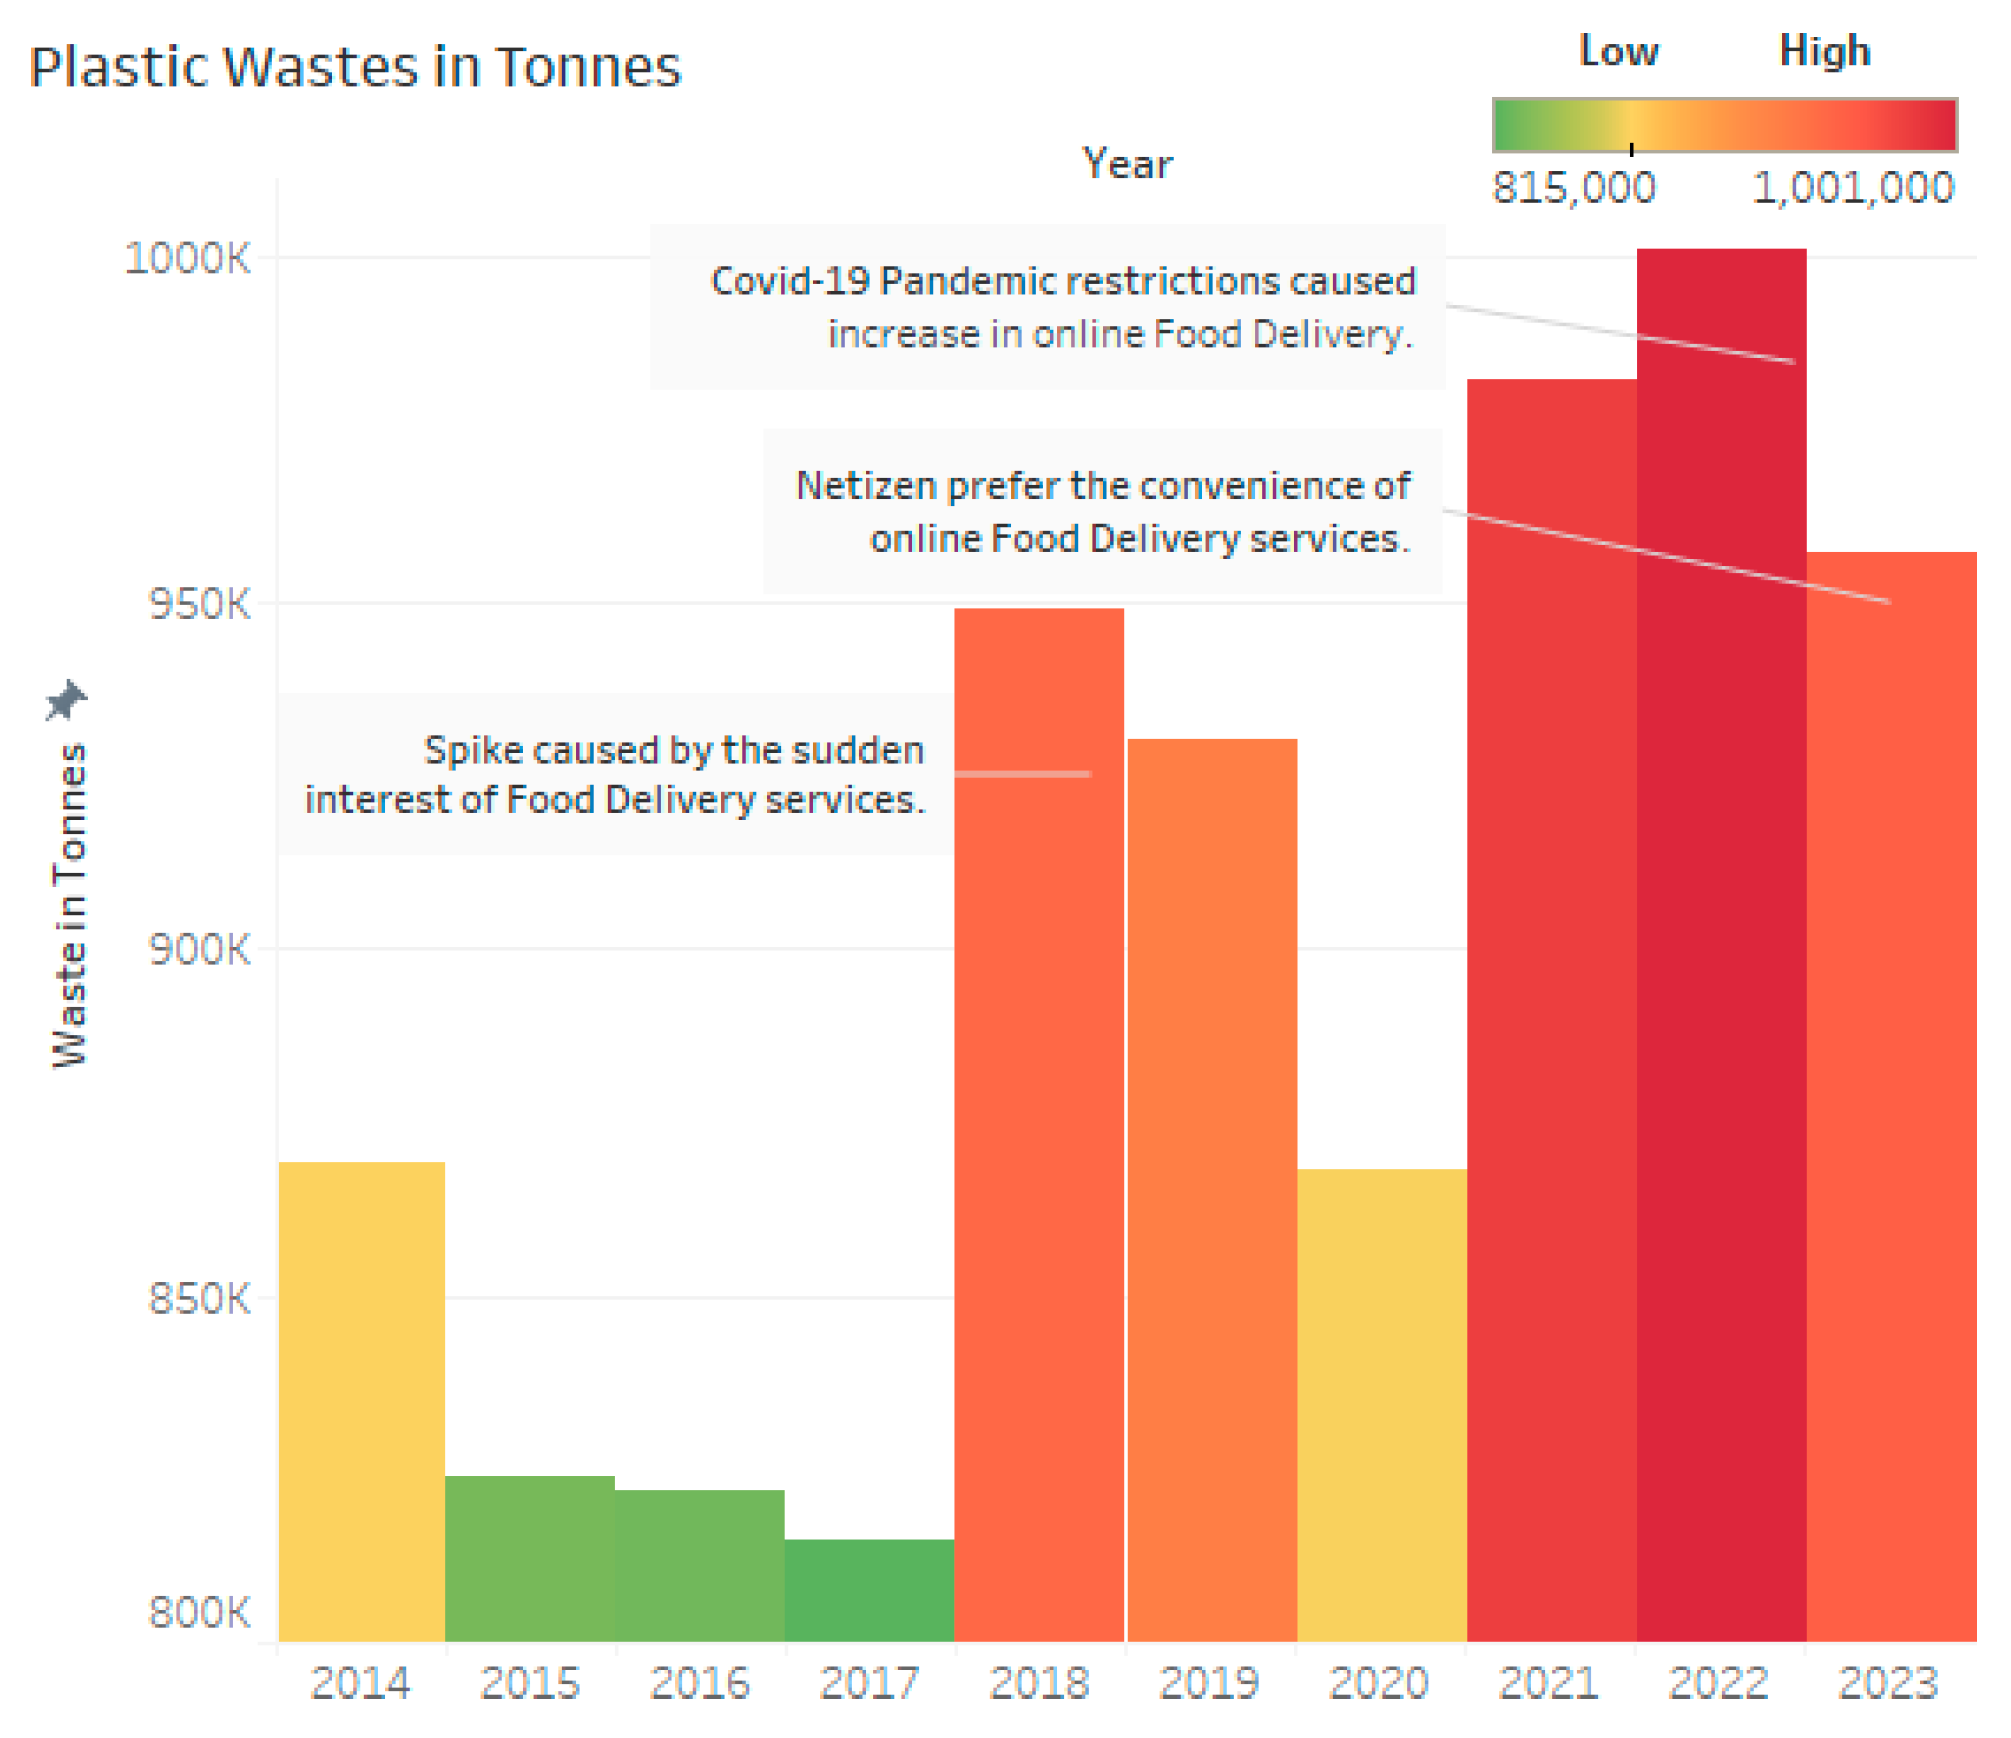
Plastic garbage increased from under 950,000 tons in 2018 to over 1,000,000 tonnes in 2022, indicating a significant rise. In spite of the removal of restrictions in later years, plastic trash persisted at high levels, demonstrating a behavioural change among consumers who continue to prefer meal delivery services despite the reintroduction of dine-in alternatives.
This tendency indicates a prolonged alteration in consumer behaviours, extending the environmental impact of the pandemic beyond its economic and health-related consequences. The graph suggests prospective reductions in 2023, likely attributable to plastic-reduction initiatives. However, the levels remain above pre-2019 baselines, indicating ongoing pressure on waste systems.
3.1.3. Food Delivery Market Fuels Environmental Strain
The final chart shows the Gross Merchandise Value (GMV) of the Food Delivery Market in Southeast Asia and it offers critical context. Between 2018 and 2023, the gross merchandise volume of the food delivery business doubled, indicating persistent regional demand. The value increased from under USD 4 billion in 2018 to more than USD 16 billion in 2023, closely correlating with the timeline of Singapore's plastic waste growth.
Figure 9.
Gross Merchandise Value of Food Delivery Market in Southeast Asia.
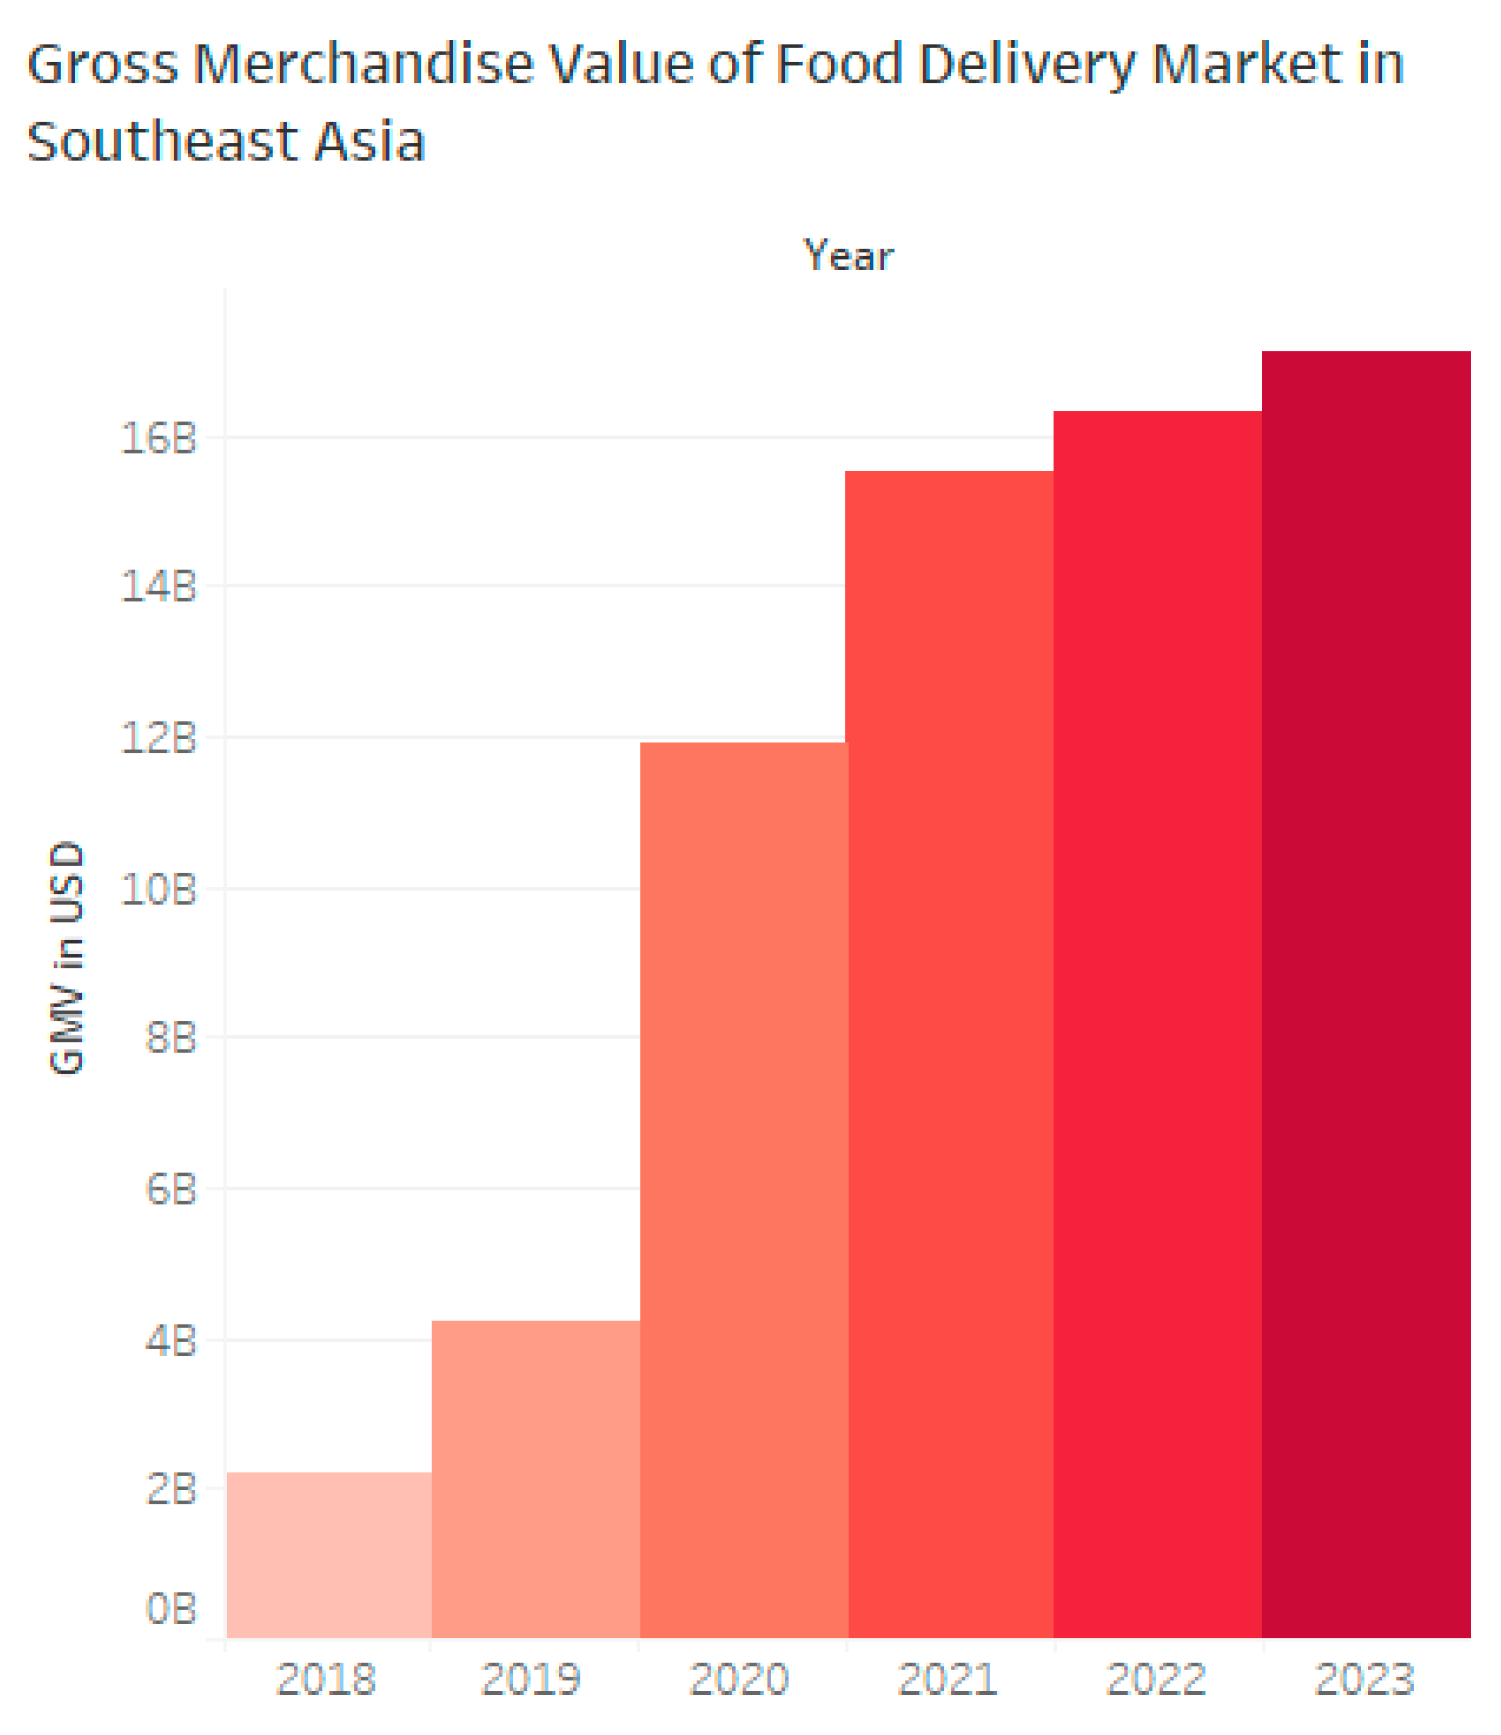
This indicates that Singapore's plastic trash problem is not unique but rather part of a wider trend throughout Southeast Asia. As regional economies embraced digital consumption, waste systems faced growing pressure from single-use packaging associated with meals, groceries, and beverages.
3.1.4. Redefining Responsibility in Post-Pandemic Waste Policy
The study shows a significant discrepancy between behavioural patterns and waste management policies. While the overall waste volume decreased due to reduced economic activity, the rise in plastic waste disproves the assumptions of environmental issues that have lessened during the pandemic. Environmental pressures eased during the pandemic. New consumption patterns, especially food delivery, have generated substantial volumes of waste that are difficult to recycle.
Singapore must expand its waste management policies to address this issue. Plastic consumption regulations, which are focused on restricting conventional packaging and straws, should be broadened to cover takeaway and delivery services. Additionally, public campaigns must target convenience-driven habits and encourage consumers to acknowledge the hidden waste expenses associated with seemingly harmless digital transactions.
3.2. The Human Factor
The waste landscape in Singapore is shaped by individual choices and daily habits far more than is acknowledged. While infrastructure and industrial contributions remain crucial, this dashboard underscores how public behaviour through recycling practices, packaging preferences, and approaches to food waste plays a pivotal role in driving or mitigating waste trends. Despite the widespread environmental awareness, discrepancies between intention and actual practice highlight an urgent necessity to better align personal motivations with sustainable outcomes. Addressing Singapore’s waste crisis thus requires not only structural solutions but also a reexamination of how everyday behaviours collectively influence the nation’s waste burden.
Figure 10.
The Human Factor Story Point.
3.2.1. Motivation over Moral Obligation: Recycling Behaviour
The first set of visuals which was extracted from the survey conducted in 2023 demonstrates that Singaporeans largely recycle when it is convenient or personally rewarding. A significant majority highlight that more accessible recycling areas and tangible incentives would motivate the individuals to recycle more regularly. On the other hand, a minimal number of individuals express willingness to make a pledge purely out of environmental responsibility. This indicates that a behavioural ecosystem in which logistical convenience and individual benefit outweigh fundamental environmental responsibility. (Milieu Insight, 2023)
Figure 11.
Recycling Triggers in May 2023.
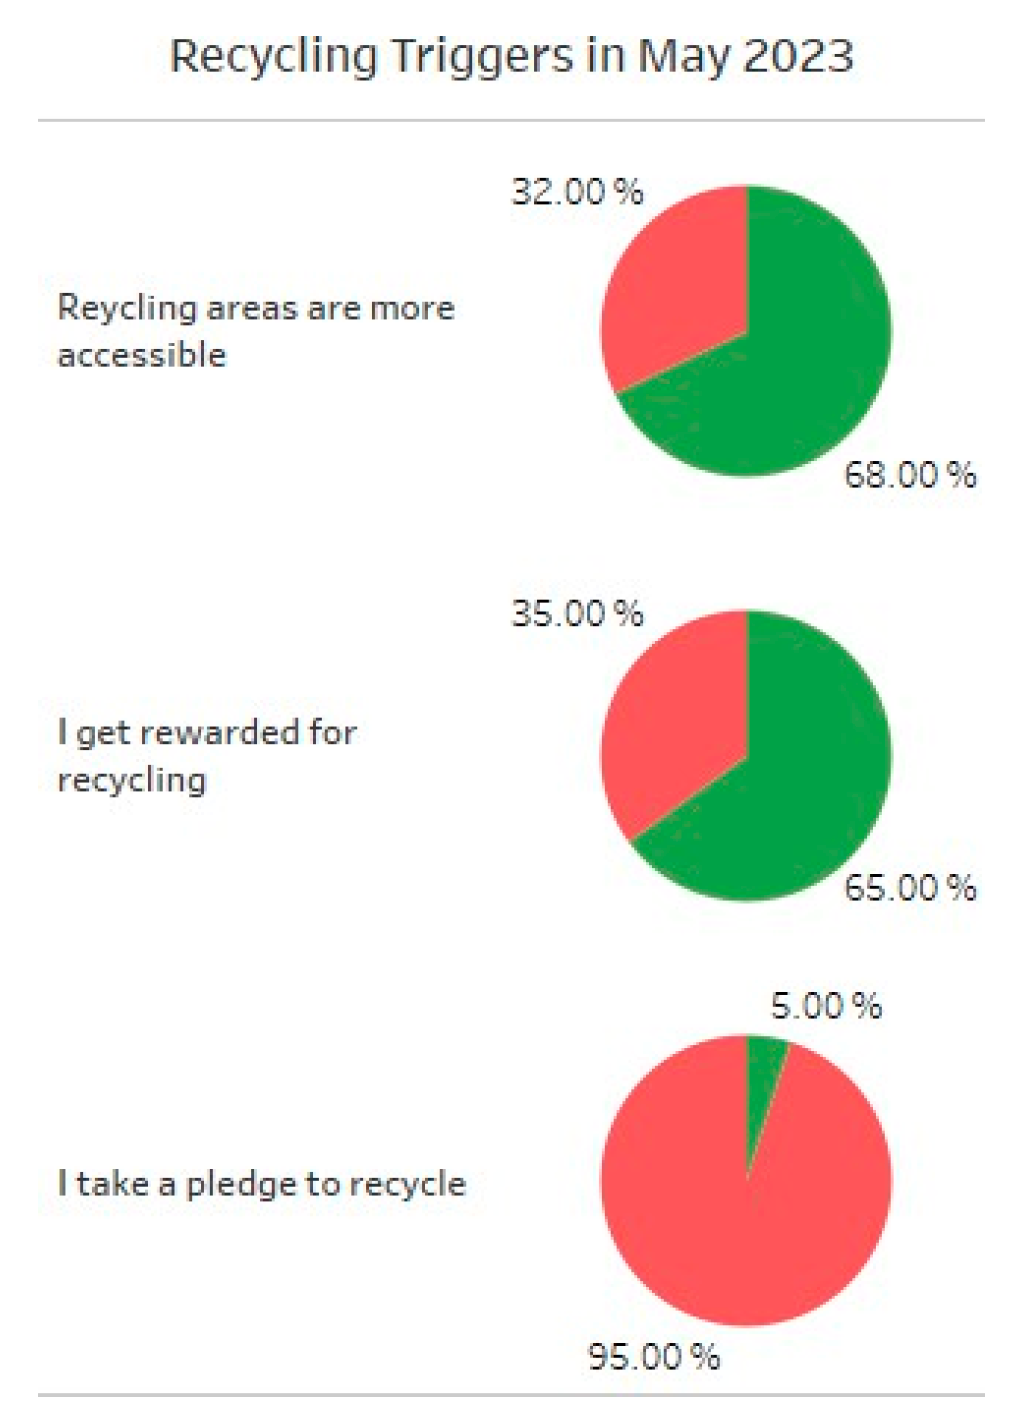
Such trends suggest that while people intellectually support recycling, habitual practices hinge on external factors such as accessible bins, financial incentives, or institutional nudges rather than a profound commitment to sustainability. This behavioural insight is essential for shaping future recycling campaigns and infrastructure planning.
3.2.2. Packaging Preferences Signal Evolving Expectations
The dashboard also explores consumer perceptions toward retail packaging. While there is a distinct preference for environmentally responsible options, the data reveals important nuances that 39% of consumers favour reducing delivery packaging altogether, 29% prefer packaging that is reusable, and 26% look specifically for recyclable packaging.
Figure 12.
Consumer Views on Retail Packaging in April 2024.
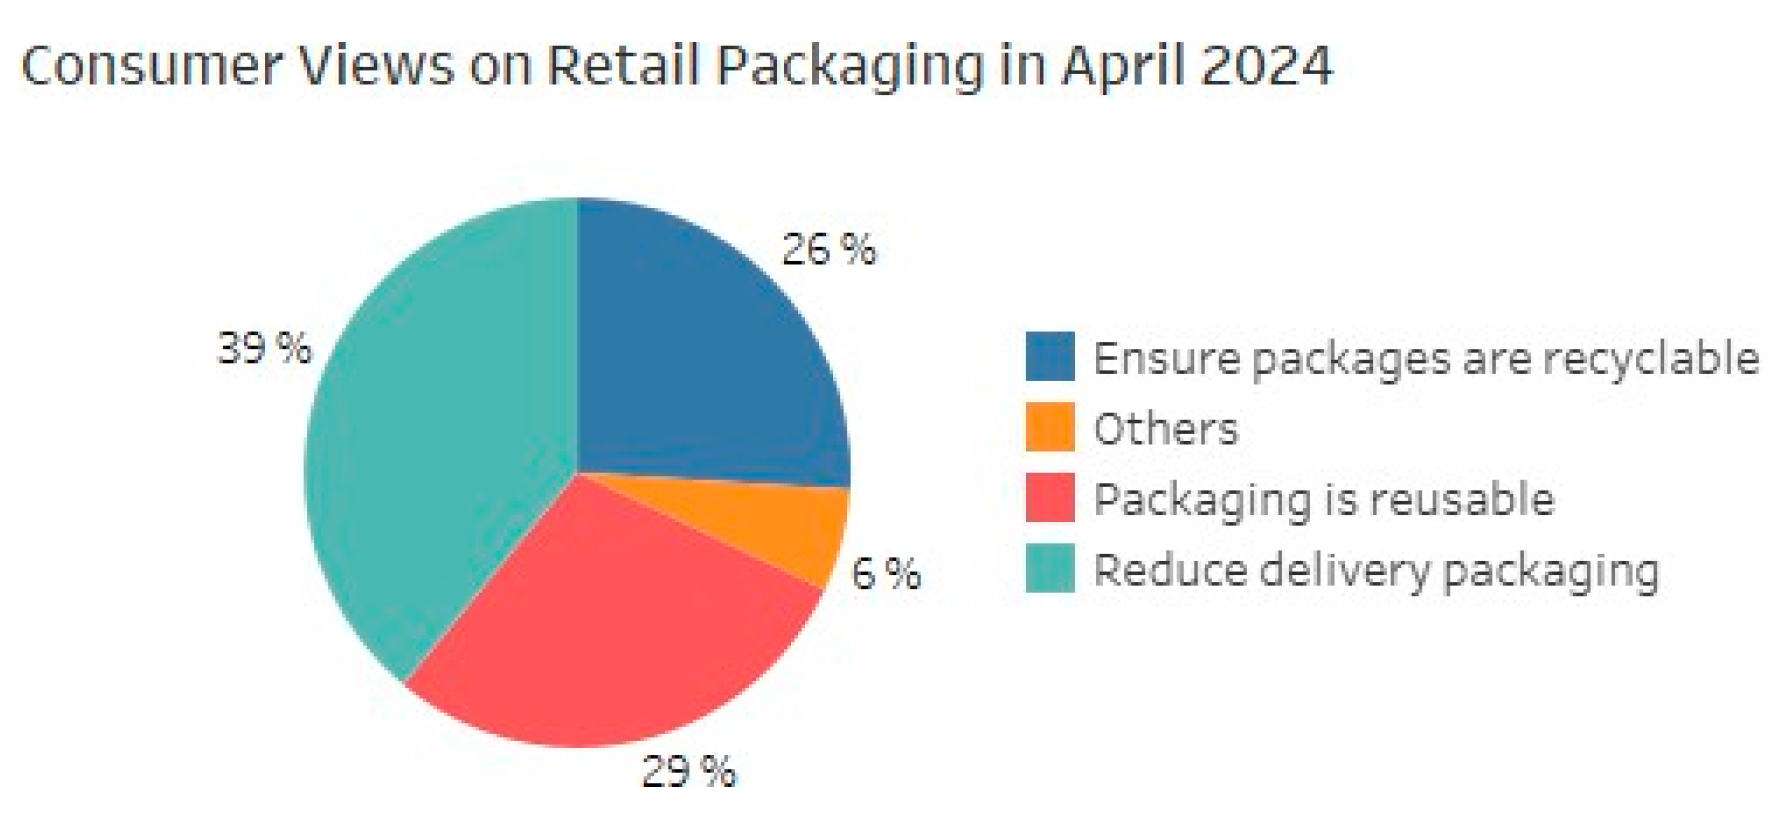
This shows that although a sizeable proportion of shoppers value packaging sustainability, these views represent an evolving expectation rather than a universally held demand. A substantial number of customers persist in prioritising alternative factors, underscoring the ongoing evolution of consumption standards.(Amazon & OnePoll, 2024) These patterns indicate that while environmental factors are progressively influencing purchasing decisions, they remain non-determinative. Retailers and policymakers have an opportunity to accelerate this transition by embedding eco-friendly packaging as the standard rather than the alternative.
3.2.3. Food Waste: A Mixed Commitment
The chart depicts a disjointed strategy for minimising food waste. A A significant number of Singaporeans are comfortable consuming leftovers and utilising refrigeration to prolong food longevity, demonstrating a pragmatic approach to waste reduction. However, fewer individuals adopt proactive habits like planning grocery lists or buying imperfect or near-expiry items which are simple yet powerful measures that could significantly reduce waste at its source.(National Environment Agency, 2019)
Figure 13.
People’s Actions to Reduce Food Wastage in Singapore in 2019.
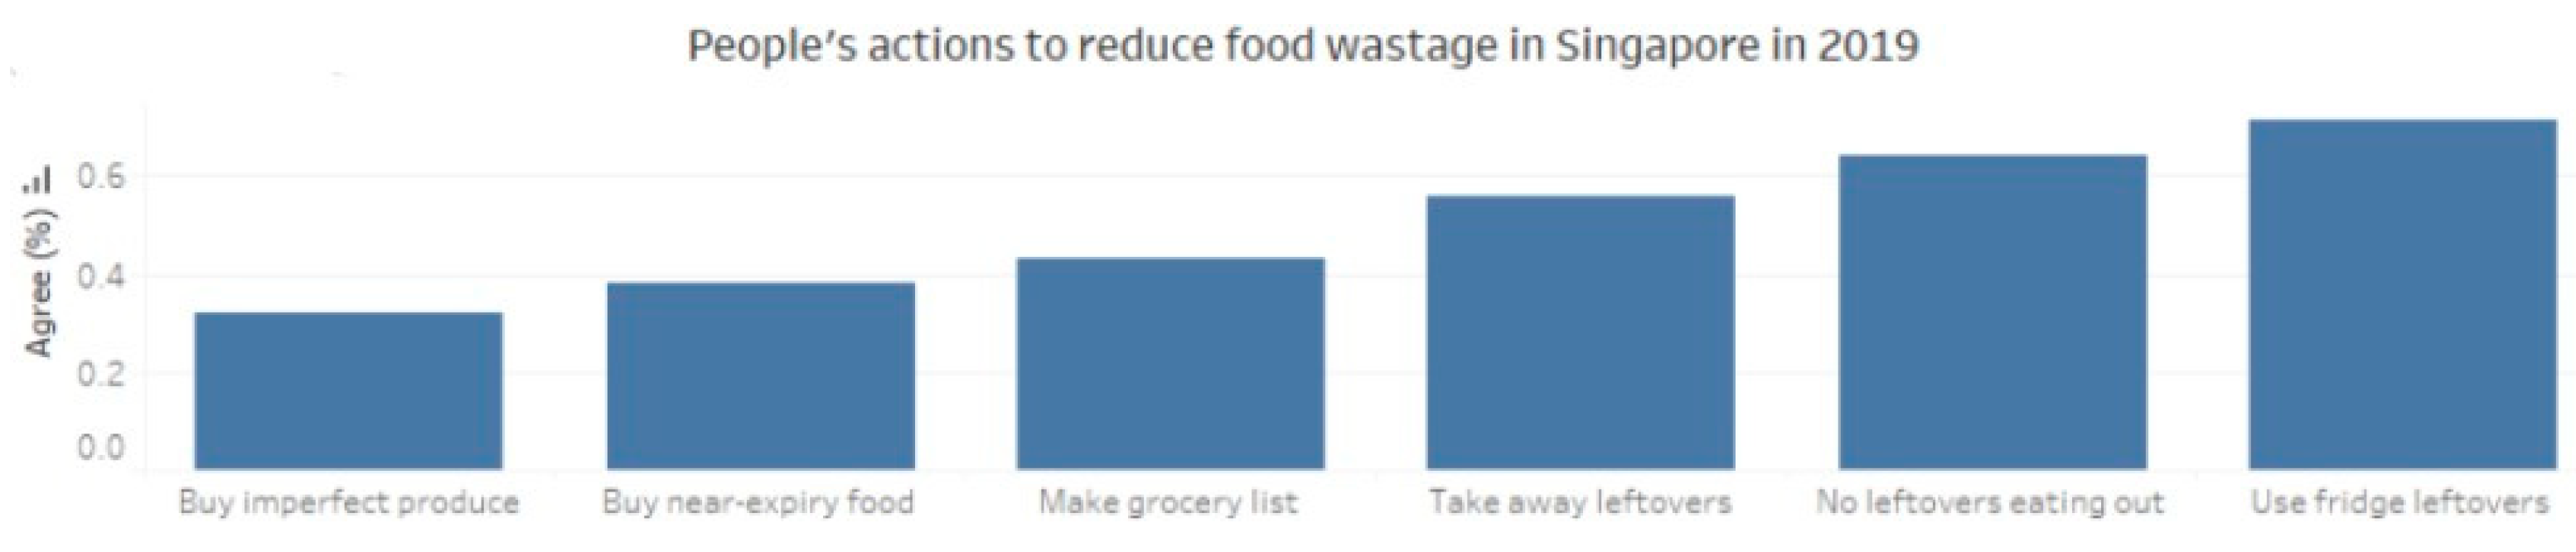
This indicates that while there is acceptance of waste reduction when it fits seamlessly into existing routines, more deliberate actions that require forethought or a departure from aesthetic norms are less widely embraced. It also emphasises the requirement for both cultural shifts and practical tools like meal planning apps or retail incentives for “imperfect” produce to broaden commitment.
3.2.4. Rethinking Intervention: From Awareness to Behaviour Change
Collectively, all these insights highlight that the population in Singapore acknowledges the significance of sustainability, yet displays a lack of consistent behaviour. People tend to respond more to convenience and incentives than to abstract environmental ideals. This pattern indicates a realistic approach where campaigns and policies should extend beyond mere awareness to actively reform systems and attitudes that facilitate sustainable choices as the most accessible and rewarding alternatives.
Figure 14.
Changes Required for Better Living in November 2023.
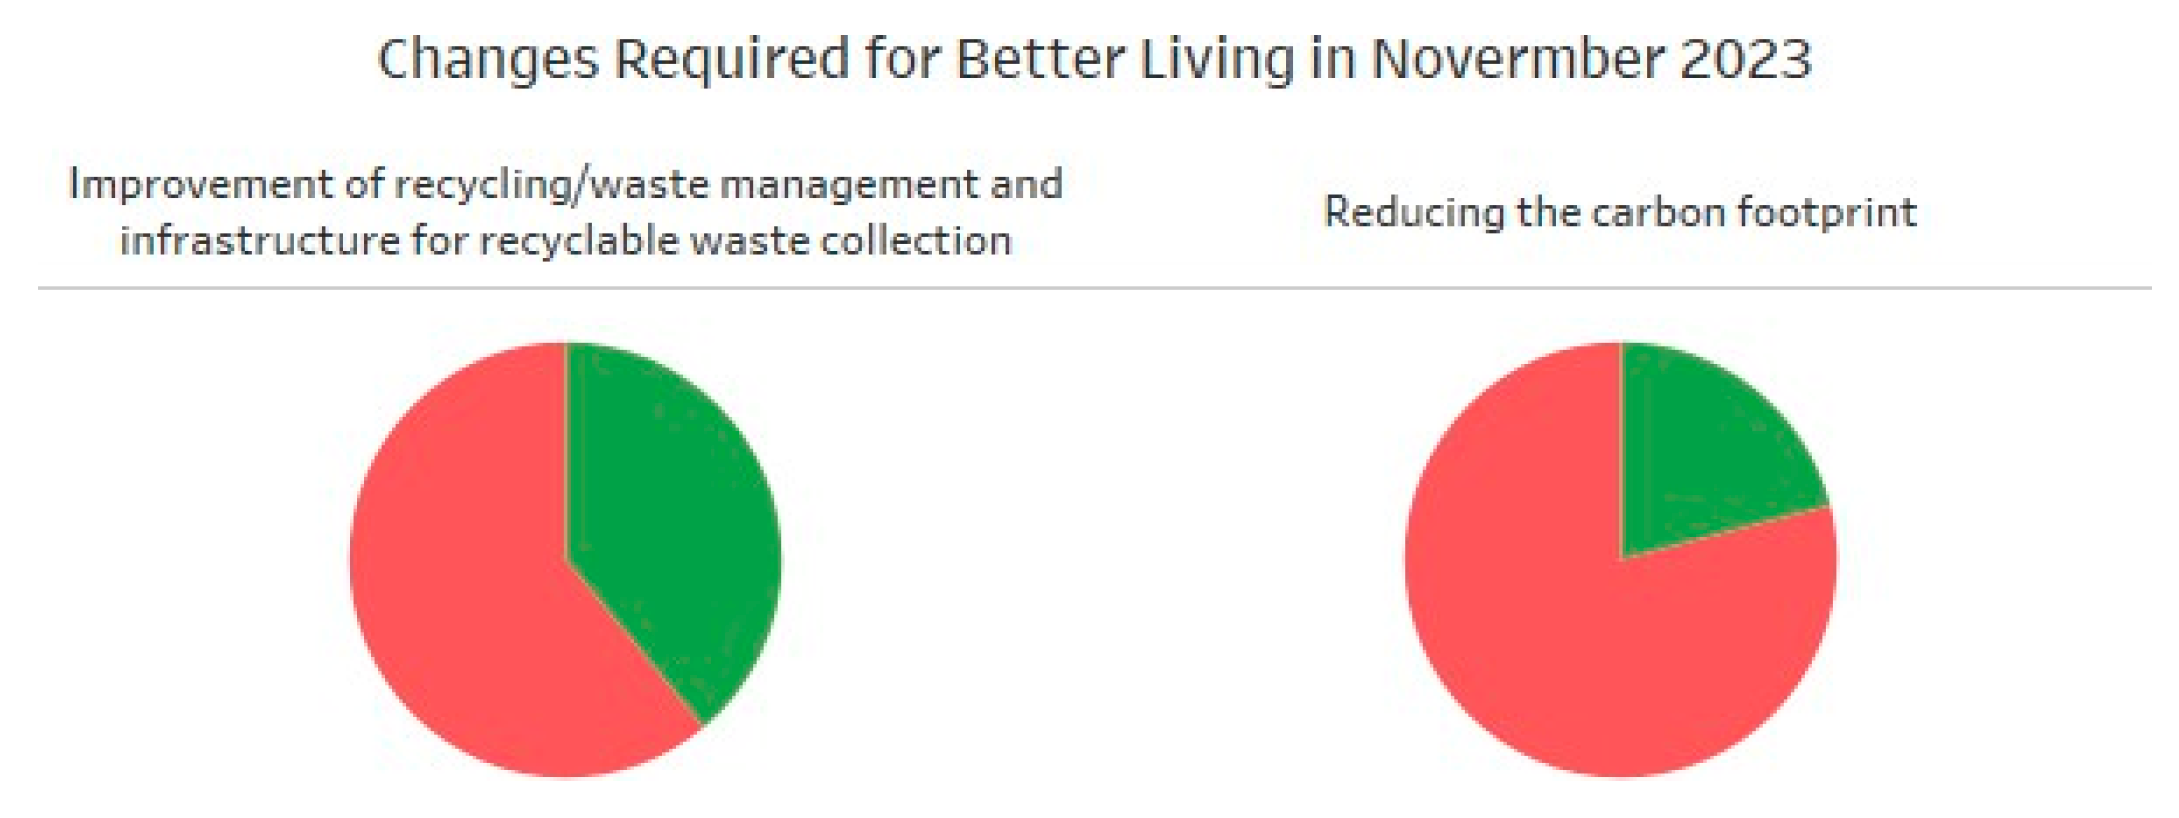
To effectively transform the waste trajectory, Singapore requires continuous community involvement, behavioural incentives, and infrastructural enhancements that tackle these psychological and logistical factors. Only by closing the gap between intention and action can public behaviour evolve from passive awareness to an active force in shaping a low-waste future.
3.3. Hidden Culprits
The waste load in Singapore is mostly influenced by industrial and commercial activities, whereas public discussions often focus on individual recycling practices. Annually, non-domestic sources including industries, enterprises, construction, and institutions, produce the majority of Singapore’s solid trash, far surpassing household contributions. This disparity has persisted over the previous decade, highlighting a fundamental issue: while families are encouraged to recycle and minimise trash, the predominant portion of garbage originates from economic sectors upstream. This exemplifies the phenomenon of "hidden culprits" where sectors and organisations whose waste impacts are less apparent in public discourse, despite evidence indicating they are the primary contributors to the nation's waste volume.
Figure 15.
Hidden Culprits Story Point.
To effectively address Singapore's waste challenge, we must shift the narrative and policy emphasis towards the structural origins of waste, rather than disproportionately highlighting individual consumer responsibility.
3.3.1. Non-Domestic Waste Is the Dominant Source
The visual analysis of trash volume by source indicates that non-domestic wastes are growing to constitute the majority of Singapore's total waste annually. The pie chart shows that the green section (indicating non-domestic sources) surpasses the red (domestic sources), with the green segments continuously prevailing, irrespective of the year. The evidence is unequivocal: industrial and commercial sectors generate far more garbage than individual homes.
Figure 16.
- Percentage of Domestic and Non-Domestic Waste Generated.
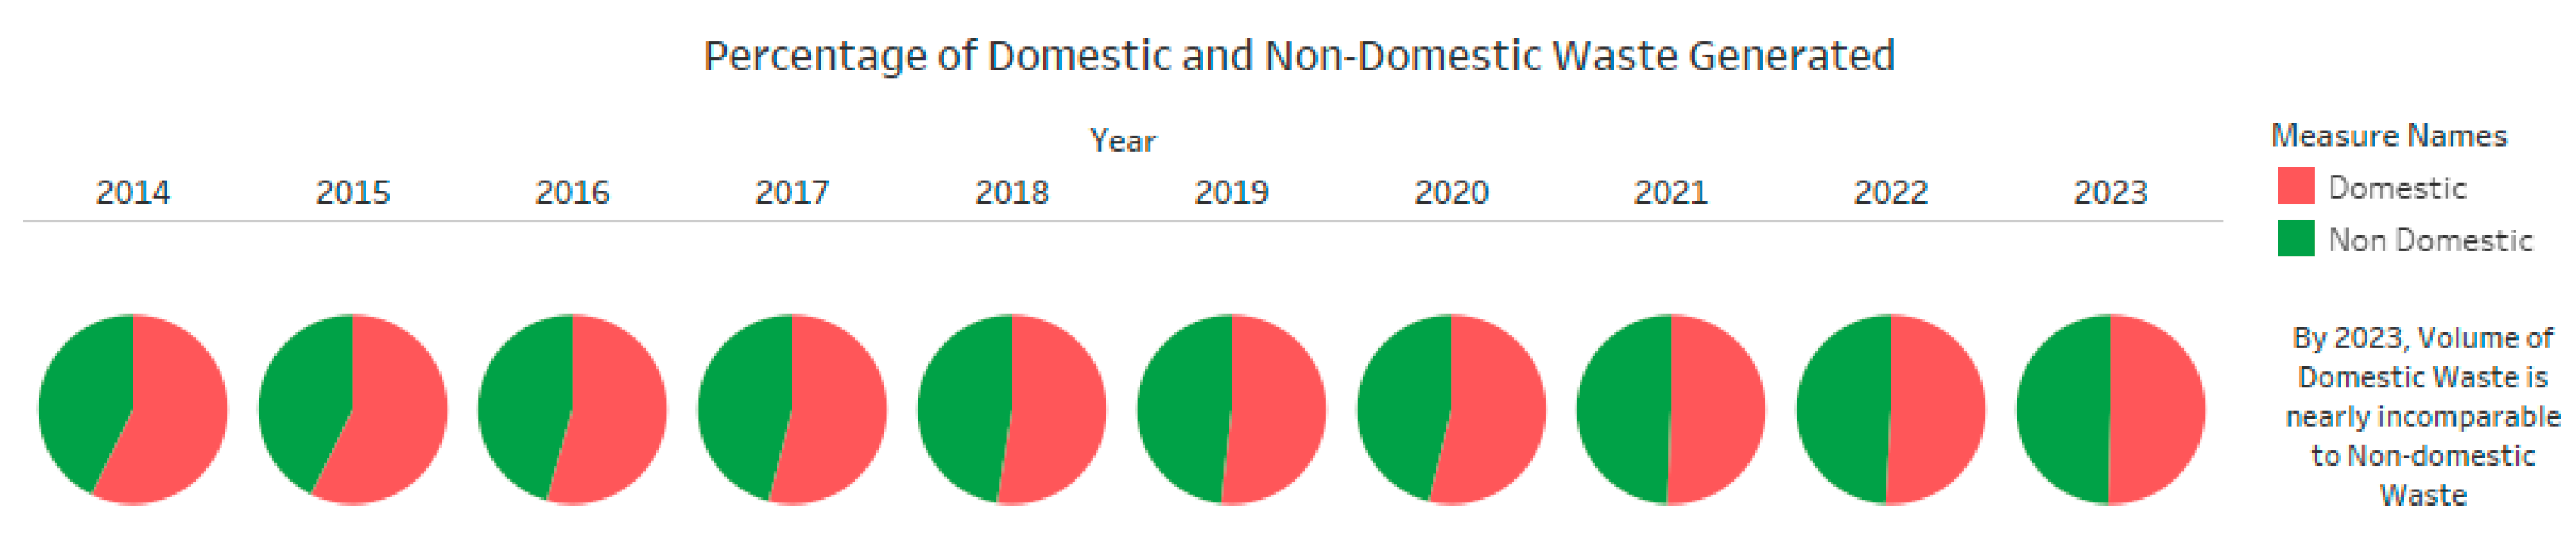
In 2020, despite a decrease in overall waste volume owing to COVID-19 lockdowns, the ratio of domestic to non-domestic garbage remained relatively unchanged. This stability corroborates the assertion that the nation's waste burden is fundamentally linked to non-domestic activities. In contrast, households exert a diminished influence on the overall trajectory of trash generation. (Singapore Department of Statistics, 2024)
3.3.2. Economic Activity Drives Waste Output
The significant decline in 2020, followed by a complete recovery in 2021 and 2022, illustrates the close correlation between Singapore's trash production and its economic development. During the lockdowns, the closure of enterprises and the deceleration of industrial activities led to a significant reduction in non-domestic waste quantities. Nevertheless, with the resumption of business and building operations, waste levels rebounded with equal rapidity.
Figure 17.
Percentage of Waste from Germany.
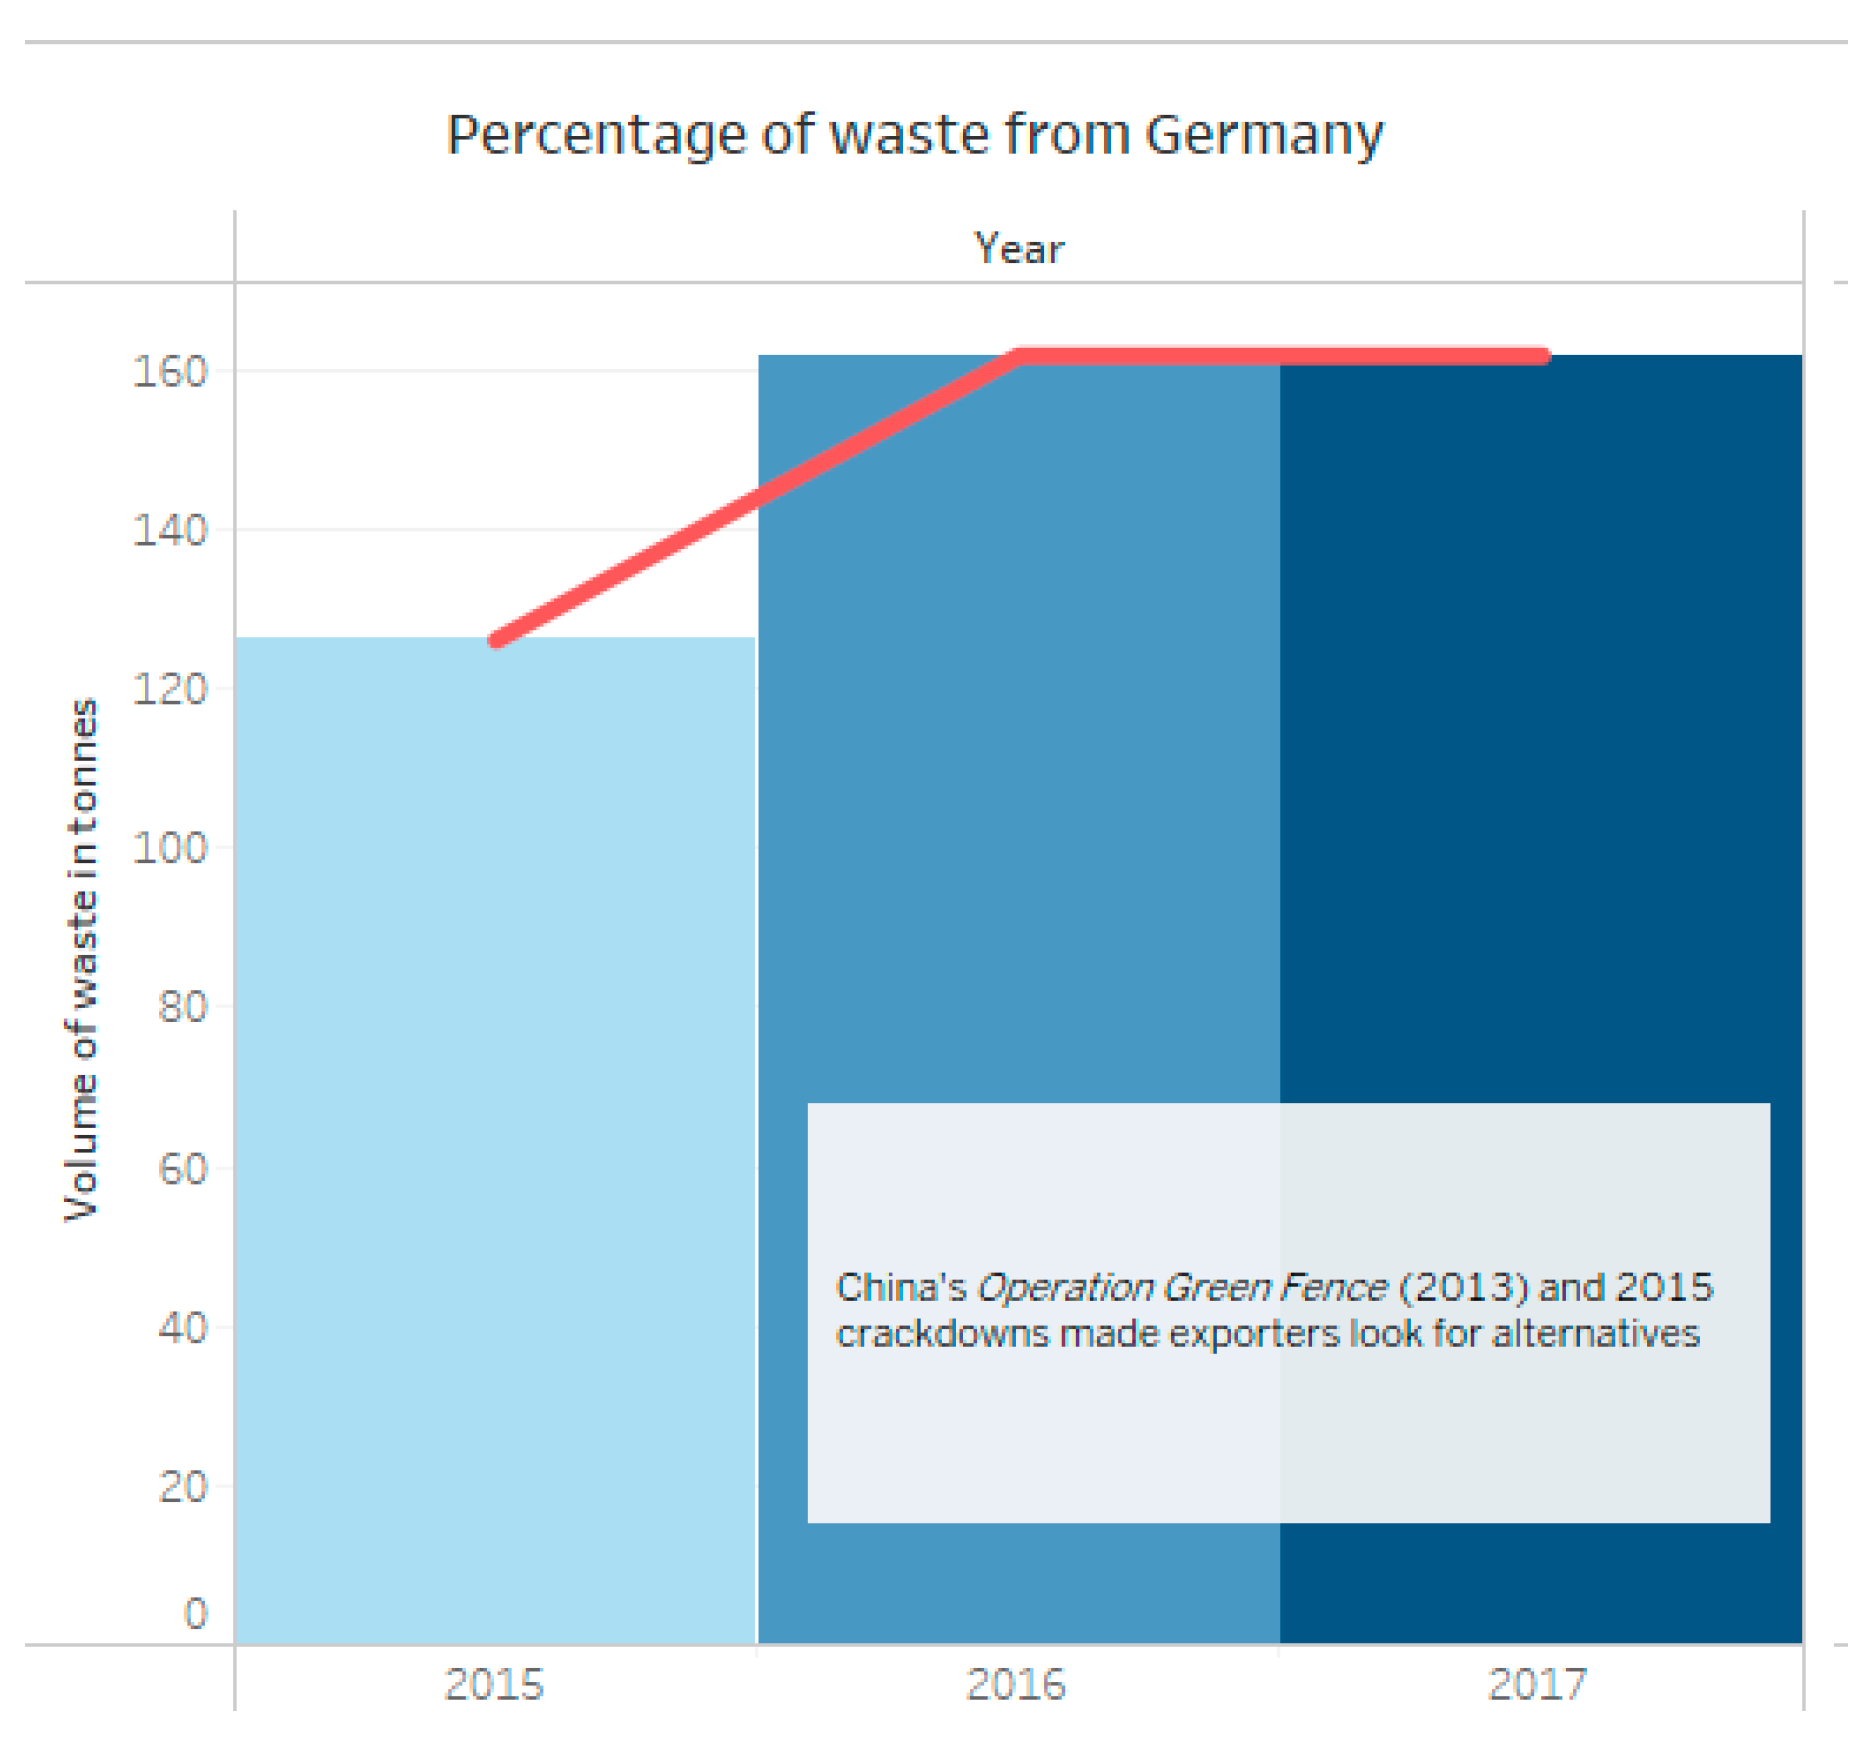
This tendency indicates that variations in national trash production are mostly influenced by alterations in company practices rather than modifications in consumer behaviour. Although home awareness programs may impact recycling on a minor scale, their influence on national trash volume is negligible compared to choices made in businesses, factories, and commercial kitchens.
3.3.3. External Pressure Adds to the Burden
The increase in trash imports from Germany and the USA from 2015 to 2017, seen in the lower two figures, adds an additional aspect to Singapore’s industrial waste profile. These rises corresponded with China's implementation of Operation Green Fence, which imposed stricter regulations on recyclable imports. Consequently, some garbage that was once sent to China has been rerouted to alternative nations, like Singapore. (UN Comtrade, 2019a) (UN Comtrade, 2019b)
Figure 18.
Percentage of Waste from USA.
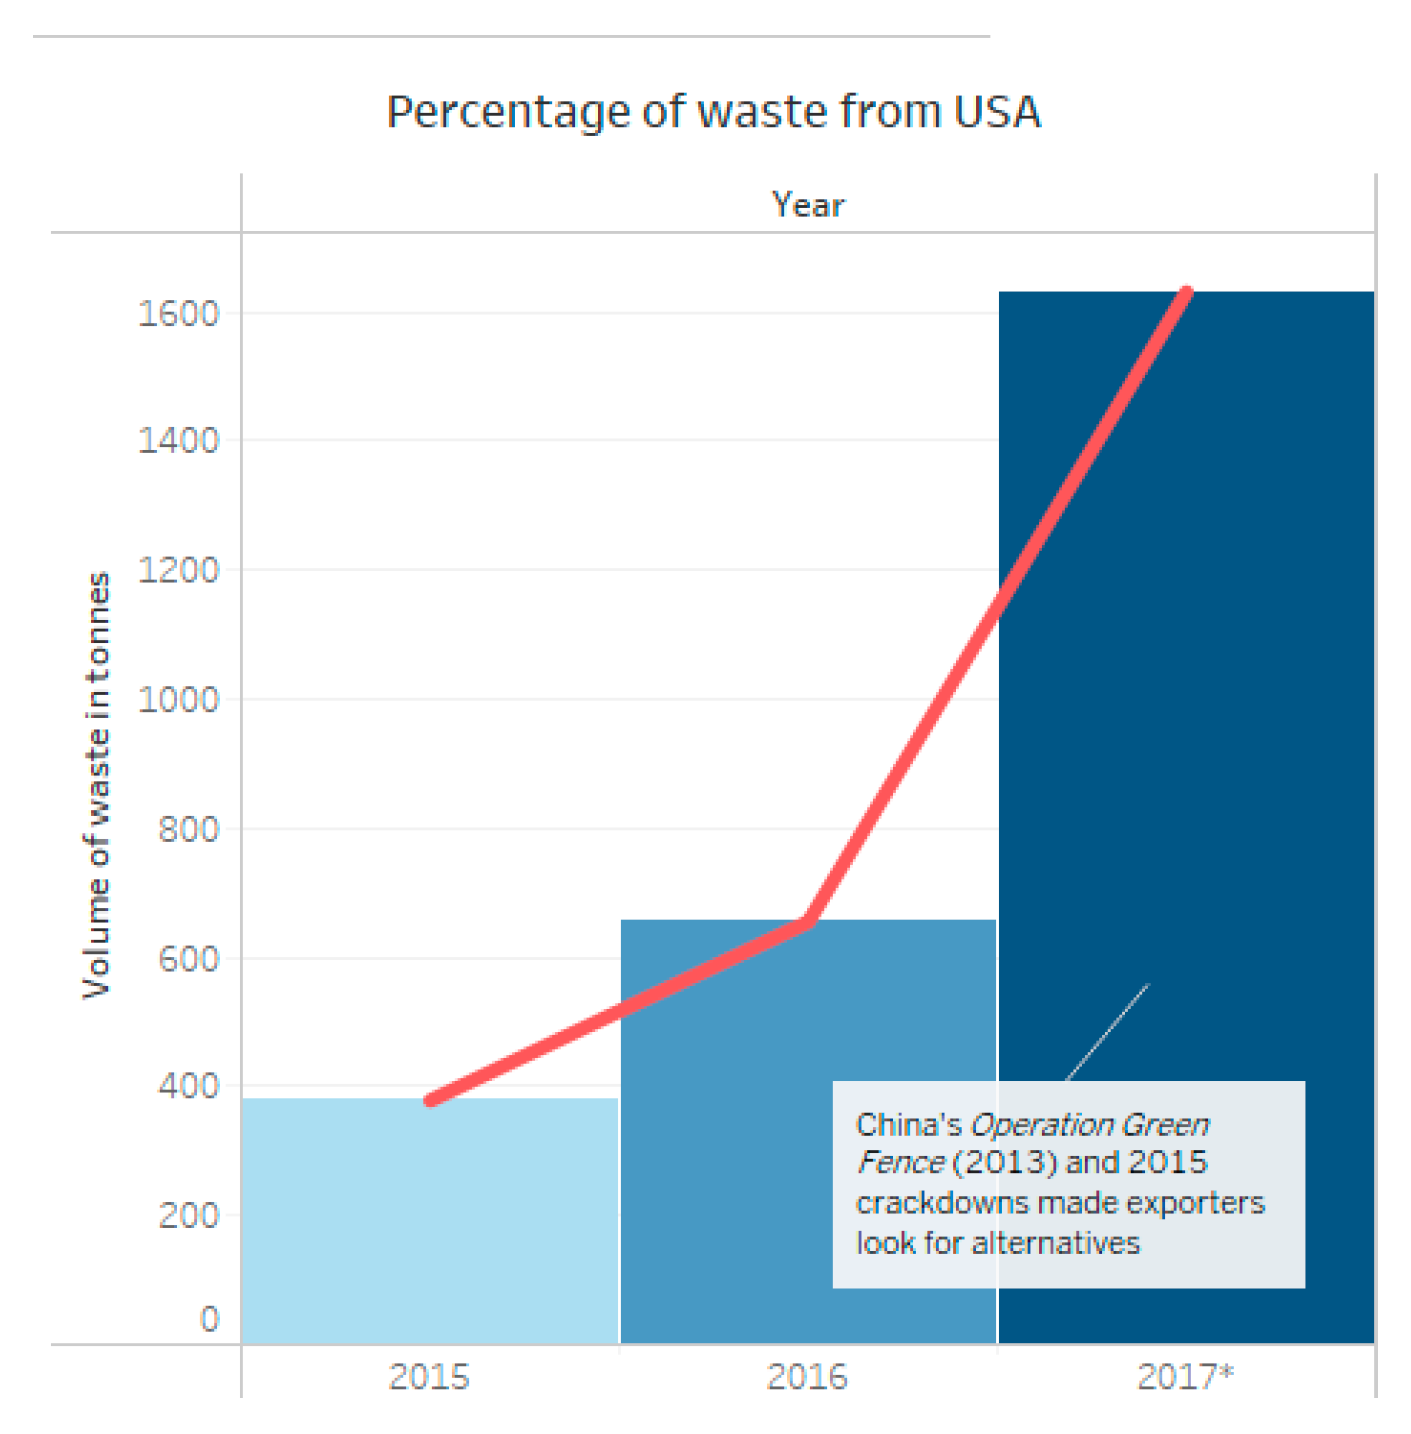
Singapore's capacity to manage or assimilate a portion of this misdirected trash illustrates its function within the global waste ecosystem. Nonetheless, it imposes additional strain on home garbage systems, particularly when incoming volumes include industrial recyclables such as plastics, paper, and metals. The visualisations depict imported garbage as a singular component, although their correlation with global policy shifts, highlights the impact of both local and international variables on Singapore's non-domestic waste burden.
3.3.4. Shifting the Narrative: Homes to Industries
Considering these results, public awareness and trash reduction campaigns should continue to emphasise individual recycling practices. Initiatives encourage households to categorise their recyclables and minimise food waste domestically. However, as the statistics illustrate, domestic contributions are minimal and largely constant, while non-domestic waste propels the total trend.
To achieve significant change, Singapore must realign its narrative and policy initiatives towards the sectors identified as having the most substantial influence. The industrial, commercial, and institutional entities responsible for the green segments in the charts must be held more accountable for the garbage they generate.
3.4. Beyond Recycling
Singapore’s waste production can be divided into categories for a better understanding. The categories are named after the materials they consist of i.e. Plastic, Paper, Non-Ferrous Metal, etc. While it is indeed crucial to reduce, reuse and recycle (apply the 3 R’s) as much as possible when it comes to waste management, an important factor that often gets ignored is the use of fossil fuels ,i.e. crude oil in Singapore’s case to be exact, and energy in waste management. Despite widespread awareness of the fact that recycling waste conserves crude oil and energy ,in this case electricity to be exact, not many people are aware of the raw details of which materials conserve how much energy and oil. It is necessary that this issue be examined in detail for a better understanding of the problem in order to reduce the pressure on the country’s energy and financial resources.
Figure 19.
Beyond Recycling Story Point.
3.4.1. Food Dominates Waste but Lacks Recycling Incentive
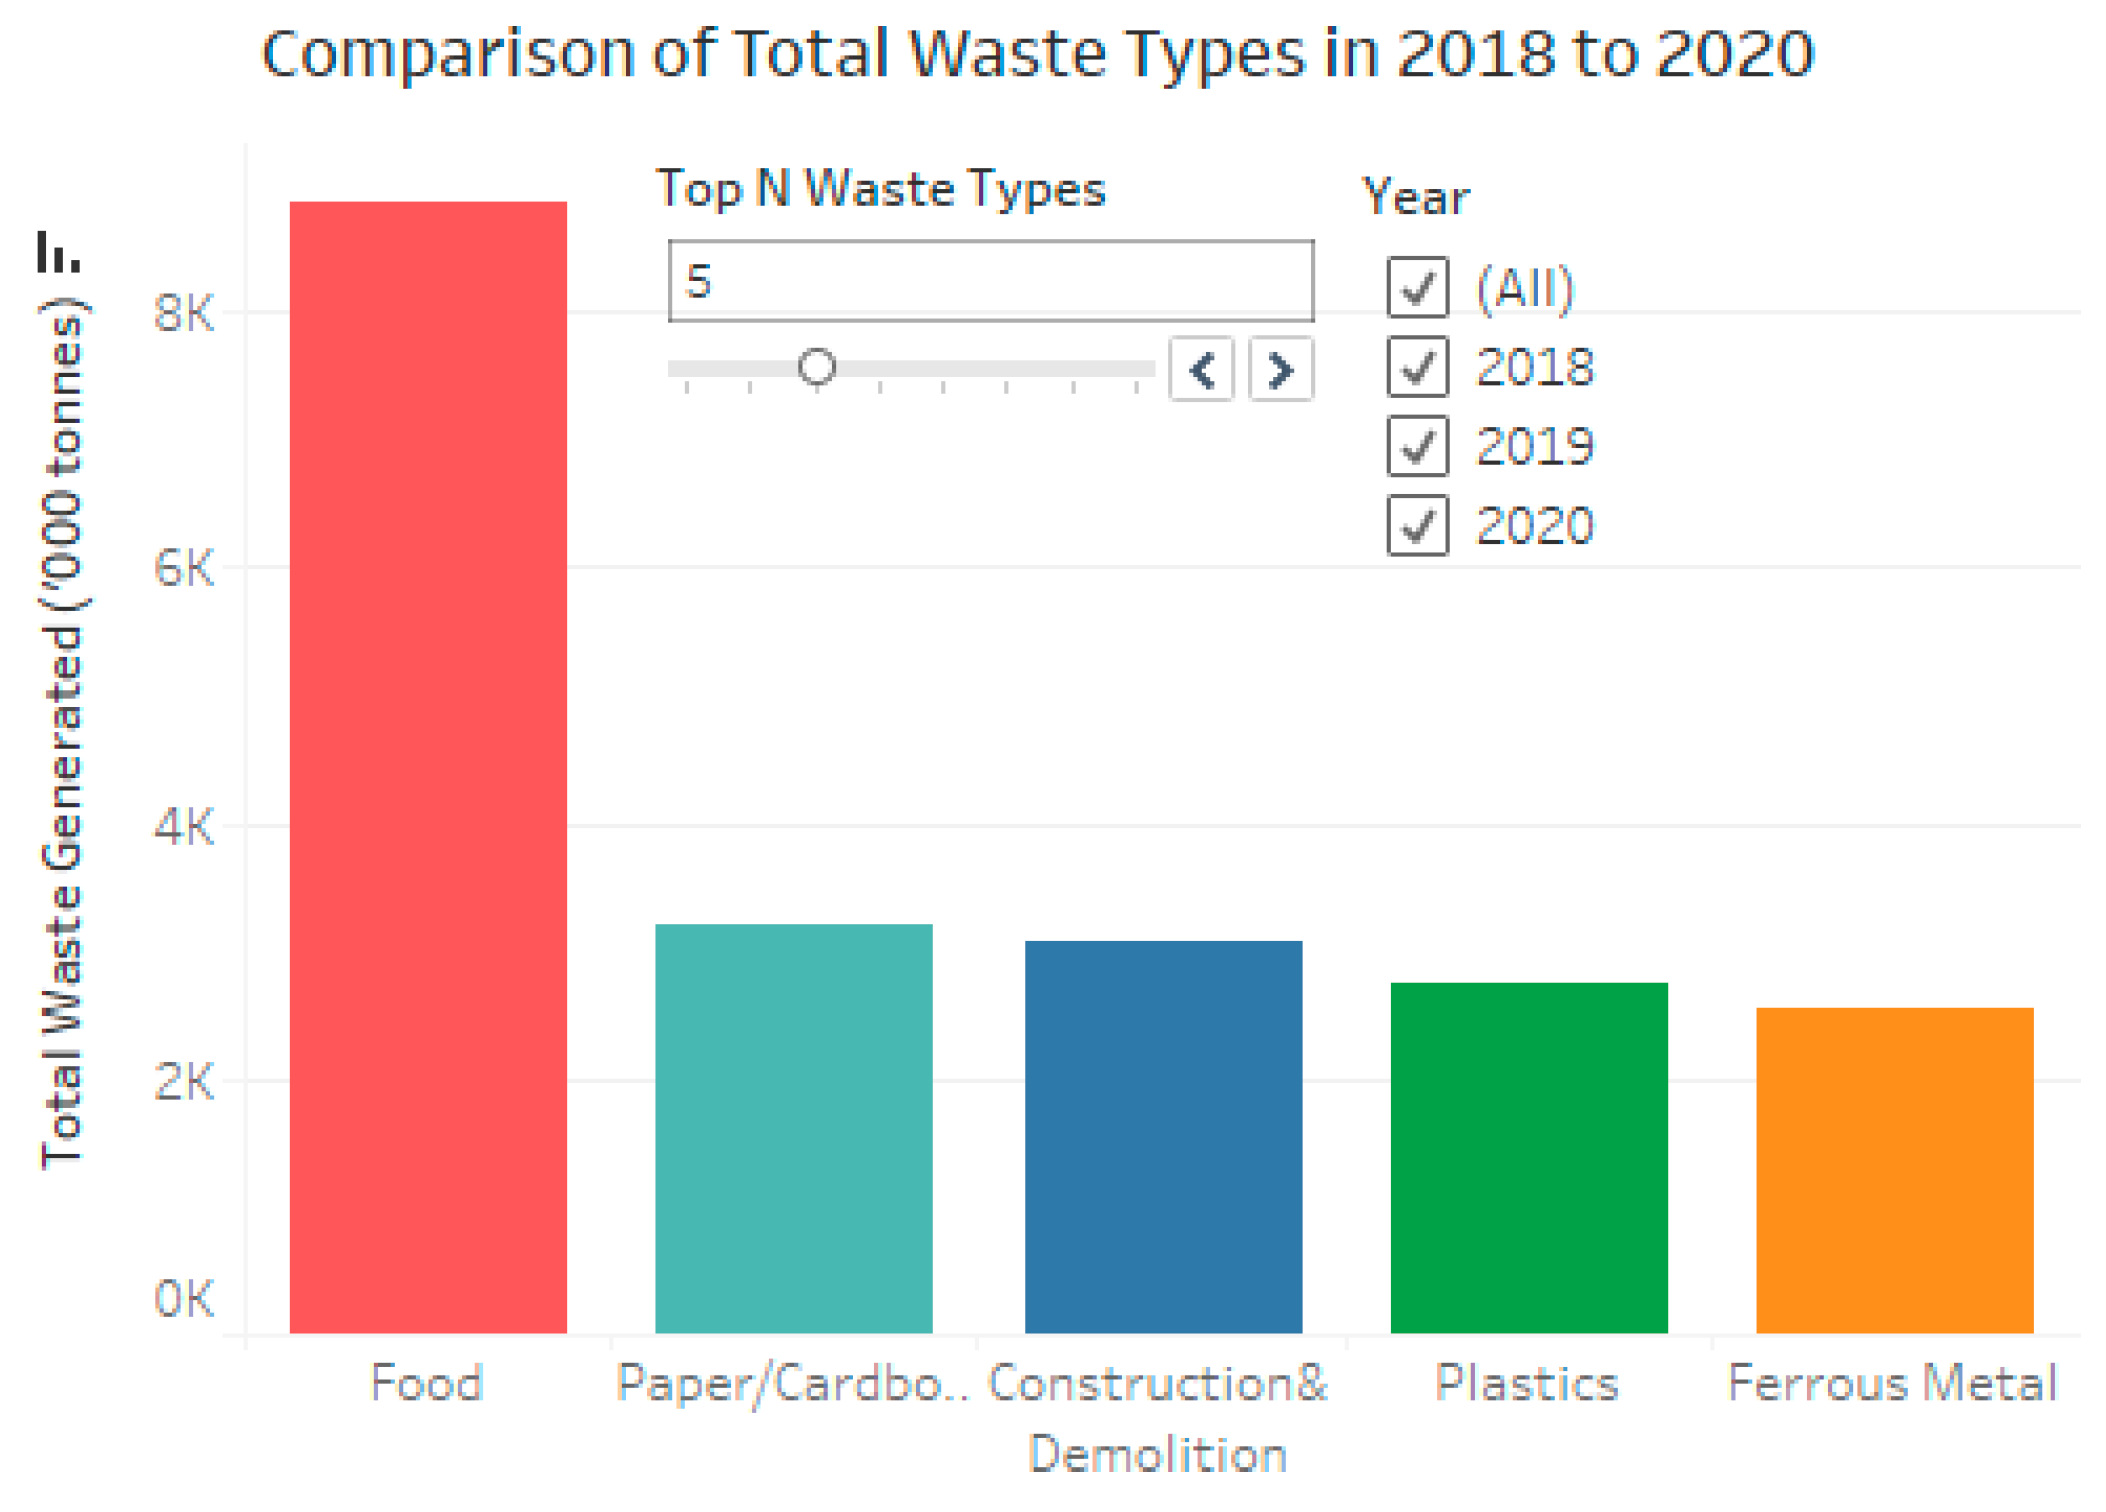
The first set of visuals is a vertical bar chart depicting the quantity of total waste generated in kilo metric tons in SIngapore in the years 2018-2020. As can be observed, the trend remains constant throughout the three years. It demonstrates that from the Top 5 leading waste categories, Food waste was the leading one with more than 8,000 kilo metric tons (Singapore Department of Statistics, 2025). However despite this Food does not appear in any of the visualizations about recycling. In fact the leading saver of crude oil and energy in the visuals is Non-Ferrous Metal.
This trend suggests that Food lacks recyclability benefits in terms of crude oil and energy conservation which in turn suggests that a better approach to food waste management will be to reduce the amount of food waste generated as that will be a much more reliable option compared to recycling food waste as it lacks benefits the aforementioned oil and energy returns.
Figure 20.
Comparison of Total Waste Types in 2018 to 2020.
3.4.2. Non-Ferrous Metals Dominate: Crude Oil, Plastic & Paper Rebound
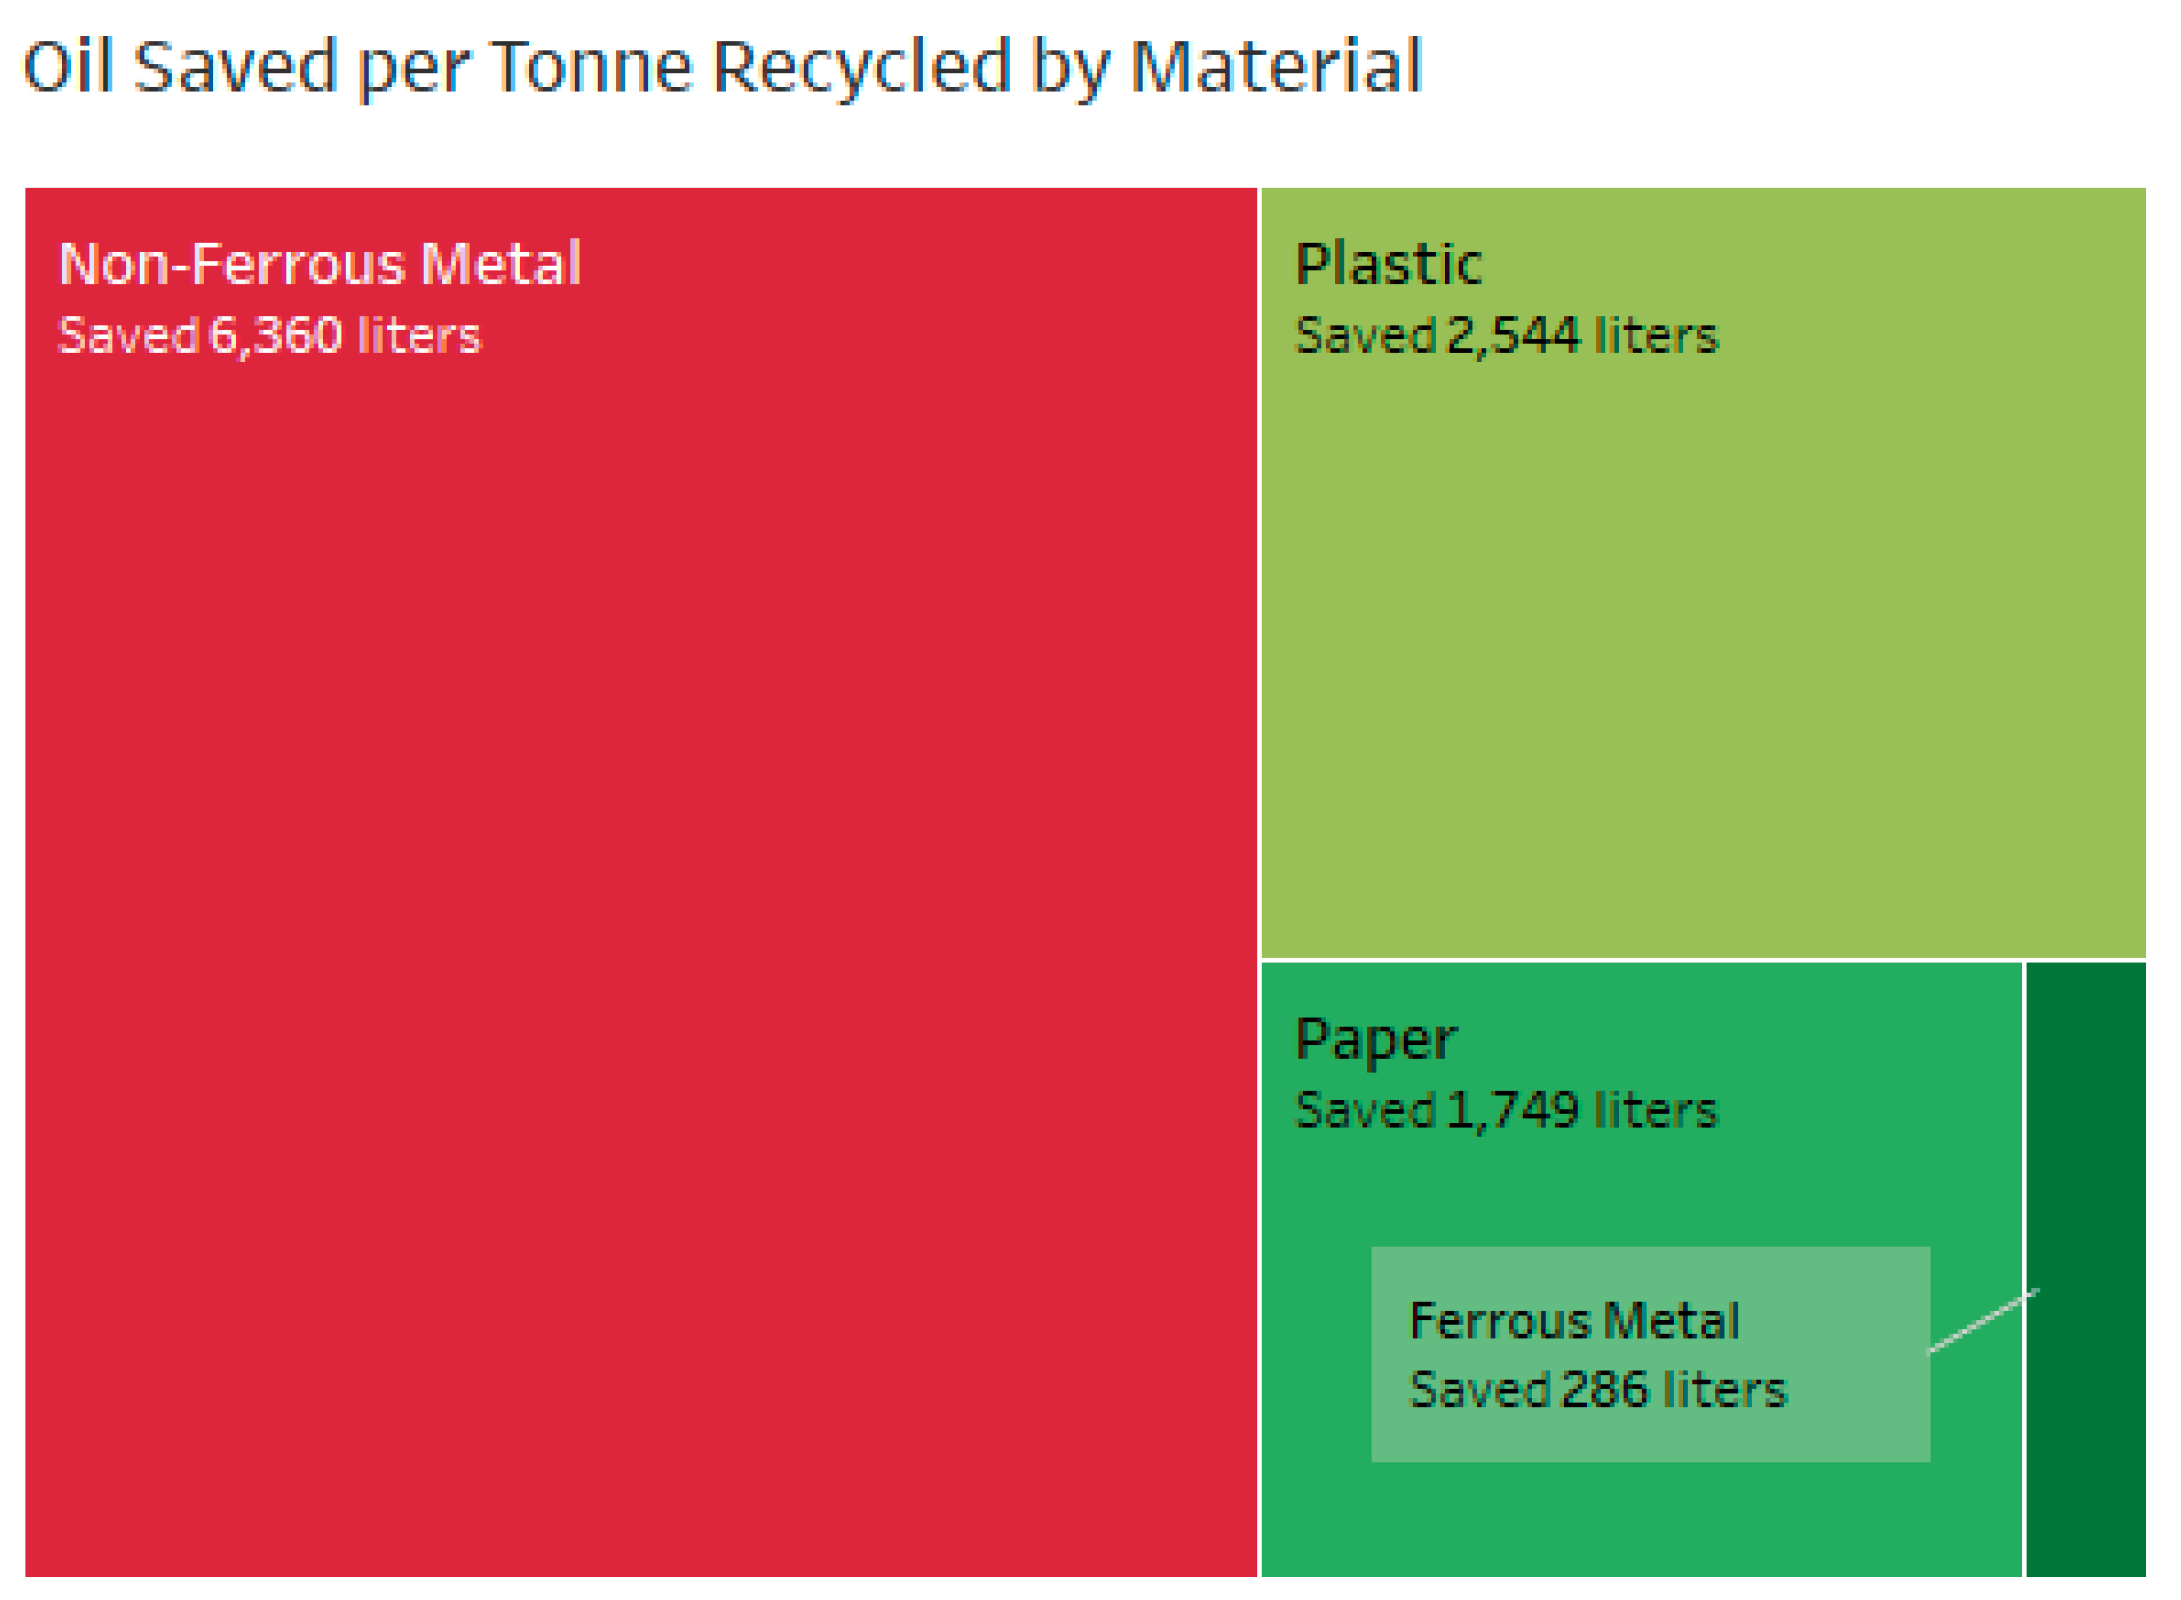
The second visual is a treemap chart which demonstrates the quantity of crude oil (in litres) conserved in recycling the top most Oil-conserving waste materials namely Non-Ferrous Metal, Plastic, Paper and Ferrous Metal. As is demonstrated above, Non-Ferrous metals saved the most crude oil in the years 2018-2020 at 6,360 liters followed by Plastic (2,544 litres) and Paper (at 1,749 litres). Ferrous Metal came in fourth position saving 286 litres (Awan, 2021). The key takeaway from this visualization is that there is a massive incentive in terms of crude oil and energy conservation to recycle Non-Ferrous Metal, Plastic and Paper. Government policymakers should utilize this incentive to promote recycling these materials as priority as it saves the country money on energy and oil imports.
Figure 21.
Oil Saved per Tonne Recycled by Material.
3.4.3. Glass Returns Lesser than Expected
The third and last visual is a horizontal bar chart which demonstrates the amount of energy (in kWh) conserved in recycling the top most Energy-conserving materials namely Non-Ferrous Metals (14,000 kWh), Plastic (5,800 kWh), Paper (4,100 kWh), Ferrous Metal (600 kWh), and Glass with less than 500 kWh (nearly 100 kWh). This demonstrates that Glass conserves very little energy when recycled in comparison to the other materials.
Figure 22.
Energy Saved per Tonne Recycled by Material.
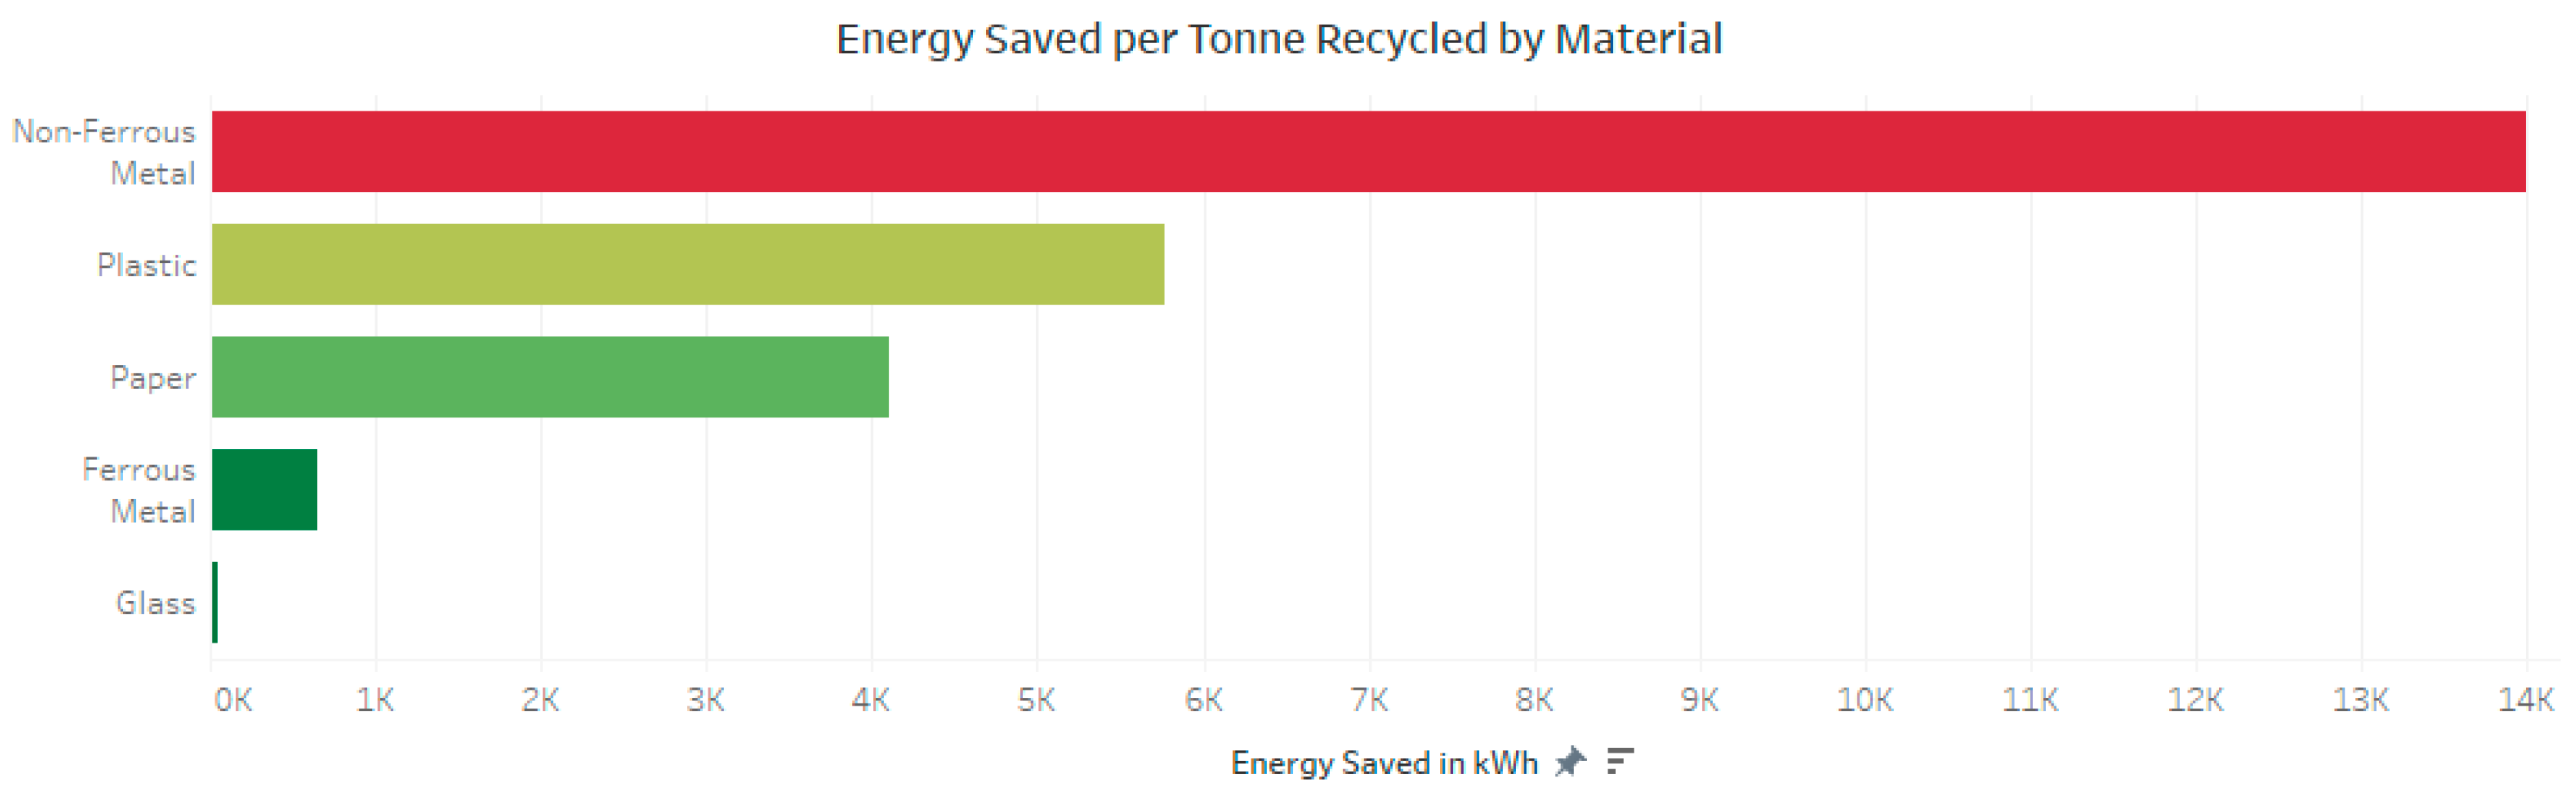
The key takeaway from this insight is that although recycling glass can be beneficial in terms of the fact that it reduce landfill space and therefore reduces pollution but it does not provide the incentive of conserving energy when recycled so the government should subsidize it’s recycling to ensure it does not get abandoned but at the same time should promote policies to support the recycling of Non-Ferrous Metals, Plastic, Paper, and Ferrous Metal as they conserve much more significant amount of energy when recycled.
3.4.4. The Way Forward: Suggested Policies
Considering the aforementioned results, food was the leading category of waste produced but also the least recycled so the government policymakers should come up with ways to reduce food waste as there is no incentive to recycle it in terms of crude oil and energy conserving (Singapore Department of Statistics, 2025).
Non-Ferrous Metals, Plastic, and Paper saved the most amount of crude oil with the top runner being Ferrous Metals (Awan, 2021). The government should implement policies to prioritise the recycling of these materials as they save the government a lot of money on oil imports and this saved money can be reinvested into other waste management initiatives.
Glass, to many people’s surprise, saves much less energy in kWh than expected (Awan, 2021). As a result, there is no incentive in terms of conserving crude oil and energy when it comes to recycling glass. However, the government can still subsidize glass recycling to reduce landfill space and protect the environment in the long run.
To conclude, the aforementioned policy measures can be implemented by the government policymakers to maximize the conservation of crude oil and energy via recycling waste while also saving financial and natural resources for the country which can be put for use on other initiatives in the future.
3.5. Success and Setbacks
The images of the Singaporean model of achieving zero waste narrate the story of a promising start that is being clouded by current stagnation and a growing divide in terms of involvement. Chronologically, the rate of recycling in the country has been on an upward trend since the year 2014, where the rate exceeded 60% until the year 2018, at which point it flatlined due to policy fatigue and the emerging impact of the COVID-19 pandemic. The second chart shows that overall waste generation increased almost twice by 2014, but it stopped at eight million tonnes, although it had started on a high note. The third graph reveals the household system disjuncture as individual recycling rates stand only at 12%-22%, whereas the national average is above 50%. In their combination, these images highlight the idea that although top-down programs may be efficient to achieve meaningful change, in the long term, the policy-realization gap will need to be bridged by including all households in the pathway of zero waste.
Figure 23.
Success and Setbacks Story Point.
3.5.1. First Wave in Recycling Expansion (2014 2018)
Recycling rates in Singapore have been gradually increasing since 2014, when the rates were about 58%, rising to above 62% in 2018, due to successful recycling initiatives like the National Recycling Programme and an increased number of collection infrastructures (NEA, 2022 ). Approximately in 2013, these critical drop phases of momentum are reflected by the green focus band on the Overall Recycling Rate line chart and the callout of “Recycling Momentum,” reflecting their close match with specific policy initiatives, investments, and enabling the activities of national public and private partners.
Figure 24.
Figure 24. Success and Setbacks Story Point.
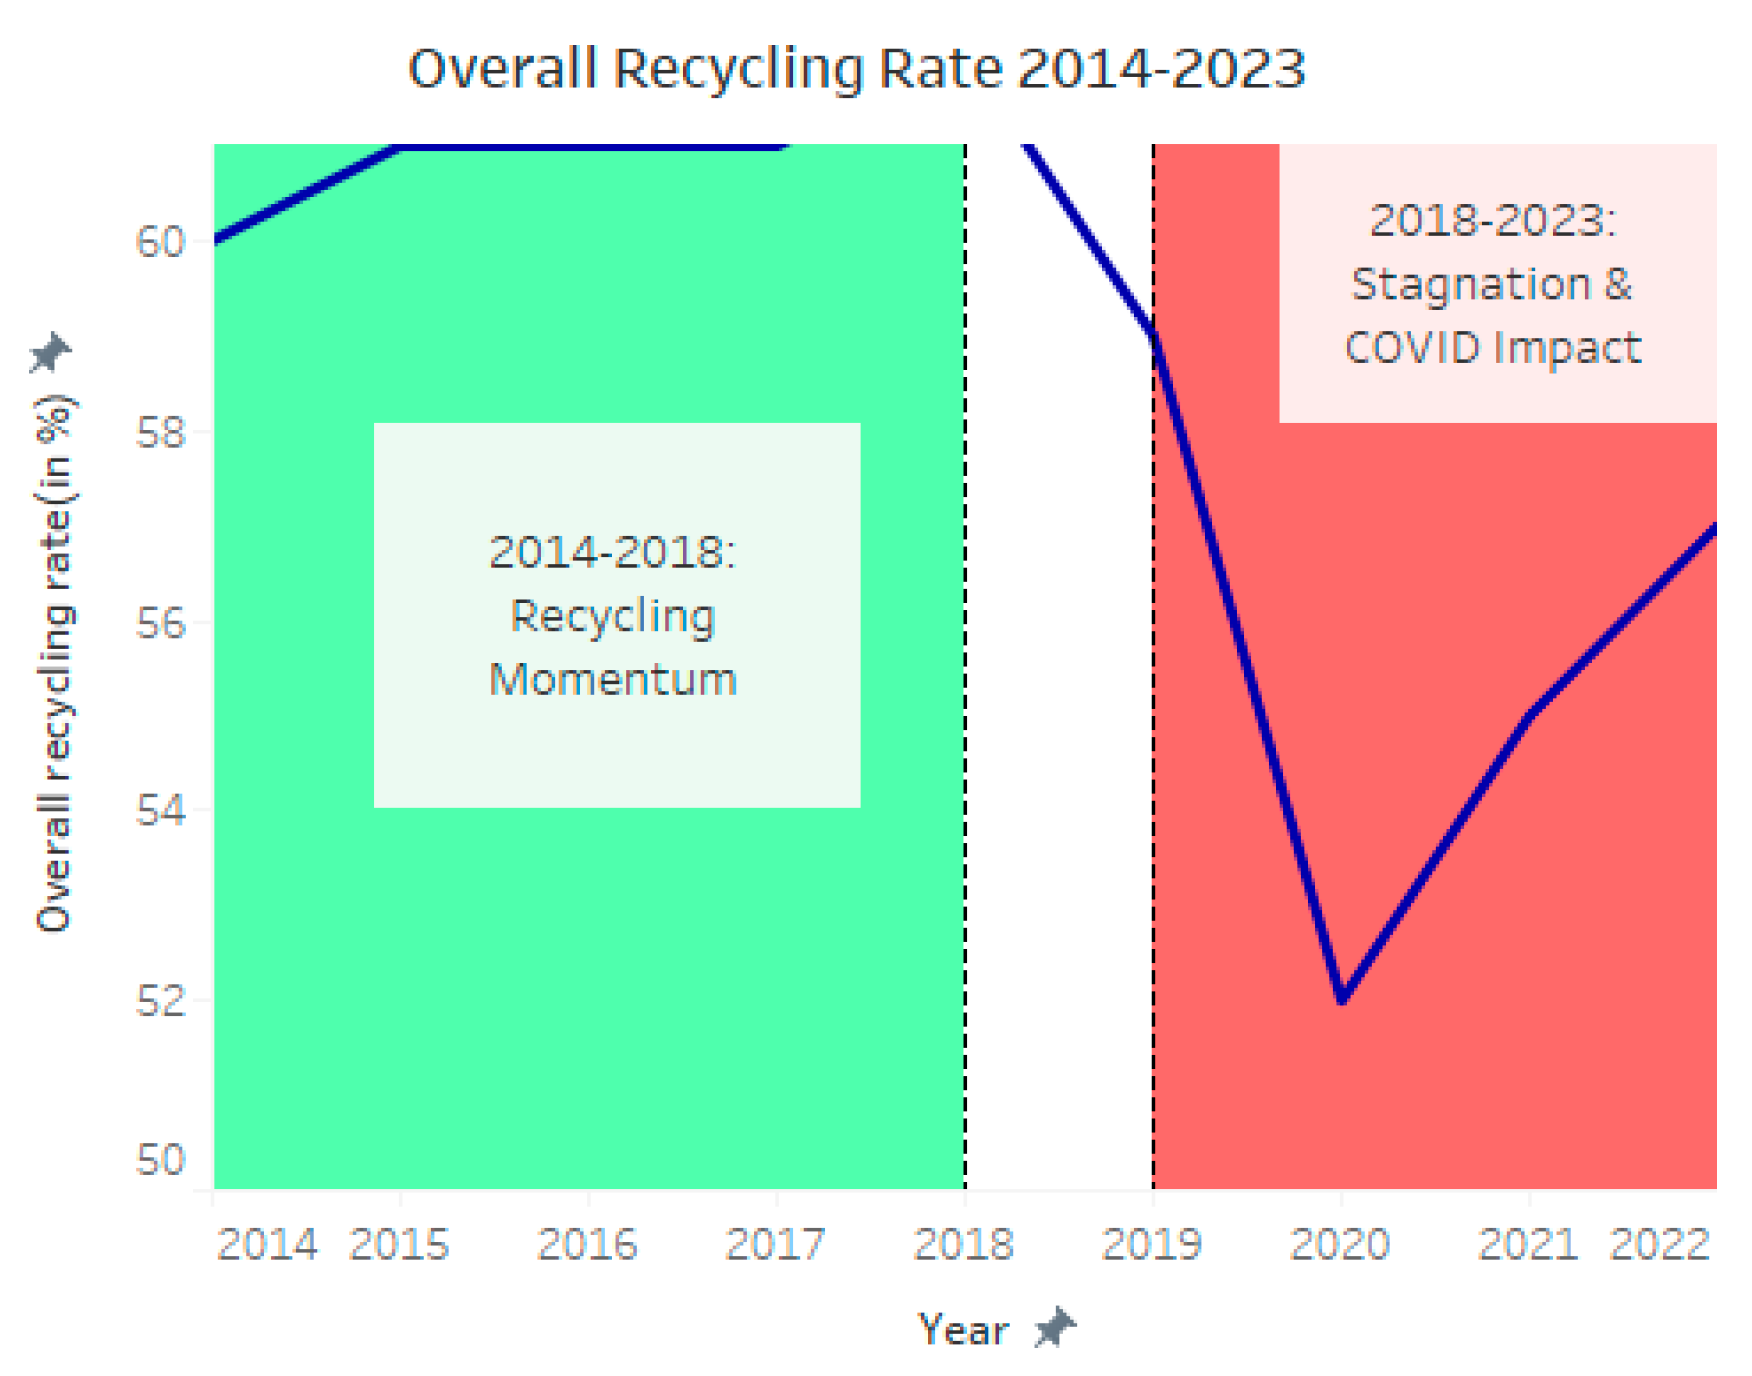
3.5.2. Pandemic and Stagnation (2018-2023)
The recycling trend stalled after 2018 and plummeted in 2020 before rebounding somewhat within the red band on the same graph, indicating the stagnation effect due to various factors, including lucrative importation levels and the COVID-19 impact. There is a similar trend in the Total Waste Trend line, as it reveals that after creating only 5.2 million tonnes in 2003, total waste generation began to skyrocket to almost 8 million tonnes by the year 2014 and now hovers around the eight million tonne mark without any obvious decrease (NEA, 2023). Despite the fact that COVID-19 restrictions had temporarily decreased the volume of waste, it returned immediately after the restart of economic activity, meaning that external shocks do not lead to lasting progress without the reintroduction of policy innovation (NEA, 2022).
Figure 25.
Total Waste Trend.

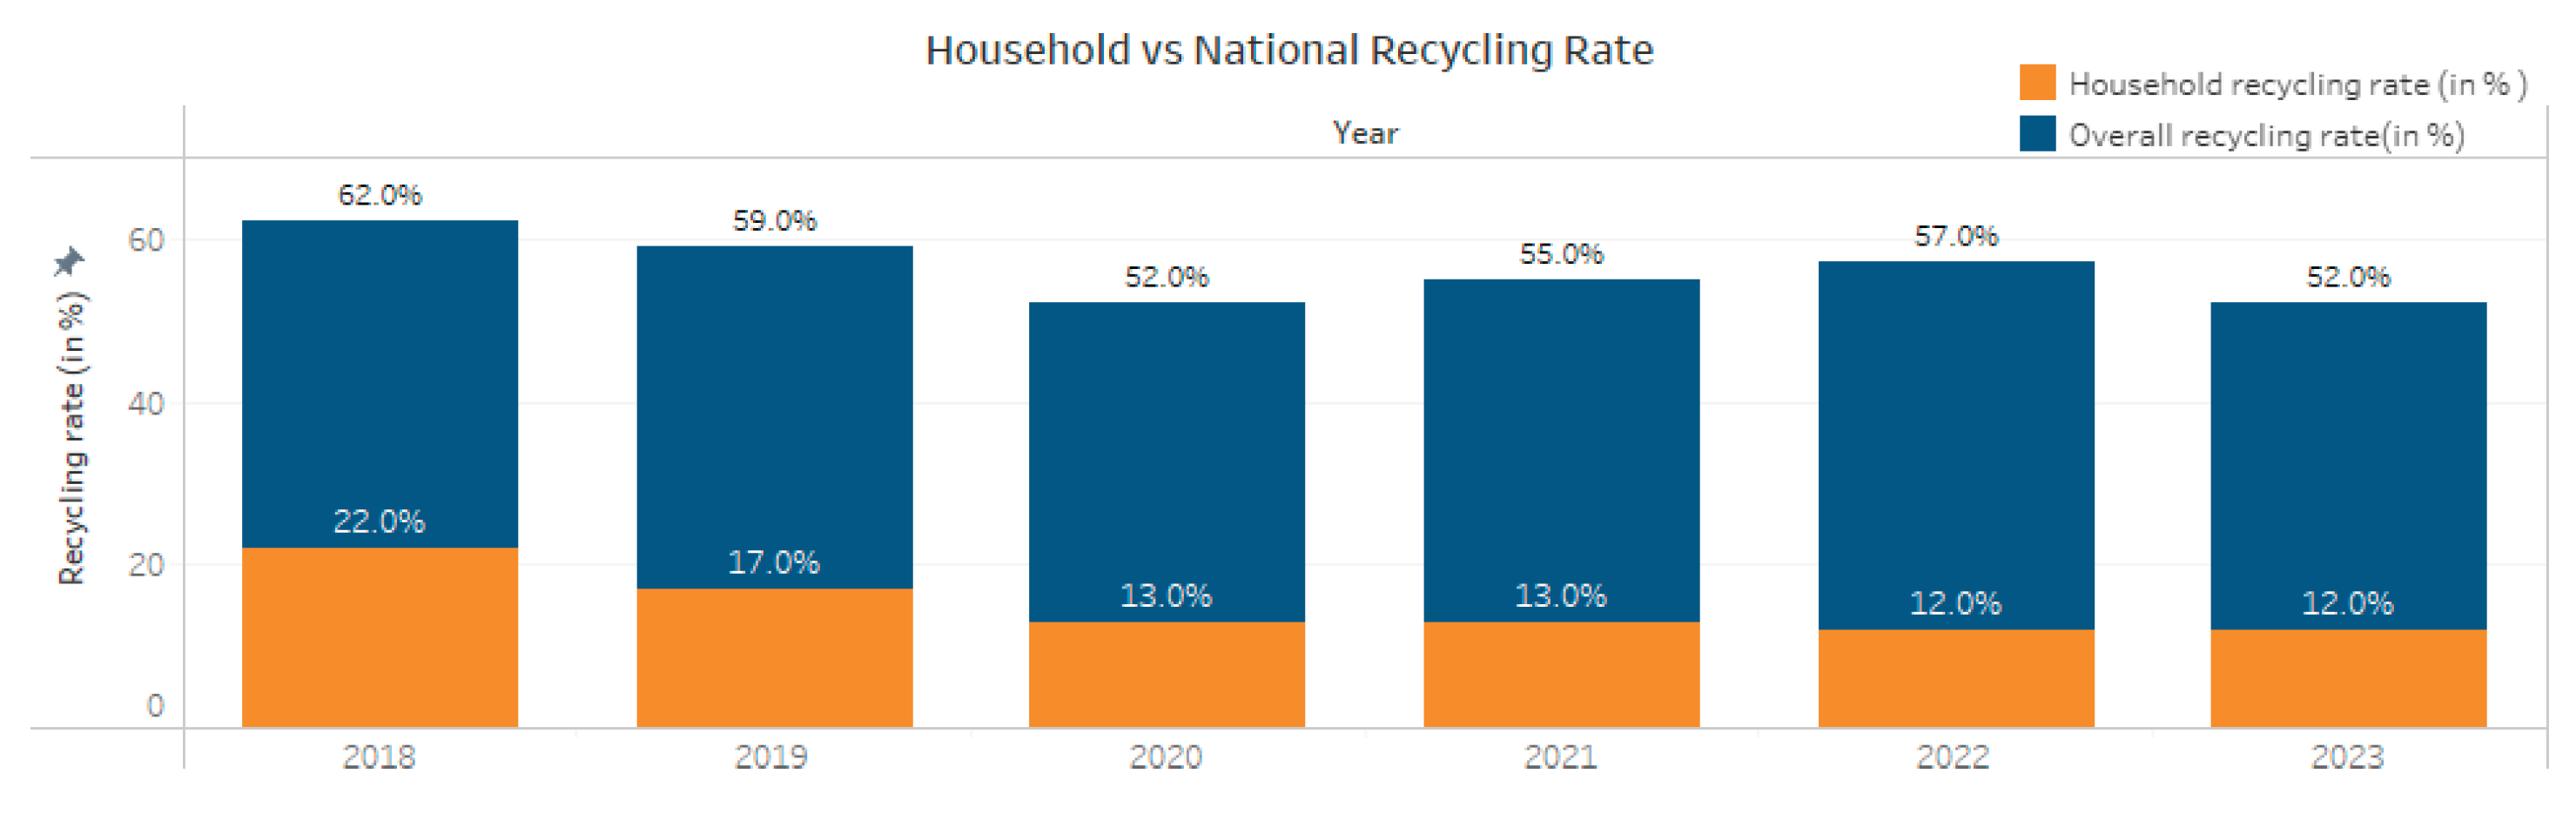
3.5.3. The Gap in Household Participation (2018-2023)
Household recycling rates were stuck at a relatively lower figure of between 12% and 22%, with the highest peak in 2018, and gradually declining since then displayed on the Household vs National Recycling Rate stacked bars, whereas the national ones were between 52% and 57%. The studies have been able to bear out the importance of convenience and subjective effort as the barriers to household engagement, even in a highly urbanized environment such as Singapore (Muniandy et al., 2021).
Figure 26.
Household vs National Recycling Rate.
3.5.4. Policy to Practice: A Way Forward
All three of these images narrate a story about initial success followed by stagnation and a gap between system performance and the action of individuals. In a bid to reach its target of a Zero Waste by 2035, Singapore should re-energize the wave of the mid-2010s by combining upstream, systemic policies, including obligatory food-waste segregation, extended producer responsibility, and focused, household-level programs. The identified behavioral barriers of the recent studies can be overcome by firmly increasing convenience by facilitating the large availability of food waste bins, real-time recycling feedback apps, and community reward systems (Muniandy et al., 2021). By matching the national policy with the daily practice, Singapore will only bridge the gap between the policy momentum and participation in households.
References
- Amazon, & OnePoll. (2024). 77% of Singapore shoppers would be open to receiving online orders without added delivery packaging. Opinions of consumers on what retailers should prioritize regarding packaging for online shopping purchases in Singapore as of April 2024. https://press.aboutamazon.com/sg/sustainability/2024/6/77-of-singapore-shoppers-would-be-open-to-receiving-online-orders-without-added-delivery-packaging#:~:text=While%2039%25%20of%20shoppers%20surveyed,sure%20that%20all%20packages%20are.
- Awan, A. A. Discover how much Singapore is saving energy per years by recycling. Singapore waste management. 2021. Available online: https://www.kaggle.com/datasets/kingabzpro/singapore-waste-management.
- Klynveld Peat Marwick Goerdeler, YouGov. Connected cities: citizen across Asia Pacific 2019 survey,. 36. Most needed changes to improve living environment according to respondents in Singapore as of November 2018. 2019. Available online: https://assets.kpmg.com/content/dam/kpmg/cn/pdf/en/2019/01/connected-citie s-citizen-insights-across-asia-pacific.pdf.
- Insight, Milieu. (2023). Leading factors to motivate Singaporeans to recycle more often as of May 2023. mili.eu.
- Momentum Works Pte. (2025, February 17). Gross merchandise value (GMV) of food delivery market in Southeast Asia from 2018 to 2024 (in billion U.S. dollars) [Graph]. Statista. https://www.statista.com/statistics/1299482/sea-food-delivery-market-gmv/.
- Muniandy, G.; Anuar, M. M.; Foster, B.; Saputra, J.; Johansyah, M. D.; Khoa, T. T.; Ahmed, Z. U. Determinants of Sustainable Waste Management Behavior of Malaysian Academics. Sustainability 2021, 13, 4424. [Google Scholar] [CrossRef]
- National Environment Agency. People’s actions to reduce food wastage in Singapore in 2019. 2019. www.nea.gov.sg.
- National Environment Agency. Total volume of plastic waste generated in Singapore from 2014 to 2023 (in 1,000 metric tons). nea.gov.sg. 2024. [Google Scholar]
- NEA. News. Nea.gov.sg. 2022. Available online: https://www.nea.gov.sg/media/news/news/index/overall-waste-generation-and-recycling-rates-increased-in-2021-as-economic-activity-picked-up?ref=inline- article.
- NEA. Waste statistics and overall recycling. Nea.gov.sg. 2023. Available online: https://www.nea.gov.sg/our-services/waste-management/waste-statistics-and- overall-recycling.
- Oversea-Chinese Banking Corporation Limited. The inaugural OCBC climate index. 19. Frequency of recycling household waste in Singapore as of June 2021 2021.
- Available online: https://://www.ocbc.com/iwov-resources/sg/ocbc/gbc/pdf/sustainability/climate-in dex/media-briefing.pdf.
- Singapore Department of Statistics. Volume of waste disposed in Singapore from 2014 to 2023, by source (in million metric tons) [Graph]. Statista. 15 June 2024. Available online: https://www.statista.com/statistics/628000/waste-disposed-in-singapore/.
- Singapore Department of Statistics. Waste Management And Overall Recycling Rates, Annual | SINGSTAT. Data.gov.sg. 2025.
- UN Comtrade. Volume of plastic waste imported from Germany into Singapore from 2010 to 2017 (in metric tons). comtrade.un.org 2019a. [Google Scholar]
- Comtrade, UN. Volume of plastic waste imported from the United States into Singapore from 2010 to 2017 (in metric tons) [Graph]. Statista. 24 January 2019b. Available online: https://www.statista.com/statistics/960812/volume-plastic-waste-imports-unite d-states-into-singapore/.
- Shah, I. A.; Jhanjhi, N. Z.; Amsaad, F.; Razaque, A. The role of cutting-edge technologies in industry 4.0. In Cyber Security Applications for Industry 4.0; Chapman and Hall/CRC, 2022; pp. 97–109. [Google Scholar]
- Humayun, M.; Almufareh, M. F.; Jhanjhi, N. Z. Autonomous traffic system for emergency vehicles. Electronics 2022, 11, 510. [Google Scholar] [CrossRef]
- Muzammal, S. M.; Murugesan, R. K.; Jhanjhi, N. Z.; Jung, L. T. SMTrust: Proposing trust-based secure routing protocol for RPL attacks for IoT applications. 2020 International Conference on Computational Intelligence (ICCI), 2020, October; IEEE; pp. 305–310. [Google Scholar]
- Humayun, M.; Jhanjhi, N. Z.; Niazi, M.; Amsaad, F.; Masood, I. Securing drug distribution systems from tampering using blockchain. Electronics 2022, 11, 1195. [Google Scholar] [CrossRef]
- Brohi, S. N.; Jhanjhi, N. Z.; Brohi, N. N.; Brohi, M. N. Key applications of state-of-the-art technologies to mitigate and eliminate COVID-19. Authorea Preprints 2023. [Google Scholar]
- Jhanjhi, N. Z.; Gaur, L.; Khan, N. A. Global Navigation Satellite Systems for Logistics: Cybersecurity Issues and Challenges. Cybersecurity in the Transportation Industry 2024, 49–67. [Google Scholar]
- Convergence of Industry 4.0 and supply chain sustainability; Khan, M. R., Khan, N. R., Jhanjhi, N. Z., Eds.; IGI Global, 2024. [Google Scholar]
- Ashraf, H.; Jhanjhi, N. Z.; Brohi, S. N.; Muzafar, S. A Comprehensive Exploration of DDoS Attacks and Cybersecurity Imperatives in the Digital Age. In Navigating Cyber Threats and Cybersecurity in the Logistics Industry; IGI Global Scientific Publishing, 2024; pp. 236–257. [Google Scholar]
- Manzoor, M. K.; Latif, R. M. A.; Haq, I.; Jhanjhi, N. Z. An energy-efficient routing protocol via angle-based flooding zone in underwater wireless sensor networks. International Journal of Intelligent Systems and Applications in Engineering 2022, 10, 116–123. [Google Scholar]
- Lim, M.; Abdullah, A.; Jhanjhi, N. Z. Performance optimization of criminal network hidden link prediction model with deep reinforcement learning. Journal of King Saud University-Computer and Information Sciences 2021, 33, 1202–1210. [Google Scholar] [CrossRef]
- Brohi, S.; Jhanjhi, N. Z.; Pillai, T. R. A Research Landscape of Agentic AI and Large Language Models: Applications, Challenges and Future Directions. Algorithms 2025, 18, 499. [Google Scholar] [CrossRef]
- Humayun, M.; Sujatha, R.; Almuayqil, S. N.; Jhanjhi, N. Z. A transfer learning approach with a convolutional neural network for the classification of lung carcinoma. Healthcare 2022, 10, 1058. [Google Scholar] [CrossRef] [PubMed]
- Zaman, D. N.; Memon, N. A. Pakistan lags behind in Technical Textiles. Journal of Management and Social Sciences 2007, 3, 120–127. [Google Scholar]
- Ashfaq, F.; Jhanjhi, N. Z.; Khan, N. A.; Muzafar, S.; Das, S. R. CrimeScene2Graph: Generating Scene Graphs from Crime Scene Descriptions Using BERT NER. International Conference on Computational Intelligence in Pattern Recognition, 2024, March; Springer Nature Singapore: Singapore; pp. 183–201. [Google Scholar]
- Faisal, A.; Jhanjhi, N. Z.; Ashraf, H.; Ray, S. K.; Ashfaq, F. A Comprehensive Review of Machine Learning Models: Principles, Applications, and Optimal Model Selection. Authorea Preprints 2025. [Google Scholar]
- Ashfaq, F.; Jhanjhi, N. Z.; Khan, N. A.; Javaid, D.; Masud, M.; Shorfuzzaman, M. Enhancing ECG Report Generation With Domain-Specific Tokenization for Improved Medical NLP Accuracy. IEEE Access 2025. [Google Scholar] [CrossRef]
Disclaimer/Publisher’s Note: The statements, opinions and data contained in all publications are solely those of the individual author(s) and contributor(s) and not of MDPI and/or the editor(s). MDPI and/or the editor(s) disclaim responsibility for any injury to people or property resulting from any ideas, methods, instructions or products referred to in the content. |
© 2025 by the authors. Licensee MDPI, Basel, Switzerland. This article is an open access article distributed under the terms and conditions of the Creative Commons Attribution (CC BY) license (http://creativecommons.org/licenses/by/4.0/).
Copyright: This open access article is published under a Creative Commons CC BY 4.0 license, which permit the free download, distribution, and reuse, provided that the author and preprint are cited in any reuse.


