
Submitted:
09 December 2025
Posted:
10 December 2025
You are already at the latest version
Abstract
Background: University students are often exposed to environments that encourage unhealthy eating, but universities can promote better health and sustainability by making sustainable food options more accessible. Methods: Temporal changes in dietary patterns and environmental footprints of 1684 students at the University of Rijeka, Croatia, over a 16-year period (2009-2025) were retrospectively analyzed using data from three cross-sectional studies. Results: A significant transition toward less sustainable diets, increased consumption of animal-based foods, and proinflammatory eating habits was observed (both p< 0.001). Adherence to the Mediterranean and Planetary Health Diet declined over time (p< 0.001), followed by increased prevalence of overweight and obesity. Consumption of most food groups increased, leading to higher water and ecological footprints. Only the intake of fruits, vegetables, whole grains, and fish declined, which corresponded with reduced carbon footprints for these and a few other food groups, while the environmental impact of other foods significantly increased (all p < 0.001). Gender, diet quality, and a proinflammatory diet were significant predictors of dietary environmental footprints. Conclusion: The findings underscore the need for systemic changes and addressing barriers at the university level to support sustainable eating behaviors. The study offers valuable insights for policymakers, educators, and researchers who aim to help students become health-conscious and environmentally responsible consumers. Further research is needed to explore the broader factors influencing dietary choices and the long-term impact of future institutional interventions.
Keywords:
dietary patterns
; environmental impact
; nutrition transition
; planetary health diet
; sustainable nutrition
; university students
1. Introduction
Diet-related health and disease outcomes are influenced by food systems, evolving dietary patterns, and their environmental impacts [1]. These patterns result from a complex interplay of economic, demographic, environmental, and cultural factors, affecting both food choices and broader lifestyles [2]. Dietary behavior is shaped by individual factors (preferences, knowledge, and skills), the micro-environment (family, workplace, school), and the macro-environment (social norms, food culture, economics, and policies) [3]. The nutrition transition, marked by the global shift from plant-based diets to ultra-processed, energy-dense foods, is driven by globalization, urbanization, incomes, and advances in food technology and marketing, contributing to the rise of noncommunicable diseases and obesity. However, strong policy and social action can mitigate these trends [4]. The EAT-Lancet Commission’s planetary-health diet addresses the dual challenges of noncommunicable diseases and environmental sustainability by promoting plant-based diets and reducing environmental impacts [5]. As humanity has surpassed six of nine planetary boundaries, particularly climate change, land-system change, and biodiversity loss, these issues now pose urgent threats, demanding systemic action [6]. Climate change and noncommunicable diseases are converging in a syndemic, requiring integrated action across health, environmental, and policy domains [7]. The urgent need for accepting the sustainable, health-conscious dietary patterns is underscored by the alarming trend of exceeding planetary boundaries [6], highlighting the important connection between public health and environmental preservation. Transitioning to sustainable dietary patterns is a great challenge [8,9,10]. Analyzing nutrition transition, environmental footprints, and stages of the epidemiologic transition offer valuable insights into how societies adapt to evolving health conditions, with shifting health and disease patterns responding to global changes [11]. Ensuring a sustainable nutritional transition within planetary boundaries is timely and crucial for promoting intergenerational health development and addressing climate and eco-environmental health risks, through strategies that minimize transgressions and integrate human health with environmental sustainability [12]. Sustainable healthy diets are those which promote health and wellbeing, minimize environmental impact, ensure accessibility and cultural acceptability, and aim to support optimal growth, prevent malnutrition and diet-related diseases, and preserve biodiversity and planetary health by integrating all sustainability dimensions [8]. Currently, in most EU countries, where the Farm to Fork strategy aims to transition to sustainable diets, current consumption patterns still exceed recommended intakes of calorie-dense foods and are low in fruits, vegetables, whole grains, legumes, and nuts [13].
University students are at an important life stage when long-term dietary habits are formed, yet they often adopt unhealthy eating behaviors due to specific shared environments, limited food options, and lifestyle constraints [14,15,16]. While they have a significant role in shaping the sustainability of their food systems, there is a need for raising awareness and making sustainable options more accessible and affordable among them. The intersection of environmental and dietary health among youth is now an important key area for intervention and future research [14,15,16], examining dietary patterns, environmental impacts, educational methods, behavioral barriers, and institutional interventions [17]. Universities are important in shaping future consumer behavior, making dietary sustainability a priority, with holistic approaches, such as combining sustainable food practices, nutrition education, and systemic changes, which are essential for fostering healthier eating habits [17]. Studies among Croatian university students consistently reported low dietary quality, with low intake of fruits, vegetables, and fish, frequent breakfast skipping, and limited nutrition knowledge, indicating prevalent unhealthy eating behaviors [18,19,20,21,22,23,24]. A strong positive correlation between nutrition knowledge and healthy dietary intake was previously observed [20]; however, recent findings suggest a weakening of this association. Despite students’ moderate awareness of the Mediterranean diet benefits, adherence no longer aligns with knowledge levels [24]. This growing gap between awareness and habits highlights how factors such as food accessibility, affordability, taste preferences, and lifestyle pressures often outweigh knowledge in shaping behavior [15]. Abreu et al. likewise found high nutrition literacy of university students but low Mediterranean diet adherence, emphasizing that knowledge alone rarely motivates behavioral change [25]. Similar trends are observed internationally. Increased nutrition literacy does not consistently change into adherence to sustainable diets such as the Mediterranean or Planetary Health Diets. A broader nutrition transition in Europe has become more evident, as evidenced by growing adoption of Westernized, convenience-based eating patterns influenced by globalization and modern lifestyles [26], where significant improvements in diet quality and sustainability are essential to achieve the desired health and environmental goals across Europe. Among Croatian students, the weakened nutrition knowledge–diet relationship [24] probably reflects environmental and social influences, such as wide use of fast food, time constraints, psychological stress, and limited access to healthy, affordable campus options. Behavioral determinants such as affordability, convenience, self-regulation, ethics, and social norms remain key modifiable factors [17]. Food environments, time pressures, and social influences that students are exposed, moderate how nutritional knowledge changes into dietary habits, underscoring the need for interventions that go beyond education to foster more sustainable behavior.
According to the above, this study aims to retrospectively analyze changes in dietary patterns and the nutritional sustainability of students of the University of Rijeka, Croatia, to enhance understanding of observed nutrition transition, and to assess the relationships between dietary choices, health-related aspects, and environmental outcomes. Furthermore, it aims to explore the association between dietary sustainability and students’ socio-demographic characteristics, based on available data. The findings could provide valuable insights into long-term changes in university students’ dietary behaviors and their implications for both human health and environmental sustainability. This research may serve as an evidence base for developing university-level and public health strategies to adopt sustainable and healthy dietary habits among young adults.
2. Materials and Methods
Study Design
This study used a retrospective, integrative analysis of three cross-sectional studies [20,21,23] investigating dietary habits and nutrition-related aspects among students of the University of Rijeka, Croatia. The selected studies collectively span a sixteen-year period (2009–2025), providing insight into temporal changes in dietary patterns and nutritional sustainability within this population. The retrospective design allows for comparative synthesis of existing quantitative findings to identify evolving trends, determinants, and sustainability dimensions of student dietary behaviors. As this study analyzed previously published, anonymized data, no additional ethical approval was required. Since this study utilized previously published, anonymized data, no additional ethical approval was necessary. In each of the original studies, participants were fully informed of the study objectives and procedures and provided written informed consent prior to enrollment. Furthermore, all studies adhered to the principles outlined in the Declaration of Helsinki, and their protocols received approval from the relevant ethical authorities.
Data Analyses
Quantitative and qualitative data were extracted from each database [20,21,23], including students’ characteristics (gender, age, level of study, lifestyle habits, anthropometric variables) and dietary variables. Survey methods of each study are described elsewhere [20,21,23]. Since the authors of this retrospective study were also the authors of selected studies [20,21,23], it was not necessary to obtain author approval for data analyses. A descriptive and comparative analysis was conducted to identify nutrition transition trends across time, dietary quality, and environmental footprints, and to evaluate changes in adherence to healthy and sustainable dietary models, along with the associations with socio-demographic characteristics.
Dietary Assessment
All studies used a semi-quantitative Food Frequency Questionnaire (FFQ) to assess habitual dietary intake among university students. Krešić et al. [20] used a FFQ comprising 97 food items, in which students reported their usual frequency of consumption and average portion sizes over the preceding twelve months. Pavičić Žeželj et al. [21] applied a 50-item FFQ, asking students to note their habitual consumption frequency and average portion sizes of the listed foods during the previous week. Similarly, Kenđel Jovanović et al. [23] used a 98-item FFQ referring to food frequency intake and average servings over the past week. All studies calculated dietary energy and nutrient intakes using the Croatian food composition database [27]. From the generated databases that collected data from the FFQs of each study [20,21,23], individual food, energy, and nutrient intakes were further analyzed.
Dietary Indices
To evaluate students' dietary patterns based on their nutritional quality, health, and sustainability potential, and environmental impact, dietary indices that address both health and sustainability, such as the Mediterranean Diet Score, Planetary Health Diet Index, and Dietary Inflammatory Index, were used.
The Mediterranean diet was chosen as an indicator of diet quality due to its well-established health benefits and recognition as a sustainable dietary pattern [28,29]. Adherence was assessed using the nine-component Mediterranean Diet Score (MDS), which assigns points based on higher intake of healthy foods (e.g., vegetables, fruits, legumes, fish, and unsaturated fats) and lower intake of meat and alcohol, yielding a total score from 0 to 9 classified as low (≤3), moderate (4,5) or high (≥6) adherence.
Adherence to a sustainable diet was evaluated using the Planetary Health Diet Index (PHDI), developed by Cacau et al. [30]. The PHDI comprises 16 components, each scored between 5 and 10 points for a total of 0 to 150, including major food groups and specific vegetable ratios to reflect alignment with a diet that supports both human and planetary health. Based on the total PHDI score of each study database, they are further classified into PHDI quartiles.
The Dietary Inflammatory Index (DII) was used to assess the overall health-related inflammatory potential of students’ diets [31]. DII scores were calculated using 36 [20] and 42 [21,23] dietary components, depending on the available data from the FFQ, and following the standardized Shivappa et al. [32] protocol. The total DII scores were classified as anti-inflammatory (DII ≤ 0) or pro-inflammatory (DII > 0). The Danish [33] and American [34] food composition databases were used for certain nutrients needed for the DII calculation.
Environmental Impact Indicators
To assess the environmental impact of students’ diets [20,21,23], data from two publicly available life cycle assessment (LCA) databases were used. These databases offer standardized and comprehensive environmental impact estimates across a wide range of food items and include multiple environmental indicators [35,36]. Environmental impact values from both sources were integrated and linked to the quantities of individual foods, composite dishes, and beverages reported by each student's FFQ data to estimate diet-related environmental burdens. The primary indicators evaluated were carbon footprint (kg CO₂ equivalents), ecological footprint (m²·year), and water footprint (m³).
Statistical Analysis
Statistical analyses were made using TIBCO Statistica, v. 13.3.0 (TIBCO Software Inc., Palo Alto, CA, USA; 2017). The Kolmogorov-Smirnov test was used to validate the variables' normality. Comparisons of categorical variables were conducted using the Chi-square test. Continuous variables were analyzed using the Student’s t-test or Mann–Whitney U test for comparisons between two groups, and by analysis of variance (ANOVA) or the Kruskal–Wallis H test for comparisons involving more than two groups, as appropriate. Multiple linear regression was used to assess the association between sociodemographic and lifestyle factors (age, gender, nutrition status, physical activity level, study level, and smoking status) and different types of environmental footprints (carbon, water, and land use footprints). Each type of footprint was analyzed as the dependent variable in a separate model, with all other variables serving as independent predictors. This approach enabled control for potential confounders (i.e. age (≤ 21 years vs. > 22 years), gender (male vs. female), level of study (undergraduate vs. graduate), nutrition status (underweight, normal weight, overweight, obesity), physical activity level (low, moderate, vigorous), smoking status (yes vs. no), PHDI quartiles (1st, 2nd, 3rd, 4th quartile), MDS adherence (low, moderate, high), DII potential (proinflammatory vs. anti-inflammatory), and enabled the evaluation of the single influence of each predictor on the different types of environmental footprints. All statistical tests were two-sided, with a p-value of less than 0.05 considered statistically significant.
3. Results
Socio-Demographic, Lifestyle, and Dietary Factors
Table 1 shows the demographic, lifestyle, and selected dietary characteristics of 1684 University of Rijeka students across three studies [20,21,23]. Women predominated in earlier studies (both 74 % in 2009 and 2018), while significantly less in 2025 (46 %, p < 0.001). Although on average, students were of similar age and almost equally distributed across age groups (≤ 21 years: 45 % vs. > 22 years: 55 %), there were significantly more older students in the 2009 and 2025 studies than in the 2018 study (p < 0.001). While the total sample and the 2025 study had the same proportion of undergraduate and graduate students, the 2009 study had more graduate students (62%), and the 2018 study had more undergraduate students (75%) (p < 0.001). The BMI increased over time (22.08 kg/m2 in 2009, 22.43 kg/m2 in 2018 and 24.11 kg/m2 in 2025, p < 0.001), with significant increase in the prevalence of overweight and obesity in the 2025 study (overweight 13 % in 2009 to 28% in 2025, obesity 1 % in 2009 to 7 % in 2025, p < 0.001). However, there was an increase in the prevalence of high-intensity physical activity (55 % normal and high physical activity in 2009, 80% in 2025, p < 0.001), while smoking habits decreased (34 % in 2009, 25 % in 2025, p < 0.001). High adherence to the Mediterranean Diet and Planetary Health Diet significantly declined over time (MDS 49 % in 2009, 7 % in 2018, and 15 % in 2025, p < 0.001; PHDI 34 % in 2009, 36 % in 2018, and 30 % in 2025, p < 0.001). Accordingly, students’ diet became over time significantly more proinflammatory (DII > 0 46 % in 2009, 91 % in 2018, and 62 % in 2025, p < 0.001). Similarly, the diet’s environmental impact regarding water and land use showed a significant upward trend, with highest in the 2025 study (all p < 0.001), although the highest carbon footprint had average diets in the 2009 study (p < 0.001). Average dietary energy intake was significantly lower in the 2018 study than others (p < 0.001). That study noted the highest intake of animal protein, a higher saturated fat ratio, and the lowest calcium, iron, and folate intake than in other studies (all p < 0.001), except for vitamin D intake, which was the lowest in the 2025 study. The 2009 study showed the most favorable nutrient intakes (dietary fiber, calcium, iron, more plant-based protein; healthier fat ratio, all p < 0.001) than other studies, while the 2025 study showed the highest average intake of cholesterol and folate (all p < 0.001) than other studies.
The energy share of macronutrients in the 2009 study was more favorable for protein, total fats, and carbohydrates than in later studies (all p < 0.001) (Figure 1). From 2009 to 2018, the shares of carbohydrates, PUFA, and alcohol in energy decreased, while the shares of total fat, SFA, MUFA, and protein increased (all p < 0.001). In the 2025 study, students' average diet had a significantly increased energy share of fats, especially of the MUFA and PUFA (all p < 0.001), while of carbohydrates decreased (p < 0.001). Protein energy share significantly decreased from 2018 to 2025 (p < 0.001), while alcohol energy share returned to those values noted in 2009.
Food Group Intake and Environmental Impact Changes
Table 2 presents dietary changes in food group intake across the three study periods and associated environmental impact. Over the 2009–2025 period, consumption increased for most of the 14 food groups, likewise associated increase in their environmental footprints. Declining intake was only in fruits, vegetables, whole grains, and fish (all p < 0.001), whereas legume and egg intake increased (both p < 0.001). Fish (p < 0.001) and animal fats (p = 0.002) intake remained relatively similar. Tubers and potatoes (p < 0.001), and milk and dairy (p = 0.002) intake decreased from 2009 to 2018 but increased significantly in 2025, while vegetable oils intake increased constantly (p < 0.001), and animal fat (p = 0.002) intake remained similar. Over sixteen years, carbon footprint significantly decreased for legumes, fruits, vegetables, tubers and potatoes, eggs, red meat, fish, animal fats, and added sugars (all p < 0.001), and increased for nuts and peanuts, whole grains, poultry, milk and dairy, and vegetable oils (all p < 0.001). Water footprint significantly increased for almost all foods, for nuts and peanuts, fruits, legumes, vegetables, tubers and potatoes, whole grain, eggs, red meat, poultry, milk and dairy, vegetable oils, animal fats, and added sugars (all p < 0.001), and remained the same for fish (p < 0.001). The ecological footprint significantly decreased for fruits, vegetables, legumes, whole grains, and fish (all p< 0.001), increased for nuts, legumes, tubers and potatoes, milk and dairy, vegetable oils, red meat, poultry, and added sugars (all p < 0.001), and remained stable for the animal fats (p < 0.001).
The Association Between Environmental Sustainability and Students’ Characteristics and Lifestyle
The association between dietary carbon footprint and students’ characteristics is presented in Table 3. Gender was a significant predictor of students' dietary carbon footprint, where women had a significantly lower footprint than men, with increasing effect size over time (2009 β = –462.65, p = 0.007; 2018 β = –987.98, p < 0.001; 2025 β = –1778.82, p < 0.001) (Table 3). Age, nutritional status, physical activity and smoking habits, and level of study showed no significant associations with dietary carbon footprint (all p > 0.05). The PHDI index was significantly and positively associated with carbon footprint in the 2018 study (β = 193.39, p = 0.034) but negatively in the 2025 study (β = –568.02, p = 0.012), showing diet-specific differences associated with students’ characteristics and their change over time. The MDS had a significant positive impact only in the 2009 study (β = 444.31, p = 0.001), with insignificant effects in other studies. A more proinflammatory diet was a significant predictor for higher carbon footprint, with a significant increasing time-related trend (2009 β = 1906.08, p < 0.001; 2018 β = 2106.11, p < 0.001; 2025 β = 3271.46, p < 0.001). Women’s average diet had significantly lower water footprints, with the largest gender difference in 2025 (β = -1302.98, p = 0.001) (Table 4). In studies from 2009 and 2025, higher PHDI scores were significantly associated with lower water footprints (β = –132.05; p < 0.001; β = –427.29; p = 0.011, respectively), whereas the MDS showed a significant positive association only in the 2009 study (β = 148.85; p = 0.001). A more proinflammatory diet was associated with higher water footprints, with effect sizes significantly increasing over time (2009 β = 525.94, p < 0.001; 2018 β = 1206.90, p < 0.001; 2025 β = 2564.66, p < 0.001). Age, nutrition status, physical activity habits, and study level showed no significant associations with dietary water footprint (all p < 0.001). Land use also showed a time-related trend, with gender and the DII as significant predictors of students’ ecological footprints (Table 5). Women's average diet had a significantly increasing association over time (2009 β = –0.66, p < 0.001; 2018 β = –2.16, p < 0.001; 2025 β = –3.39, p < 0.001). Nutritional status was a significant predictor only in the 2009 study, where it was negatively associated (β = –0.33; p = 0.027), while it showed a positive, but insignificant association over time (2018 β =0.50, p = 0.179; 2025 β = 0.08, p = 0.885). Higher diet quality assessed with PHDI was significantly associated with lower land use in the 2009 (β = –0.29; p < 0.001) and 2025 (β = –0.87; p = 0.018) studies. Mediterranean diet adherence was significantly positively associated with land use only in the 2009 study (β = 0.53; p < 0.001). A more proinflammatory diet was the strongest predictor for significant and positive association with land use, with effect sizes significantly increasing over time (β ranging from 1.72 in 2009 to 7.36 in 2025; all p < 0.001, respectively).

Table 2.
Dietary patterns and related environmental impact indicators in University of Rijeka students (n=1684).
Table 2.
Dietary patterns and related environmental impact indicators in University of Rijeka students (n=1684).
| All | Krešić et al., 2009 |
Pavičić Žeželj et al., 2018 |
Kenđel Jovanović et al., 2025 |
p-value* | |||||
| mean | SD | mean | SD | mean | SD | mean | SD | ||
| Nuts and peanuts (g/day) | 4.90 | 12.72 | 3.25 | 5.12 | 2.32 | 2.81 | 22.23 | 27.21 | <0.001 |
| Carbon footprint (g CO2 eqv.) | 5.84 | 13.49 | 3.24 | 5.10 | 2.76 | 3.09 | 23.77 | 29.39 | <0.001 |
| Water footprint (m3) | 35.86 | 90.55 | 23.36 | 36.76 | 22.98 | 2.76 | 158.72 | 194.17 | <0.001 |
| Ecological footprint (m2*year) | 0.04 | 0.11 | 0.02 | 0.04 | 3.33 | 2.98 | 0.20 | 0.25 | <0.001 |
| Legumes (g/day) | 32.35 | 43.06 | 18.21 | 18.92 | 53.41 | 59.95 | 53.02 | 53.19 | <0.001 |
| Carbon footprint (g CO2 eqv.) | 12.93 | 16.08 | 14.23 | 18.27 | 11.06 | 12.35 | 10.92 | 10.96 | <0.001 |
| Water footprint (m3) | 5.84 | 9.67 | 1.76 | 2.07 | 5.93 | 7.32 | 5.78 | 6.82 | <0.001 |
| Ecological footprint (m2*year) | 0.02 | 0.03 | 0.01 | 0.02 | 0.03 | 0.04 | 0.03 | 0.03 | <0.001 |
| Fruits (g/day) | 276.67 | 222.32 | 369.40 | 224.04 | 122.75 | 110.22 | 173.29 | 156.38 | <0.001 |
| Carbon footprint (g CO2 eqv.) | 412.49 | 451.75 | 650.94 | 446.10 | 53.39 | 46.66 | 72.06 | 63.55 | <0.001 |
| Water footprint (m3) | 61.63 | 66.98 | 39.58 | 35.08 | 84.71 | 75.99 | 113.63 | 102.80 | <0.001 |
| Ecological footprint (m2*year) | 0.14 | 0.12 | 0.19 | 0.12 | 0.06 | 0.05 | 0.08 | 0.07 | <0.001 |
| Vegetables (g/day) | 228.67 | 165.33 | 278.68 | 174.64 | 125.14 | 94.23 | 214.60 | 132.54 | <0.001 |
| Carbon footprint (g CO2 eqv.) | 289.24 | 238.82 | 388.23 | 245.30 | 113.70 | 94.32 | 201.69 | 163.35 | <0.001 |
| Water footprint (m3) | 49.71 | 29.86 | 53.49 | 27.84 | 36.77 | 28.19 | 59.08 | 33.56 | <0.001 |
| Ecological footprint (m2*year) | 0.26 | 0.24 | 0.32 | 0.27 | 0.15 | 0.14 | 0.18 | 0.11 | <0.001 |
| Whole grains (g/day) | 27.21 | 33.20 | 32.35 | 37.29 | 15.04 | 22.95 | 28.86 | 23.71 | <0.001 |
| Carbon footprint (g CO2 eqv.) | 58.59 | 59.17 | 51.66 | 55.34 | 65.54 | 61.53 | 75.57 | 65.77 | <0.001 |
| Water footprint (m3) | 51.73 | 52.17 | 46.02 | 50.46 | 57.27 | 51.99 | 66.09 | 56.18 | <0.001 |
| Ecological footprint (m2*year) | 0.07 | 0.08 | 0.08 | 0.10 | 0.06 | 0.06 | 0.07 | 0.06 | 0.003 |
| Eggs (g/day) | 22.61 | 27.32 | 15.42 | 18.14 | 29.84 | 32.34 | 40.18 | 37.08 | <0.001 |
| Carbon footprint (g CO2 eqv.) | 83.07 | 100.50 | 56.71 | 66.71 | 109.42 | 119.03 | 147.78 | 136.37 | <0.001 |
| Water footprint (m3) | 94.28 | 114.07 | 64.36 | 75.71 | 124.19 | 135.10 | 167.73 | 154.79 | <0.001 |
| Ecological footprint (m2*year) | 0.14 | 0.18 | 0.10 | 0.12 | 0.19 | 0.21 | 0.26 | 0.24 | <0.001 |
| Fish (g/day) | 47.07 | 43.02 | 49.88 | 40.94 | 40.75 | 45.82 | 47.34 | 45.05 | 0.001 |
| Carbon footprint (g CO2 eqv.) | 228.49 | 278.41 | 346.37 | 305.38 | 45.58 | 51.63 | 71.19 | 63.00 | <0.001 |
| Water footprint (m3) | 0.00 | 0.00 | 0.00 | 0.00 | 0.00 | 0.00 | 0.00 | 0.00 | <0.001 |
| Ecological footprint (m2*year) | 0.01 | 0.01 | 0.01 | 0.01 | 0.00 | 0.00 | 0.00 | 0.00 | <0.001 |
| Tubers and potatoes (g/day) | 107.74 | 79.97 | 104.14 | 64.98 | 95.52 | 83.13 | 148.75 | 114.59 | <0.001 |
| Carbon footprint (g CO2 eqv.) | 47.69 | 37.20 | 57.93 | 38.72 | 25.93 | 22.56 | 45.93 | 34.84 | <0.001 |
| Water footprint (m3) | 57.91 | 47.73 | 48.51 | 31.44 | 59.96 | 52.17 | 95.92 | 73.07 | <0.001 |
| Ecological footprint (m2*year) | 0.05 | 0.04 | 0.05 | 0.03 | 0.04 | 0.04 | 0.06 | 0.05 | <0.001 |
| Milk and dairy (g/day) | 390.25 | 224.13 | 404.55 | 222.66 | 358.90 | 188.87 | 389.78 | 283.52 | 0.002 |
| Carbon footprint (g CO2 eqv.) | 808.52 | 499.94 | 844.45 | 409.66 | 689.08 | 382.10 | 889.92 | 889.88 | <0.001 |
| Water footprint (m3) | 544.67 | 347.46 | 542.28 | 298.42 | 498.47 | 271.11 | 649.20 | 587.54 | <0.001 |
| Ecological footprint (m2*year) | 0.75 | 0.56 | 0.74 | 0.39 | 0.65 | 0.39 | 0.96 | 1.12 | <0.001 |
| Vegetable oils (g/day) | 20.33 | 18.80 | 12.65 | 6.57 | 26.83 | 23.51 | 41.57 | 23.31 | <0.001 |
| Carbon footprint (g CO2 eqv.) | 15.50 | 12.51 | 15.58 | 9.91 | 10.13 | 8.93 | 26.05 | 20.17 | <0.001 |
| Water footprint (m3) | 74.33 | 71.31 | 90.41 | 49.38 | 42.37 | 1.97 | 148.29 | 100.81 | <0.001 |
| Ecological footprint (m2*year) | 0.13 | 0.11 | 0.16 | 0.07 | 0.01 | 0.01 | 0.25 | 0.14 | <0.001 |
| Red meat and products (g/day) | 95.69 | 87.45 | 95.99 | 61.40 | 64.26 | 79.77 | 158.19 | 147.83 | <0.001 |
| Carbon footprint (g CO2 eqv.) | 2574.74 | 1874.21 | 2736.51 | 1772.55 | 2243.22 | 1912.85 | 2522.32 | 2137.84 | <0.001 |
| Water footprint (m3) | 867.16 | 878.09 | 637.85 | 395.24 | 908.74 | 858.13 | 1811.52 | 1574.89 | <0.001 |
| Ecological footprint (m2*year) | 3.70 | 3.10 | 3.15 | 1.69 | 3.63 | 3.33 | 6.34 | 5.37 | <0.001 |
| Poultry and substitutes (g/day) | 62.54 | 53.04 | 71.03 | 51.33 | 31.79 | 37.29 | 86.88 | 60.77 | <0.001 |
| Carbon footprint (g CO2 eqv.) | 360.56 | 326.43 | 295.75 | 205.00 | 319.93 | 217.67 | 733.91 | 596.85 | <0.001 |
| Water footprint (m3) | 267.05 | 272.11 | 157.41 | 118.11 | 344.57 | 234.44 | 601.49 | 453.11 | <0.001 |
| Ecological footprint (m2*year) | 1.02 | 1.00 | 0.65 | 0.47 | 1.24 | 0.85 | 2.23 | 1.70 | <0.001 |
| Animal fats (g/day) | 11.65 | 5.58 | 11.43 | 4.13 | 11.55 | 6.10 | 12.86 | 8.98 | 0.002 |
| Carbon footprint (g CO2 eqv.) | 2.06 | 2.74 | 2.38 | 3.11 | 1.53 | 1.30 | 1.67 | 2.86 | <0.001 |
| Water footprint (m3) | 1.45 | 2.14 | 1.86 | 2.43 | 0.62 | 0.58 | 1.30 | 2.23 | <0.001 |
| Ecological footprint (m2*year) | 0.01 | 0.01 | 0.01 | 0.01 | 0.00 | 0.00 | 0.01 | 0.01 | <0.001 |
| Added sugars (g/day) | 22.92 | 23.27 | 22.48 | 15.87 | 12.28 | 11.89 | 46.48 | 43.32 | <0.001 |
| Carbon footprint (g CO2 eqv.) | 251.85 | 217.66 | 299.07 | 237.18 | 207.80 | 177.02 | 129.49 | 106.93 | <0.001 |
| Water footprint (m3) | 237.95 | 268.69 | 141.80 | 134.01 | 389.16 | 338.80 | 362.18 | 355.67 | <0.001 |
| Ecological footprint (m2*year) | 0.59 | 0.73 | 0.34 | 0.24 | 1.20 | 1.11 | 0.51 | 0.46 | <0.001 |
* ANOVA or Kruskal-Wallis’s test, where appropriate.
Table 3.
Associations between dietary carbon footprint (kg CO2 eqv.) and characteristics of the University of Rijeka's students (n=1684).
Table 3.
Associations between dietary carbon footprint (kg CO2 eqv.) and characteristics of the University of Rijeka's students (n=1684).
| 2009 study (Krešić et al.) | 2018 study (Pavičić Žeželj et al.) | 2025 Kenđel Jovanović et al. | ||||||||||
| β | 95% CI | p-value | β | 95% CI | p-value | β | 95% CI | p-value | ||||
| Age (1 ≤ 21 years; 2 > 22 years) | -37.97 | 84.78 | -160.72 | 0.544 | -13.64 | 190.91 | -218.19 | 0.896 | -99.91 | 238.73 | -438.55 | 0.564 |
| Gender (1 men; 2 women) | -462.65 | -127.49 | -797.82 | 0.007 | -987.98 | -511.38 | -1464.57 | <0.001 | -1778.82 | -940.44 | -2617.20 | <0.001 |
| Nutrition status (1 underweight; 2 normal weight; 3 overweight; 4 obesity) | -144.37 | 164.29 | -453.02 | 0.360 | 253.84 | 643.12 | -135.43 | 0.202 | -223.13 | 432.07 | -878.33 | 0.505 |
| Physical activity level (1 low; 2 moderate; 3 high) | 84.81 | 280.65 | -111.03 | 0.396 | 116.66 | 359.37 | -126.04 | 0.347 | -174.58 | 487.79 | -836.95 | 0.606 |
| Smoking habits (1 no; 2 yes) | 50.79 | 337.65 | -236.07 | 0.729 | 266.10 | 673.43 | -141.23 | 0.201 | -84.16 | 831.91 | -1000.23 | 0.857 |
| Study level (1 undergraduate; 2 graduate) | 120.15 | 559.91 | -319.62 | 0.592 | -448.82 | 464.66 | -1362.29 | 0.336 | -394.48 | 1106.39 | -1895.35 | 0.607 |
| PHDI quartiles (1 Q1; 2Q2; 3Q3; 4 Q4) | 83.27 | 222.09 | -55.56 | 0.240 | 193.39 | 372.11 | 14.67 | 0.034 | -568.02 | -130.05 | -1005.99 | 0.012 |
| MDS adherence (1 low; 2 moderate; 3 high) | 444.31 | 700.23 | 188.38 | 0.001 | 194.39 | 531.89 | -143.12 | 0.260 | 270.95 | 994.99 | -453.08 | 0.464 |
| DII inflammation potential (1 proinflammatory; 2 anti-inflammatory) |
1906.08 | 2208.89 | 1603.26 | <0.001 | 2106.11 | 2845.46 | 1366.76 | <0.001 | 3271.46 | 4340.60 | 2202.32 | <0.001 |
Table 4.
Associations between dietary water footprint (m3) and characteristics of the University of Rijeka's students (n=1684).
Table 4.
Associations between dietary water footprint (m3) and characteristics of the University of Rijeka's students (n=1684).
| 2009 study (Krešić et al.) | 2018 study (Pavičić Žeželj et al.) | 2025 Kenđel Jovanović et al. | ||||||||||
| β | 95% CI | p-value | β | 95% CI | p-value | β | 95% CI | p-value | ||||
| Age (1 ≤ 21 years; 2 > 22 years) | -20.47 | –61.07 | 20.13 | 0.323 | -28.38 | 86.40 | -143.17 | 0.628 | -58.06 | 194.91 | -311.02 | 0.653 |
| Gender (1 men; 2 women) | -141.97 | –252.82 | –31.12 | 0.012 | -610.70 | -343.26 | -878.14 | <0.001 | -1302.98 | -676.71 | -1929.25 | <0.001 |
| Nutrition status (1 underweight; 2 normal weight; 3 overweight; 4 obesity) | -17.63 | –119.71 | 84.45 | 0.735 | 110.01 | 328.45 | -108.43 | 0.324 | -146.26 | 343.18 | -635.70 | 0.559 |
| Physical activity level (1 low; 2 moderate; 3 high) | 6.74 | –58.03 | 71.50 | 0.839 | 39.42 | 175.61 | -96.78 | 0.571 | -58.27 | 436.52 | -553.06 | 0.818 |
| Smoking habits (1 no; 2 yes) | 127.80 | 32.93 | 222.66 | 0.008 | 89.12 | 317.69 | -139.45 | 0.445 | -176.56 | 507.75 | -860.88 | 0.614 |
| Study level (1 undergraduate; 2 graduate) | -61.05 | –206.50 | 84.40 | 0.411 | -148.96 | 363.63 | -661.56 | 0.569 | -369.00 | 752.16 | -1490.16 | 0.520 |
| PHDI quartiles (1 Q1; 2Q2; 3Q3; 4 Q4) | -132.05 | –177.97 | –86.13 | <0.001 | 57.53 | 157.82 | -42.76 | 0.261 | -427.29 | -100.13 | -754.45 | 0.011 |
| MDS adherence (1 low; 2 moderate; 3 high) | 148.85 | 64.20 | 233.50 | 0.001 | 122.89 | 312.28 | -66.50 | 0.204 | 311.26 | 852.12 | -229.61 | 0.261 |
| DII inflammation potential (1 proinflammatory; 2 anti-inflammatory) | 525.94 | 425.78 | 626.10 | <0.001 | 1206.90 | 1621.79 | 792.02 | <0.001 | 2564.66 | 3363.31 | 1766.00 | <0.001 |
Table 5.
Associations between ecological footprint (m2*year) and characteristics of the University of Rijeka's students (n=1684).
Table 5.
Associations between ecological footprint (m2*year) and characteristics of the University of Rijeka's students (n=1684).
| 2009 study (Krešić et al.) | 2018 study (Pavičić Žeželj et al.) | 2025Kenđel Jovanović et al. | ||||||||||
| β | 95% CI | p-value | β | 95% CI | p-value | β | 95% CI | p-value | ||||
| Age (1 ≤ 21 years; 2 > 22 years) | -0.04 | 0.08 | -0.16 | 0.520 | -0.07 | 0.31 | -0.46 | 0.702 | -0.18 | 0.37 | -0.74 | 0.519 |
| Gender (1 men; 2 women) | -0.66 | -0.34 | -0.98 | <0.001 | -2.16 | -1.27 | -3.05 | 0.000 | -3.39 | -2.02 | -4.76 | <0.001 |
| Nutrition status (1 underweight; 2 normal weight; 3 overweight; 4 obesity) | -0.33 | -0.04 | -0.63 | 0.027 | 0.50 | 1.23 | -0.23 | 0.179 | 0.08 | 1.15 | -0.99 | 0.885 |
| Physical activity level (1 low; 2 moderate; 3 high) | 0.05 | 0.24 | -0.13 | 0.580 | 0.23 | 0.68 | -0.23 | 0.329 | -0.31 | 0.77 | -1.39 | 0.576 |
| Smoking habits (1 no; 2 yes) | 0.10 | 0.37 | -0.18 | 0.489 | 0.46 | 1.22 | -0.30 | 0.237 | -1.82 | -0.33 | -3.32 | 0.018 |
| Study level (1 undergraduate; 2 graduate) | -0.05 | 0.37 | -0.47 | 0.822 | -0.84 | 0.87 | -2.54 | 0.336 | -0.74 | 1.71 | -3.19 | 0.554 |
| PHDI quartiles (1 Q1; 2Q2; 3Q3; 4 Q4) | -0.29 | -0.16 | -0.42 | <0.001 | 0.15 | 0.49 | -0.18 | 0.368 | -0.87 | -0.15 | -1.58 | 0.018 |
| MDS adherence (1 low; 2 moderate; 3 high) | 0.53 | 0.77 | 0.28 | <0.001 | 0.38 | 1.01 | -0.25 | 0.243 | 1.05 | 2.24 | -0.13 | 0.082 |
| DII inflammation potential (1 proinflammatory; 2 anti-inflammatory) | 1.72 | 2.01 | 1.43 | <0.001 | 3.51 | 4.89 | 2.13 | <0.001 | 7.36 | 9.10 | 5.61 | <0.001 |
4. Discussion
This retrospective study provides a comprehensive analysis of dietary patterns and their environmental and health impacts among students of the University of Rijeka, Croatia, over a sixteen-year period (2009–2025). The results revealed significant trends in both nutritional quality and sustainability, presenting insights into the evolving challenges and opportunities for promoting healthy and sustainable eating behaviors among young consumers. University students are important for making a change; therefore, to promote the health, wellness, and longevity of youth while ensuring the preservation of planetary health, youth-focused public health programs should be developed through collaborative efforts between universities and public health institutions, incorporating knowledge of evolving food systems, ecological public health, and the principles of planetary health diets.
Change in Dietary Patterns/Nutrition Transition
This study revealed a significant change in students' dietary patterns over time. Their diet's adherence to the Mediterranean and Planetary Health diet, both of which are associated with improved health outcomes and reduced environmental impacts [28,29,37,38], significantly declined from 2009 to 2025. In 2009, 49% of students’ diet highly adhered to the Mediterranean diet, whereas this proportion declined to 7% in 2018, followed by a slight increase to 15% in 2025. The adherence to the Planetary Health Diet also similarly but mildly declined over time. The observed decline in adherence to sustainable diets had been followed by increased environmental impact indicators, and also by increased proinflammatory potential of students' diets. These findings align with trends observed in other parts of Europe, where Westernized eating patterns and convenience-based food choices are becoming more prevalent [15,16,26,39]. Even diets proven to be healthy, such as Mediterranean, vegetarian, or vegan diets, can have relatively high environmental impacts when they include resource-intensive foods, such as nuts, avocados, or dairy, rely on imported or out-of-season produce, or incorporate highly processed plant-based products. Thus, nutritional quality does not necessarily equate to low environmental footprint, as factors such as production methods, transport, and food waste substantially influence a diet’s ecological impact. Perrone et al. recently discussed that adherence to the Mediterranean diet is declining across Mediterranean populations due to widespread socio-economic, cultural, and behavioral changes, and framing this trend not as a diminution of the diet’s value but as a public health challenge and opportunity for revitalizing and adapting it within current food systems [40]. Changes in students’ diet across sixteen years, observed in this study, revealed significant fluctuations in food group intake and their associated environmental impacts. While the intake of nuts and peanuts, fruits, vegetables, whole grains, red meat, poultry, and added sugars declined from 2009 to 2018, the consumption of these foods significantly increased in 2025. The consumption of nuts, peanuts, fruits, vegetables, and whole grains has been associated with reduced inflammatory markers and with a lower risk of chronic inflammatory diseases. This specific potential in reducing inflammation biomarkers such as C-reactive protein and interleukin-6 [41] is due to their content of omega-3 fatty acids, polyunsaturated fats, and antioxidants. Students’ nutrition transition over time showed an improved lipid profile, characterized by a higher proportion of unsaturated fatty acids, which is likely attributed to increased consumption of nuts, peanuts, and legumes. Furthermore, legumes, fruits, and vegetables, as good sources of dietary fiber, contribute to the regulation of postprandial blood glucose and insulin sensitivity, and promote gut health by enhancing microbiota diversity that increases production of short-chain fatty acids with anti-inflammatory effects [42]. Conversely, pro-inflammatory foods such as red meat, poultry, and added sugars promote inflammation, with red meat and processed foods contributing to increased inflammation through saturated fats, heme iron, and advanced glycation end products, while excessive poultry and sugar intake are associated with activation of inflammatory pathways like NF-κB signaling [41]. The increase in consumption of pro-inflammatory foods not only more likely contributes to diet-related diseases such as obesity, cardiovascular diseases, and diabetes [41], but also reflects a shift towards diets that are less aligned with sustainability goals [5,8,43]. The observed increase in overweight and obesity prevalence over time within this study further underscores the implications of transitioned dietary trends for students’ long-term health. Recent research [15,16] indicates that university and college students are experiencing increasing rates of overweight and obesity, often driven by poor dietary patterns, physical inactivity, and environmental factors such as limited access to healthy food options. These trends are concerning because habits formed during young adulthood tend to persist into later life and consequently may increase the risk of chronic diseases, such as type 2 diabetes, cardiovascular disease, and metabolic imbalances [44], and even cause an accelerated biological ageing [45]. A recent systematic literature review exploring barriers in sustainable food consumption [46] highlighted factors like economic constraints, limited availability, knowledge gaps, and psychological barriers that hinder consumer adoption of sustainable diets, which is related to the characteristic students’ lifestyle [14,16,17]. Addressing these challenges requires well-planned strategies such as subsidies, education, improved accessibility, and building trust in labelling systems, while also tackling systemic barriers in supply chains and production [46]. In addition, multi-level, context-specific interventions that integrate structural, social, and individual determinants, such as affordability, nutrition literacy, and cooking self-efficacy, may effectively promote the adoption of sustainable dietary practices among youth [47].
Environmental Impact of the Diet
The environmental impact of students’ diets analyzed in this study also showed significant temporal changes, characterized by an increase in dietary environmental indicators over time. Overall, the carbon footprint showed a significant decrease across most food groups, with the exception of whole grains, eggs, fish, milk and dairy, vegetable oils, and poultry, which exhibited increasing trends. The water and ecological footprint values were higher in 2025 compared with 2009 across all food groups, with the exception of the water footprint of the added sugars group. An exception was also observed for fruits, vegetables, and whole grains, whose ecological footprint after sixteen years was lower compared with the initial assessment. Animal-based foods are associated with an increase in all ecological footprints, while plant-based foods, especially unprocessed or minimally processed fruits, vegetables, legumes, grains, and nuts, generally with lower carbon emissions, but some plant-based foods, like grains, nuts, and oils, can have increased water use [48]. Daas et al. recently highlighted that when ultra-processed foods are included in plant-based diet indices, their environmental sustainability depends greatly on the specific composition [49]. This study showed that carbon footprints decreased with the intake of nuts, fruits, vegetables, and reduced red meat, and added sugars consumption, but increased with the consumption of whole grains and poultry. Water footprints increased with most foods, including nuts, fruits, whole grains, eggs, and red meat, while ecological footprints decreased with fruits, vegetables, and whole grains, but increased for red meat, poultry, and eggs. This suggests that observed time-related dietary environmental impact transition may depend on differences in the food type and its processing level within the same food group, rather than on differences in consumption quantities. For example, plant-based ultra-processed foods, such as processed grains, generally have lower greenhouse gas emissions and lack essential nutrients than unprocessed or minimally processed animal-based foods, which have much higher impacts due to production systems and LCA values [35,36,50,51]. Although students over time increased red meat and product consumption, they also significantly increased legume intake, which is a positive trend, as legumes are important protein sources in plant-based diets and have much lower carbon footprints than animal-based foods [52]. Although transitioning to plant-based diets may lower environmental impacts, it is also important to recognize that dietary nutritional quality tends to decline with increasing levels of food processing, regardless of the same food origin, which presents a complex challenge [37,53], and seeks more focused education on whole-food intake. Recently, Kalmpourtzidou et al. reviewed that Mediterranean, healthy, and sustainable diets, despite their nutritional and health advantages, express relatively high environmental impacts, particularly greater freshwater and land use, and especially in southern Europe, compared with diets that further reduce meat and animal-based foods [54], which is in line with this study’s results. This study observed significant and consistent gender differences among students’ characteristics associated with the environmental impact of their diet. Women had a diet with lower carbon, water, and land footprints compared to men. This finding is consistent with other research that showed that men had higher dietary environmental impacts than women, when impacts were expressed per total food intake [55,56,57]. However, although reporting impacts per unit of energy may be more appropriate for certain purposes like subgroup comparisons, it does not account for the effects of overconsumption, which is a major contributor to dietary environmental burden [58]. The increasing effect size of this gender difference over time suggests that women tend to have and remain a healthier dietary pattern. Of all dietary indices, DII was consistently associated with environmental impact, where a more proinflammatory diet was significantly associated with greater environmental impacts, indicating that diets detrimental to health also tend to be less sustainable, with this effect strengthening over time. If young people continue to consume proinflammatory and environmentally unsustainable diets, they may face heightened risks of chronic diseases such as obesity, cardiovascular disease, and diabetes. At the same time, these dietary patterns impair environmental degradation, threatening future food security and ecosystem stability. Therefore, adopting nutrient-rich, sustainable diets among students is critical for the preservation of both health and planetary well-being. The connections between dietary practices, nutrition, the environment, and disease provide valuable insights for public health, such as results of this study, by highlighting the impact of rapidly evolving food systems, nutrition transition, and related health outcomes. The increased reliance on animal-sourced foods, a significant driver of ecosystem degradation and climate change, exacerbates unsustainable dietary trends and further strains ecological sustainability and biodiversity [5,8,12,53]. Abreu et al. showed that despite the clear evidence of students' growing awareness of the environmental and health benefits of sustainable diets, a significant gap between knowledge and behavior remains [25]. Factors such as food accessibility, affordability, time pressures, and lifestyle constraints significantly shape students' dietary choices than knowledge alone, and despite relatively high levels of nutrition knowledge, there is a weak relationship between nutrition literacy and actual dietary habits [24,25]. The growing reliance on convenience foods, fast food outlets, and the increasing prevalence of highly processed foods on campuses are major barriers to adopting healthier, more sustainable diets. Furthermore, the challenges of balancing academic, social, and work commitments leave little time for meal preparation, which further exacerbates reliance on unhealthy food choices. Based on these and this study’s findings, it is necessary to design more effective interventions that support the nutritional transition of students toward more sustainable dietary patterns. Interventions aimed at promoting sustainable eating behaviors must, therefore, go beyond education and focus on creating food environments that support healthy and sustainable choices, such as providing affordable and accessible plant-based options in campus cafeterias and offering incentives for sustainable food practices. To overcome this, it is necessary to establish a strong collaboration between public health, universities, and the food system.
Implications for Policy and Future Research
The findings from this study highlight the urgent need for systemic changes at the institutional level to support sustainable eating behaviors among university students. As universities play a pivotal role in shaping the dietary habits of young adults, they have a unique opportunity to influence long-term dietary patterns and foster a culture of sustainability [15,16,17,46,47]. While there is growing interest in sustainable eating among students, focus should be on improving the availability and affordability of healthy, sustainable food options, implementing nutrition education programs that address both health and environmental impacts, and promoting practices that reduce the environmental footprint of campus food systems, by expanding affordable, plant-based, and local food options in dining services, and launching awareness campaigns on the environmental impact of food waste and diet choices. By creating an environment where sustainable food options are more accessible and appealing, universities can help students make lasting improvements to both their health and the planet. Further research is needed to explore the multifaceted factors influencing dietary choices among university students, including the role of social norms, peer influence, and the psychological stressors associated with student life. Additionally, longitudinal studies that track dietary behaviors over long periods could provide deeper insights into the long-term impact of university-level interventions on students' eating habits and their broader environmental and health outcomes.
Study Limitations
This study has several strengths and limitations. A key strength lies in the use of a comprehensive database compiled from three independent studies [20,21,23], which increased the sample size and enhanced the diversity of participants, thereby improving the robustness and ecological validity of the findings. The availability of data collected across different time points also enabled the identification of temporal patterns. Additionally, the use of FFQs across all studies, while similar in design, allowed for the collection of detailed dietary data. However, differences in the different recall periods and specific food items included in each FFQ could have introduced variability in dietary reporting across the studies. Despite these challenges, the FFQs provide valuable insights into dietary patterns over time. The study also employed the LCA method to evaluate the sustainability of dietary patterns, following international guidelines. This approach provides a robust framework for assessing environmental impacts, contributing to the study's comprehensive analysis of sustainability. However, a limitation of this method is the absence of standardized LCA databases for representative foods in the national marketplace, which could potentially affect the accuracy and comparability of the results. The lack of region-specific databases means that assumptions were made regarding the environmental impacts of certain food items, which may not fully reflect local agricultural practices or food systems [59]. Furthermore, the retrospective design limits the study in that the data were not originally collected to address more specific research questions, resulting in potential gaps or limitations in key factors, such as food accessibility, affordability, time pressures, nutrition knowledge, and lifestyle constraints of students. Methodological differences among the three included studies [20,21,23] may have introduced heterogeneity that affects comparability. Residual confounding and selection bias may also occur, given the limited control over participant characteristics and contextual factors in the original datasets. Finally, although the study provides insight into time-related trends of university students' diet, external influences occurring during the periods may limit the contemporary relevance of the findings, and causal inferences cannot be established. Nevertheless, the study findings represent valuable data for the Croatian university context and public health. However, to enable efficient transition to sustainable diets among students, further research from other Croatian universities is needed.
5. Conclusions
This study observed a significant nutritional transition among University of Rijeka students towards less sustainable dietary patterns. While certain sustainable dietary practices were noted, such as an increased intake of nuts and legumes, the overall sustainability and health characteristic of the diet was negatively impacted by increased animal-based food consumption and proinflammatory eating behaviors over time. These changes have important implications for both students’ health and the environment. Addressing their barriers to sustainable eating and creating supportive food environments in universities is essential in reversing these trends and promoting healthier, more sustainable dietary behaviors. This study provides valuable suggestions for policymakers, educators, and researchers working to create a generation of students who are not only health-conscious but also environmentally responsible in their food choices.
Author Contributions
Conceptualization, GKJ, SPŽ, and GK; methodology, GKJ; software, GKJ and ED; validation, GKJ, ED, SPŽ, and GK; formal analysis, GKJ, MS, and ED; investigation, GKJ, SPŽ, ED, MS, and GK; data curation, SPŽ; writing—original draft preparation, GKJ; writing—review and editing, GKJ, SPŽ, ED, MS, and GK; visualization, GKJ; supervision, GKJ and SPŽ. All authors have read and agreed to the published version of the manuscript.
Funding
This research received no external funding.
Institutional Review Board Statement
The study was conducted in accordance with the Declaration of Helsinki. Ethical review and approval were waived for this study due to the nature of the study.
Informed Consent Statement
Participants’ consent was waived due nature of the study.
Data Availability Statement
The data presented in this study are available on request from the corresponding author.
Conflicts of Interest
The authors declare no conflicts of interest.
Abbreviations
The following abbreviations are used in this manuscript:
| FFQ | Food Frequency Questionnaire |
| BMI | Body mass index |
| PHDI | Planetary Health Diet Index |
| MDS | Mediterranean Diet Score |
| DII | Dietary Inflammatory Index |
| LCA | Life Cycle Assessment |
References
- Clark, M.A.; Springmann, M.; Hill, J.; Tilman, D. Multiple health and environmental impacts of foods. Proc. Natl. Acad. Sci. U.S.A. 2019, 116(46), 23357–23362. [CrossRef]
- Fernqvist, F.; Spendrup, S.; Tellström, R. Understanding food choice: A systematic review of reviews. Heliyon 2024, 10(12), e32492. Published 2024 Jun 5. [CrossRef]
- Mozaffarian, D.; Angell, S.Y.; Lang, T.; Rivera, J.A. Role of government policy in nutrition—barriers to and opportunities for healthier eating. BMJ 2018, 361, k2426. Published 2018 Jun 13. [CrossRef]
- Popkin, B.M.; Ng, S.W. The nutrition transition to a stage of high obesity and noncommunicable disease prevalence dominated by ultra-processed foods is not inevitable. Obes. Rev. 2022, 23(1), e13366. [CrossRef]
- Willett, W.; Rockström, J.; Loken, B.; Springmann, M.; Lang, T.; Vermeulen, S.; et al. Food in the Anthropocene: The EAT-Lancet commission on healthy diets from sustainable food systems. Lancet 2019, 393, 447–492. [CrossRef]
- Richardson, K.; Steffen, W.; Lucht, W.; et al. Earth beyond six of nine planetary boundaries. Sci. Adv. 2023, 9(37), eadh2458. [CrossRef]
- Hunter, R.F.; Garcia, L.; Dagless, S.; et al. The emerging syndemic of climate change and non-communicable diseases. Lancet Planet. Health 2024, 8(7), e430–e431. [CrossRef]
- World Health Organization (WHO); Food and Agriculture Organization (FAO). Sustainable healthy diets: guiding principles. 2025. Available online: https://www.who.int/publications/i/item/9789241516648 (accessed on 30 October 2025).
- Norwood, P.; Cleland, E.; McNamee, P. Exploring attitudes towards healthy and sustainable diets: A Q-methodology study. Cleaner Responsible Consumption 2025, 18, 100308.
- Swinburn, B.A.; Kraak, V.I.; Allender, S.; et al. The Global Syndemic of Obesity, Undernutrition, and Climate Change: The Lancet Commission report. Lancet 2019, 393(10173), 791–846. [CrossRef]
- Gulis, G.; Zidkova, R.; Meier, Z. Changes in disease burden and epidemiological transitions. Sci. Rep. 2025, 15(1), 8961. Published 2025 Mar 15. [CrossRef]
- Deksne, J.; Lonska, J.; Litavniece, L.; Tambovceva, T. Shaping sustainability through food consumption: A conceptual perspective. Sustainability 2025, 17(15), 7138. [CrossRef]
- Biganzoli, F.; Caldeira, C.; Dias, J.; De Laurentiis, V.; Leite, J.; Wollgast, J.; Sala, S. Towards healthy and sustainable diets: Understanding food consumption trends in the EU. Foods 2025, 14(16), 2798. [CrossRef]
- Raghoebar, S.; Mesch, A.; Gulikers, J.; Winkens, L.H.H.; Wesselink, R.; Haveman-Nies, A. Experts’ perceptions on motivators and barriers of healthy and sustainable dietary behaviors among adolescents: The SWITCH project. Appetite 2024, 194, 107196. [CrossRef]
- Jurado-Gonzalez, P.; López-Toledo, S.; Bach-Faig, A.; Medina, F.-X. Barriers and enablers of healthy eating among university students in Oaxaca de Juarez: A mixed-methods study. Nutrients 2025, 17, 1263. [CrossRef]
- Almoraie, N.M.; Alothmani, N.M.; Alomari, W.D.; Al-Amoudi, A.H. Addressing nutritional issues and eating behaviours among university students: A narrative review. Nutr. Res. Rev. 2025, 38, 53–68. [CrossRef]
- Elliott, P.S.; Devine, L.D.; Gibney, E.R.; O'Sullivan, A.M. What factors influence sustainable and healthy diet consumption? A review and synthesis of literature within the university setting and beyond. Nutr. Res. 2024, 126, 23–45. [CrossRef]
- Šatalić, Z.; Colić Barić, I.; Keser, I.; Marić, B. Evaluation of diet quality with the Mediterranean dietary quality index in university students. Int. J. Food Sci. Nutr. 2004, 55(8), 589–595.
- Šatalić, Z.; Barić, I.C.; Keser, I. Diet quality in Croatian university students: Energy, macronutrient and micronutrient intakes according to gender. Int. J. Food Sci. Nutr. 2007, 58(5), 398–410. [CrossRef]
- Kresić, G.; Kendel Jovanović, G.; Pavicić Zezel, S.; Cvijanović, O.; Ivezić, G. The effect of nutrition knowledge on dietary intake among Croatian university students. Coll. Antropol. 2009, 33(4), 1047–1056. Available online: https://hrcak.srce.hr/file/78762.
- Pavičić Žeželj, S.; Dragaš Zubalj, N.; Fantina, D.; Krešić, G.; Kenđel Jovanović, G. Adherence to Mediterranean diet in University of Rijeka students. Paediatria Croatica 2019, 63(1), 31. Available online: . [CrossRef]
- Pfeifer, D.; Rešetar, J.; Czlapka-Matyasik, M.; et al. Changes in diet quality and its association with students' mental state during two COVID-19 lockdowns in Croatia. Nutr. Health 2024, 30(4), 797–806. [CrossRef]
- Kenđel Jovanović, G.; Krešić, G.; Dujmić, E.; Pavičić Žeželj, S. Adherence to the Planetary Health Diet and its association with diet quality and environmental outcomes in Croatian university students: A cross-sectional study. Nutrients 2025, 17(11), 1850. [CrossRef]
- Vujačić, V.; Podovšovnik, E.; Planinc, S.; Krešić, G.; Kukanja, M. Bridging knowledge and adherence: A cross-national study of the Mediterranean diet among tourism students in Slovenia, Croatia, and Montenegro. Sustainability 2025, 17(12), 5440. [CrossRef]
- Abreu, F.; Hernando, A.; Goulão, L.F.; et al. Mediterranean diet adherence and nutritional literacy: An observational cross-sectional study of the reality of university students in a COVID-19 pandemic context. BMJ Nutr. Prev. Health 2023, 6(2), 221–230. [CrossRef]
- Grant, F.; Aureli, V.; Di Veroli, J.N.; Rossi, L. Mapping of the adherence to the planetary health diet in 11 European countries: Comparison of different diet quality indices as a result of the PLAN'EAT project. Front. Nutr. 2025, 12, 1645824. Published 2025 Sep 17. [CrossRef]
- Kaić-Rak, A.; Antonić, K. Tablice o sastavu namirnica i pića; Zavod za Zaštitu Zdravlja SR Hrvatske: Zagreb, Croatia, 1990.
- Sofi, F.; Cesari, F.; Abbate, R.; Gensini, G.F.; Casini, A. Adherence to Mediterranean diet and health status: Meta-analysis. BMJ 2020, 337, a1344. doi.org:10.1136/bmj.a1344.
- Serra-Majem, L.; Román-Viñas, B.; Sanchez-Villegas, A.; Guasch-Ferré, M.; Corella, D.; La Vecchia, C. Benefits of the Mediterranean diet: Epidemiological and molecular aspects. Molecular Aspects of Medicine 2019, 67, 1–55. [CrossRef]
- Cacau, L.T.; De Carli, E.; de Carvalho, A.M.; et al. Development and validation of an index based on EAT-Lancet recommendations: The Planetary Health Diet Index. Nutrients 2021, 13, 1698. [CrossRef]
- Marx, W.; Veronese, N.; Kelly, J.T.; et al. The dietary inflammatory index and human health: An umbrella review of meta-analyses of observational studies. Adv. Nutr. 2021, 12(5), 1681–1690. [CrossRef]
- Shivappa, N.; Steck, S.E.; Hurley, T.G.; Hussey, J.R.; Hébert, J.R. Designing and developing a literature-derived, population-based dietary inflammatory index. Public Health Nutr. 2014, 17(8), 1689–1696. [CrossRef]
- National Food Institute, Technical University of Denmark. Food data (Version 4.2); Technical University of Denmark: Copenhagen, Denmark, 2022. Available online: https://frida.fooddata.dk/index.php?lang=en (accessed on 11 August 2025).
- U.S. Department of Agriculture, Agricultural Research Service. FoodData Central; U.S. Department of Agriculture: Washington, DC, USA, 2019. Available online: https://fdc.nal.usda.gov/ (accessed on 11 August 2025).
- Mertens, E.; Kaptijn, G.; Kuijsten, A.; van Zanten, H.H.E.; Geleijnse, J.M.; van 't Veer, P. SHARP Indicators Database (Version 697 2) [Dataset]. DANS Data Station Life Sciences, 2019. (accessed on 18 August 2025). [CrossRef]
- Petersson, T.; Secondi, L.; Magnani, A.; Antonelli, M.; Dembska, K.; Valentini, R.; Varotto, A.; Castaldi, S. SU-EATABLE LIFE: A comprehensive database of carbon and water footprints of food commodities [Dataset]. figshare 2021. (accessed on 18 August 2025). [CrossRef]
- Laine, J.E.; Huybrechts, I.; Gunter, M.J.; et al. Co-benefits from sustainable dietary shifts for population and environmental health: An assessment from a large European cohort study. Lancet Planet. Health 2021, 5(11), e786–e796. [CrossRef]
- Muszalska, A.; Wiecanowska, J.; Michałowska, J.; et al. The role of the planetary diet in managing metabolic syndrome and cardiovascular disease: A narrative review. Nutrients 2025, 17(5), 862. [CrossRef]
- Dokova, K.G.; Pancheva, R.Z.; Usheva, N.V.; et al. Nutrition transition in Europe: East–West dimensions in the last 30 years—A narrative review. Front. Nutr. 2022, 9, 919112. [CrossRef]
- Perrone, P.; Landriani, L.; Patalano, R.; Meccariello, R.; D’Angelo, S. The Mediterranean diet as a model of sustainability: Evidence-based insights into health, environment, and culture. Int. J. Environ. Res. Public Health 2025, 22(11), 1658. [CrossRef]
- Yu, X.; Pu, H.; Voss, M. Overview of anti-inflammatory diets and their promising effects on non-communicable diseases. Br. J. Nutr. 2024, 132(7), 898–918. [CrossRef]
- Barber, T.M.; Kabisch, S.; Pfeiffer, A.F.H.; Weickert, M.O. The effects of the Mediterranean diet on health and gut microbiota. Nutrients. 2023;15(9):2150. [CrossRef]
- Chen, C.; Chaudhary, A.; Mathys, A. Dietary change and global sustainable development goals. Front. Sustain. Food Syst. 2022, 6, 771041. [CrossRef]
- Lawrence, E.M.; Mollborn, S.; Hummer, R.A. Health lifestyles across the transition to adulthood: Implications for health. Soc. Sci. Med. 2017, 193, 23–32. [CrossRef]
- Kankaanpää, A.; Tolvanen, A.; Heikkinen, A.; Kaprio, J.; Ollikainen, M.; Sillanpää, E. The role of adolescent lifestyle habits in biological aging: A prospective twin study. eLife 2022, 11, e80729. [CrossRef]
- Nichifor, B.; Zait, L.; Timiras, L. Drivers, barriers, and innovations in sustainable food consumption: A systematic literature review. Sustainability 2025, 17(5), 2233. [CrossRef]
- Muñoz-Martínez, J.; Cussó-Parcerisas, I.; Carrillo-Álvarez, E. Exploring the barriers and facilitators for following a sustainable diet: A holistic and contextual scoping review. Sustainable Prod. Consum. 2024, 46, 476–490. [CrossRef]
- Xu, X.; Sharma, P.; Shu, S.; et al. Global greenhouse gas emissions from animal-based foods are twice those of plant-based foods. Nat. Food 2021, 2, 724–732. [CrossRef]
- Daas, M.C.; Vellinga, R.E.; Pinho, M.G.M.; et al. The role of ultra-processed foods in plant-based diets: Associations with human health and environmental sustainability. Eur. J. Nutr. 2024, 63, 2957–2973. [CrossRef]
- García, S.; Pastor, R.; Monserrat-Mesquida, M.; et al. Ultra-processed foods consumption as a promoting factor of greenhouse gas emissions, water, energy, and land use: A longitudinal assessment. Sci. Total Environ. 2023, 891, 164417. [CrossRef]
- Mandouri, J.; Onat, N.C.; Kucukvar, M.; Jabbar, R.; Al-Quradaghi, S.; Al-Thani, S.; Kazançoğlu, Y. Carbon footprint of food production: A systematic review and meta-analysis. Sci. Rep. 2025, 15(1), 35630. [CrossRef]
- Costa, M.P.; Chadwick, D.; Saget, S.; et al. Representing crop rotations in life cycle assessment: A review of legume LCA studies. Int. J. Life Cycle Assess. 2020, 25, 1942–1956. [CrossRef]
- Magkos, F.; Tetens, I.; Bügel, S.; Felby, C.; Schacht, S.R.; Hill, J.O.; Ravussin, E.; Astrup, A. A perspective on the transition to plant-based diets: A diet change may attenuate climate change, but can it also attenuate obesity and chronic disease risk? Adv. Nutr. 2020, 1;11(1):1-9. [CrossRef]
- Kalmpourtzidou, A.; Biasini, B.; Rosi, A.; Scazzina, F. Environmental impact of current diets and alternative dietary scenarios worldwide: A systematic review. Nutr. Rev. 2025, 83(9), 1678–1710. [CrossRef]
- Meier, T.; Christen, O. Gender as a factor in an environmental assessment of the consumption of animal and plant-based foods in Germany. Int. J. Life Cycle Assess. 2012, 17, 550–564. [CrossRef]
- Ridoutt, B.G.; Baird, D.; Hendrie, G.A. Diets within planetary boundaries: What is the potential of dietary change alone? Sustainable Prod. Consum. 2021, 28, 802–810. [CrossRef]
- Hallström, E.; Davis, J.; Håkansson, N.; Ahlgren, S.; Åkesson, A.; Wolk, A.; Sonesson, U. Dietary environmental impacts relative to planetary boundaries for six environmental indicators: A population-based study. J. Clean Prod. 2022, 373, 133949. [CrossRef]
- Sundin, N.; Rosell, M.; Eriksson, M.; Jensen, C.; Bianchi, M. The climate impact of excess food intake—An avoidable environmental burden. Resources, Conserv. Recycl. 2021, 174, 105777. [CrossRef]
- Bôto, J.M.; Rocha, A.; Miguéis, V.; Meireles, M.; Neto, B. Sustainability dimensions of the Mediterranean diet: A systematic review of the indicators used and its results. Adv. Nutr. 2022, 13(5), 2015–2038. [CrossRef]
Figure 1.
Macronutrient energy share among university students (n=1684).
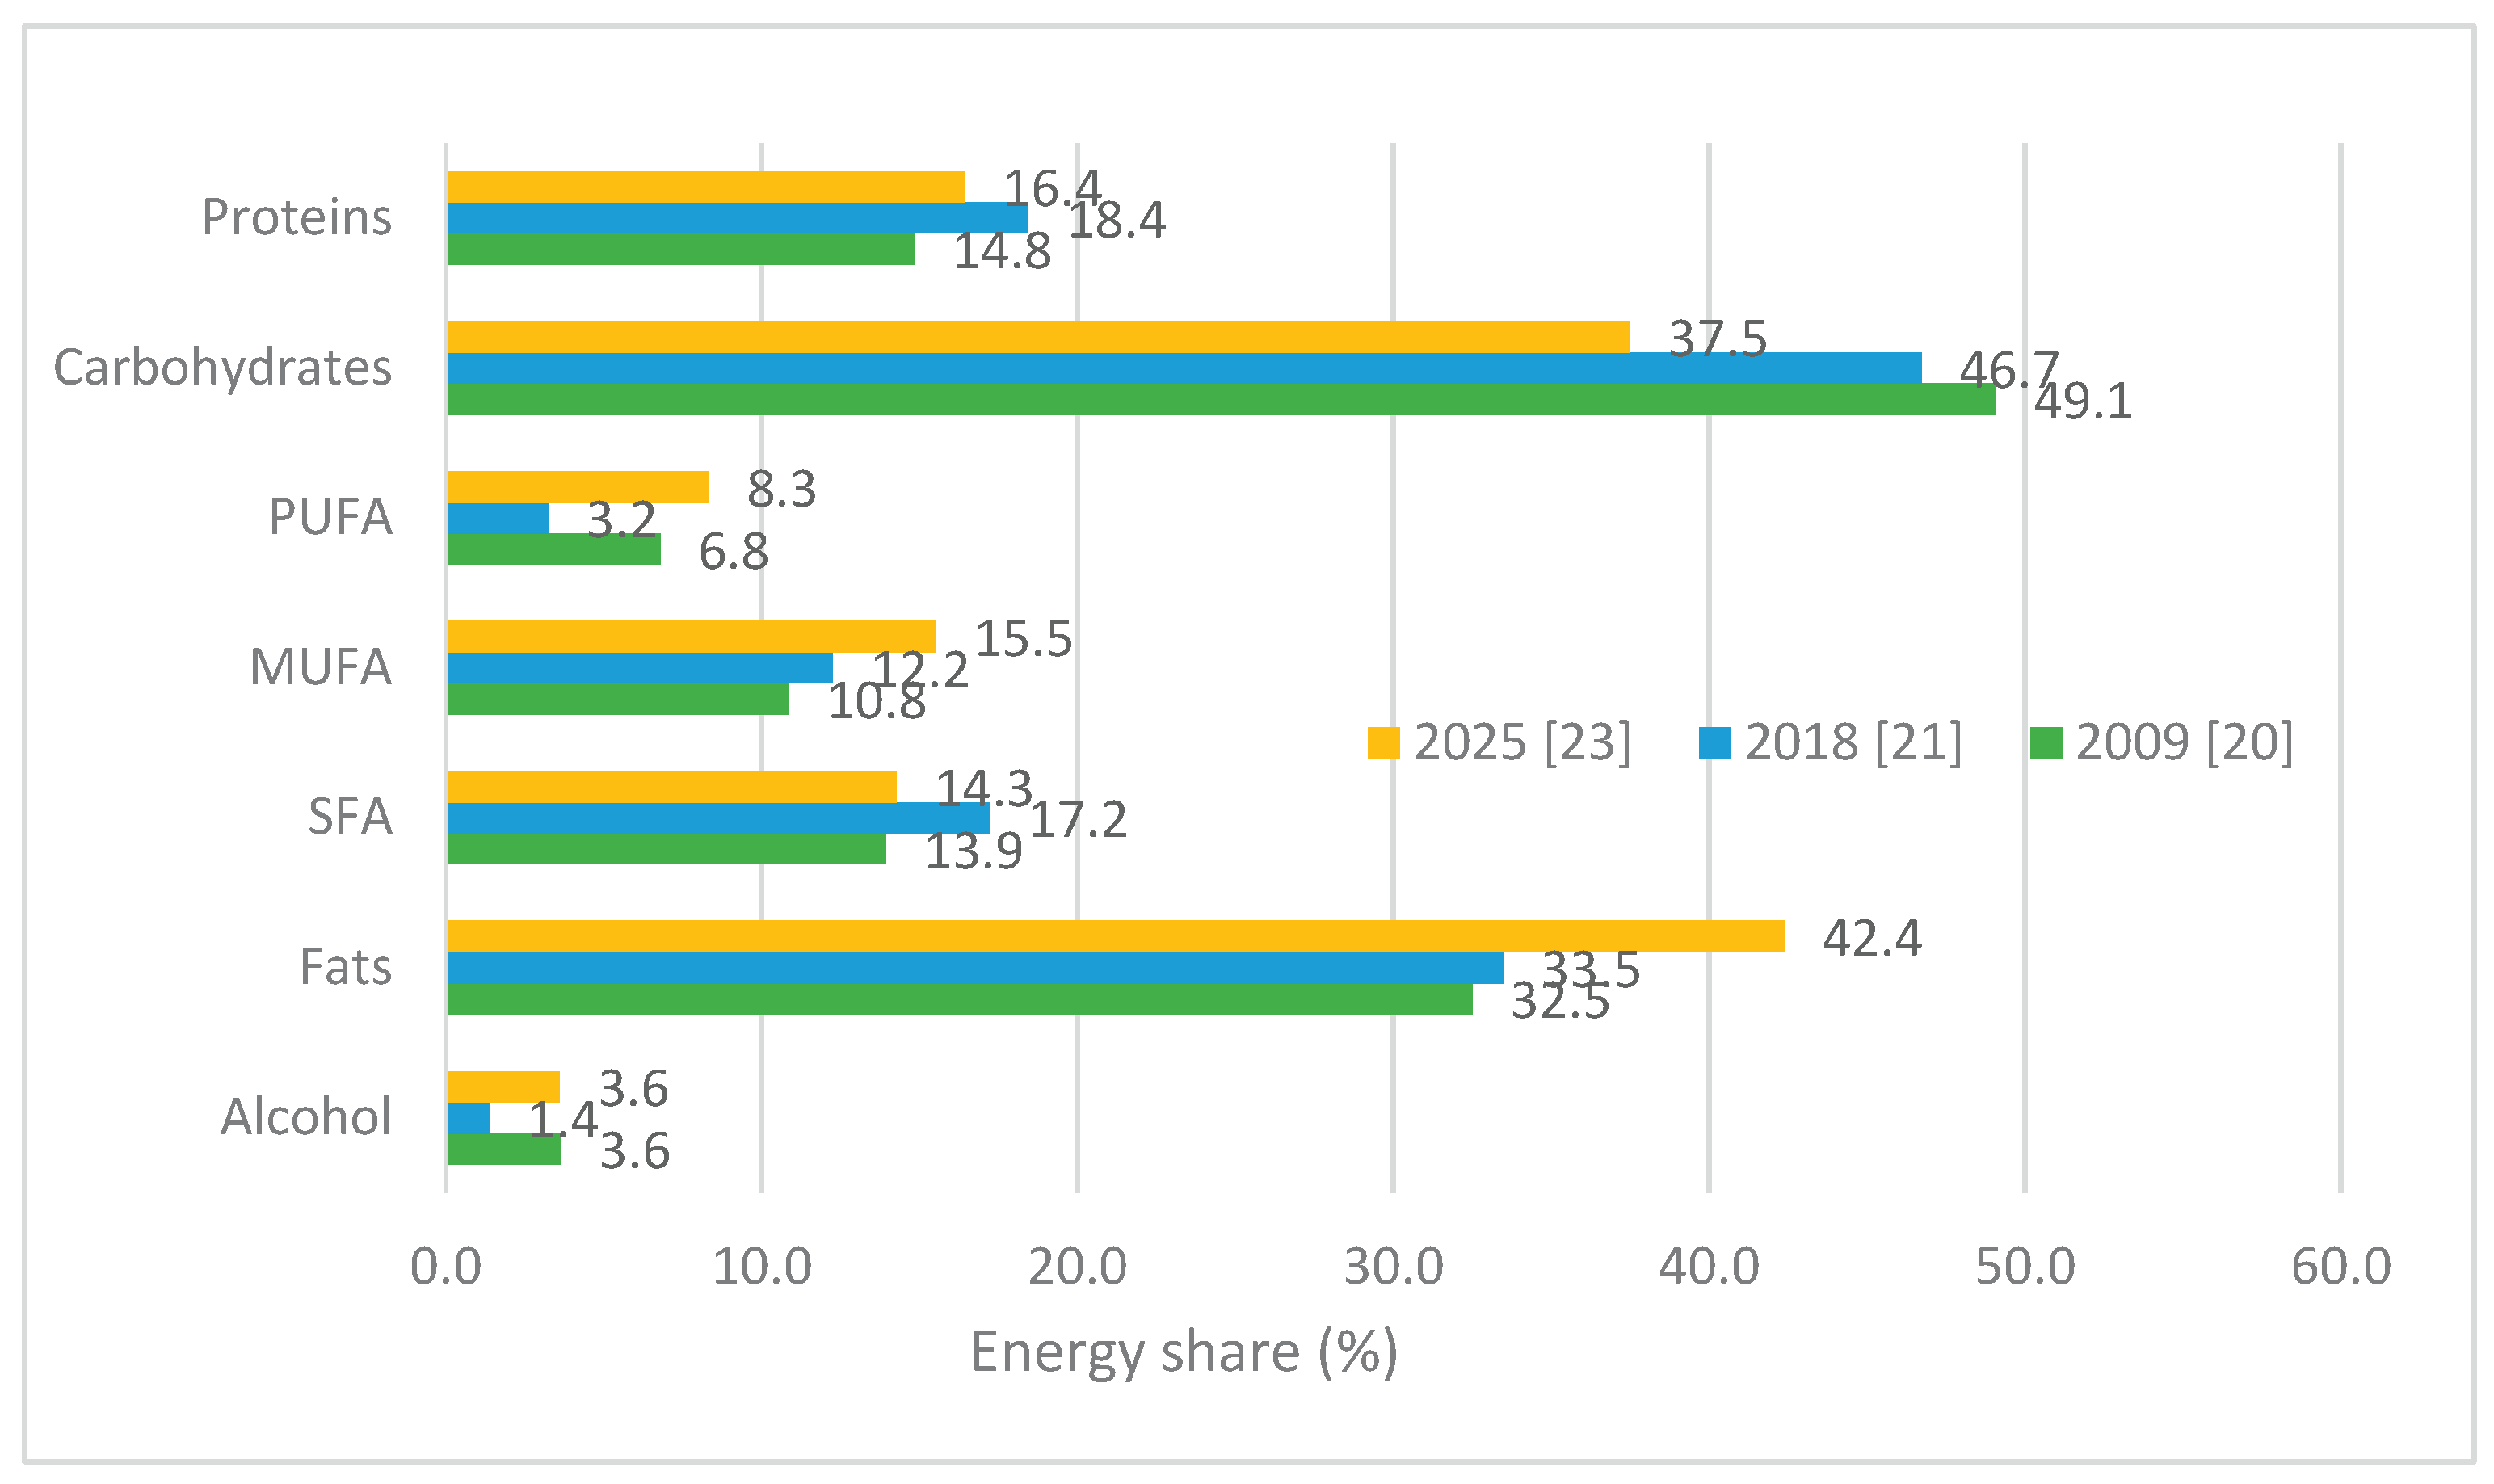
Table 1.
The University of Rijeka's students (n=1684) characteristics and lifestyle habits.
| All | Krešić et al., 2009 [20] |
Pavičić Žeželj et al., 2018 [21] |
Kenđel Jovanović et al., 2025 [23] |
p-valueb | |||||
| N | % | N | % | N | % | N | % | ||
| Number | 1684 | 100 | 1005 | 60 | 455 | 27 | 224 | 13 | <0.001 |
| Men | 504 | 30 | 264 | 26 | 119 | 26 | 121 | 54 | <0.001 |
| Women | 1180 | 70 | 741 | 74 | 336 | 74 | 103 | 46 | |
| Agea | 21.95 | 1.89 | 21.97 | 1.74 | 21.60 | 1.94 | 22.67 | 2.19 | <0.001 |
| ≤ 21 years | 754 | 45 | 383 | 38 | 288 | 63 | 83 | 37 | <0.001 |
| > 22 years | 930 | 55 | 622 | 62 | 167 | 37 | 141 | 63 | |
| Study level | |||||||||
| Undergraduate | 843 | 50 | 383 | 38 | 342 | 75 | 118 | 53 | <0.001 |
| Graduate | 841 | 50 | 622 | 62 | 113 | 25 | 106 | 47 | |
| Body mass index (kg/m2)a | 22.45 | 3.13 | 22.08 | 2.87 | 22.43 | 3.33 | 24.11 | 3.50 | <0.001 |
| Underweight | 85 | 5 | 49 | 5 | 30 | 7 | 6 | 3 | <0.001 |
| Normal weight | 1316 | 78 | 818 | 81 | 359 | 79 | 139 | 62 | |
| Overweight | 243 | 14 | 126 | 13 | 53 | 11 | 64 | 28 | |
| Obesity | 40 | 2 | 12 | 1 | 13 | 3 | 15 | 7 | |
| Physical activity level | |||||||||
| Low | 730 | 43 | 453 | 45 | 232 | 51 | 45 | 20 | <0.001 |
| Normal | 636 | 38 | 428 | 43 | 109 | 24 | 99 | 44 | |
| High | 318 | 19 | 124 | 12 | 114 | 25 | 80 | 36 | |
| Smoking (yes) | 575 | 34 | 340 | 34 | 179 | 39 | 56 | 25 | 0.001 |
| Mediterranean Diet Score (MDS)a | 4.78 | 1.40 | 5.45 | 0.92 | 3.70 | 1.36 | 4.00 | 1.47 | <0.001 |
| Low adherence | 306 | 18 | 24 | 2 | 204 | 45 | 78 | 35 | <0.001 |
| Moderate adherence | 820 | 49 | 489 | 49 | 218 | 48 | 113 | 50 | |
| High adherence | 558 | 33 | 492 | 49 | 33 | 7 | 33 | 15 | |
| Planetary Health Diet Index (PHDI)a | 61.98 | 13.09 | 67.84 | 9.94 | 52.21 | 11.72 | 55.54 | 13.30 | <0.001 |
| 1st quartile | 297 | 18 | 160 | 16 | 106 | 23 | 31 | 14 | <0.001 |
| 2nd quartile | 483 | 29 | 325 | 32 | 101 | 22 | 57 | 25 | |
| 3rd quartile | 330 | 20 | 180 | 18 | 82 | 18 | 68 | 30 | |
| 4th quartile | 574 | 34 | 340 | 34 | 166 | 36 | 68 | 30 | |
| Dietary Inflammatory Index (DII)a | 1.11 | 2.51 | 0.18 | 2.10 | 3.18 | 2.02 | 1.07 | 2.62 | <0.001 |
| Proinflammatory diet (DII > 0) | 1012 | 60 | 460 | 46 | 413 | 91 | 139 | 62 | <0.001 |
| Anti-inflammatory diet (DII < 0) | 672 | 40 | 545 | 54 | 42 | 9 | 85 | 38 | |
| Carbon footprint (kg CO2 eqv.)a | 5.93 | 2.81 | 6.80 | 2.43 | 4.20 | 2.34 | 5.52 | 3.52 | <0.001 |
| Water footprint (m3)a | 2768.49 | 1525.48 | 2380.93 | 768.22 | 2696.85 | 1310.68 | 4652.83 | 2674.74 | <0.001 |
| Ecological footprint (m2*year)a | 7.49 | 4.47 | 6.47 | 2.26 | 7.46 | 4.35 | 11.78 | 6.58 | <0.001 |
| Energy intake (MJ/day)a | 8.74 | 3.05 | 9.16 | 2.63 | 7.40 | 2.93 | 9.59 | 4.03 | <0.001 |
| Protein ratio (animal:vegetable)a | 2.19 | 1.25 | 1.76 | 0.77 | 2.91 | 1.41 | 2.66 | 1.70 | <0.001 |
| SFA : PUFA ratioa | 3.06 | 2.00 | 2.17 | 0.68 | 5.65 | 2.08 | 1.80 | 0.52 | <0.001 |
| Cholesterol (mg/day)a | 368.39 | 216.20 | 326.96 | 174.79 | 377.69 | 222.59 | 435.38 | 280.07 | <0.001 |
| Dietary fibers (g/day)a | 22.18 | 9.79 | 25.76 | 8.85 | 14.94 | 6.97 | 20.82 | 10.28 | <0.001 |
| Calcium (mg/day)a | 966.79 | 414.49 | 1083.90 | 371.27 | 695.58 | 358.90 | 992.26 | 448.54 | <0.001 |
| Iron (mg/day)a | 18.67 | 7.94 | 21.26 | 7.45 | 12.78 | 5.13 | 19.03 | 8.39 | <0.001 |
| Vitamin D (mcg/day)a | 6.61 | 6.92 | 6.60 | 10.53 | 6.84 | 4.06 | 3.66 | 2.45 | <0.001 |
| Folate (mcg/day)a | 253.80 | 153.79 | 289.32 | 152.90 | 150.35 | 82.81 | 304.56 | 170.83 | <0.001 |
a mean ± SD. b Ordinal data were tested with a Chi-squared test; numerical data with an ANOVA or Kruskal-Wallis’s test, where appropriate. SFA – saturated fatty acids; PUFA – polyunsaturated fatty acids.
Disclaimer/Publisher’s Note: The statements, opinions and data contained in all publications are solely those of the individual author(s) and contributor(s) and not of MDPI and/or the editor(s). MDPI and/or the editor(s) disclaim responsibility for any injury to people or property resulting from any ideas, methods, instructions or products referred to in the content. |
© 2025 by the authors. Licensee MDPI, Basel, Switzerland. This article is an open access article distributed under the terms and conditions of the Creative Commons Attribution (CC BY) license (http://creativecommons.org/licenses/by/4.0/).
Copyright: This open access article is published under a Creative Commons CC BY 4.0 license, which permit the free download, distribution, and reuse, provided that the author and preprint are cited in any reuse.


