
Submitted:
09 December 2025
Posted:
10 December 2025
You are already at the latest version
Abstract
(1) Background: MicroRNAs (miRNAs) are candidate biomarkers of therapeutic re-sponse; this study sequenced tumor miRNAs before and after neoadjuvant chemoradi-ation (CRT) in cohorts with locally advanced rectal cancer undergoing total mesorectal excision. (2) Materials and Methods: A total of 79 tumor samples, with 36 in the pre-operative (pre-OP) and 43 in the post-operative (post-OP) group, underwent miRNA profiling with the NanoString nCounter Human v3 assay and functional tar-get/pathway analysis using miRDB and TargetScanHuman. (3) Results: NanoString nCounter profiling of 798 miRNAs showed an overall higher expression in post-OP versus pre-OP samples, with 93 miRNAs upregulated in the post-OP group. Tar-get/pathway analyses of the top upregulated miRNAs indicated enrichment across 37 KEGG pathways—including MAPK and Ras signaling and proteoglycans in can-cer—and qRT-PCR validated significant post-OP increases in six miRNAs (miR-143-3p, miR-145-5p, miR-99a-5p, miR-125b-5p, miR-100-5p, and let-7c-5p). (4) Conclusion: We found and validated significant differentially expressed (DE) miRNAs in the post-OP group compared to the pre-OP group in patients with rectal cancer undergoing con-current CRT. These DE miRNAs might serve as the key molecules in CRT-induced suppression of tumor progression and immunomodulation. The further role of DE miRNAs as significant biomarkers needs to be explored in future studies.
Keywords:
chemoradiation
; microRNA
; Nanostring
; rectal cancer
1. Introduction
Colorectal cancer (CRC) ranks as the fourth most commonly diagnosed cancer and the second primary cause of cancer mortality in the United States [1]. According to 2021 cancer statistics in Korea, CRC is the second most frequently diagnosed cancer and contributes to the third highest cancer mortality in South Korea [2]. Worldwide, colorectal cancer mortality has declined over the decades due to advancements in cancer prevention, earlier detection through screening, and improved treatment modalities [3,4,5].
Rectal cancer accounts for approximately 40% of CRC cases and various neoadjuvant therapies including neoadjuvant chemoradiation therapy (CRT) and neoadjuvant chemotherapy followed by radical total mesorectal excision (TME) are recommended as one of the standard treatment options in locally advanced rectal cancer [6,7]. After neoadjuvant CRT, tumor and rectal tissues are influenced by this treatment and there have been several investigations on the effect of neoadjuvant CRT in terms of tumor microenvironment [8,9,10,11]. This effect of neoadjuvant CRT has the potential to influence oncologic prognosis and outcomes.
MicroRNA (miRNA) are non-coding, single-stranded RNA molecules that are 21–23 nucleotides in size [12]. miRNAs, present in plants, animals, and certain viruses, play a crucial role in RNA silencing and the post-transcriptional regulation of gene expression [13,14]. In human and animal cells, miRNAs predominantly function by destabilizing mRNA [15]. It is estimated that as much as 30% of human genes are regulated by miRNAs [16]. They are instrumental in the regulation of biological processes, including apoptosis, cell differentiation, maturation, and cell proliferation [17,18]. miRNAs are highly stable during storage, are secreted into physiological fluids with minimal degradation, and are easily quantifiable using quantitative polymerase chain reaction, microarray, or sequencing approaches [16]. Numerous prior research have suggested that miRNAs could serve as indicators of cancer therapy response, potentially aiding in the formulation of novel ways to surmount therapeutic resistance [19,20,21,22]. Recent studies have identified the significant function of miRNA in contemporary oncology treatment and its association with radiation [19,21,22].
In the present study, we sequenced the miRNA from tumor tissues before and after treatment among cohorts who underwent standard neoadjuvant CRT followed by TME in locally advanced rectal cancer. We anticipated that evaluating changes in miRNA expression would provide a more precise assessment of the impact of CRT on rectal cancer patients on a biochemical level. Ultimately, our objective was to observe the variation in miRNAs that are influenced and expressed by radiation therapy (RT).
2. Results
2.1. Identification of DE miRNA
To identify miRNA expression patterns related to the CRT, we performed NanoString nCounter assays on tumor samples from the rectal cancer site. The expression of 798 miRNAs was compared between pre-OP and post-OP samples. The results showed an overall tendency for higher miRNA expression in the post-OP compared to the pre-OP group. Significant differences in miRNA expression between the two groups were determined using criteria of |log2(fold change)| > 2 and p-value < 0.05. Compared to the pre-OP group, 93 up-regulated miRNAs were identified in post-OP group. No significantly down-regulated miRNAs were found as none met the fold change criteria (Figure 1, Table 1). Only the top 10 significantly up-regulated miRNAs were used for further analysis.
2.2. DE miRNAs Regulates Cancer Related Pathways
To understand function of the DE miRNAs, we selected top 10 miRNAs and identify target genes using the miRDB and TargetScanHuman databases. A total of 4,622 genes were predicted in miRDB and 7,022 genes in TargetScanHuman, with 3,381 overlapping genes identified (Figure 2A, Table S1). Using these 3,381 genes, we performed KEGG pathway analysis with the DAVID web tool. We identified miRNAs regulate genes in 138 KEGG pathways (Table S2). “MAPK signaling pathway”, “proteoglycans in cancer”, “Ras signaling pathway”, “pathways in cancer” were among some of the most significant pathways (Figure 2B).
2.3. Validation of miRNA Expression
To confirm the reliability of the bioinformatics analysis in identifying DE miRNA, qRT-PCR was performed on 8 samples from the pre-OP group and 12 samples from the post-OP group as written above and to validate the top 10 up-regulated miRNAs. hsa-miR-1-3p and hsa-miR-199a-5p were excluded from further analysis due to reliability concerns, as their raw Ct values were above 35 in most pre-OP group samples. Statistical comparison of the relative expression between the two groups using the Wilcoxon test revealed that 6 out of the 10 miRNAs were significantly upregulated in the post-OP group (Figure 3, Table 2).
3. Discussion
This study aimed to identify miRNA expression changes associated with CRT in rectal cancer. Using NanoString nCounter assays, we compared miRNA expression patterns between pre-OP and post-OP samples and observed an overall trend of increased miRNA expression in the post-OP group. 34 miRNAs were significantly up-regulated and none showed significant down-regulation. To understand the biological significance of the up-regulated miRNAs, the top 10 were selected for target gene prediction using the miRDB and TargetScanHuman databases, which can identify a total of 3,381 genes. KEGG pathway analysis of these genes revealed involvement in 37 pathways, including several cancer-related pathways such as “MAPK signaling pathway,” “proteoglycans in cancer,” “Ras signaling pathway,” and “pathways in cancer.” This pathway enrichment suggests that these upregulated miRNAs may play important roles in suppressing genes involved in cancer progression. To validate the findings from the DE analysis, qRT-PCR was conducted on a subset of samples, confirming that 6 of the top 10 up-regulated miRNAs were significantly elevated in the post-OP group: hsa-miR-143-3p, hsa-miR-145-5p, hsa-miR-99a-5p, hsa-miR-125b-5p, hsa-miR-100-5p, and hsa-let-7c-5p. Our study results showed several concordant or disparate results compared to previous research works related to miRNA studies in rectal cancer [22,23].
Among the upregulated miRNAs, miR-143, miR-145-5p, miR-99a-5p, let-7c, miR-100-5p, and miR-125b-5p have been reported as tumor suppressors in various cancer types. miR-143 and miR-145-5p inhibit EMT-related genes, including CXCR4, vimentin, and snail-1, reducing cancer cell invasion and proliferation in lung, prostate, and ovarian cancers [24,25,26,27]. miR-145 acts as a tumor suppressor in various cancers and is downregulated in colorectal cancer. Increased miR-145 expression inhibits colorectal adenocarcinoma cell growth and metastasis through regulation of mesothelin expression [28]. Similarly, miR-143 is frequently downregulated in colorectal cancer, and its upregulation following CRT may contribute to enhanced therapeutic efficacy by suppressing tumor cell proliferation and metastasis.
miR-99a-5p induces cellular senescence and enhances sensitivity to chemotherapy agents, such as gemcitabine, potentially overcoming treatment resistance [29]. Although miR-99a is recognized as a tumor suppressor with decreased expression observed in various cancer types [29,30], specific studies in rectal cancer following CRT remain limited. Thus, the observed increase in miR-99a-5p expression in this study suggests a potential role in suppressing tumor cell proliferation and improving therapeutic response.
let-7c inhibits the expression of oncogenic genes such as N-RAS, C-MYC, and MMP-1, and reduces proliferation and migration in several cancers [31,32]. Members of the let-7 miRNA family are frequently downregulated tumor suppressors in multiple cancer types. Increased let-7c-5p expression after CRT could similarly suppress tumor cell growth and metastasis [33].
miR-100-5p and miR-125b-5p also exhibit tumor-suppressive functions. miR-100-5p inhibits tumor progression in non-small cell lung cancer and hepatocellular carcinoma by targeting oncogenic regulators such as HOXA1, SMARCA5, and PLK1 [34,35,36]. miR-100 has been linked to radiation resistance in CRC cells, which means that its higher levels after treatment may affect how well the treatment works [37].
miR-125b-5p suppresses malignant phenotypes in endometrial cancer [38] and serves as a prognostic factor in CRC. However, studies on miR-125b present conflicting results; certain studies have linked elevated miR-125b expression to increased tumor size and decreased survival, whereas others reported that high miR-125b-2-3p levels correlate with improved 5-year survival rates [39,40]. These divergent findings suggest that the role of miR-125b may depend significantly on the tumor’s genetic background and therapeutic context.
The increased expression of these miRNAs after CRT may influence tumor cell proliferation, invasion, and metastasis, contributing significantly to treatment responses and clinical outcomes. Certain miRNAs are also implicated in regulating immune responses, potentially inhibiting immune evasion mechanisms or enhancing immune cell activation within the tumor microenvironment. Monitoring changes in these miRNA expressions could offer helpful tips for predicting therapeutic efficacy and establishing personalized treatment strategies. Further studies considering genetic backgrounds, treatment modalities, and patient-specific factors are required to clarify the distinct roles of individual miRNAs.
Our KEGG pathway enrichment analysis of DE miRNAs identified after CRT highlighted four significantly associated pathways: the “MAPK signaling pathway,” “proteoglycans in cancer,” “Ras signaling pathway,” and general “cancer-related pathways.” These signaling cascades are not only critical in tumorigenesis but also intimately involved in modulating the tumor immune microenvironment following the therapeutic intervention.
The MAPK pathway regulates immune checkpoint molecules such as PD-L1, thereby influencing T cell-mediated anti-tumor immunity after radiation exposure [41]. Proteoglycans contribute to the regulation of immune cell trafficking and cytokine bioavailability, ultimately impacting immune surveillance and tumor immune evasion mechanisms [42]. The “Ras signaling pathway,” frequently dysregulated in cancer, alters cytokine production and antigen presentation capabilities, thus modulating both innate and adaptive immune responses [43]. The involvement of the broader "pathways in cancer" network further highlights the complexity of immunological responses triggered by CRT, where pro-tumor and anti-tumor immune mechanisms may coexist or compete [44].
Recent studies have reported that CRT induces new somatic mutations and neoantigen production in rectal cancer, leading to increased T cell infiltration and enhanced immune responses [45,46]. Increased PD-L1 expression combined with elevated CD8+ T cell infiltration has also been associated with significantly improved disease-free and overall survival [47]. The observed upregulation of miRNAs and activation of immune-related pathways such as MAPK and Ras signaling in the present study may reflect similar alterations in the tumor immune microenvironment.
Changes in miRNA expression patterns following CRT may contribute to the reprogramming of the immune microenvironment by regulating PD-L1 expression and enhancing CD8+ T cell infiltration, potentially influencing treatment response and clinical outcomes. Specific miRNAs may serve not only as biomarkers for treatment response but also as key modulators of immunogenicity in rectal cancer. Further studies are needed to investigate the correlations among miRNA expression, PD-L1 status, and immune infiltration markers, such as CD8+ T cells, in order to clarify the underlying immunological mechanisms.
Although our research results showed some discrepancies compared with other past studies, ours were verified through qRT-PCR and demonstrated some consistent results comparing to prior studies [22,23]. The main limitation is that we could not observe the distinctive outcomes depending on different tumor responses due to the sample sizes and we need to validate these findings in future studies. Also recent changes in treatment trends in rectal cancer and its relation to different molecular results need to be clarified.
In conclusion, we found and validated significant DE miRNAs (hsa-miR-143-3p, hsa-miR-145-5p, hsa-miR-99a-5p, hsa-miR-125b-5p, hsa-miR-100-5p, hsa-let-7c-5p) in post-OP group compared to pre-OP group in patients with rectal cancer undergoing concurrent CRT. We also discovered that DE miRNAs regulate several significant cancer-related pathways. These miRNAs might serve as the key molecules in CRT-induced suppression of tumor progression and immunomodulation. Future studies need to explore the further role of miRNAs as biomarkers in the field of CRT.
4. Materials and Methods
4.1. Patients
We obtained institutional review board approval before study initiation (IRB no: UC18SNS0143). All included patients were diagnosed with biopsy-proven locally advanced rectal cancer and whole-body staging work-up. They underwent preoperative CRT followed by radical TME surgery. Preoperative (pre-OP) and postoperative (post-OP) samples were acquired from diagnostic biopsy and TME surgery specimens, respectively. The study enrolled and evaluated a total of 79 cancer samples, including 36 in the pre-OP group and 43 in the post-OP group. For the miRNA study, pre-OP and post-OP samples were analyzed in 10-20 formalin-fixed, paraffin-embedded (FFPE) tissue samples. In FFPE samples, the most representative regions of the tumor tissue (at least 60% of tumor cells) were examined and included by a specialized pathologist. The characteristics of Pre-OP and post-OP samples are described in Table 3.
4.2. RNA Extraction and Quantification
Total RNA was then extracted using a miRNeasy FFPE kit (QIAGEN). RNA yield and purity were assessed using a DS 11 Spectrophotometer (Denovix Inc., DE, USA). According to the manufacturer’s recommendations, NanoString recommends using more than >100 ng total RNA, as this amount of input material generates a robust signal for most tissue/cell isolates. Therefore, more than 300 ng of total RNA was added to the sample preparation reaction within the available 3 μL volume. Finally, RNA quality was assessed using the Fragment Analyzer from Advanced Analytical Technologies (IA, USA).
4.3. miRNA Microarray Expression by NanoString
nCounter miRNA expression assay (Nanostring Technologies, Seattle, WA) was performed using more than 300 ng of miRNA and the Human miRNA v3 Assay Kit. The miRNA sample was used for the miRNA tag ligation reaction, after which the tagged miRNAs were hybridized with the human miRNA codeset for 18 hours at 65 °C and then processed according to the manufacturer’s instructions.
Excess probes were removed using two-step magnetic bead-based purification on the nCounter Prep Station (NanoString Technologies). Abundances of specific target molecules were quantified on the nCounter Digital Analyzer by counting the individual fluorescent barcodes and assessing the target molecules. For each assay, a high-density scan encompassing 280 fields of view was performed. The data was collected using the nCounter Digital Analyzer after taking images of the immobilized fluorescent reporters in the sample cartridge with a CCD camera.
4.4. miRNA Expression Analysis
Nanostring data was normalized using the NanoTube (v.1.8.0) R package [48]. Raw counts were scaled by comparing the geometric mean of positive control features between samples. Genes were removed if at least 50% of samples had values less than 2 s.d. above the mean of negative controls. Next, counts were scaled by comparing the geometric mean of housekeeping genes between samples.
Differential expression analysis between the pre-OP and post-OP groups was performed with the limma (v.3.58.1) R package. Differentially expressed (DE) miRNA were identified with using thresholds of a log fold-change (FC) of ≥1 and a p-value of ≤0.05.
4.5. Functional Analysis
Target genes of the top 10 upregulated miRNAs were predicted using miRDB and TargetScanHuman databases [49,50]. Only genes predicted by both databases and with a miRDB score ≥ 80 were selected for further analysis.
Functional enrichment analysis of predicted target genes was performed using Kyoto Encyclopedia of Genes and Genomes (KEGG) pathway analysis via the DAVID web tool [51]. Pathways with Benjamini-adjusted p-values < 0.05 were considered statistically significant.
4.6. qRT-PCR Validation
Total RNA, which includes miRNAs, was quantified using a NanoDrop™ spectrophotometer (Thermo Scientific). To synthesize cDNA from total RNA, gene-specific primers were employed following the TaqMan miRNA assay protocol (Applied Biosystems). The reverse transcriptase reactions included 1-10 ng of RNA samples, miRNA specific RT primer, dNTPs (deoxynucleotide triphosphates), Multiscribe Reserve Transcriptase, Reverse transcription Buffer, RNase inhibitor. The reaction mixtures were incubated in a thermal Cycler within a 384-well plate for 30 min at 16℃, followed by 30 min at 42℃, 5 min at 85℃ and then held at 4℃. The resulting synthesized cDNA samples were stored at - 20℃ until they were ready for further use.
Real-time PCR was performed using an Applied Biosystems Viia 7 system. Each 10 µL PCR reaction included the RT product, TaqMan Universal PCR master mix, and the primers and probe mix specified by the TaqMan MicroRNA Assay protocol. The primer details are provided in Supplementary Table S3. The PCR reactions were carried out in a 384-well plate with an initial incubation at 95°C for 20 s, followed by 40 cycles of 95°C for 1 s and 60° for 20 s. The Ct cut-off for lower limit of detection was set at 35. U6 snRNA served as the endogenous control, and the expression of each miRNA was normalized to the expression of U6 snRNA.
4.7. Validation of miRNA Using qRT-PCR
Validation of up-regulated DE miRNA was performed using qRT-PCR with 8 samples of pre-OP groups and 12 samples of post-OP group. The characteristics of the Pre-OP and post-OP samples used for validation are described in Table 4. Relative expression of miRNAs was calculated by the delta-delta-cycle threshold (ΔΔCt) method. U6 snRNA was used as an endogenous control for expression normalization, and ΔΔCt was calculated as the difference between pre-OP and post-OP group ΔCt.
Supplementary Materials
The following supporting information can be downloaded at the website of this paper posted on Preprints.org. Table S1: Predicted target genes; Table S2: Kegg pathway analysis of predicted target genes; Table S3: List of primers of targets and the housekeeping gene.
Author Contributions
Conceptualization, M.Lee and DS.Lee.; validation, M.Lee, J.Park and DS.Lee.; formal analysis, H.Shim and M.Lee.; investigation, DS.Lee, M. Dohopolski and YH.Ko; resources, M.Lee and DS.Lee.; writing—original draft preparation, H.Shim and DS.Lee.; writing—review and editing, M.Lee and DS.Lee.; visualization, H.Shim.; supervision, M.Lee, DS.Lee and YH.Ko.; funding acquisition, DS.Lee.
Funding
This work was supported by the National Research Foundation of Korea (NRF) grant funded by the Korea government (MSIT) (No. RS-2023-00246209).
Institutional Review Board Statement
The study was conducted in accordance with the Declaration of Helsinki, and approved by the Institutional Review Board (IRB no: UC18SNS0143).
Informed Consent Statement
Patient consent was waived due to the nature of the study (Study using Human Biological Data Bank).
Acknowledgments
The authors have reviewed and edited the output and take full responsibility for the content of this publication.
Conflicts of Interest
The authors declare no conflicts of interest.
References
- Siegel, R.L. Cancer statistics, 2025. CA Cancer J Clin 2025, 75(1), 10–45. [Google Scholar] [CrossRef]
- Park, E.H. Cancer Statistics in Korea: Incidence, Mortality, Survival, and Prevalence in 2021. Cancer Res Treat 2024, 56(2), 357–371. [Google Scholar] [CrossRef]
- Gmeiner, W.H. Recent Advances in Therapeutic Strategies to Improve Colorectal Cancer Treatment. Cancers (Basel) 2024, 16(5). [Google Scholar] [CrossRef]
- Maida, M. Screening of colorectal cancer: present and future. Expert Rev Anticancer Ther 2017, 17(12), 1131–1146. [Google Scholar] [CrossRef] [PubMed]
- Schreuders, E.H. Colorectal cancer screening: a global overview of existing programmes. Gut 2015, 64(10), 1637-49. [Google Scholar] [CrossRef] [PubMed]
- Franke, A.J. Total Neoadjuvant Therapy: A Shifting Paradigm in Locally Advanced Rectal Cancer Management. Clin Colorectal Cancer 2018, 17(1), 1–12. [Google Scholar] [CrossRef] [PubMed]
- Kasi, A. Total Neoadjuvant Therapy vs Standard Therapy in Locally Advanced Rectal Cancer: A Systematic Review and Meta-analysis. JAMA Netw Open 2020, 3(12), e2030097. [Google Scholar] [CrossRef]
- Chen, C.C. The Effects of Neoadjuvant Treatment on the Tumor Microenvironment in Rectal Cancer: Implications for Immune Activation and Therapy Response. Clin Colorectal Cancer 2020, 19(4), e164–e180. [Google Scholar] [CrossRef]
- Su, W. Tumor microenvironment remodeling after neoadjuvant chemoradiotherapy in local advanced rectal cancer revealed by single-cell RNA sequencing. J Transl Med 2024, 22(1), 1037. [Google Scholar] [CrossRef]
- Tayshetye, P. Tumor Microenvironment before and after Chemoradiation in Locally Advanced Rectal Cancer: Beyond PD-L1. Cancers (Basel) 2022, 15(1). [Google Scholar] [CrossRef]
- Yasui, K. Effect of preoperative chemoradiotherapy on the immunological status of rectal cancer patients. J Radiat Res 2020, 61(5), 766–775. [Google Scholar] [CrossRef] [PubMed]
- Bartel, D.P. Metazoan MicroRNAs. Cell 2018, 173(1), 20–51. [Google Scholar] [CrossRef] [PubMed]
- Bartel, D.P. MicroRNAs: genomics, biogenesis, mechanism, and function. Cell 2004, 116(2), 281-97. [Google Scholar] [CrossRef] [PubMed]
- Qureshi, A. VIRmiRNA: a comprehensive resource for experimentally validated viral miRNAs and their targets.; Database (Oxford), 2014. [Google Scholar]
- Jonas, S.; Izaurralde, E. Towards a molecular understanding of microRNA-mediated gene silencing. Nat Rev Genet 2015, 16(7), 421-33. [Google Scholar] [CrossRef]
- Yang, Y. Current status of surgical treatment of rectal cancer in China. Chin Med J (Engl) 2020, 133(22), 2703–2711. [Google Scholar] [CrossRef]
- Dong, H. MicroRNA: function, detection, and bioanalysis. Chem Rev 2013, 113(8), 6207-33. [Google Scholar] [CrossRef]
- Inui, M.; Martello, G.; Piccolo, S. MicroRNA control of signal transduction. Nat Rev Mol Cell Biol 2010, 11(4), 252-63. [Google Scholar] [CrossRef]
- Abd El Fattah, Y.K. CCDC144NL-AS1/hsa-miR-143-3p/HMGA2 interaction: In-silico and clinically implicated in CRC progression, correlated to tumor stage and size in case-controlled study; step toward ncRNA precision. Int J Biol Macromol 2023, 253 Pt 2, 126739. [Google Scholar] [CrossRef]
- Jakob, M. MicroRNA expression patterns in oral squamous cell carcinoma: hsa-mir-99b-3p and hsa-mir-100-5p as novel prognostic markers for oral cancer. Head Neck 2019, 41(10), 3499–3515. [Google Scholar] [CrossRef]
- Wu, F. Screening of MicroRNA Related to Irradiation Response and the Regulation Mechanism of miRNA-96-5p in Rectal Cancer Cells. Front Oncol 2021, 11, 699475. [Google Scholar] [CrossRef]
- Yang, I.P. MicroRNAs as Predictive Biomarkers in Patients with Colorectal Cancer Receiving Chemotherapy or Chemoradiotherapy: A Narrative Literature Review. Cancers (Basel) 2023, 15(5). [Google Scholar] [CrossRef] [PubMed]
- Losurdo, P. microRNAs combined to radiomic features as a predictor of complete clinical response after neoadjuvant radio-chemotherapy for locally advanced rectal cancer: a preliminary study. Surg Endosc 2023, 37(5), 3676–3683. [Google Scholar] [CrossRef] [PubMed]
- Asghariazar, V. MicroRNA-143 act as a tumor suppressor microRNA in human lung cancer cells by inhibiting cell proliferation, invasion, and migration. Mol Biol Rep 2022, 49(8), 7637–7647. [Google Scholar] [CrossRef] [PubMed]
- Chang, Y. miR-145-5p inhibits epithelial-mesenchymal transition via the JNK signaling pathway by targeting MAP3K1 in non-small cell lung cancer cells. Oncol Lett 2017, 14(6), 6923–6928. [Google Scholar] [CrossRef]
- Ozen, M. Overexpression of miR-145-5p inhibits proliferation of prostate cancer cells and reduces SOX2 expression. Cancer Invest 2015, 33(6), 251-8. [Google Scholar] [CrossRef]
- Dong, R. miR-145 inhibits tumor growth and metastasis by targeting metadherin in high-grade serous ovarian carcinoma. Oncotarget 2014, 5(21), 10816-29. [Google Scholar] [CrossRef]
- Li, J. Effects of hsa-mir-145-5p on the Regulation of msln Expression in Colorectal Adenocarcinoma. Anal Cell Pathol (Amst) 2022, 2022, 5587084. [Google Scholar] [CrossRef]
- Tamai, M. microRNA-99a-5p induces cellular senescence in gemcitabine-resistant bladder cancer by targeting SMARCD1. Mol Oncol 2022, 16(6), 1329–1346. [Google Scholar] [CrossRef]
- Gu, A.; Bao, X. MiR-99a-5p Constrains Epithelial-Mesenchymal Transition of Cervical Squamous Cell Carcinoma Via Targeting CDC25A/IL6. Mol Biotechnol 2022, 64(11), 1234–1243. [Google Scholar] [CrossRef]
- Mortazavi, D.; Sharifi, M. Antiproliferative effect of upregulation of hsa-let-7c-5p in human acute erythroleukemia cells. Cytotechnology 2018, 70(6), 1509–1518. [Google Scholar] [CrossRef]
- Shao, L. Delivery of MicroRNA-let-7c-5p by Biodegradable Silica Nanoparticles Suppresses Human Cervical Carcinoma Cell Proliferation and Migration. J Biomed Nanotechnol 2020, 16(11), 1600–1611. [Google Scholar] [CrossRef] [PubMed]
- Mozammel, N. The Simultaneous Effects of miR-145-5p and hsa-let-7a-3p on Colorectal Tumorigenesis: In Vitro Evidence. Adv Pharm Bull 2024, 14(1), 231–240. [Google Scholar]
- Chen, P.; Zhao, X.; Ma, L. Downregulation of microRNA-100 correlates with tumor progression and poor prognosis in hepatocellular carcinoma. Mol Cell Biochem 2013, 383(1-2), 49–58. [Google Scholar] [CrossRef] [PubMed]
- Chen, D. miR-100 induces epithelial-mesenchymal transition but suppresses tumorigenesis, migration and invasion. PLoS Genet 2014, 10(2), e1004177. [Google Scholar] [CrossRef] [PubMed]
- Han, W. microRNA-100 functions as a tumor suppressor in non-small cell lung cancer via regulating epithelial-mesenchymal transition and Wnt/beta-catenin by targeting HOXA1. Thorac Cancer 2020, 11(6), 1679–1688. [Google Scholar] [CrossRef]
- Yang, X.D. Role of miR-100 in the radioresistance of colorectal cancer cells. Am J Cancer Res 2015, 5(2), 545-59. [Google Scholar]
- Pan, S. MiR-125b-5p Targets MTFP1 to Inhibit Cell Proliferation, Migration, and Invasion and Facilitate Cell Apoptosis in Endometrial Carcinoma. Mol Biotechnol 2023, 65(6), 961–969. [Google Scholar] [CrossRef]
- Zeng, Z.L. The lncRNA XIST/miR-125b-2-3p axis modulates cell proliferation and chemotherapeutic sensitivity via targeting Wee1 in colorectal cancer. Cancer Med 2021, 10(7), 2423–2441. [Google Scholar] [CrossRef]
- Nishida, N. MicroRNA miR-125b is a prognostic marker in human colorectal cancer. Int J Oncol 2011, 38(5), 1437-43. [Google Scholar]
- Liu, S. Radiotherapy remodels the tumor microenvironment for enhancing immunotherapeutic sensitivity. Cell Death Dis 2023, 14(10), 679. [Google Scholar] [CrossRef]
- Tzanakakis, G. Proteoglycans and Immunobiology of Cancer-Therapeutic Implications. Front Immunol 2019, 10, 875. [Google Scholar] [CrossRef]
- Dong, Z.Y. Potential Predictive Value of TP53 and KRAS Mutation Status for Response to PD-1 Blockade Immunotherapy in Lung Adenocarcinoma. Clin Cancer Res 2017, 23(12), 3012–3024. [Google Scholar] [CrossRef]
- Demaria, S. Radiation dose and fraction in immunotherapy: one-size regimen does not fit all settings, so how does one choose? J Immunother Cancer 2021, 9(4). [Google Scholar] [CrossRef] [PubMed]
- Ji, D. Somatic Mutations and Immune Alternation in Rectal Cancer Following Neoadjuvant Chemoradiotherapy. Cancer Immunol Res 2018, 6(11), 1401–1416. [Google Scholar] [CrossRef] [PubMed]
- Zhang, H. Neoadjuvant therapy alters the immune microenvironment in pancreatic cancer. Front Immunol 2022, 13, 956984. [Google Scholar] [CrossRef]
- Fakih, M. High PD-L1 expression and high CD8+T-cell infiltration identifies a new subpopulation of colorectal cancer with high risk of relapse and poor outcome. Annals of Oncology 2017, 28. [Google Scholar] [CrossRef]
- Class, C.A. Easy NanoString nCounter data analysis with the NanoTube. Bioinformatics 2023, 39(1). [Google Scholar] [CrossRef]
- Agarwal, V. Predicting effective microRNA target sites in mammalian mRNAs. Elife 2015. [Google Scholar] [CrossRef]
- Chen, Y.; Wang, X. miRDB: an online database for prediction of functional microRNA targets. Nucleic Acids Res 2020, 48(D1), D127–D131. [Google Scholar] [CrossRef]
- Sherman, B.T. DAVID: a web server for functional enrichment analysis and functional annotation of gene lists (2021 update). Nucleic Acids Res 2022, 50(W1), W216–W221. [Google Scholar] [CrossRef]
Figure 1.
The volcano plot depicts the upregulated (red) miRNAs that showed a log2 fold change > 1 with p-value of <0.05. The log2 fold change is on the x-axis, and the negative log of the p-value is on the y-axis. The black dots represent the miRNAs that do not pass the filter parameters.
Figure 1.
The volcano plot depicts the upregulated (red) miRNAs that showed a log2 fold change > 1 with p-value of <0.05. The log2 fold change is on the x-axis, and the negative log of the p-value is on the y-axis. The black dots represent the miRNAs that do not pass the filter parameters.
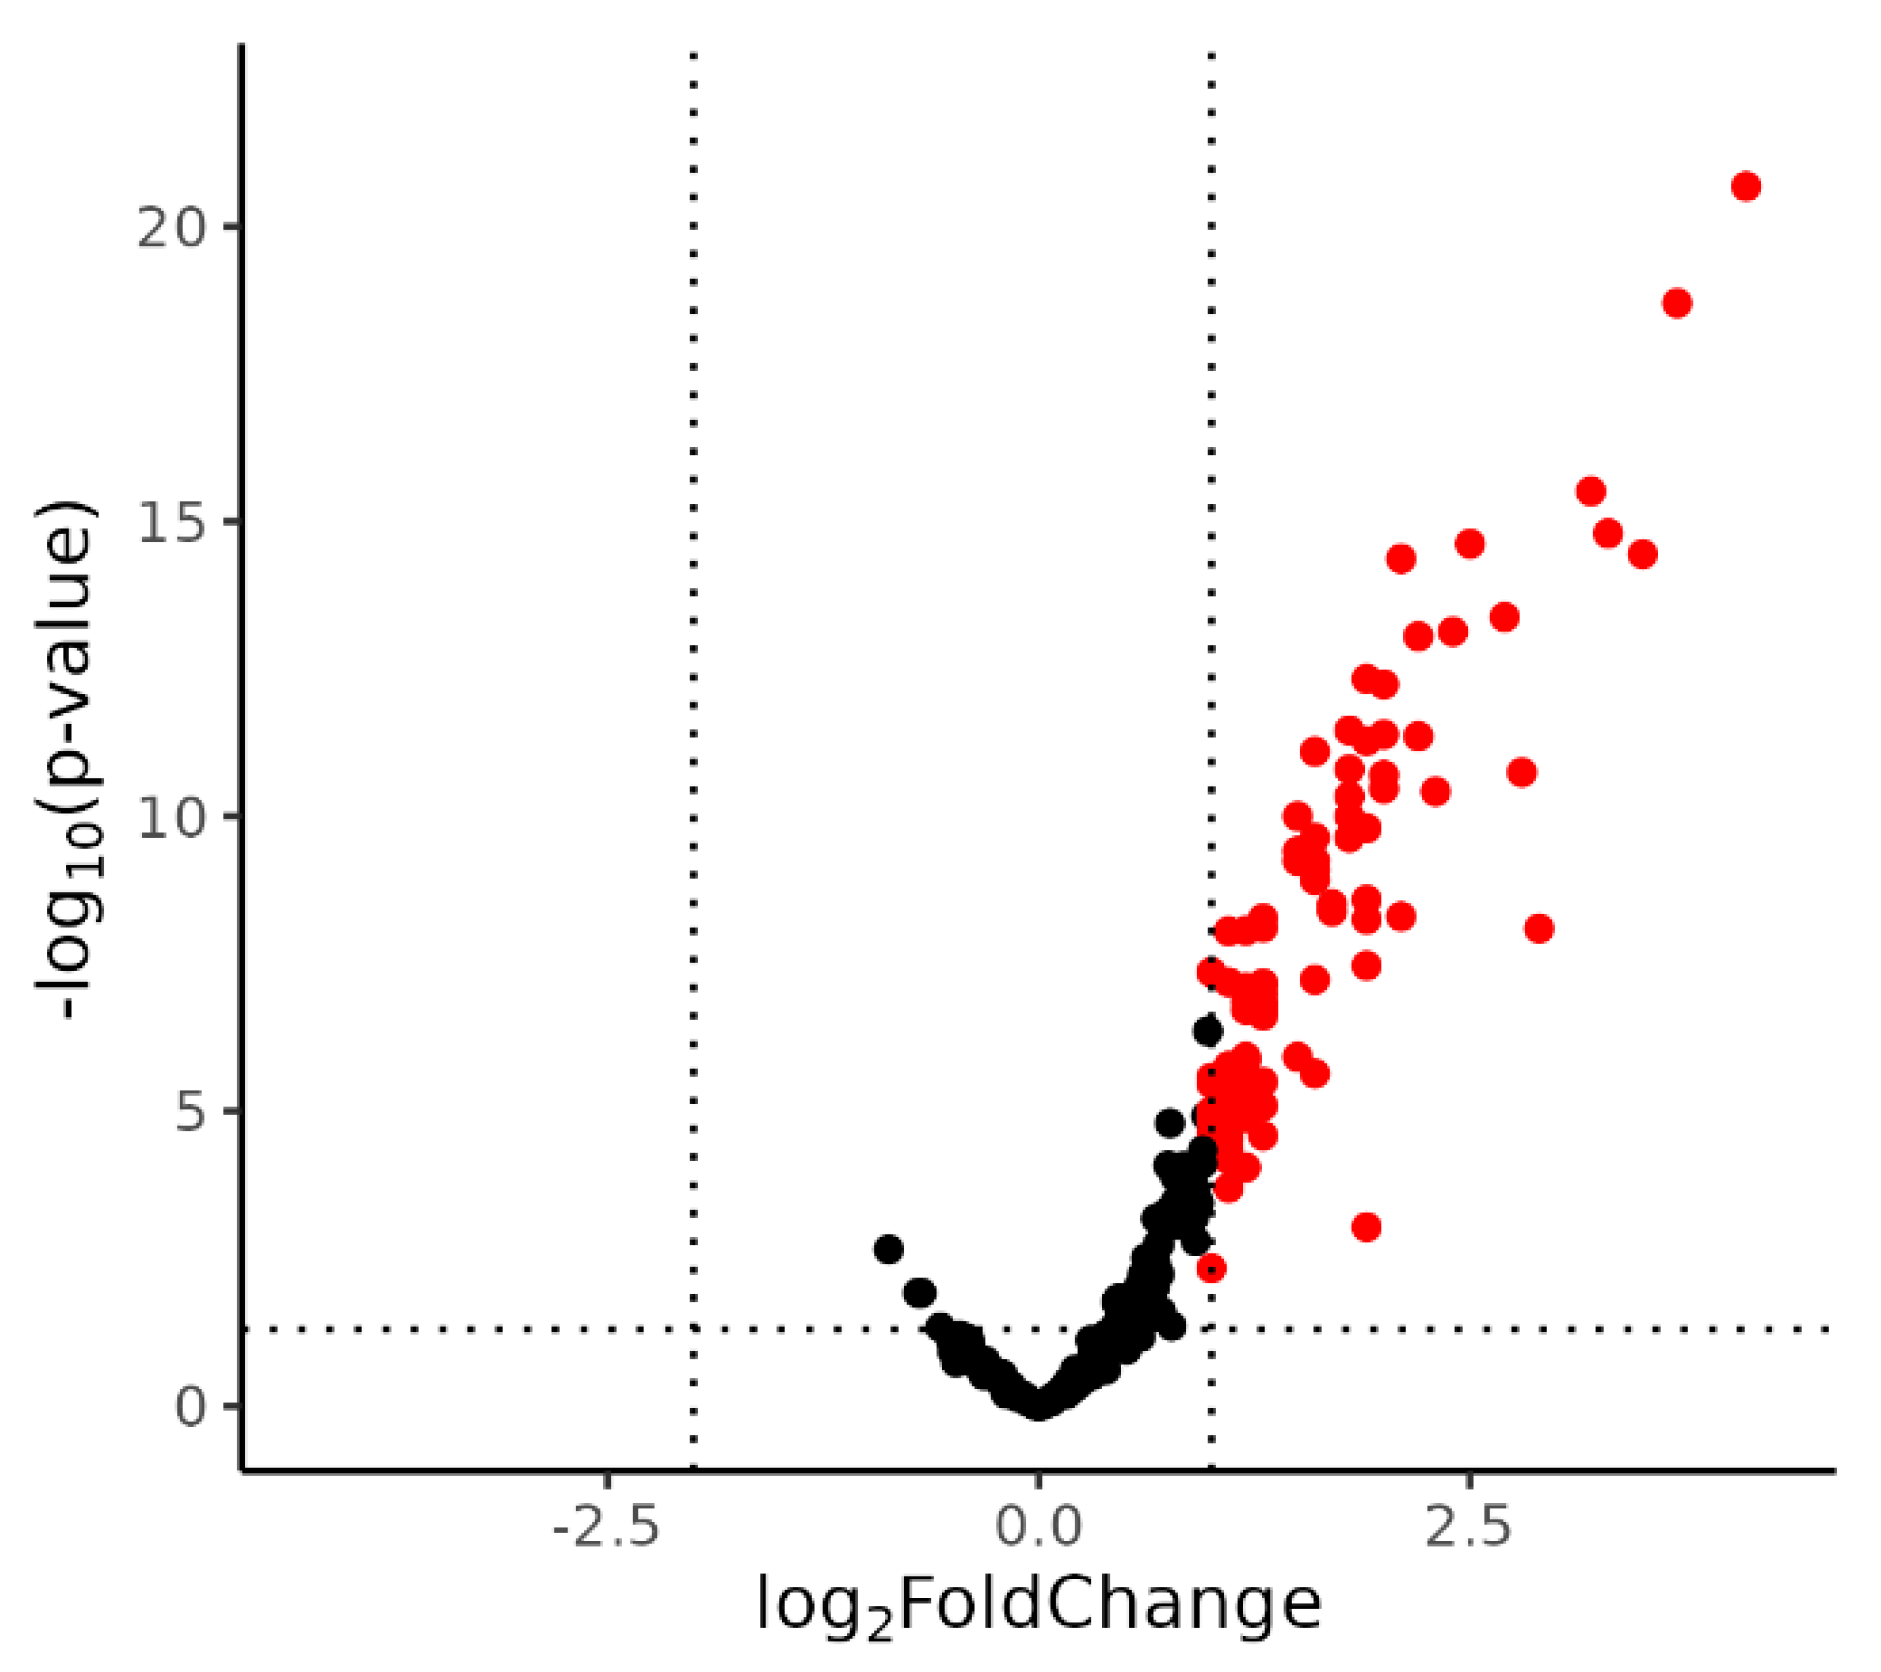
Figure 2.
Results of miRNA target gene functional analysis (A) Venn diagram shows the number of predicted target genes for the top 10 upregulated miRNAs in post-OP group identified by both miRDB and TargetScanHuman. (B) Bar plot shows the most significant KEGG pathways identified through pathway enrichment analysis of the 3,381 predicted target genes.
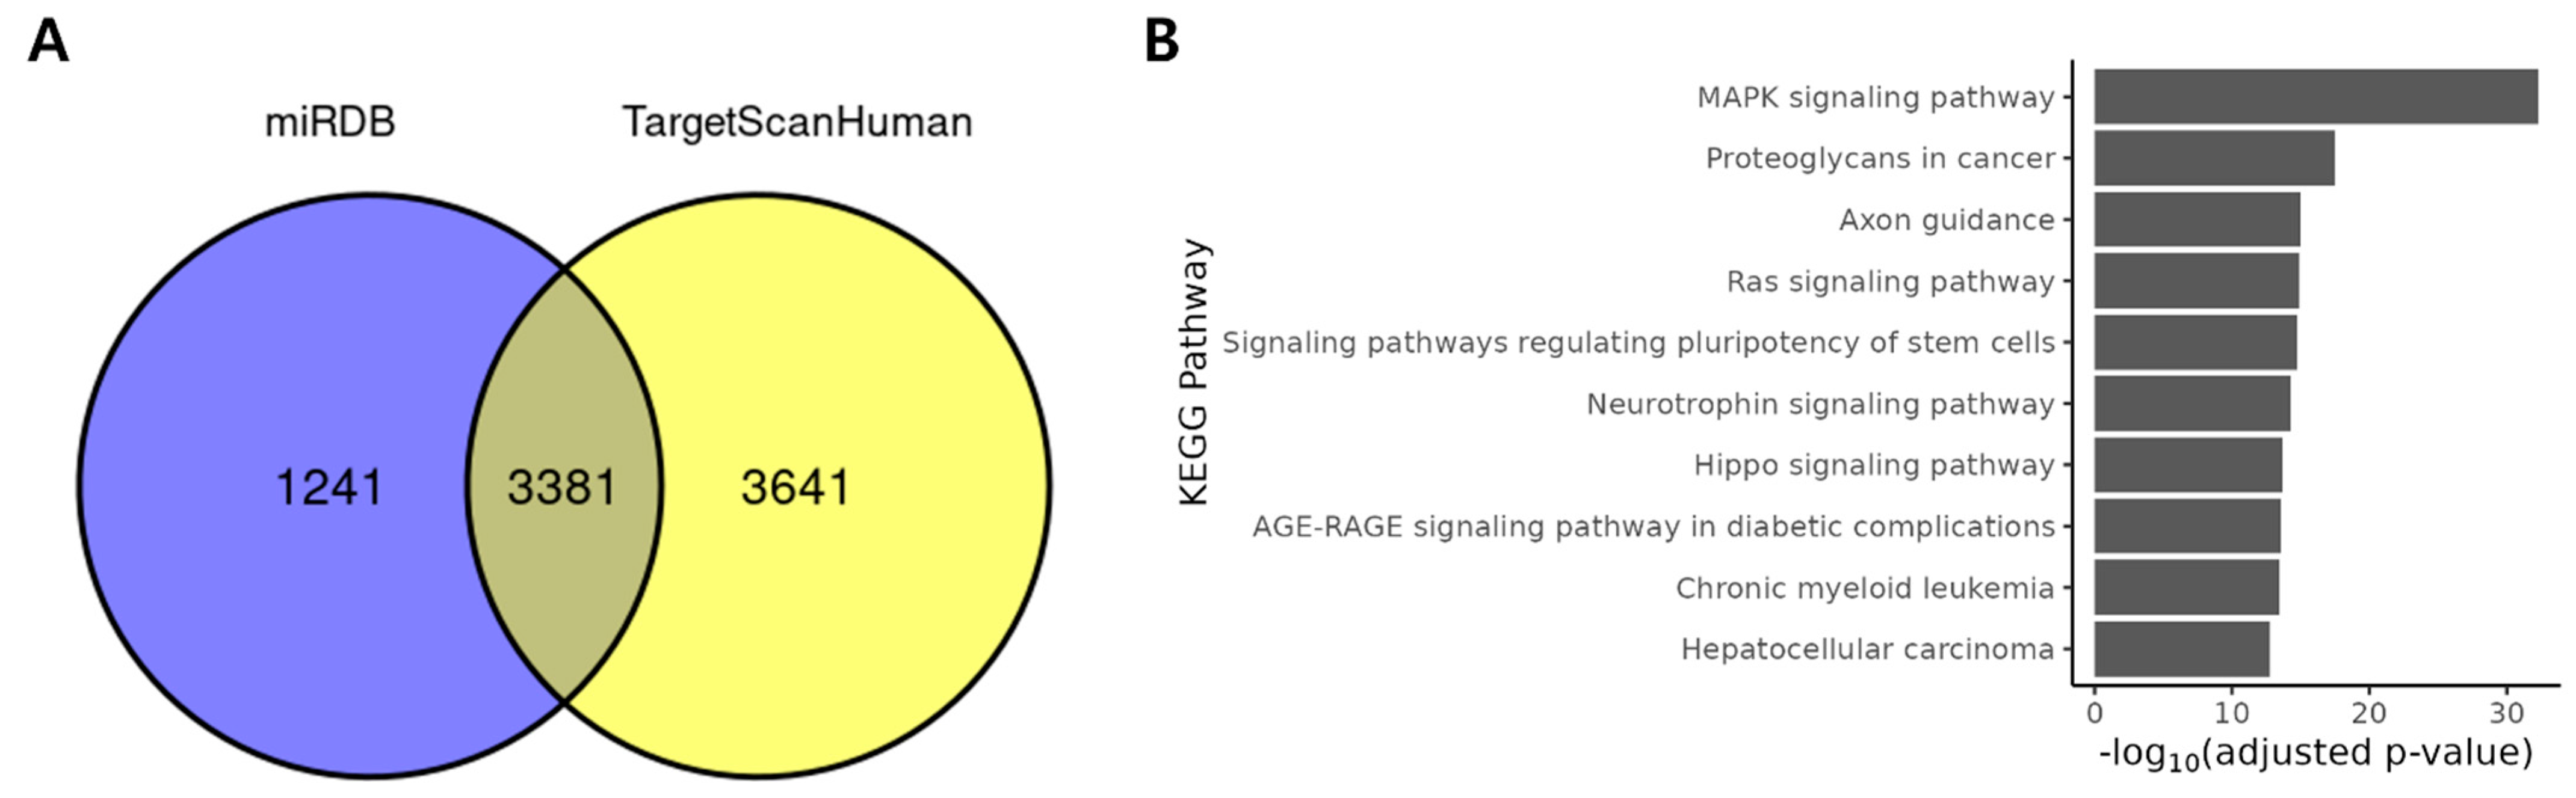
Figure 3.
Expression pattern of the top 10 upregulated miRNAs by qRT-PCR. Boxplot showing the relative expression levels of the top 10 upregulated miRNAs in pre-OP and post-OP samples as measured by qRT-PCR.
Figure 3.
Expression pattern of the top 10 upregulated miRNAs by qRT-PCR. Boxplot showing the relative expression levels of the top 10 upregulated miRNAs in pre-OP and post-OP samples as measured by qRT-PCR.
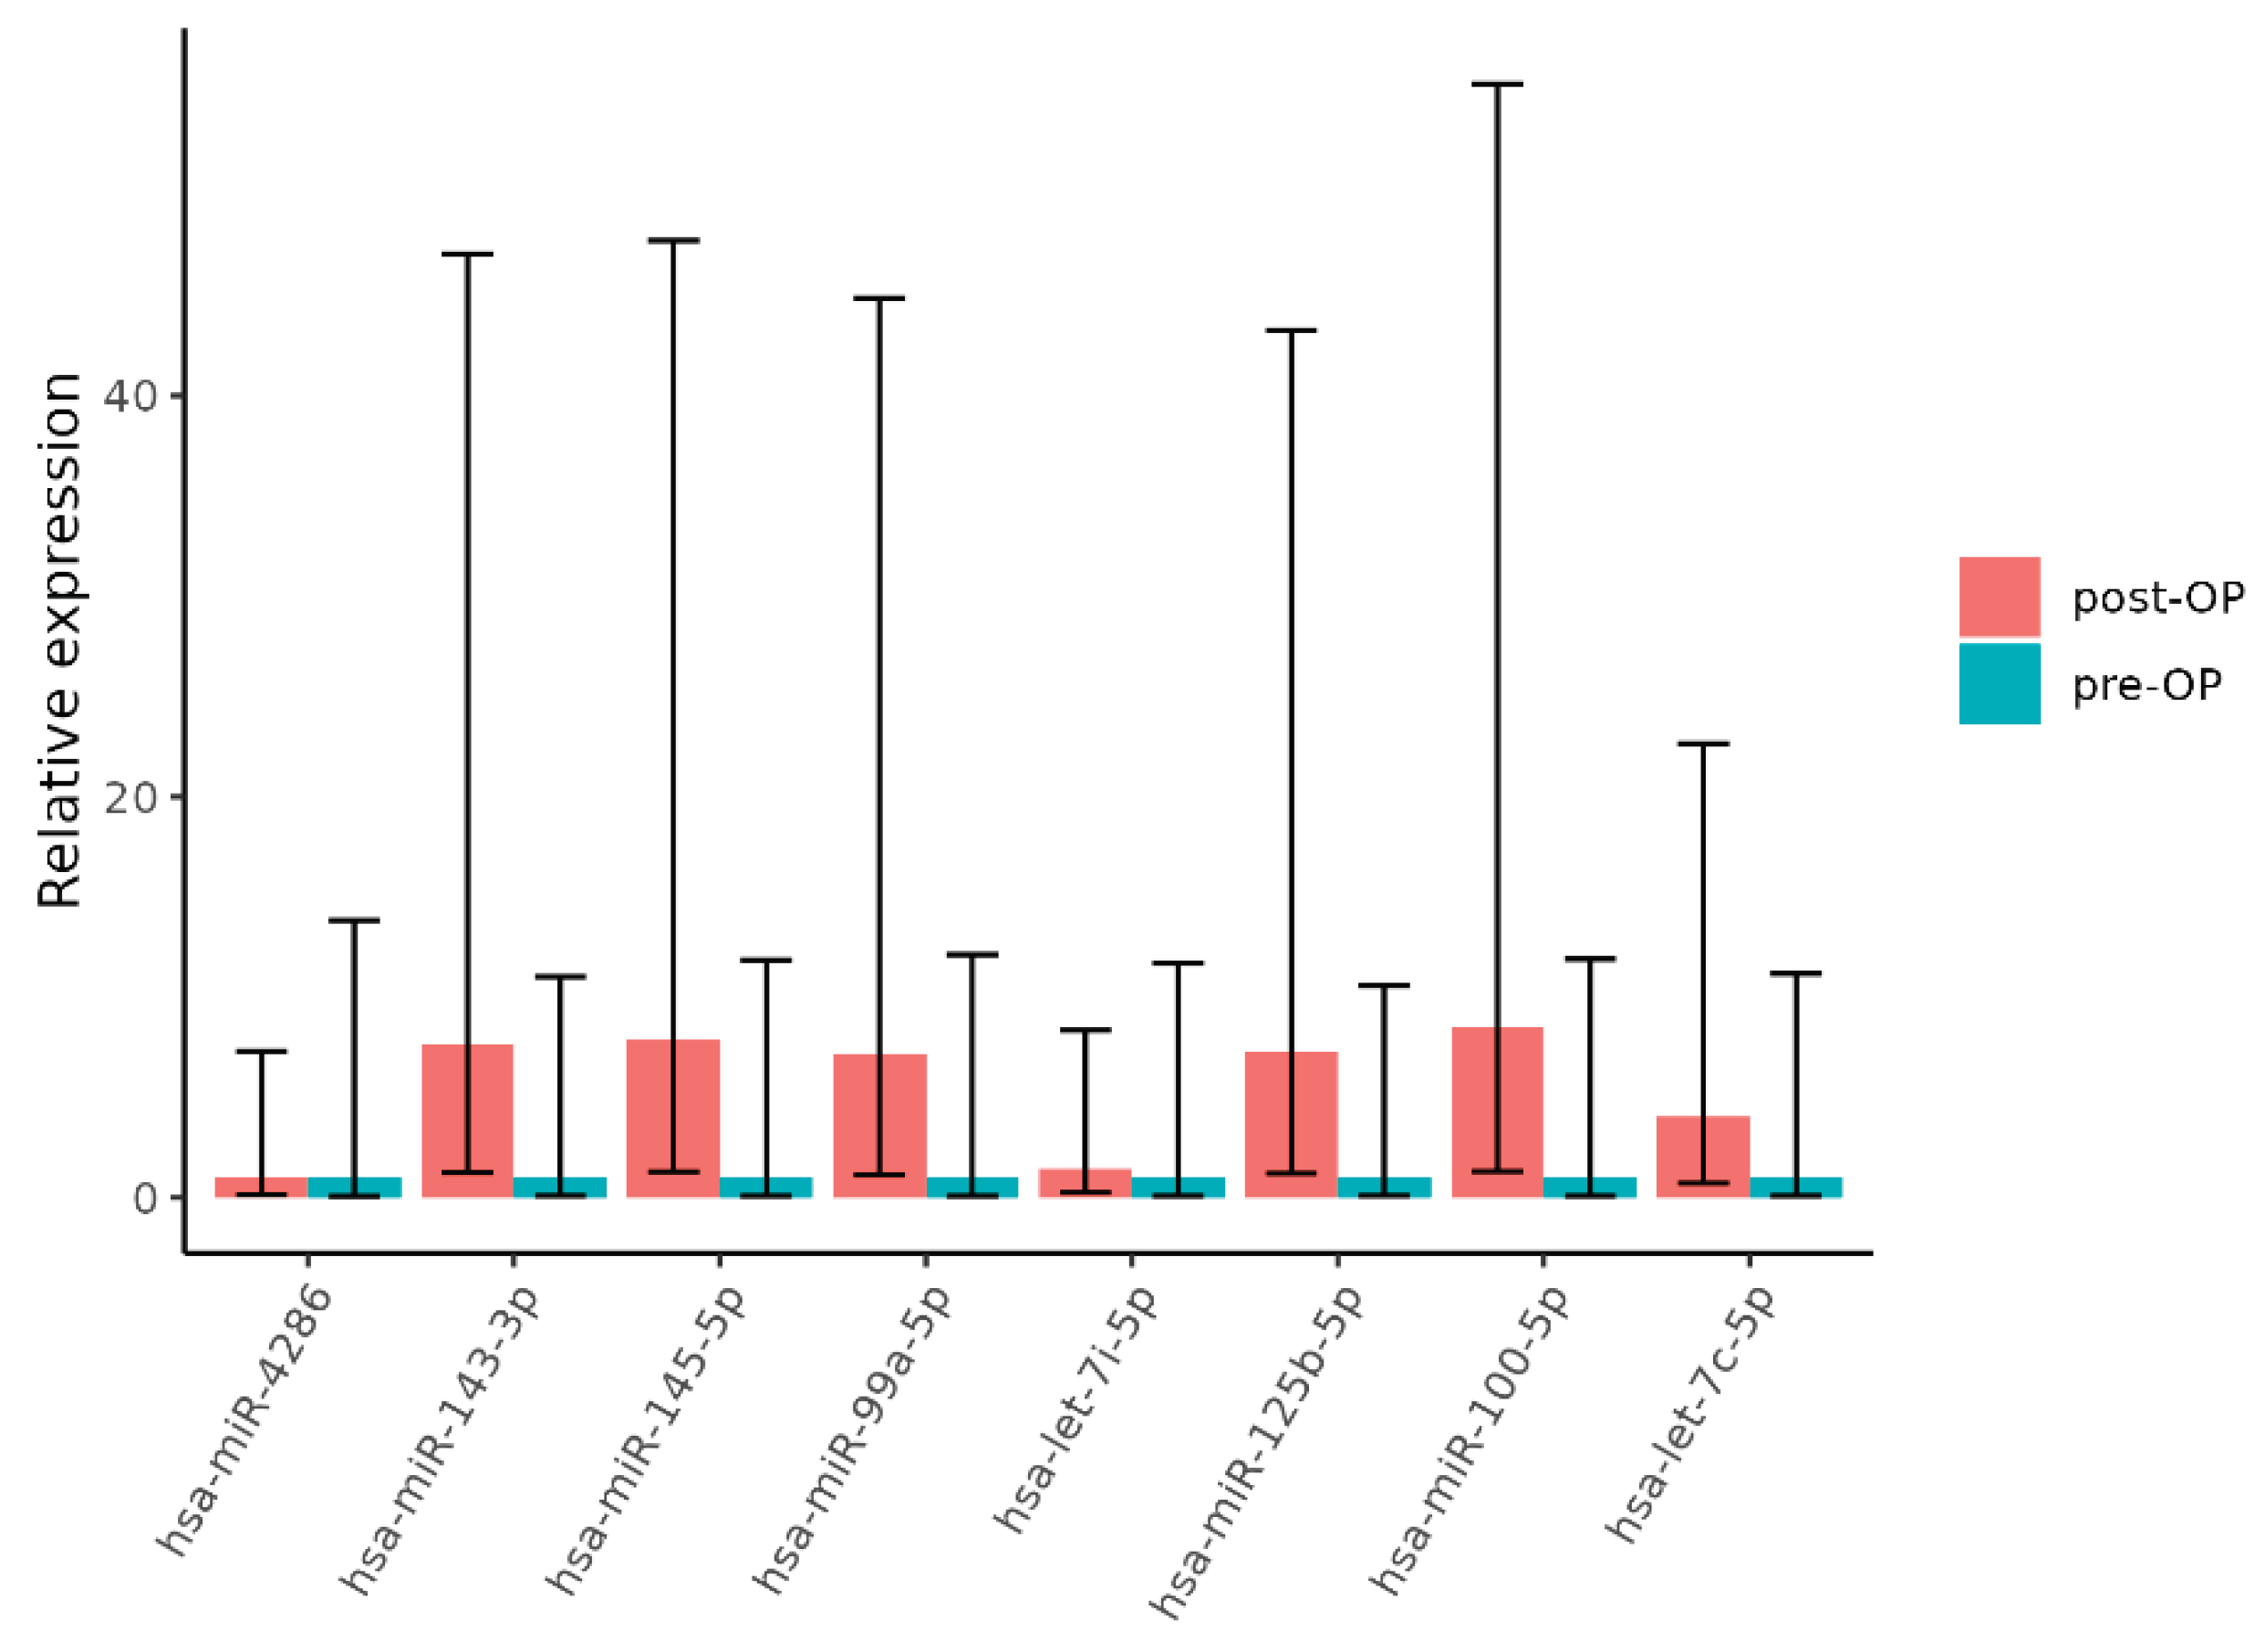

Table 1.
Differentially expressed genes.
| miRNA | Log2FC | T | p-Value * |
|---|---|---|---|
| hsa-miR-4286 | 4.1 | 12 | 2.1×10⁻²¹ |
| hsa-miR-99a-5p | 3.7 | 11 | 2×10-19 |
| hsa-miR-143-3p | 3.5 | 9.1 | 3.6×10⁻¹⁵ |
| hsa-miR-145-5p | 3.3 | 9.3 | 1.6×10⁻¹⁵ |
| hsa-miR-125b-5p | 3.2 | 9.6 | 3.1×10⁻¹⁶ |
| hsa-let-7i-5p | 2.9 | 6.2 | 8×10⁻⁹ |
| hsa-miR-1-3p | 2.8 | 7.5 | 1.8×10⁻¹¹ |
| hsa-miR-100-5p | 2.7 | 8.6 | 4.2×10⁻¹⁴ |
| hsa-miR-199a-5p | 2.5 | 9.2 | 2.4×10⁻¹⁵ |
| hsa-let-7c-5p | 2.4 | 8.5 | 7.4×10⁻¹⁴ |
* P-values were obtained by using an empirical Bayes moderated t-test as implemented in the limma package.
Table 2.
Wilcoxon test of qRT-PCR result
| miRNA | Estimate | p-Value |
|---|---|---|
| hsa-miR-4286 | -0.72111 | 0.39571 |
| hsa-miR-143-3p | -2.90002 | 0.027714 |
| hsa-miR-145-5p | -3.10603 | 0.015049 |
| hsa-miR-99a-5p | -2.85 | 0.015861 |
| hsa-let-7i-5p | -0.20001 | 0.816826 |
| hsa-miR-125b-5p | -2.69999 | 0.009722 |
| hsa-miR-100-5p | -3.25 | 0.002985 |
| hsa-let-7c-5p | -2 | 0.038708 |
Table 3.
General clinical data of pre-OP and post-OP group.
| Groups | pre-OP (n=36) | post-OP (n=43) | p-Value* |
|---|---|---|---|
| Age (year) | 0.277 | ||
| Median (range) | 66 (18-80) | 67 (44-84) | |
| Gender | 0.403 | ||
| Male: Female | 21(58.3): 15 (41.7) | 28 (65.1): 15 (34.9) | |
| Clinical stage at initial diagnosis (cT) | 0.93 | ||
| 1 | 0 (0) | 0 (0) | |
| 2 | 3 (8.3) | 3 (7) | |
| 3 | 22 (61.1) | 28 (65.1) | |
| 4a/4b | 11 (30.6) | 12 (27.9) | |
| Clinical stage at initial diagnosis (cN) | 0.907 | ||
| 0 | 4 (11.1) | 5 (11.6) | |
| 1a/1b/1c | 24 (66.7) | 27 (62.8) | |
| 2a/2b | 8 (22.2) | 11 (25.6) | |
| Response to preoperative CRT | 0.986 | ||
| CR/PR | 21 (58.3) | 25 (58.1) | |
| SD/PD | 15 (41.7) | 18 (41.9) | |
| Pathological stage after surgery (ypT) | 0.827 | ||
| 0/Tis | 7 (19.4) | 4 (9.3) | |
| 1 | 3 (8.3) | 4 (9.3) | |
| 2 | 9 (25) | 15 (34.9) | |
| 3 | 15 (41.7) | 18 (41.9) | |
| 4a/4b | 2 (5.6) | 2 (4.6) | |
| Pathological stage after surgery (ypN) | 0.892 | ||
| 0 | 27 (75) | 35 (81.4) | |
| 1a/1b/1c | 6 (16.7) | 5 (11.6) | |
| 2a/2b | 3 (8.3) | 3 (7) | |
| Total RT dose (Gy) | 0.99 | ||
| Median (range) | 50.4 (50.4-60) | 50.4 (50.4-60) | |
| Chemotherapy regimen | 0.986 | ||
| Capecitabine: 5-FU/Leucovorin | 23 (63.9): 13 (36.1) | 25 (58.1): 18 (41.9) |
* P-values were obtained by using Pearson chi-square test and independent t-test.
Table 4.
General clinical data of miRNA validation cohorts (pre-OP and post-OP group).
| Groups | pre-OP (n=8) | post-OP (n=12) | p-Value* |
|---|---|---|---|
| Age (year) | 0.171 | ||
| Median (range) | 64 (44-76) | 73 (50-77) | |
| Gender | 0.356 | ||
| Male: Female | 4 (50):4 (50) | 9 (75): 3 (25) | |
| Clinical stage at initial diagnosis (cT) | 0.454 | ||
| 1 | 0 (0) | 0 (0) | |
| 2 | 1 (12.5) | 0 (0) | |
| 3 | 4 (50) | 7 (58.3) | |
| 4a/4b | 3 (37.5) | 5 (41.7) | |
| Clinical stage at initial diagnosis (cN) | 0.53 | ||
| 0 | 6 (75) | 2 (16.7) | |
| 1a/1b/1c | 1 (12.5) | 7 (58.3) | |
| 2a/2b | 1 (12.5) | 3 (25) | |
| Response to preoperative CRT | 1 | ||
| CR/PR | 4 (50) | 9 (75) | |
| SD/PD | 4 (50) | 3 (25) | |
| Pathological stage after surgery (ypT) | 0.771 | ||
| 0/Tis | 1 (12.5) | 1 (8.3) | |
| 1 | 1 (12.5) | 2 (16.7) | |
| 2 | 3 (37.5) | 6 (50) | |
| 3 | 3 (37.5) | 2 (16.7) | |
| 4a/4b | 0 (0) | 1 (8.3) | |
| Pathological stage after surgery (ypN) | 0.4 | ||
| 0 | 6 (75) | 9 (75) | |
| 1a/1b/1c | 1 (12.5) | 3 (25) | |
| 2a/2b | 1 (12.5) | 0 (0) | |
| Total RT dose (Gy) | 0.613 | ||
| Median (range) | 50.4 (50.4-55.8) | 50.4 (50.4-55.8) | |
| Chemotherapy regimen | 0.648 | ||
| Capecitabine: 5-FU/Leucovorin | 4 (50): 4 (50) | 8 (66.7): 4 (33.3) |
* P-values were obtained by using Fisher’s exact test and independent t-test.
Disclaimer/Publisher’s Note: The statements, opinions and data contained in all publications are solely those of the individual author(s) and contributor(s) and not of MDPI and/or the editor(s). MDPI and/or the editor(s) disclaim responsibility for any injury to people or property resulting from any ideas, methods, instructions or products referred to in the content. |
© 2025 by the authors. Licensee MDPI, Basel, Switzerland. This article is an open access article distributed under the terms and conditions of the Creative Commons Attribution (CC BY) license (https://creativecommons.org/licenses/by/4.0/).
Copyright: This open access article is published under a Creative Commons CC BY 4.0 license, which permit the free download, distribution, and reuse, provided that the author and preprint are cited in any reuse.


