
Submitted:
05 December 2025
Posted:
08 December 2025
You are already at the latest version
Abstract
This study analyzed environmental noise in neonatal hospital units, including low- and high-risk nurseries and neonatal intensive care units (NICUs). Continuous 24-hour measurements over ten days showed that average sound levels significantly exceeded international recommendations, with peaks up to 92.7 dB (p < 0.05). Hourly LAeq values often reached or surpassed 65 dB, with more than 20% of daily recordings above this limit and, in some cases, over 50%. Heatmaps revealed recurrent patterns: high-risk nurseries showed peaks during late morning and afternoon, low-risk nurseries at night, and NICUs maintained elevated levels throughout the day. Main noise sources were alarms, medical equipment, and staff or visitor activity. The Premature Infant Pain Profile (PIPP) suggested associations between noise and neonatal discomfort. Overall, up to 60% of noise could be reduced through architectural, technological, and organizational measures, underscoring the need for hospital policies that protect neonatal neurosensory health. These findings provide evidence-based guidance for designing quieter neonatal care environments.
Keywords:
neonatal
; intensive care unit (NICU)
; environmental noise
; sound level monitoring
; neonatal pain
1. Introduction
High levels of sound are identified as one of the main physical pollutants in Neonatal Intensive Care Units (NICUs) and nurseries, representing a significant risk factor for the health and well-being of newborns. Exposure to elevated sound levels has been associated with short- and long-term adverse effects, including physiological alterations, increased heart and respiratory rates, oxygen desaturation, sleep disturbances, behavioral and emotional changes [1,2,3].
International organizations, such as the American Academy of Pediatrics (AAP), recommend that continuous noise levels in NICUs should not exceed 45 dB, with a maximum of 65–70 dB for non-continuous sources such as alarms or clinical interventions [1,3]. However, evidence shows that actual hospital noise levels consistently exceed these recommendations, [2]. These acoustic conditions, in addition to being potentially harmful to hear, can affect neurodevelopment, physiological stability, and neonatal comfort.
In Mexico, recent studies have documented that both in high- and low-risk nurseries and NICUs, noise-generating sources —such as monitor alarms, ventilators, staff conversations, and family visits— frequently exceeds the recommended thresholds[1,2].
In this context, assessing hospital noise levels and their relationship with neonatal comfort and pain is essential when designing policies that protect the neurosensory health of newborns and improve the quality of the hospital environment. Therefore, the aim of this study is to analyze environmental noise levels in high- and low-risk nurseries and neonatal intensive care units, identifying the main noise sources exceeding 45 dB and evaluating their association with neonatal comfort and pain, in order to propose mitigation strategies that foster a healthy and protective hospital environment.
Environmental noise in neonatal intensive care units (NICU) has gained attention due to physiological changes produced in preterm infants, producing negative short-term effects on the cardiovascular and respiratory systems [4]. The exposure threshold recommendations of The National Institute for Occupational Safety and Health (NIOSH) were limited to 85 A-weighted decibels (dBA) for 8 h exposure on average [5]. The Consensus Committee on Recommended Design Standards for Advanced Neonatal Care suggested that NICUs should be designed to mitigate a combination of continuous background sound and operational sound [6]. Therefore, the acoustic conditions in these areas must be continuously monitored.
Sound, from a physics standpoint,it is understood as a mechanical wave requiring a propagation medium. One of its properties is the sound intensity, commonly expressed in decibels and calculated as Equation (1):
where I is the intensity of the sound, P is the acoustic power, and A is the area perpendicular to the direction of propagation. This is directly related to the energy delivered per unit time and area [7].
Or in terms of pressure:
where is the density of the medium and is the sound speed. The next section explains why this is not the better way to measure this quantity.
1.1. Sound Pressure
As is well known, sound is a mechanical wave that propagates through a medium. It stimulates the ear by exerting variable pressure, which is then converted into electrical signals that the brain interprets [8]. The lowest sound pressure detectable by the human ear is approximately , whereas the upper threshold, beyond which pain occurs, is about . Since the human brain does not process these variations linearly, a logarithmic scale provides a more accurate representation of the subjective perception of sound [8].
For this reason, sound pressure levels are expressed on a base-10 logarithmic scale, with a multiplicative factor of ten applied:
In terms of the intensity, we can write
By substituting equation (2) into the medium, equation (3) is obtained, expressed in terms of p, which can be directly measured. This quantity is defined as the sound pressure level (SPL), expressed in decibels, with the reference pressure conventionally set at [8].
The most common instrument for measuring the sound pressure level (SPL) is a sound level meter [7]. Usually, sound level meters have two response times: fast and slow. The fast response has a time constant of 100 milliseconds, designed to approximate the response of the ear. The slow response has a constant time of 1 second, when the measured sound fluctuated continuously and violently [8]. Two convenient quantities to measure the sound level effect during a long time period are and . Both of them consist essentially of the equivalent continuous sound level, in the time we take measurements converted to decibel units. We can understand it as a mean that considers the logarithmic scale of the decibels, which means that characterizes fluctuating noises as an equivalent steady-state [8].
The quantity is found by replacing the unweighted sound pressure level with the A-weighted sound pressure level that emulates the human ear sensibility[8].
1.2. Hearing Damage Risk
Hearing damage is a cumulative result of level and duration. That is why two types of noise are considered: continuous and impulse noise [8].
The acoustic environment in pediatric hospital areas, especially in low-risk nurseries and Neonatal Intensive Care Units (NICUs), has received increasing attention. Due to its influence on newborn development and well-being in these units, noise control is essential. Neonates, especially premature or critically ill infants, are highly susceptible to excessive auditory stimuli that can interfere with their neurosensory maturation.
Recommendations suggest maintaining ambient noise levels between 45 and 50 dB, with a maximum of 65 to 70 dB for non-continuous sources such as alarms or clinical interventions [9,10]. However, studies show that real noise levels in both low-risk nurseries and NICUs often exceed these limits. On average, continuous sources surpass 62 dB, and peak levels can exceed 90 dB [11,12,13].
To grasp the significance of differences in recorded values, note that decibels operate on a logarithmic scale. For example, 60 dB corresponds to an intensity of , while 80 dB equals . Although the difference is only 20 dB, the actual energy is 100 times greater [7].
In NICUs, the constant presence of high-frequency ventilators, monitors, infusion pumps, and other devices creates a dense acoustic environment, potentially causing disturbances in circadian rhythm, heart rate changes, sleep difficulties, increased oxidative stress, and auditory development problems [14]. Even in low-risk nurseries, where neonates do not require intensive technological support, staff activity, visitors, alarms, and other noise sources contribute to levels that exceed recommendations.
Up to 60% of hospital noise can be prevented or reduced with interventions involving architectural design, staff education, the use of quieter technologies, and active sound environment monitoring [10,14]. Reported consequences include auditory damage from continuous sources above 45 dB, long-term neurodevelopmental effects, and direct links between high noise levels and neonatal stress or pain [1].
Given the importance of acoustic environments for neonatal health, this study aims to analyze reported noise levels in low-risk nurseries and NICUs, highlighting the need for policies and practices that promote a quieter, more protective clinical environment.
2. Materials and Methods
An observational and prospective study was carried out in a hospital in Mexico City. This hospital included three types of neonatal services: low-risk nurseries, high-risk nurseries, and NICUs. The low -risk nursery has the capacity to attend 14 neonates, the high-risk nursery 7 neonates, and the NICU has the capacity for 8 neonates. A calibrated sound level meter (TES-1353S) was used to record sound pressure levels per second for 24 hours, for 10 days. The dB register was divided by morning shift (from 7:00 to 15:00), afternoon shift (from 15:00 to 20:30), and night shift (from 20:30 to 7:00). The number of persons in each shift was registered, as well as the levels of sound produced by monitors, incubators, ventilators, oxygen intakes, medical visit passes, family visits and air intakes. Data were classified as:
- Continuous noise: from medical equipment and ventilation.
- Impulsive noise: alarms, opening doors, voices.
- Avoidable noise: non-urgent human activity (conversations, unnecessary movement of furniture).
Statistical analysis was performed using statistical moments and a T-test, to broadly characterize daily data behavior.
Plots were generated showing sound level versus time segmented by shifts, hourly and 10-second averages for specific intervals, percentages of time spent in classified noise ranges by neonatal impact, the equivalent sound pressure per hour and per day, and heatmaps showing the distribution of sound level throughout the day.
All values were compared against WHO and other international standards using descriptive statistics.
3. Results
3.1. Heat Maps
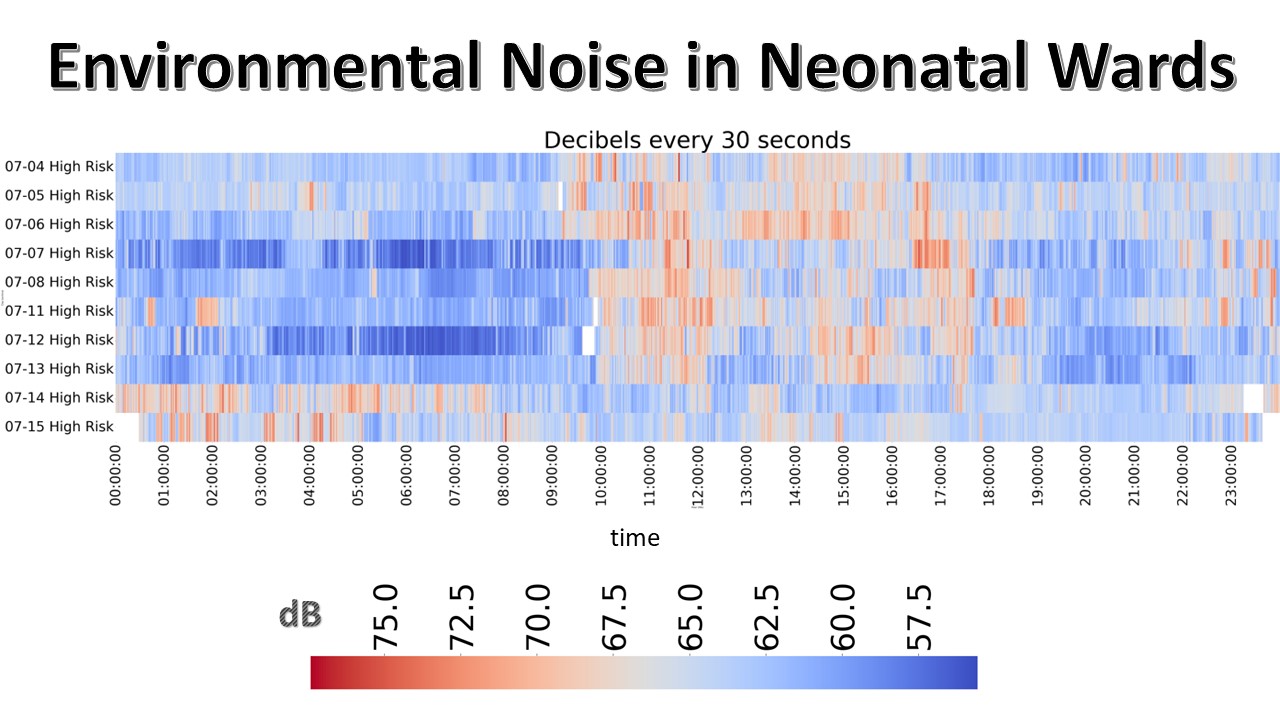
The heat maps allow for clear identification of recurrent noise patterns. In high-risk nurseries, noise levels increased consistently between 10:50 am and 5:30 pm. In low-risk nurseries, an increase was observed during the night, from 12:00 am to 8:00 am. In contrast, NICU nurseries did not present a specific peak hour; however, elevated sound levels were recorded between 10:00 pm to 6:00 am (Figure 1), as reflected in the percentage of time above 65 dB (Table 1). These findings highlight recurrent periods of higher noise, particularly in high- and low-risk nurseries. Visiting hours (around 12:00 pm) were associated with elevated noise in low-risk nurseries, while in the same setting, persistently high levels were observed throughout the night (Figure 1).
3.2. The Equivalent Continuous Sound Level ()
The averages per shift (Figure 5) throughout the day frequently approached the critical threshold of 65 dB. This indicates that several hours reached levels classified as “critical,” while all others remained within the “high” classification or above. Consequently, the equivalent sound pressure level per day was consistently elevated (Table 1). The box plots (Figure 2) provide a clearer comparison, showing how closely the data aligned with dangerous noise levels. Although the daily median often remained slightly below the risk threshold, the equivalent continuous level offers a more reliable measure of the cumulative impact of noise exposure. Overall, the values consistently approached or exceeded the risk limit.
3.3. Intervals Above 65 dB
To identify periods of sustained high-level noise (above 65 dB), the data were analyzed using 1-minute windows with a 10-second shift. A one-sample t-test was used for each window to determine if noise levels were continuously maintained above a 65 dB threshold. Thereby distinguishing sustained noise from isolated acoustic events, in the Table 2 is shown an example of an interval of four consecutive shifts which is considered as continuous and another example of isolated shift. In order to determine if there are over the 65 dB threshold, there are highlighted only the windows which the null hypothesis takes the positive value consecutively, this lead us to exclude the rare cases like when a medical apparatus is activated and conserve only the intervals with continue noise (Figure 3), the intervals considered non significative has peaks over the 65 dB but this intervals are discarded because the noise is not constant in contrast with the intervals highlighted in which the data over the risk is not only present on a few picks (Figure 4). In the other side analyzing per day, all the dates have always above the twenty percent of the day over the critical risk, and a few of them over the fifty percent, (Table 1) and we can identify that most of this time percent over 65 dB is continuous.
3.4. Average Decibel Levels by Shift
In the average by shift (Figure 5), it is notable that there is a hierarchy in the averages for most of the days. On the shift from 14 to 20 hours of the High-Risk, most of the days the averages are over the other two shifts averages. The shift from 07 to 14 hours is second, and the shift from 20 to 07 hours has the lowest averages. Similarly, in the Low-Risk the shift from 07 to 14 hours and the one from 20 to 07 hours have similar averages on four days , and the shift from 14 to 20 hours has the lowest averages most of the days. The shifts of the NICU do not show a dominance on the averages per day. In general, the NICU does not have lower averages than the other nurseries.
3.5. Noise Sources
4. Discussion
Noise in NICUs is a critical environmental factor influencing neonatal well-being. Measurements were taken using a calibrated sound level meter in dB(A).
According to the American Academy of Pediatrics (AAP), continuous noise should not exceed 45 dB(A), with peaks up to 65 dB(A). This threshold is still used by The Consensus Committee on Recommended Design Standards for Advanced Neonatal Care, although several authors had recommended 70 dBA for transitory sounds [1,2].
4.1. Environmental Noise Measurement
The calibrated meter was used in NICU and nurseries to assess areas with potential risk to neonatal health by comparing values to established thresholds.
4.2. Neonatal Pain Evaluation
A crucial aspect not covered in our study is the direct correlation between noise events and neonatal pain. A previous study conducted in a similar setting utilized the Premature Infant Pain Profile (PIPP) to assess neonatal discomfort [1]. While this work highlights the clinical relevance of pain assessment, a direct correlation with our acoustic data was not feasible due to the lack of precise time-stamping and methodological details in the available PIPP assessments. This limitation underscores the need for a future prospective study designed to collect synchronized, time-stamped noise and PIPP data. Such an approach would be essential to quantitatively link specific acoustic events to physiological stress responses in neonates.
4.3. Continuous and Intermittent Sources
Data show continuous sources above 50 dB even on the intervals with the lowest average, really large intervals with continuous intervals over 65 dB and a really high time percent over 65 dB per day, which means there is continuous noise over the threshold for intermittent noise. That is alarming, since damage can be expected in neonates exposed to constant noise over 50 dB, and we found at least 10 dB over this threshold in the data. Intermittent peaks often exceeded 75 dB, which is a sound level that can cause hearing damage, particularly in neonates.
4.4. The Equivalent Continuous Sound Level ()
The represents the average sound energy over a given period, expressed as a continuous equivalent level. In our measurements, hourly values of frequently approach or exceed the critical threshold. This indicates that, on certain days, the cumulative noise exposure is comparable to experiencing a steady sound level near the threshold of intermittent noise throughout the entire day. Moreover, during specific hours, the equivalent continuous sound level surpasses this threshold, reflecting periods of particularly high acoustic impact.
Noise patterns correlate with time of day and recurring hospital activity. It is necessary to apply measures like use a sound insulation in the windows frame or some programs of staff education.
5. Conclusions
The findings indicate that continuous noise sources in neonatal care environments often exceed recommended safe levels for healthy development. The observed noise patterns show a clear association with the time of day and routine hospital activities. These results highlight the need for practical interventions, such as improving sound insulation in window frames and implementing staff education programs, to reduce acoustic exposure and promote a more supportive environment for neonatal recovery.
Author Contributions
Conceptualization, A.J. and E.R.; methodology, M.T.and E.R.; software, L.N., E.R; validation, A.J., E.R. and M.T., D.E. J.A. G.M; formal analysis, L.N., M.T. and E.R.; investigation, A.J., M.T. and E.R., D.E. J.A. G.M; resources, A.J., D.E., J.A., G.M; data curation, L.N., E.R.; writing—original draft preparation, E.R., L.N., A.J., and M.T.; writing—review and editing, E.R., L.N., A.J., and M.T. visualization, E.R., L.N., A.J., and M.T.; supervision, E.R., A.J., and M.T. project administration, E.R., and A.J.; funding acquisition, E.R., D.E., J.A., G.M and A.J. All authors have read and agreed to the published version of the manuscript.
Funding
This research received no external funding.
Institutional Review Board Statement
This study was conducted in accordance with the Declaration of Helsinki, and the protocol was approved by the Ethics Committee of Hospital Juárez de México (Registration number: HJM 258/21 -R) on May 10th, 2022. Informed Consent Statement: Informed consent for participation is not required as per local legislation (Reglamento de la Ley General de Salud en Materia de Investigación para la Salud), because we did not include personal details, images, or videos relating to an individual person.
Informed Consent Statement
Informed consent was obtained from all subjects involved in the study.
Data Availability Statement
The data presented in this study are available on request from the corresponding author due to restrictions of the Ethics Committee.
Acknowledgments
The authors acknowledge the support provided by Hospital Juárez de México and express their gratitude to Dr. Francisco López González for sharing insightful ideas that strengthened the development of this manuscript.
Conflicts of Interest
The authors declare no conflicts of interest.
Abbreviations
The following abbreviations are used in this manuscript:
| NICU | Neonatal Intensive Care Unit |
References
- Del Angel Ortiz, A.Y. Fuentes generadoras de ruido en el servicio de neonatología que superan los 45 dB y su asociación con la intensidad de dolor en el neonato hospitalizado en un hospital de segundo nivel de la Ciudad de México. Specialty thesis in neonatal nursing, Universidad Autónoma del Estado de Hidalgo, Pachuca, Hidalgo, México, 2024. [Google Scholar]
- Jiménez-Osorio, A.S.; Estrada-Luna, D.; del Angel-Ortiz, A.Y.; Ángel-García, J.; Flores-Chávez, O.R. Fuentes generadoras de ruido y su asociación con el confort neonatal. Eureka. Revista científica de psicología 2024, 21((M) Libro 2), 198–215. [Google Scholar]
- Philbin, M.K.; Gray, L. Changing levels of quiet in an intensive care nursery. Journal of Perinatology 2002, 22(6), 455–460. [Google Scholar] [CrossRef] [PubMed]
- Wachman, E.M.; Lahav, A. The effects of noise on preterm infants in the NICU. Archives of Disease in Childhood-Fetal and Neonatal Edition 2011, 96(4), F305–F309. [Google Scholar] [CrossRef] [PubMed]
- NIOSH. Science policy update: individual fit-testing recommendation for hearing protection devices. In U.S. Centers for Disease Control and Prevention, National Institute for Occupational Safety and Health; 2025; Volume 104. [Google Scholar] [CrossRef]
- University of Notre Dame. NICU Standard 28: Acoustic environment. Available online: https://nicudesign.nd.edu/nicu-standards/standard-29-acoustic-environment/ (accessed on 29 September 2025).
- Garret, S.L. Understanding Acoustics: An Experimentalist’s View of Acoustics and Vibration; Springer International Publishing AG, 2020. [Google Scholar]
- Bies, D.A.; Hansen, C.H. Engineering Noise Control Theory and practice; Spon Press, 2009. [Google Scholar]
- Smith, S.W.; Ortmann, A.J.; Clark, W.W. Noise in the neonatal intensive care unit: a new approach to examining acoustic events. Noise health 2018, 20(94), 121–130. [Google Scholar] [CrossRef] [PubMed]
- Casey, L.; Fucile, S.; Flavin, M.; Dow, K. A two-pronged approach to reduce noise levels in the neonatal intensive care unit. Early Human Development 2020, 146, 105073. [Google Scholar] [CrossRef] [PubMed]
- Wallis, R.; Harris, E.; Lee, H.; Davies, W.; Astin, F. Environmental noise levels in hospital settings: A rapid review of measurement techniques and implementation in hospital settings. Noise health 2019, 21(102), 200–216. [Google Scholar] [CrossRef] [PubMed]
- Mariet, A.S.; Bernard, N.; Pujol, S.; Sagot, P.; Thiriez, G.; Riethmuller, D.; Boilleaut, M.; Defrance, J.; Houot, H.; Parmentier, A.L.; et al. Association between moderated level of air pollution and fetal growth: the potential role of noise exposure. Scientific Reports 2021, 11(1), 11238. [Google Scholar] [CrossRef] [PubMed]
- Mayhew, K.J.; Lawrence, S.L.; Squires, J.E.; Harrison, D. Elevated Sound Levels in the Neonatal Intensive Care Unit: What Is Causing the Problem? Advances in Neonatal Care 2022, 22(6), E207–E216. [Google Scholar] [CrossRef] [PubMed]
- Goldstein, J.; Laliberte, A.; Keszler, M. Ambient Noise Production by High-Frequency Neonatal Ventilators. The Journal of Pediatrics 2019, 204, 157–161. [Google Scholar] [CrossRef] [PubMed]
Figure 1.
Heat maps for all the cases of each classification: (a) High-Risk. (b) Low-Risk. (c) NICUS. (d) Graduation Bar.
Figure 1.
Heat maps for all the cases of each classification: (a) High-Risk. (b) Low-Risk. (c) NICUS. (d) Graduation Bar.
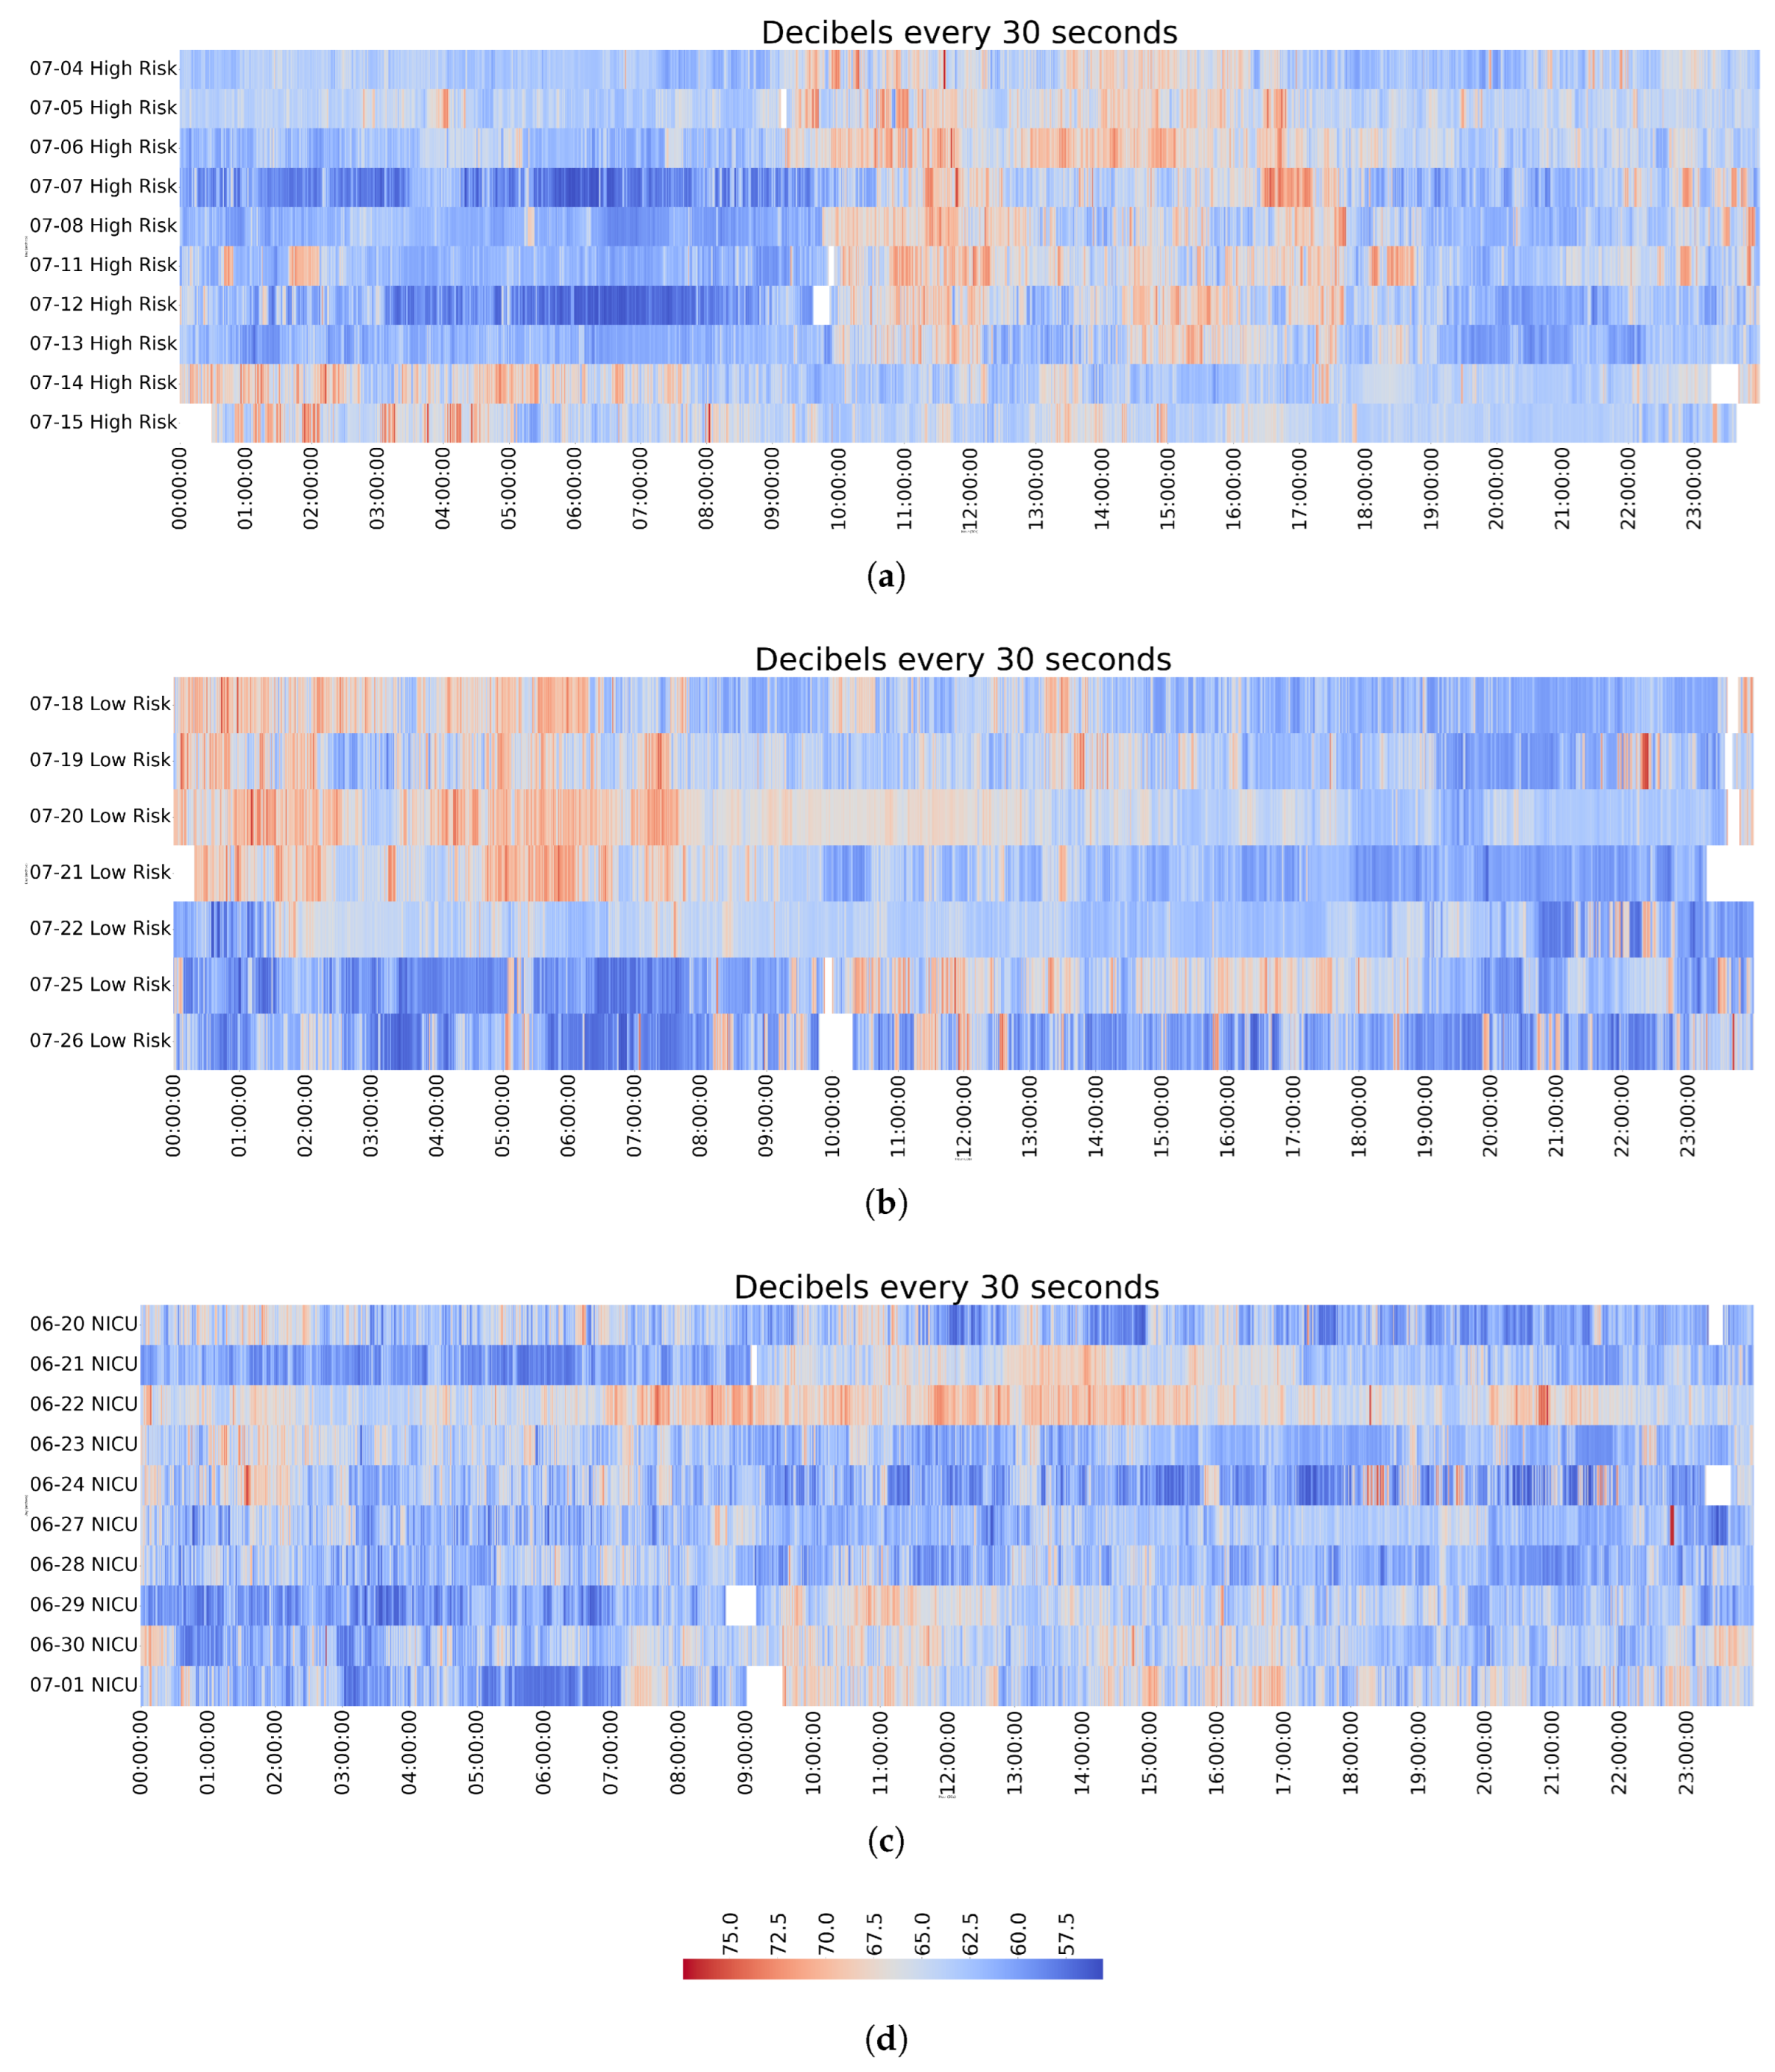
Figure 2.
Boxes Graph: (a) High-Risk. (b) Low-Risk. (c) NICUS.
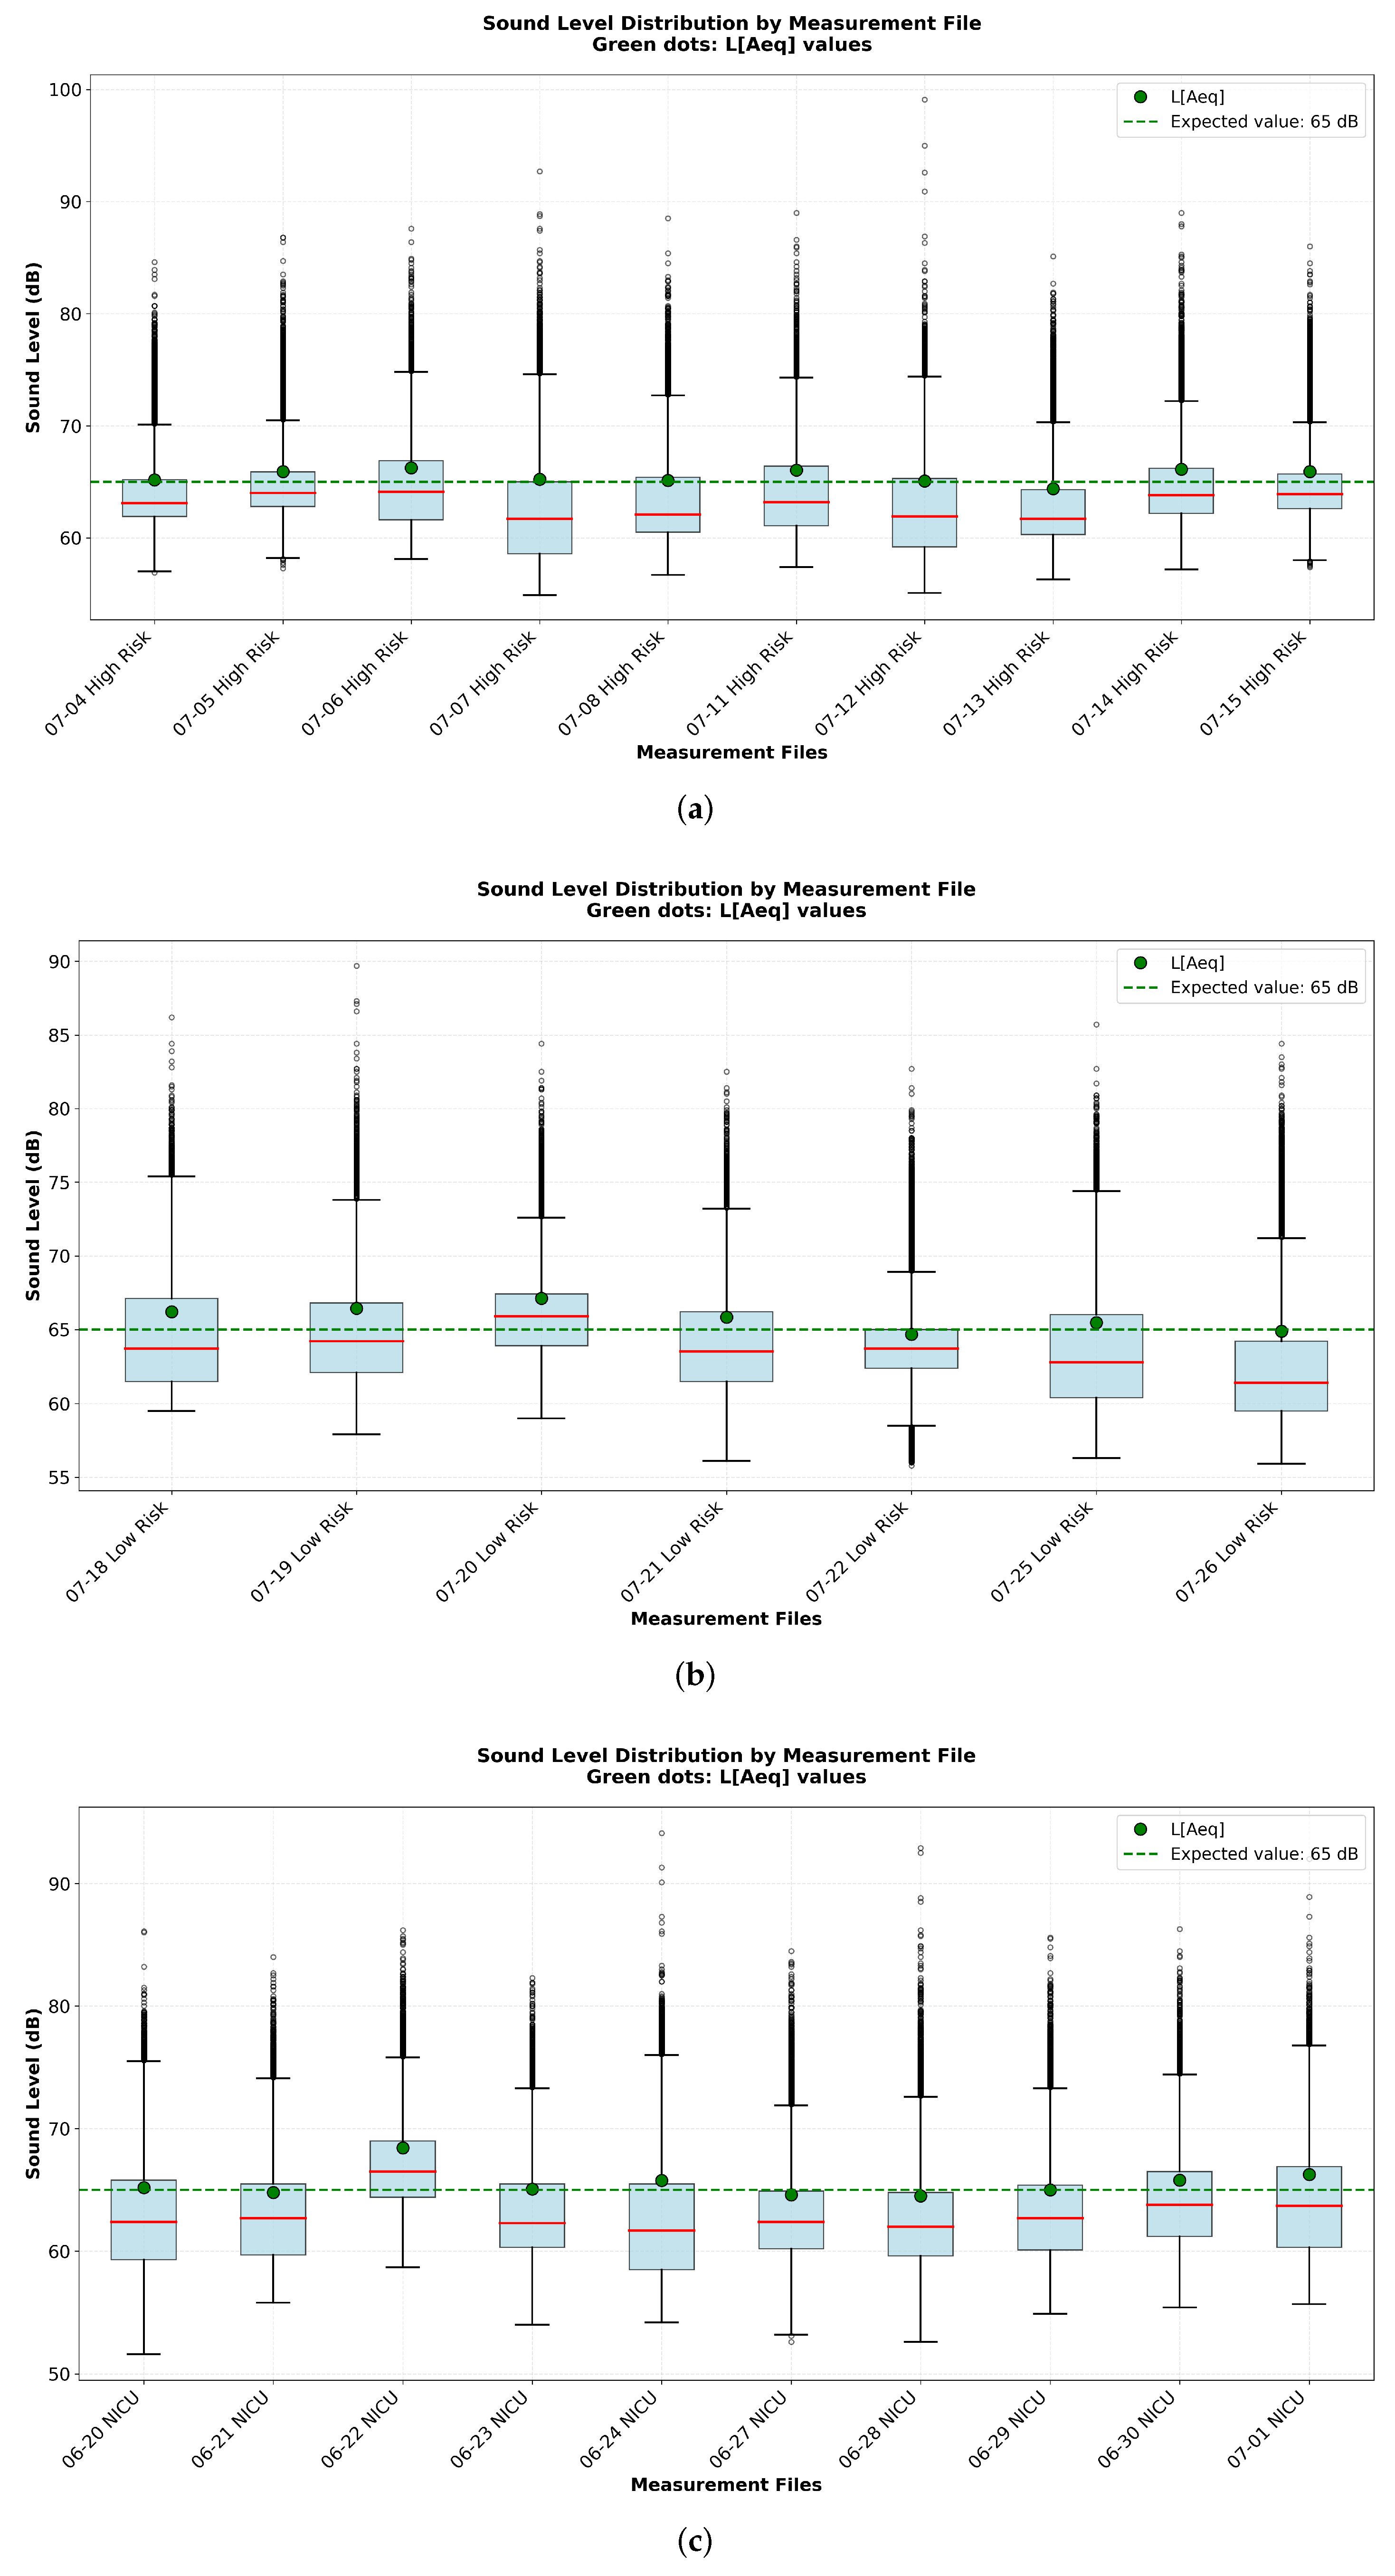
Figure 3.
Periods above 65 dB: (a) 06-30 NICU. (b) 07-11 High Risk. (c) 07-19 Low Risk.
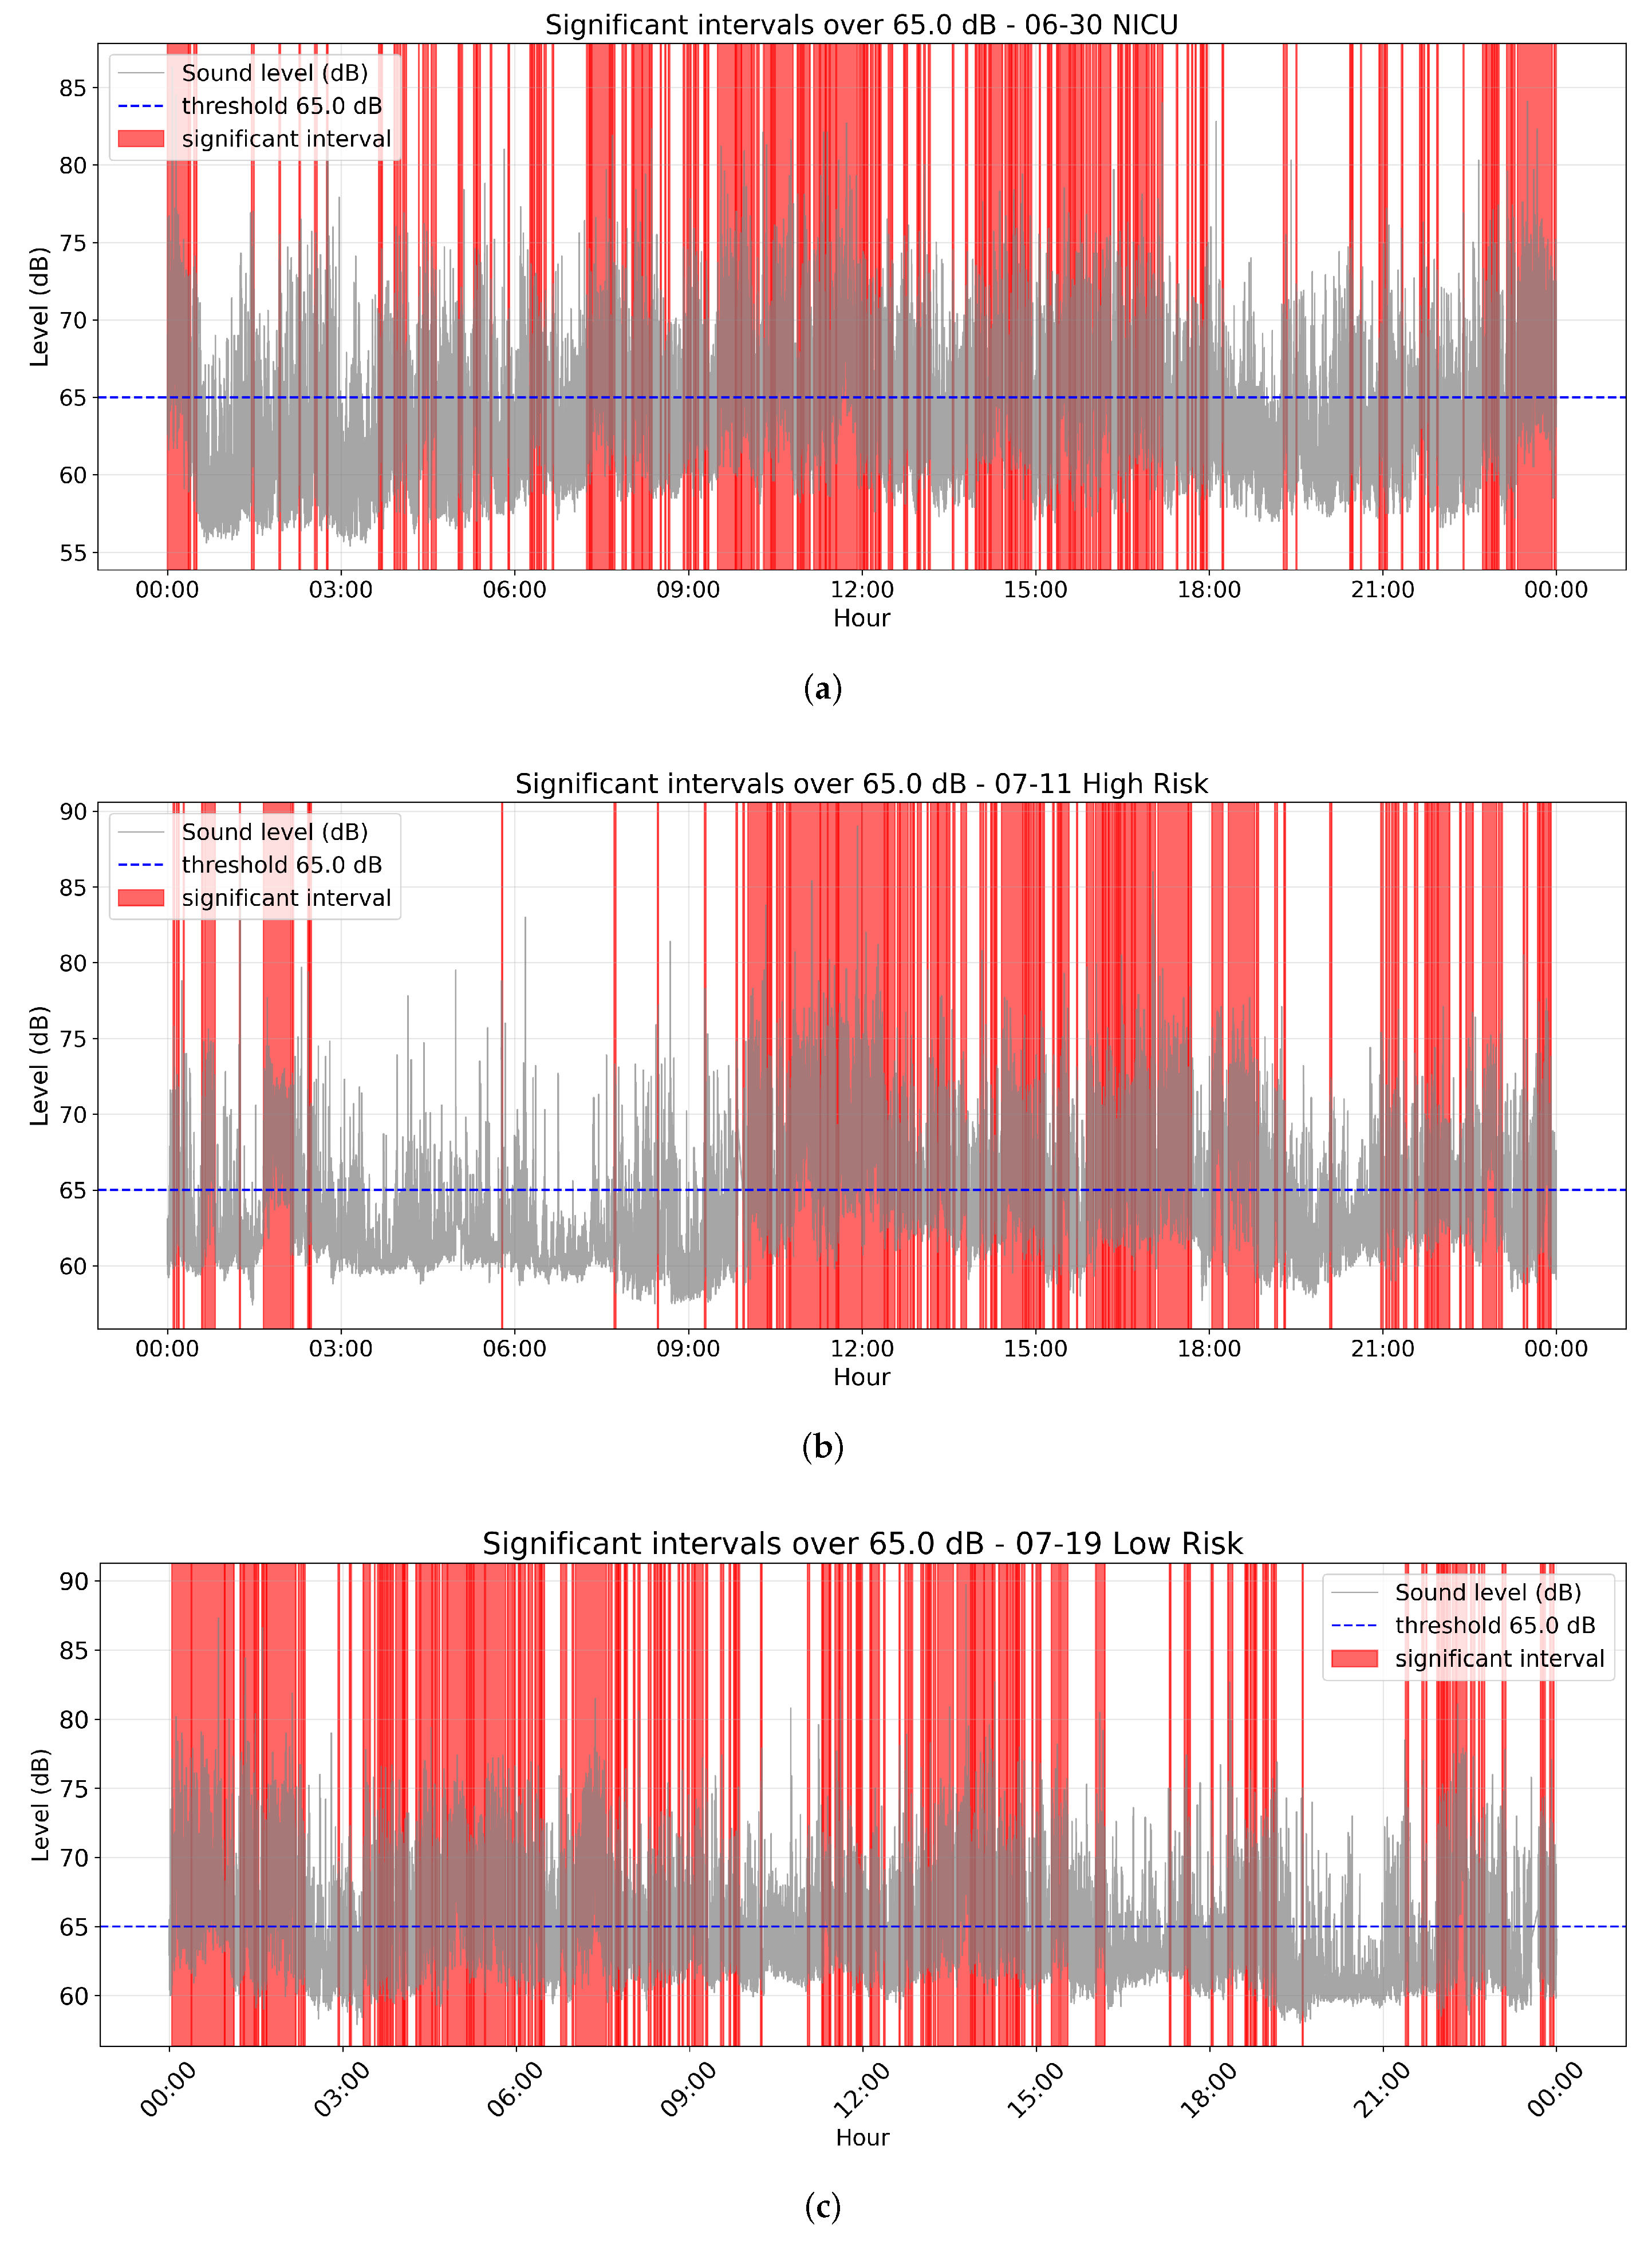
Figure 4.
Comparative between a continuous interval (on the left) and an isolated interval (on the right) : (a) 07/01 UCIN 11:30-12:00 and 03:00 and 03:30. (b) 07/19 Low Risl 05:00-05:30 and 10:30-11:00 (c) 07/11 High Risk 12:00-12:30 and 06:00 and 06:30 .
Figure 4.
Comparative between a continuous interval (on the left) and an isolated interval (on the right) : (a) 07/01 UCIN 11:30-12:00 and 03:00 and 03:30. (b) 07/19 Low Risl 05:00-05:30 and 10:30-11:00 (c) 07/11 High Risk 12:00-12:30 and 06:00 and 06:30 .
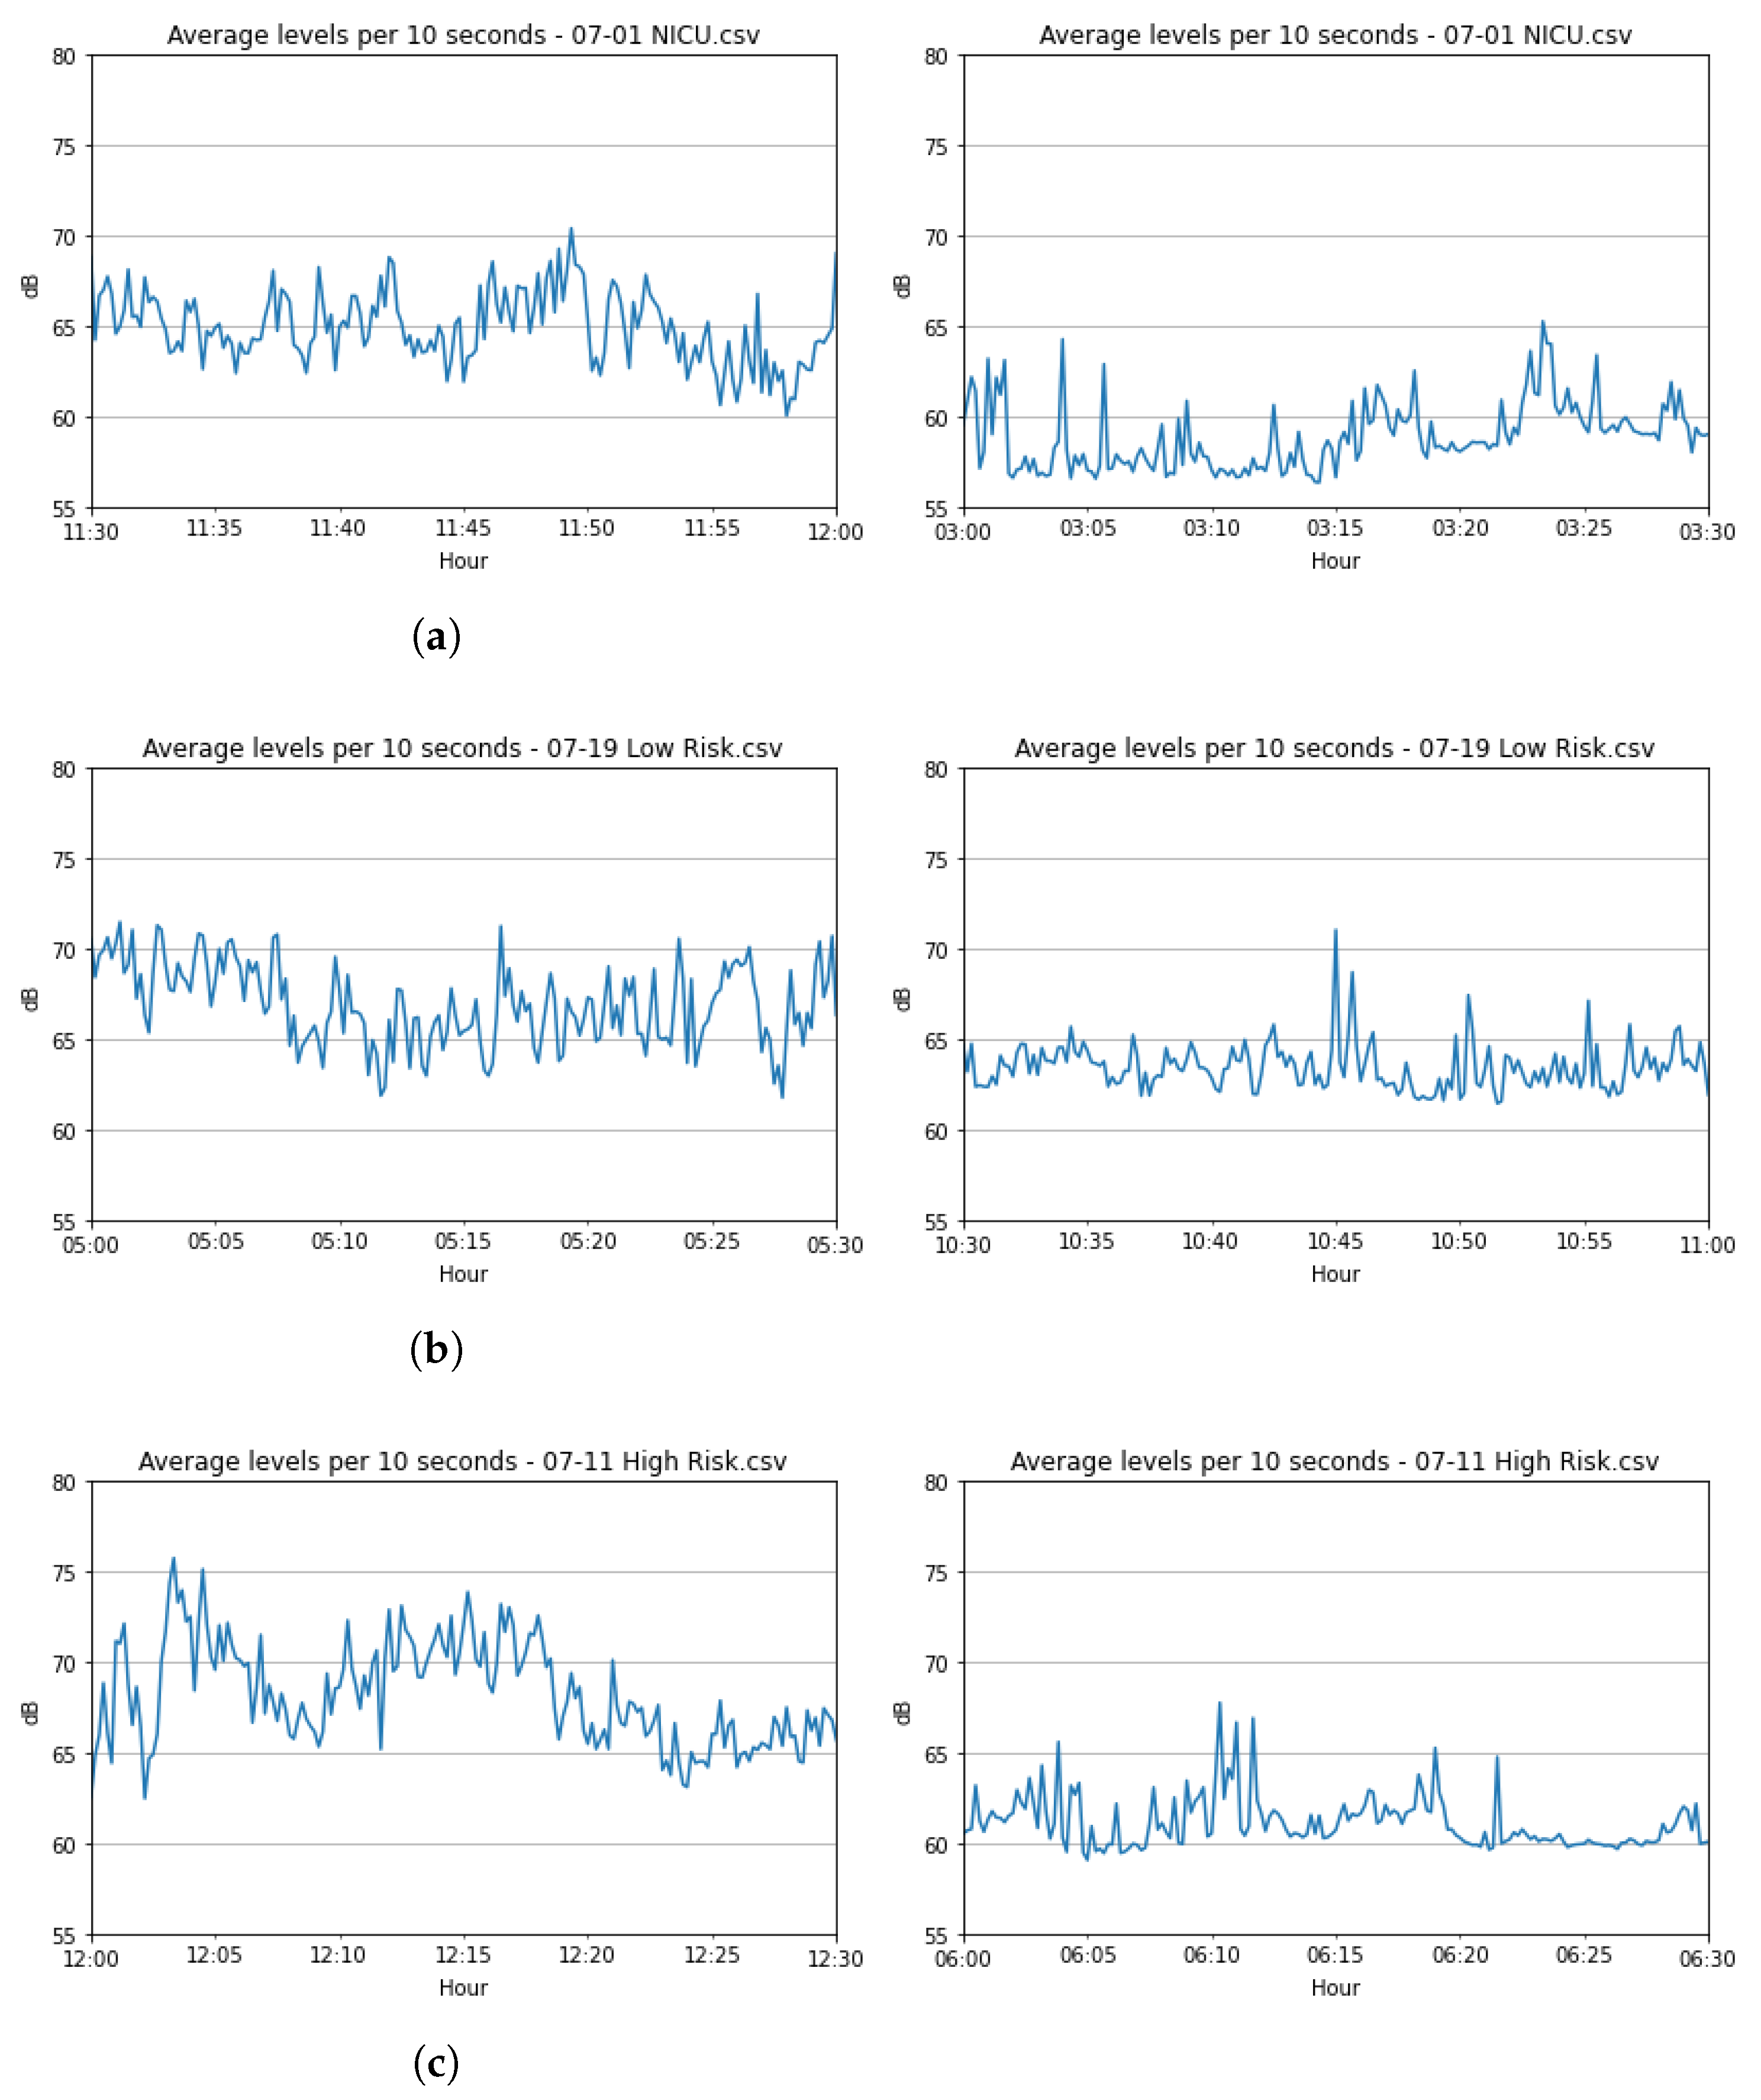
Figure 5.
Average dB calculated per shift interval per day: (a) NICU. (b) High Risk. (c) Low Risk.
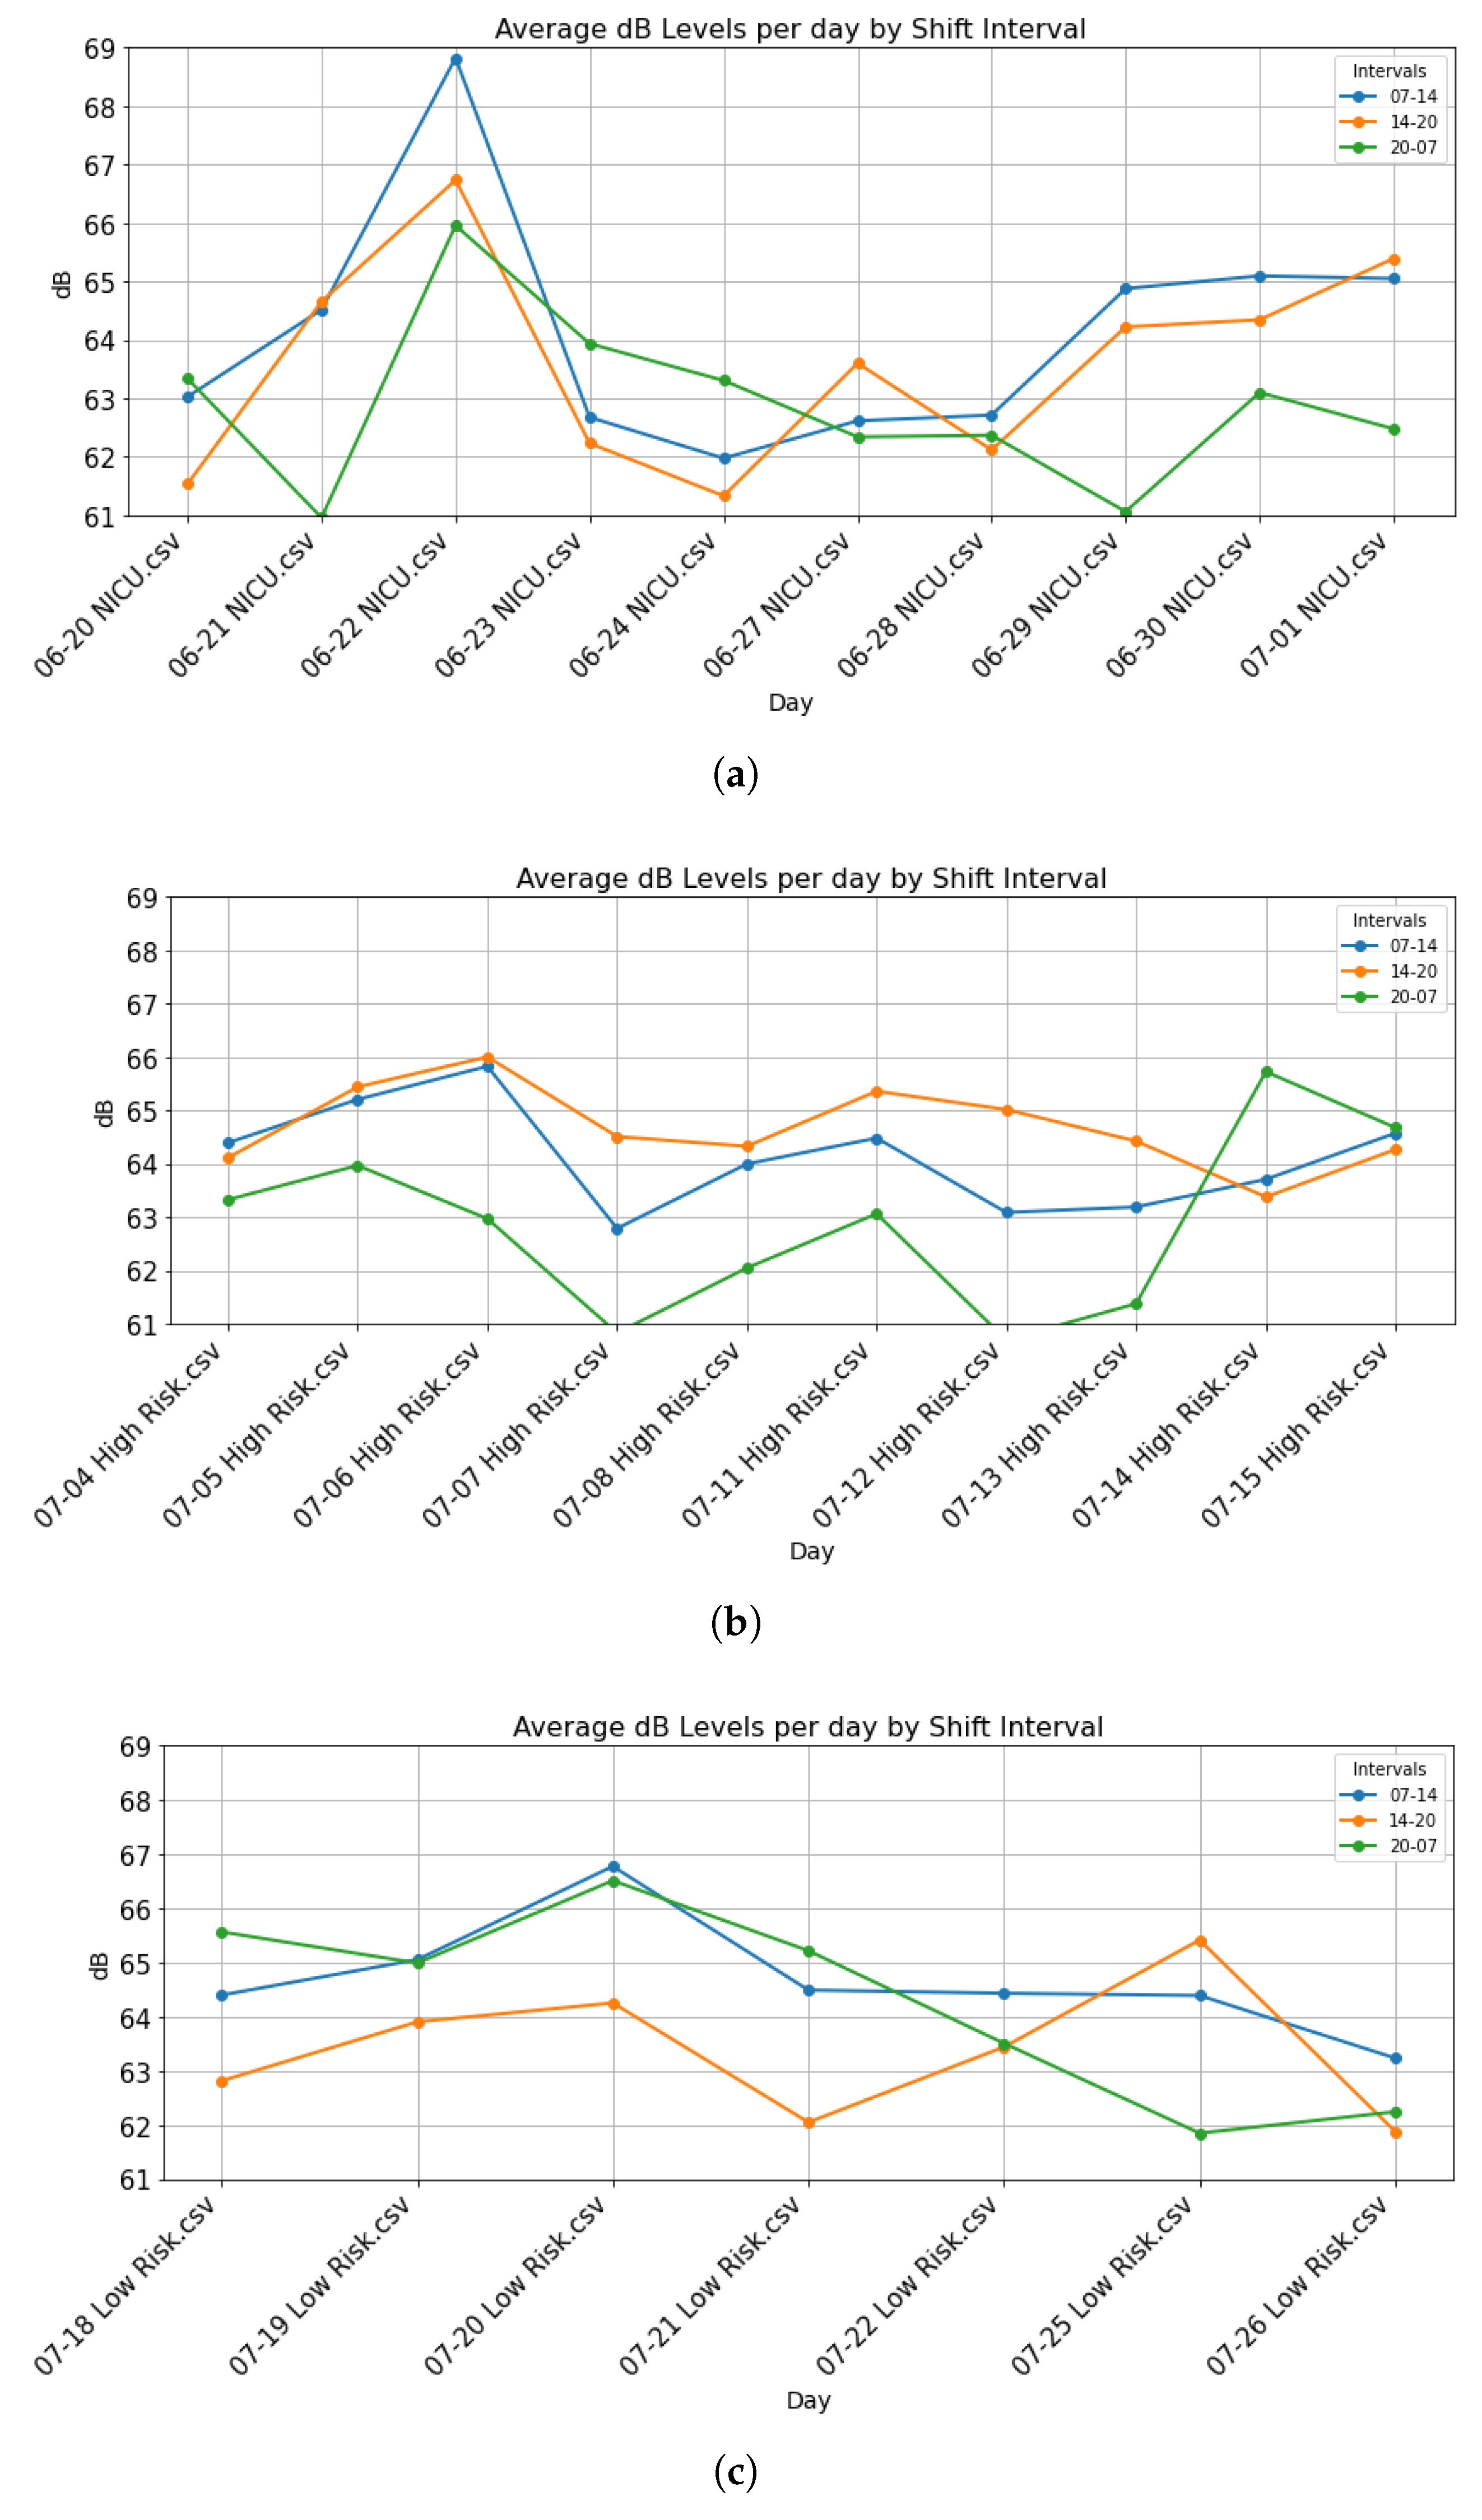

Table 1.
Summary of Key Noise Metrics by Unit and Day.
| Date(Month-day) | time percent over 65 dB | time percent over 80 dB | ||
|---|---|---|---|---|
| 06-20 | 29.79 | 0.012 | 65.2 | |
| 06-21 | 28.8 | 0.021 | 64.8 | |
| 06-22 | 67.18 | 0.09 | 68.4 | |
| 06-23 | 27.847 | 0.015 | 65.1 | |
| NICU | 06-24 | 27.54 | 0.046 | 65.8 |
| 06-27 | 23.93 | 0.027 | 64.6 | |
| 06-28 | 22.9 | 0.049 | 64.5 | |
| 06-29 | 28.06 | 0.038 | 65.0 | |
| 06-30 | 38.08 | 0.037 | 65.8 | |
| 07-01 | 39.73 | 0.047 | 66.3 | |
| 07-04 | 26.42 | 0.011 | 65.2 | |
| 07-05 | 34.17 | 0.033 | 65.9 | |
| 07-06 | 41.51 | 0.045 | 66.3 | |
| 07-07 | 24.94 | 0.054 | 65.2 | |
| High-Risk | 07-08 | 27.11 | 0.035 | 65.1 |
| 07-11 | 34.11 | 0.037 | 66.0 | |
| 07-12 | 26.51 | 0.031 | 65.1 | |
| 07-13 | 20.41 | 0.018 | 64.4 | |
| 07-14 | 34.5 | 0.043 | 66.1 | |
| 07-15 | 31.88 | 0.024 | 65.9 | |
| 07-18 | 39.07 | 0.017 | 66.2 | |
| 07-19 | 40.11 | 0.031 | 66.4 | |
| 07-20 | 60.13 | 0.012 | 67.1 | |
| Low-Risk | 07-21 | 33.11 | 0.007 | 65.8 |
| 07-22 | 23.58 | 0.003 | 64.7 | |
| 07-25 | 31.71 | 0.014 | 65.5 | |
| 07-26 | 20.85 | 0.015 | 64.9 |
1 In the NICU, the June 22 was particularly notable, with noise levels remaining above the critical threshold for more than half of the 24-hour period. In the High-Risk, on July 6 there is a 41 percent of the day with noise levels remaining above the critical threshold. In the Low-Risk, on July 20 there is over half day with noise levels remaining above the critical threshold.
Table 2.
Extract of results to apply a T-test.
| Interval | P value | H0 |
|---|---|---|
| 00:05:40-00:06:39 | 0.791 | False |
| 00:05:50-00:06:49 | 0.0549 | False |
| 00:06:00-00:06:59 | 2.94e-05 | True |
| 00:06:10-00:07:09 | 8.02e-06 | True |
| 00:06:20-00:07:19 | 2.64e-4 | True |
| 00:06:30-00:07:29 | 5.76e-3 | True |
| 00:06:40-00:07:39 | 0.726 | False |
| 00:06:50-00:07:49 | 0.999 | False |
| 00:15:50-00:16:49 | 0.939 | False |
| 00:16:00-00:16:59 | 0.602 | False |
| 00:16:10-00:17:09 | 0.00218 | True |
| 00:16:20-00:17:19 | 0.0325 | False |
| 00:16:30-00:17:29 | 0.480 | False |
| 00:16:40-00:17:39 | 0.304 | False |
1 There are two selected intervals extracts of July 11, to explain which intervals are considered as significative.
Table 3.
Recommended vs. Observed Noise Levels in Nurseries and NICUs (Source [2]).
Table 3.
Recommended vs. Observed Noise Levels in Nurseries and NICUs (Source [2]).
| Noise Source | Recommended Level (dB) | Observed Level (dB) |
|---|---|---|
| Continuous ambient noise | 45–50 | >62 |
| Alarms/interventions | Up to 70 | >90 |
| High-frequency ventilators | – | 80–90 |
| Conversations and visitors | <50 | 60–70 |
Disclaimer/Publisher’s Note: The statements, opinions and data contained in all publications are solely those of the individual author(s) and contributor(s) and not of MDPI and/or the editor(s). MDPI and/or the editor(s) disclaim responsibility for any injury to people or property resulting from any ideas, methods, instructions or products referred to in the content. |
© 2025 by the authors. Licensee MDPI, Basel, Switzerland. This article is an open access article distributed under the terms and conditions of the Creative Commons Attribution (CC BY) license (http://creativecommons.org/licenses/by/4.0/).
Copyright: This open access article is published under a Creative Commons CC BY 4.0 license, which permit the free download, distribution, and reuse, provided that the author and preprint are cited in any reuse.


