
Submitted:
05 December 2025
Posted:
10 December 2025
You are already at the latest version
Abstract
Background: Preeclampsia (PE) is a leading cause of maternal and perinatal morbidity worldwide, yet its mechanisms remain poorly understood. Dysregulated innate im-munity, specifically aberrant complement activation and excessive neutrophil extracel-lular traps (NETs) formation, contributes to endothelial dysfunction and inflammation in preeclampsia. However, the interaction between complement activation and NETs, as well as the differences between these immune pathways in early-onset and late-onset preeclampsia, remain unclear. To address this gap, we assessed complement components and NET markers across various preeclampsia phenotypes and examined their rela-tionships.
Methods: Plasma samples were collected from 56 women with early-onset preeclampsia (EO-PE) before 34 weeks, 32 with late-onset preeclampsia (LO-PE) after 34 weeks, and 32 healthy pregnant women in the control group. Complement components (C1q, C3, C3a, C4, and the terminal complement complex, TCC) and NETs markers (MPO-DNA, cit-rullinated histone H3, and cathepsin G) were measured using ELISA. Group differences were assessed with non-parametric tests, and associations between markers and clinical variables were analyzed using Spearman correlations.
Results: We observed higher levels of C1q, C3, C3a, and TCC in pregnant women with severe preeclampsia compared with healthy pregnancies (p < 0.001), while C4 levels remained unchanged. Among neutrophil trap biomarkers, MPO-DNA levels were el-evated in EO-PE (p = 0.019), while CitH3 and cathepsin G levels did not differ significantly between groups. Strong correlations were observed between MPO-DNA and TCC (ρ = 0.30, p = 0.013), as well as between cathepsin G and C3a (ρ = 0.40, p = 0.0007), indicating NETs–complement interactions. Patterns of complement and NETs activation were similar in early and late preeclampsia, despite differences in gestational age.
Conclusions: The observed associations between MPO-DNA and TCC, and between cathepsin G and C3a, indicate meaningful crosstalk between NETs and complement ac-tivation. These findings support the role of innate immune dysregulation in preeclampsia and highlight NETs–complement interactions as potential targets for diagnostic and therapeutic approaches.
Keywords:
preeclampsia
; early-onset preeclampsia
; late-onset preeclampsia
; complement activation
; C1q
; C3a
; TCC
; neutrophil extracellular traps (NETs)
; MPO-DNA
; citrullinated histone H3 (CitH3)
; cathepsin G
; innate immunity
1. Introduction
Preeclampsia (PE) is a multisystem disorder characterized by new-onset hypertension and/or proteinuria after 20 weeks of gestation [1,2] and remains a leading cause of maternal and perinatal morbidity and mortality worldwide [3]. Early-onset (EO) and late-onset (LO) preeclampsia are recognized as distinct subtypes [4], with early-onset (<34 weeks) disease more strongly associated with placental dysfunction, and late-onset (≥34 weeks) disease reflecting predominantly maternal cardiovascular susceptibility. Although the clinical manifestations of PE are well defined, its underlying biological mechanisms remain debated [4,5,6], and no single unifying hypothesis fully explains its heterogeneous presentation [7,8]. Despite the multifactorial nature of PE development, increasing evidence demonstrates that dysregulation of innate immune mechanisms, in particular activation of the complement system [9,10,11] and formation of neutrophil extracellular traps (NETs) [12,13,14], plays a key role in the pathogenesis of PE [15].
The complement system is involved in placental development, clearance of apoptotic cells, and maintenance of immune homeostasis in the maternal-fetal system [16]. However, excessive or uncontrolled activation of complement pathways is associated with endothelial dysfunction, placental damage, and hypertensive disorders of pregnancy [17,18]. Several studies [10,17,18,19] have reported elevated levels of complement activation products, including C1q, C3, C3a, C4, and, especially, the terminal complement complex (TCC, C5b-9), in both maternal and fetal circulations in preeclampsia, suggesting activation of both the classical and terminal pathways. However, findings regarding specific pathways and the extent of activation in early- versus late-onset disease remain inconsistent [20].
Neutrophils are highly active in PE and can release extracellular chromatin structures (NETs), composed of extracellular chromatin fibers coated with serine proteases such as MPO-DNA complexes, neutrophil elastase, cathepsin G, and decondensed citrullinated histone H3 (CitH3), represent another innate immune mechanism increasingly implicated in the pathogenesis of PE [22,23].
NETs promote thrombosis, endothelial injury, injure trophoblasts, obstruct intervillous blood flow, amplify inflammation, and may serve as a platform for complement activation [24]. Importantly, NETs and complement activation appear to reinforce one another in a self-amplifying inflammatory loop [15,24]. Yet, the nature and magnitude of this interplay in different PE phenotypes remain poorly understood and, in some cases, controversial [20,25]. Despite growing interest [26,27], only a few studies combine immunological markers with detailed clinical phenotyping [17,28,29]. Many studies focus on either complement [18,19,20,21] or NETs [30,31,32,33], but rarely both together with profound clinical implications. Understanding how complement system and NETs activation patterns align with PE phenotypes may shed light on the disorder's immunopathological diversity and support biomarker-based risk stratification.
We hypothesized that EO-PE demonstrates stronger complement–NET activation than LO-PE and that these immune signatures correlate with clinical severity and maternal characteristics.
To address this, we quantified complement components (C1q, C3, C3a, C4, and C5b-9) and NETs markers (MPO-DNA complexes, CitH3, cathepsin G), compared patterns across PE phenotypes, and explored correlations between immunological and clinical parameters.
2. Results
2.1. Participants’ characteristics
The study included 120 pregnant women stratified into four groups: EO-PE (n = 56), LO-PE (n = 32), a healthy control group <34 weeks (n = 17), and a healthy control group ≥34 weeks (n = 15). Women with EO-PE and LO-PE were comparable in age and body mass index (BMI). No significant differences were observed between the two PE subgroups in maternal age (median 32.5 [28.8–36.0] vs. 34.0 [31.0–36.0] years; p = 0.522) or BMI (29.7 [27.8–34.5] vs. 30.0 [28.0–33.8] kg/m²; p = 0.608). As expected, EO-PE was characterized by a markedly earlier gestational age at both hospital admission and delivery compared with LO-PE. The median gestational age at admission was 32.0 [29.0–33.0] weeks in EO-PE and 35.5 [34.9–36.5] weeks in LO-PE (p < 0.001). Similarly, gestational age at birth was significantly lower in women with LO-PE (31.15 [29.43–32.52] vs. 36.60 [35.98–37.05] weeks; p < 0.0001). Daily proteinuria did not differ significantly between the groups (1.30 [0.31–2.54] g/day in EO-PE vs. 1.70 [0.77–2.25] g/day in LO-PE; p = 0.670), suggesting a similar degree of renal involvement. Overall, the EO-PE and LO-PE groups demonstrated comparable maternal characteristics, with the primary difference being gestational age at presentation and delivery — consistent with established clinical distinctions between early- and late-onset disease. Baseline characteristics did not differ between the two control subgroups except for gestational age.
2.2. Complement System Activation
Median concentrations of C1q, C3, C3a, C4, and terminal complement complex (TCC) for all four groups are summarized in Table 1. According to the Kruskal–Wallis test, significant overall group differences were observed for C1q, C3, C3a, and TCC (all p < 0.001), whereas C4 showed no significant variation (p = 0.240). Both early-onset and late-onset preeclampsia demonstrated marked activation of the classical and alternative complement pathways. Plasma C1q levels were substantially higher in EO-PE and LO-PE than in gestational-age–matched controls. A similar pattern was seen for C3 and its activation fragment C3a, with both PE groups showing distinctly elevated concentrations compared with healthy pregnancies. C3a concentrations were significantly higher in both EO-PE and LO-PE compared with gestational-age–matched controls, with non-overlapping interquartile ranges between control and preeclamptic pregnancies, indicating robust activation of the C3–C3a axis in preeclampsia. C4 levels, in contrast, did not differ significantly across groups, suggesting limited discriminatory value of this classical pathway component in the present cohort. Activation of the terminal complement pathway was particularly pronounced. TCC concentrations were significantly increased in both EO-PE and LO-PE relative to controls, indicating enhanced formation of the membrane attack complex (MAC) in preeclamptic pregnancies.
Taken together, these data demonstrate a consistent up-regulation of complement activation—spanning classical, alternative, and terminal pathway components—in both early- and late-onset preeclampsia. The absence of differences between EO-PE and LO-PE supports a shared complement activation signature across clinical phenotypes of the disorder.
2.3. Neutrophil Extracellular Trap (NETs) Biomarkers in Preeclampsia
Table 2 summarizes circulating NETs-associated markers—MPO–DNA complexes, citrullinated histone H3 (CitH3), and cathepsin G—in healthy controls <34 weeks, controls ≥34 weeks, early-onset preeclampsia (EO-PE), and late-onset preeclampsia (LO-PE).
Across all three biomarkers, median concentrations were higher in preeclamptic pregnancies compared with both gestational-age–matched control groups, although none of the markers reached statistical significance in the Kruskal–Wallis test (MPO–DNA: p = 0.051; CitH3: p = 0.150; cathepsin G: p = 0.060). The greatest elevation was observed for MPO–DNA and cathepsin G, which showed a consistent upward shift in both EO-PE and LO-PE relative to controls.
The overall distributional pattern shows a trend toward NETs enrichment in preeclampsia, indicating increased neutrophil activation and extracellular trap formation, even in the absence of statistically significant changes.
No differences were detected between EO-PE and LO-PE, supporting a shared NETs activation profile across the two clinical phenotypes.
2.4. Relationship Between Complement Activation and NETs Formation
Table 3 summarizes the Spearman correlation coefficients between circulating NETs biomarkers (MPO–DNA, CitH3, and cathepsin G) and components of the complement system (C1q, C3a, and terminal complement complex, TCC). The analysis demonstrates several significant positive correlations, indicating coordinated activation of neutrophil extracellular traps and complement pathways in preeclamptic pregnancies.
The strongest associations were observed between MPO–DNA and both TCC and C3a, as well as between cathepsin G and C1q/C3a, suggesting that increased complement activation is accompanied by enhanced NETosis (Figure 1).
These correlations support the presence of a functional Complement–NETs amplification loop, in which complement activation products promote NETs formation, and NETs, in turn, propagate further complement activation. Weak negative correlations of CitH3 with C1q and TCC did not reach statistical significance, reflecting biomarker-specific variability in NETs components. Taken together, this correlation pattern indicates that complement activation and the formation of NET are not isolated events but represent interrelated links in the impaired regulation of innate immunity in both early and late preeclampsia.
2.5. Differences Between Early- and Late-Onset Preeclampsia
Table 4 provides the head-to-head comparison between EO-PE and LO-PE across all measured immune markers, including classical, alternative, and terminal complement pathway components, as well as circulating NETs-associated biomarkers. This table allows assessment of whether early- and late-onset disease differ in the magnitude or pattern of complement activation and NETosis.
Although overall NETs biomarkers did not differ significantly between early- and late-onset preeclampsia, MPO–DNA complexes tended to be higher in the EO-PE group. This pattern is biologically plausible, as early-onset preeclampsia represents a more severe, placenta-driven phenotype characterized by profound placental hypoxia, increased release of trophoblast-derived danger signals, and stronger activation of the innate immune response. These stimuli promote enhanced neutrophil activation and NETosis, resulting in greater accumulation of MPO–DNA complexes. Thus, the relative increase in MPO–DNA in EO-PE may reflect the intensity and duration of placental injury rather than a fundamentally different NETs profile between the two PE subtypes.
3. Discussion
To our knowledge, no previous study has simultaneously assessed complement activation, NETs formation, and the detailed clinical phenotypes of early and late preeclampsia. Therefore, this study presents a comprehensive immunological and clinical characterization of preeclampsia that has not been previously reported.
Having demonstrated that both EOP and LOP were characterized by comparable activation of complement pathways and NET markers, it is important to consider whether gestational age itself may influence baseline values. From a physiological perspective, certain complement components, such as C3 and C4, show a moderate increase by the third trimester, reflecting normal immune adaptation during pregnancy. In contrast, upstream and terminal activation markers (C1q, C3a, TCC), as well as NETs-associated biomarkers, show little to no gestational variation in healthy pregnancies.
Although gestational age has a moderate effect on physiological levels of specific complement proteins (such as C3 and C4), in healthy pregnant women, its impact is significantly less than the magnitude of changes observed in preeclampsia. It is important to note that the control group in this study was stratified by gestational age (<34 or ≥34 weeks), which minimizes potential error related to physiological gestational changes.
Given that the magnitude of complement and NETs activation observed in both early-onset and late-onset preeclampsia greatly exceeded the expected physiological variation across gestation, the similarities between EO-PE and LO-PE cannot be attributed to differences in gestational age. Rather, these findings support the concept that dysregulated complement activation and NET-driven inflammation represent core mechanisms shared by both clinical subtypes of preeclampsia.
The idea of a Complement–NETs amplification loop (Figure 2), in which complement activation and NET synthesis function as mutually reinforcing processes, provides a mechanistic framework for understanding these results. NETs provide a highly pro-inflammatory scaffold composed of DNA, histones, and neutrophil granule enzymes that can directly bind and activate complement components, including C1q and C3, thereby amplifying classical and alternative pathway activity. Proteases released during NETosis, such as cathepsin G, further cleave complement proteins into active fragments, enhancing downstream signaling and promoting terminal pathway activation.
Conversely, complement activation products—particularly C3a, C5a, and sublytic C5b-9—serve as potent stimuli for neutrophil activation and NET release. These anaphylatoxins prime neutrophils, increase their responsiveness to placental danger signals, and promote NETosis in both maternal circulation and the uteroplacental interface. Through this bidirectional interaction, complement activation and NET formation perpetuate a cycle of endothelial injury, oxidative stress, and microvascular dysfunction—hallmarks of the maternal syndrome of preeclampsia. The presence of consistent correlations between complement activation products (C3a, C1q, TCC) and NETs-related biomarkers (MPO–DNA, cathepsin G) in our study supports the biological relevance of this loop in both EO-PE and LO-PE.
In summary, our results indicate that PE is characterized by coordinated activation of complement pathways together with the excessive NETs formation, representing interconnected immunological processes that contribute to endothelial damage and the clinical manifestations of severe PE (Complement system-NETs loop). Despite differences in timing of PE (before and after 34 weeks), the observation that both early and late PE exhibit similar patterns of complement dysregulation and NETs formation suggests a common immunopathological mechanism.
These findings highlight the potential clinical value of combined complement and NET profiling for improved disease phenotyping and risk stratification. Further research is needed to determine whether these biomarkers may serve as therapeutic targets or prognostic indicators of adverse maternal and perinatal outcomes.
There are several limitations to this study. First, the results may not be as applicable to larger populations with more varied clinical and demographic features due to its single-center design. Secondly, while the sample size was sufficient for identifying group differences, subgroup analyses—especially within EO-PE and LO-PE— could benefit from using larger cohorts in future studies. Third, biomarker measurements were performed at a single time point, which precludes assessment of temporal dynamics in complement or NETs activation across pregnancy. Fourth, although healthy controls were stratified by gestational age, some degree of natural inter-individual immunological heterogeneity cannot be entirely excluded. Lastly, because this was an observational study, some connections between placental failure, complement system activation, and the creation of NETs were not shown, underscoring the need for longer-term research. The final limitation of the conducted work was that the observational nature of the study did not allow for establishing certain links between placental dysfunction, complement system activation, and NET formation, underscoring the need for longitudinal studies.
4. Materials and Methods
A cross-sectional, single-center comparative study was conducted at the Perinatal Center of City Clinical Hospital No. 67 named after L. A. Vorokhobov (Moscow, Russia) between September 2023 and June 2025. The study included pregnant women diagnosed with severe preeclampsia and healthy pregnant women with uncomplicated physiological pregnancies. All participants provided written informed consent prior to enrollment.
The study protocol was approved by the Local Ethics Committee (Protocol No. 29–24 dated December 5, 2024) and complies with the Declaration of Helsinki.
Inclusion Criteria
Pregnancy ≥ 20 weeks of gestation.
For the preeclampsia group: clinical and laboratory signs of severe preeclampsia, including systolic blood pressure ≥ 160 mmHg and/or diastolic ≥ 110 mmHg; proteinuria ≥ 2 g/day or ≥ 2+ on urine dipsticks; signs of maternal organ dysfunction.
For the control group: normal pregnancy course, absence of hypertension, proteinuria, or obstetric complications.
Written informed consent to participate
Exclusion Criteria
Chronic arterial hypertension.
Pre-gestational diabetes mellitus.
Autoimmune or infectious diseases.
Multiple pregnancy.
Severe somatic pathology (kidney, liver, connective tissue disease).
Declined participation.
Study Groups
A total of 120 pregnant women were enrolled and stratified into four groups matched for age and gestational age:
Early-onset PE (EO-PE) before 34 weeks of gestation (n = 56).
Late-onset PE (LO-PE) at or after 34 weeks (n = 32).
Healthy controls <34 weeks: physiological pregnancy, gestational age <34 weeks (n = 17).
Healthy controls ≥34 weeks: physiological pregnancy, gestational age ≥34 weeks (n = 15).
Sample Collection
All study participants had venous blood samples collected into EDTA tubes during hospitalization. Samples were centrifuged for 10 minutes at 1500 g at 4°C. Plasma was aliquoted and stored at –80°C until analysis. Repeated freeze-thaw cycles were avoided.
Complement System Measurement
Concentrations of complement components C1q, C3a, and C4, as well as the terminal complement complex TCC (C5b-9), were measured using ELISA-based assays according to manufacturers’ instructions [34,35].
C1q levels were measured using a quantitative sandwich ELISA (Human C1q ELISA Kit, Elabscience®, Cat. No. E-EL-H2255), with an analytical range of 31.25–2000 ng/mL and a sensitivity of 18.75 ng/mL. In the present study, the median C1q concentration in the healthy control group was 78.38 ng/mL.
C3 levels were measured using a quantitative sandwich ELISA (Human C3 ELISA Kit, Elabscience®, Cat. No. E-EL-H0834), with an analytical range of 31.25–2000 ng/mL and a sensitivity of 18.75 ng/mL. In the present study, the median C3 concentration in the healthy control group was 959.0 ng/mL.
C3a levels were measured using a quantitative ELISA (Human C3a ELISA Kit, Hycult Biotech®, Cat. No. HK354), with an analytical range of 31.3–2000 pg/mL and a sensitivity of 31.3 pg/mL. In the present study, the median C3a concentration in the healthy control group was 541.40 pg/mL.
C4 levels were measured using a quantitative sandwich ELISA (Human C4 ELISA Kit, Elabscience®, Cat. No. E-EL-H0259), with an analytical range of 3.13–200 ng/mL and a sensitivity of 1.88 ng/mL. In the present study, the median C4 concentration in the healthy control group was 532.0 ng/mL.
TCC (C5b-9) levels were measured using a quantitative ELISA (Human TCC ELISA Kit, Hycult Biotech®, Cat. No. HK328), with a detection range of 0–3000 mAU/mL and a sensitivity of 40 mAU/mL. In the present study, the median TCC (C5b-9) concentration in the healthy control group was 1623 mAU/mL.
All samples were assayed in duplicate. Calibration standards and quality controls were included in each run.
Measurement of NETs Biomarkers
Three NET-associated markers were quantified:
1. MPO–DNA complexes were quantified using a capture ELISA specific for myeloperoxidase-bound DNA (MPO–DNA ELISA Kit, Cayman Chemical, Ann Arbor, MI, USA; Cat. No. 601010) with an analytical range of 0.3–10 ng/mL and a sensitivity of ~0.3 ng/mL. The assay detects NETs-associated chromatin fragments through MPO capture and anti-DNA detection. In the present study, the median MPO–DNA concentration in the healthy control group was 7.62 ng/mL.
2. Citrullinated Histone H3 (CitH3), a specific marker of PAD4-dependent chromatin decondensation during NET formation, was measured using the CitH3 (Clone 11D3) ELISA Kit (Cayman Chemical, Ann Arbor, MI, USA; Cat. No. 501620) with a reference range of 0–5 ng/mL and a sensitivity of approximately 0.1 ng/mL. In the present study, the median CitH3 concentration in the healthy control group was 0.24 ng/mL.
3. Plasma Cathepsin G was measured using a quantitative sandwich ELISA (AssayMax™ Human Cathepsin G ELISA Kit, Assaypro LLC, St. Charles, MO, USA; Cat. No. ECATG) with an analytical range is 3.125–100 ng/mL, with a sensitivity of approximately 1.0 ng/mL. In the present study, the median Cathepsin G concentration in the healthy control group was 22.84 ng/mL.
All complement system and NETs markers were measured according to the manufacturers’ protocols.
5. Conclusions
In conclusion, this study demonstrates that preeclampsia is characterized by pronounced activation of complement pathways and enhanced NETs formation, representing interconnected immune mechanisms underlying both early- and late-onset disease. The comparable immune profiles observed across EO-PE and LO-PE indicate shared pathogenic pathways despite differences in gestational timing. These findings emphasize the potential clinical value of complement and NETs biomarkers for refining disease classification and guiding future preventive and therapeutic strategies. Further research is warranted to explore whether modulation of these pathways may mitigate disease severity or improve maternal and fetal outcomes.
Supplementary Materials
The following supporting information can be downloaded at: https://www.mdpi.com/article/doi/s1, Figure S1: title; Table S1: title; Figure S2: title; Table S2: title; Table S3: title.
Author Contributions
Conceptualization, J.K., G.G., and A.M.; methodology, V.B., G.G. and M.T.; data curation, A.A., D.K., S.M., N.M.; software K.G., N.G., and T.M.; validation, G.S., and G.G.; investigation, P.D; formal analysis, J-C.G. and I.E.; writing—original draft preparation, J.K., V.B.; visualization, V.B., I.K., N.K. and A.M. All authors have read and agreed to the published version of the manuscript.
Funding
This research received no external funding.
Institutional Review Board Statement
The study was conducted in accordance with the Declaration of Helsinki and approved by the Local Ethics Committee of Sechenov University for studies involving humans (Protocol No. 29–24; approval 05 December 2024).
Informed Consent Statement
Informed consent was obtained from all subjects involved in the study.
Data Availability Statement
The original contributions presented in this study are included in the article/supplementary material. Further inquiries can be directed to the corresponding author(s).
Acknowledgments
During the preparation of this manuscript/study, the author(s) used ChatGPT (OpenAI) used for language editing and figure editing. All scientific interpretations, data analysis, and conclusions were made by the authors. The authors have reviewed and edited the output and take full responsibility for the content of this publication.
Conflicts of Interest
The authors declare no conflicts of interest.
References
- Hypertension in pregnancy. Report of the American College of Obstetricians and Gynecologists’ Task Force on Hypertension in Pregnancy. Obstet Gynecol. 2013 Nov;122(5):1122-1131. doi: 10.1097/01.AOG.0000437382.03963.88. PMID: 24150027. [CrossRef]
- Onah, L. N., Ezenwaeze, M. N., & Nwankwo, C. (2025). Pre-eclampsia: A comprehensive review of pathophysiology, clinical features, prevention and management. World Journal of Advanced Pharmaceutical and Medical Research. https://doi.org/10.53346/wjapmr.2025.9.1.0030. [CrossRef]
- Facca TA, Famá EAB, Mastroianni-Kirsztajn G, Sass N. Why Is Preeclampsia still an Important Cause of Maternal Mortality Worldwide? Rev Bras Ginecol Obstet. 2020 Sep;42(9):586-587. doi: 10.1055/s-0040-1714132. Epub 2020 Sep 29. PMID: 32992360; PMCID: PMC10309247. [CrossRef]
- Roberts JM, Hubel CA. The two stage model of preeclampsia: variations on the theme. Placenta. 2009 Mar;30 Suppl A(Suppl A):S32-7. doi: 10.1016/j.placenta.2008.11.009. Epub 2008 Dec 13. PMID: 19070896; PMCID: PMC2680383. [CrossRef]
- Gilbert JS, Ryan MJ, LaMarca BB, Sedeek M, Murphy SR, Granger JP. Pathophysiology of hypertension during preeclampsia: linking placental ischemia with endothelial dysfunction. Am J Physiol Heart Circ Physiol. 2008 Feb;294(2):H541-50. doi: 10.1152/ajpheart.01113.2007. Epub 2007 Nov 30. PMID: 18055511. [CrossRef]
- Cornelius DC. Preeclampsia: From Inflammation to Immunoregulation. Clin Med Insights Blood Disord. 2018 Jan 10;11:1179545X17752325. doi: 10.1177/1179545X17752325. PMID: 29371787; PMCID: PMC5772493. [CrossRef]
- Martini C, Saeed Z, Simeone P, Palma S, Ricci M, Arata A, Sorella A, Liani R, Ricci F, D'Antonio F, Mattioli AV, Gallina S, Santilli F, Renda G. Preeclampsia: Insights into pathophysiological mechanisms and preventive strategies. Am J Prev Cardiol. 2025 Jul 3;23:101054. doi: 10.1016/j.ajpc.2025.101054. PMID: 40703703; PMCID: PMC12284657. [CrossRef]
- Antonova A.S., Khizroeva J.Kh., Bitsadze V.O., Tretyakova M.V., Makatsariya N.A., Efendieva E.R., Shatilina A.Yu., Lyadnova E.M. Genetic thrombophilia and antiphospholipid antibodies in women with early and late preeclampsia: a retrospective cohort study. Obstetrics, Gynecology and Reproduction. 2025;19(1):14-25. (In Russ.) https://doi.org/10.17749/2313-7347/ob.gyn.rep.2024.586. [CrossRef]
- Regal JF, Burwick RM, Fleming SD. The Complement System and Preeclampsia. Curr Hypertens Rep. 2017 Oct 18;19(11):87. doi: 10.1007/s11906-017-0784-4. PMID: 29046976; PMCID: PMC5849056. [CrossRef]
- Burwick RM, Java A, Regal JF. The role of complement in normal pregnancy and preeclampsia. Front Immunol. 2025 Jul 24;16:1643896. doi: 10.3389/fimmu.2025.1643896. [CrossRef]
- Lokki AI, Heikkinen-Eloranta J, Jarva H, Saisto T, Lokki ML, Laivuori H, Meri S. Complement activation and regulation in preeclamptic placenta. Front Immunol. 2014 Jul 9;5:312. doi: 10.3389/fimmu.2014.00312. [CrossRef]
- Aslanian-Kalkhoran L, Mehdizadeh A, Aghebati-Maleki L, Danaii S, Shahmohammadi-Farid S, Yousefi M. The role of neutrophils and neutrophil extracellular traps (NETs) in stages, outcomes and pregnancy complications. J Reprod Immunol. 2024 Jun;163:104237. doi: 10.1016/j.jri.2024.104237. Epub 2024 Mar 8. PMID: 38503075. [CrossRef]
- Hahn S, Giaglis S, Hoesli I, Hasler P. Neutrophil NETs in reproduction: from infertility to preeclampsia and the possibility of fetal loss. Front Immunol. 2012 Nov 27;3:362. doi: 10.3389/fimmu.2012.00362. PMID: 23205021; PMCID: PMC3506920. [CrossRef]
- Gupta AK, Hasler P, Holzgreve W, Hahn S. Neutrophil NETs: a novel contributor to preeclampsia-associated placental hypoxia? Semin Immunopathol. 2007 Jun;29(2):163-7. doi: 10.1007/s00281-007-0073-4. PMID: 17621701. [CrossRef]
- Kajana X, Caridi G, Bruschi M, Spinelli S, Lugani F, Ghiggeri GM, La Porta E, Mortari G, Verrina EE, Angeletti A, Bigatti C. The Crosstalk Between NETs and the Complement Cascade: An Overview in Nephrological Autoimmune Disease. Int J Mol Sci. 2025 Mar 20;26(6):2789. doi: 10.3390/ijms26062789. PMID: 40141431; PMCID: PMC11943363. [CrossRef]
- Girardi G, Bulla R, Salmon JE, Tedesco F. The complement system in the pathophysiology of pregnancy. Mol Immunol. 2006 Jan;43(1-2):68-77. doi: 10.1016/j.molimm.2005.06.017. [CrossRef]
- Kumar V, Stewart JH 4th. The complement system in human pregnancy and preeclampsia. Front Immunol. 2025 Aug 19;16:1617140. doi: 10.3389/fimmu.2025.1617140. PMID: 40904461; PMCID: PMC12401976. [CrossRef]
- Blakey H, Sun R, Xie L, Russell R, Sarween N, Hodson J, et al. Pre-eclampsia is associated with complement pathway activation in the maternal and fetal circulation, and placental tissue. Pregnancy Hypertens. 2023 Jun;32:43-49. doi: 10.1016/j.preghy.2023.04.001. [CrossRef]
- Pierik E, Prins JR, van Goor H, Dekker GA, Daha MR, Seelen MAJ, Scherjon SA. Dysregulation of Complement Activation and Placental Dysfunction: A Potential Target to Treat Preeclampsia? Front Immunol. 2020 Jan 15;10:3098. doi: 10.3389/fimmu.2019.03098. PMID: 32010144; PMCID: PMC6974484. [CrossRef]
- He Y, Xu B, Song D, Yu F, Chen Q, Zhao M. Expression of the complement system's activation factors in plasma of patients with early/late-onset severe pre-eclampsia. Am J Reprod Immunol. 2016 Sep;76(3):205-11. doi: 10.1111/aji.12541. Epub 2016 Jul 27. PMID: 27461873. [CrossRef]
- Lynch AM, Gibbs RS, Murphy JR, Giclas PC, Salmon JE, Holers VM. Early elevations of the complement activation fragment C3a and adverse pregnancy outcomes. Obstet Gynecol. 2011 Jan;117(1):75-83. doi: 10.1097/AOG.0b013e3181fc3afa. PMID: 21173647; PMCID: PMC5267353. [CrossRef]
- Goggs R, Jeffery U, LeVine DN, Li RHL. Neutrophil-Extracellular Traps, Cell-Free DNA, and Immunothrombosis in Companion Animals: A Review. Vet Pathol. 2020 Jan;57(1):6-23. doi: 10.1177/0300985819861721. Epub 2019 Jul 25. PMID: 31342866. [CrossRef]
- Xu, X., Wu, Y., Xu, S. et al. Clinical significance of neutrophil extracellular traps biomarkers in thrombosis. Thrombosis J 20, 63 (2022). https://doi.org/10.1186/s12959-022-00421-y. [CrossRef]
- Yuen J, Pluthero FG, Douda DN, Riedl M, Cherry A, Ulanova M, Kahr WH, Palaniyar N, Licht C. NETosing Neutrophils Activate Complement Both on Their Own NETs and Bacteria via Alternative and Non-alternative Pathways. Front Immunol. 2016 Apr 14;7:137. doi: 10.3389/fimmu.2016.00137. PMID: 27148258; PMCID: PMC4831636. [CrossRef]
- Giaglis S, Stoikou M, Sur Chowdhury C, Schaefer G, Grimolizzi F, Rossi SW, Hoesli IM, Lapaire O, Hasler P, Hahn S. Multimodal Regulation of NET Formation in Pregnancy: Progesterone Antagonizes the Pro-NETotic Effect of Estrogen and G-CSF. Front Immunol. 2016 Dec 5;7:565. doi: 10.3389/fimmu.2016.00565. PMID: 27994595; PMCID: PMC5136684. [CrossRef]
- Cheng S, Norris W, Kalkunte S, Jash S, Richardson LR, Sharma S. Evidence for Complement Activation in Preeclampsia Placenta and Its Presence in Circulation. Am J Reprod Immunol. 2025 May;93(5):e70076. doi: 10.1111/aji.70076. PMID: 40388260. [CrossRef]
- Ramos A, Youssef L, Molina P, Martinez-Sanchez J, Moreno-Castaño AB, Blasco M, De Moner B, Tortajada M, Camacho M, Borrell M, Crovetto F, Pino M, Escolar G, Carreras E, Gratacos E, Diaz-Ricart M, Palomo M, Crispi F. Endothelial damage and complement dysregulation in fetuses from pregnancies complicated by preeclampsia. Acta Obstet Gynecol Scand. 2025 May;104(5):829-838. doi: 10.1111/aogs.15072. Epub 2025 Feb 25. PMID: 40007223; PMCID: PMC11981108. [CrossRef]
- Aneman I, Pienaar D, Suvakov S, Simic TP, Garovic VD, McClements L. Mechanisms of Key Innate Immune Cells in Early- and Late-Onset Preeclampsia. Front Immunol. 2020 Aug 18;11:1864. doi: 10.3389/fimmu.2020.01864. PMID: 33013837; PMCID: PMC7462000. [CrossRef]
- Zhong XY, Gebhardt S, Hillermann R, Tofa KC, Holzgreve W, Hahn S. Circulatory nucleosome levels are significantly increased in early and late-onset preeclampsia. Prenat Diagn. 2005 Aug;25(8):700-3. doi: 10.1002/pd.1204. PMID: 16050002. [CrossRef]
- Gupta AK, Gebhardt S, Hillermann R, Holzgreve W, Hahn S. Analysis of plasma elastase levels in early and late onset preeclampsia. Arch Gynecol Obstet. 2006 Jan;273(4):239-42. doi: 10.1007/s00404-005-0093-z. Epub 2005 Nov 15. PMID: 16292578. [CrossRef]
- Kunder M, Kutty AM, Lakshmaiah V, Sheela SR. Correlation of Plasma Neutrophil Elastase Activity and Endogenous Protease Inhibitor Levels with the Severity of Pre-eclampsia. J Clin Diagn Res. 2017 Mar;11(3):BC09-BC12. doi: 10.7860/JCDR/2017/24181.9469. Epub 2017 Mar 1. PMID: 28511370; PMCID: PMC5427296. [CrossRef]
- Guillotin F, Fortier M, Portes M, Demattei C, Mousty E, Nouvellon E, et al. Vital NETosis vs. suicidal NETosis during normal pregnancy and preeclampsia. Front Cell Dev Biol. 2023 Jan 5;10:1099038. doi: 10.3389/fcell.2022.1099038. PMID: 36684420; PMCID: PMC9849884. [CrossRef]
- Sundet BK, Sugulle M, Jacobsen DP, Bratseth V, Palmero S, Kindberg KM, et al. Predelivery maternal circulating neutrophil extracellular traps and deoxyribonuclease in placental dysfunction and preeclampsia. Am J Obstet Gynecol. 2025 Oct 15:S0002-9378(25)00731-8. doi: 10.1016/j.ajog.2025.10.003. Epub ahead of print. PMID: 41106578. [CrossRef]
- Dillon SP, D'Souza A, Kurien BT, Scofield RH. Systemic lupus erythematosus and C1q: A quantitative ELISA for determining C1q levels in serum. Biotechnol J. 2009 Aug;4(8):1210-4. doi: 10.1002/biot.200800273. Erratum in: Biotechnol J. 2010 Mar;5(3):337. Erratum in: Biotechnol J. 2010 May;5(5):530. PMID: 19370710; PMCID: PMC2829988. [CrossRef]
- He YD, Xu BN, Song D, Wang YQ, Yu F, Chen Q, Zhao MH. Normal range of complement components during pregnancy: A prospective study. Am J Reprod Immunol. 2020 Feb;83(2):e13202. doi: 10.1111/aji.13202. Epub 2019 Nov 12. PMID: 31646704; PMCID: PMC7027513. [CrossRef]
Figure 1.
Spearman correlation heatmap of complement components and NETs biomarkers (based on Table 3). The matrix illustrates positive and negative correlations between complement markers (C1q, C3a, TCC) and NETs-associated indicators (MPO–DNA, CitH3, cathepsin G). Correlation coefficients (ρ) are displayed within each cell.
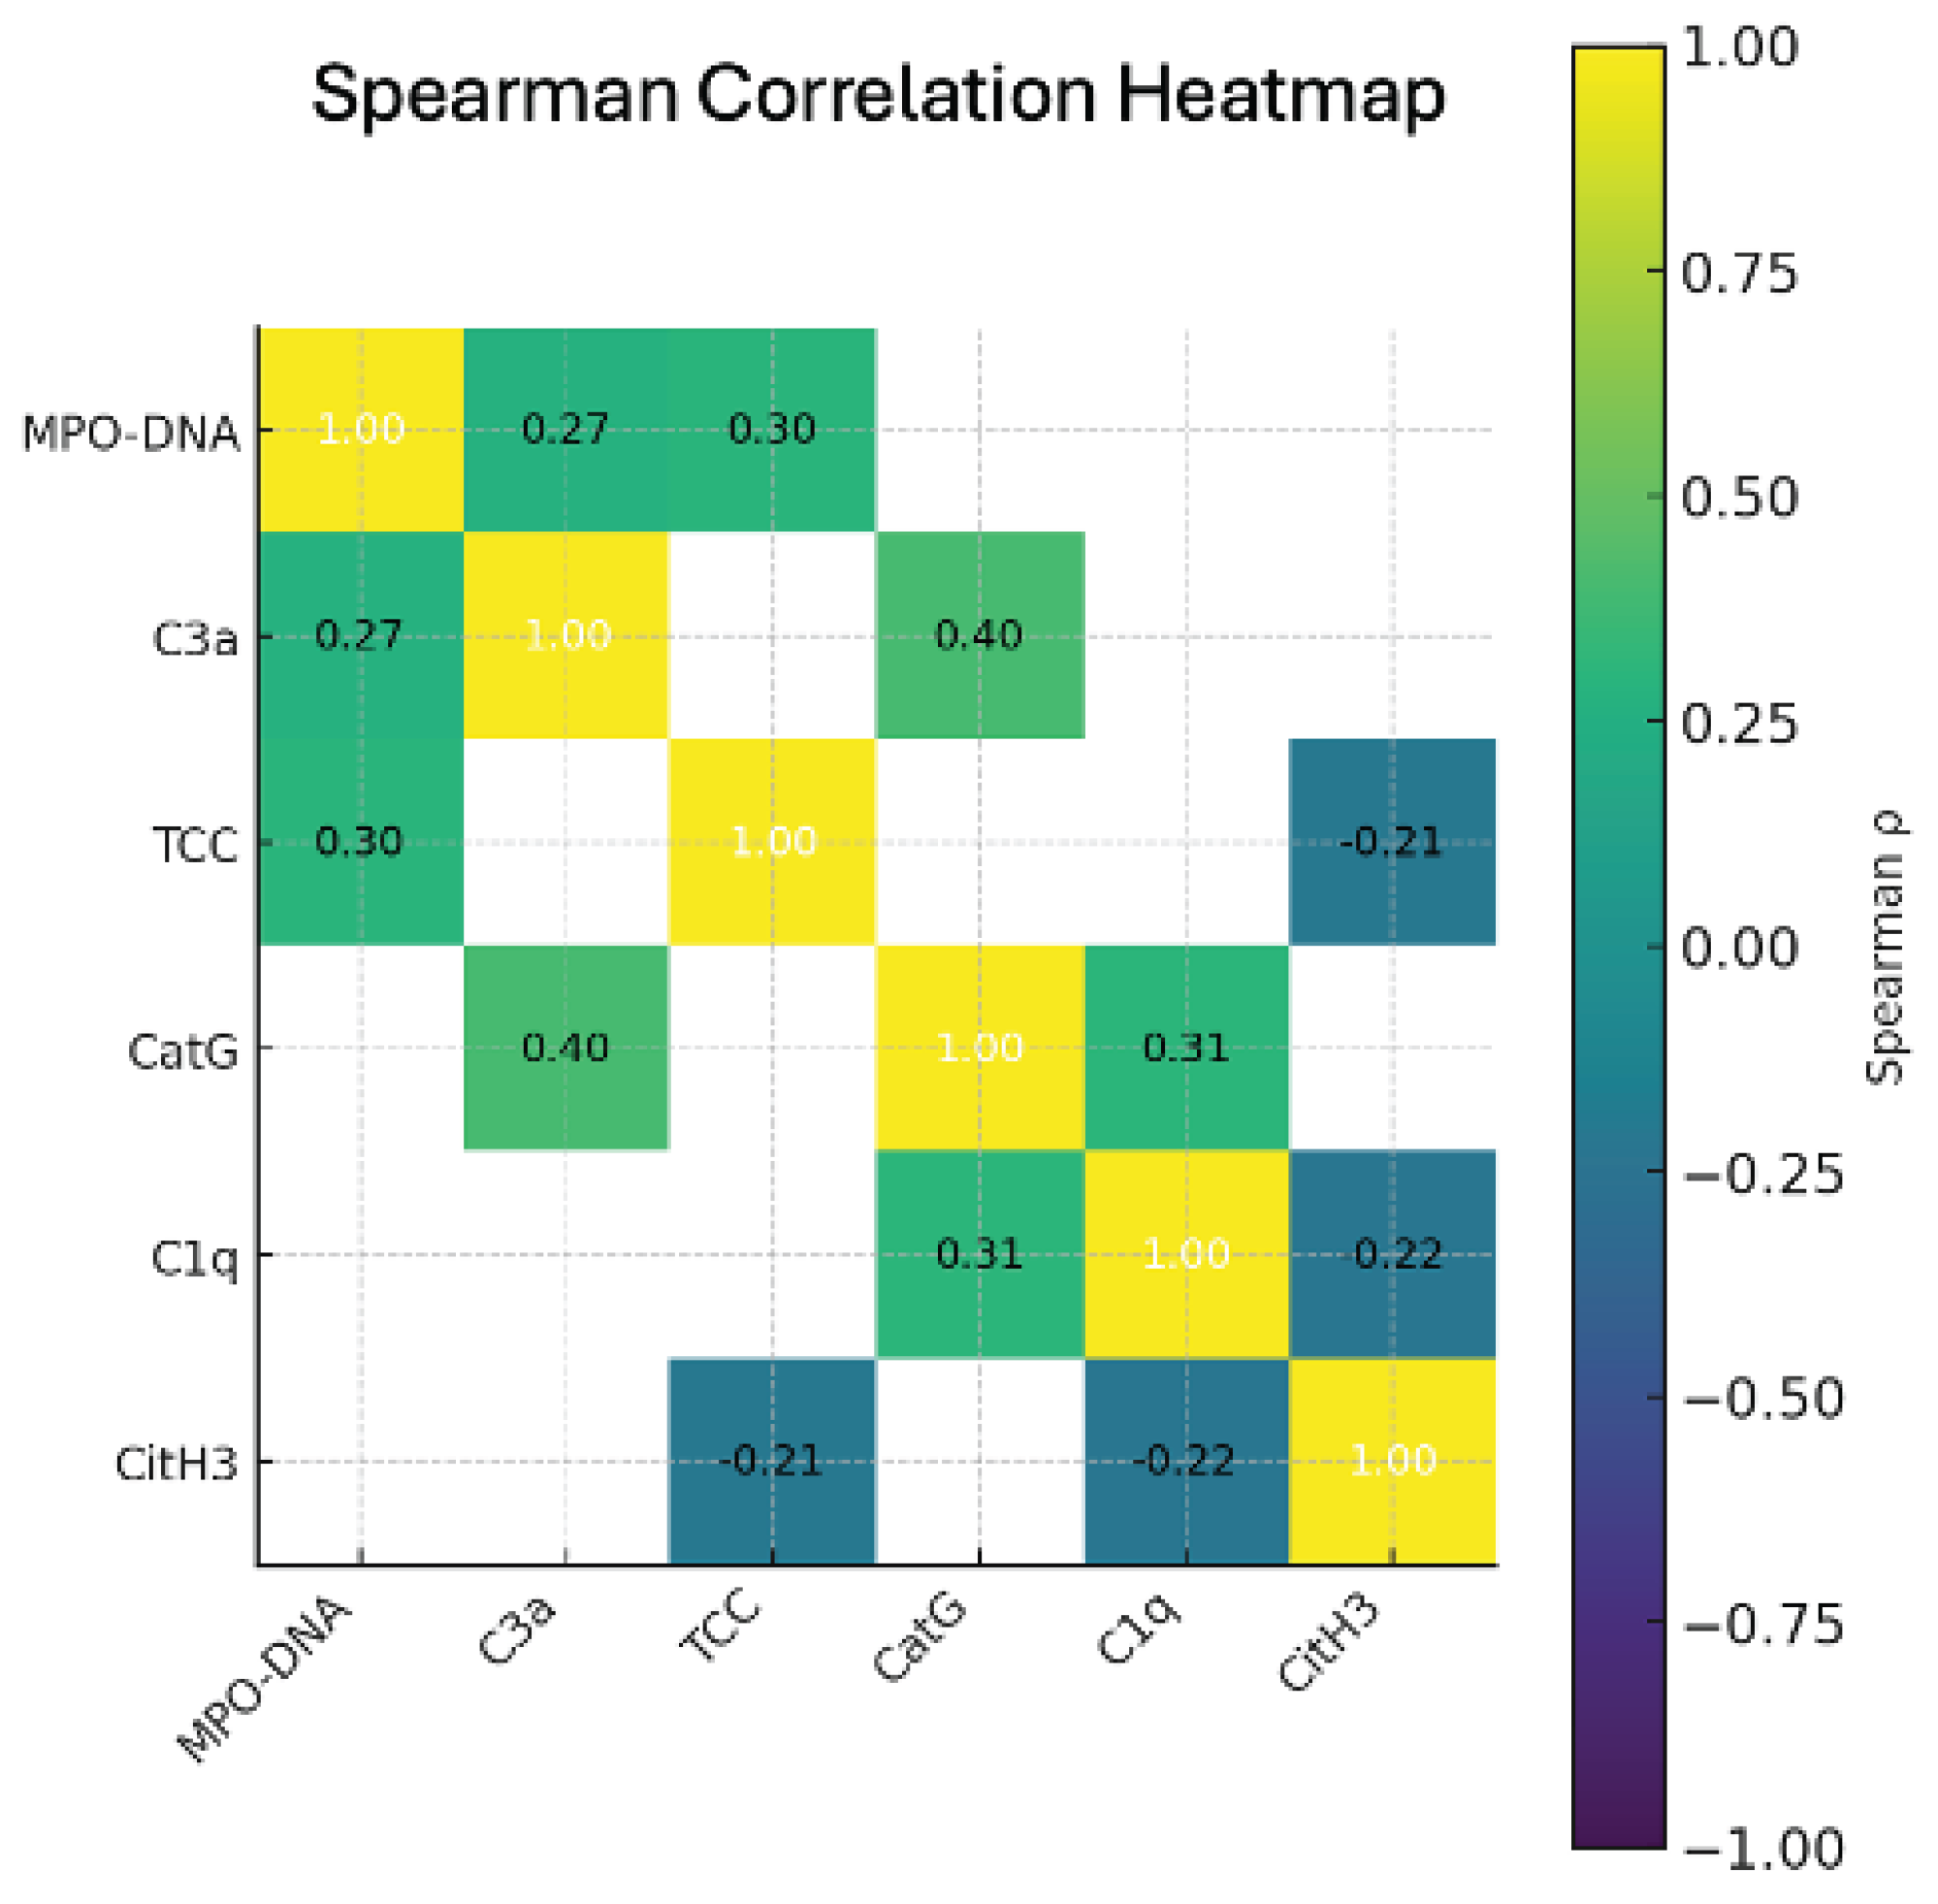
Figure 2.
Complement system-NETs loop. It shows how NETs and the complement system interact bidirectionally, creating a self-amplifying immunological loop that promotes endothelial dysfunction and the onset of preeclampsia. NETs components (MPO–DNA complexes, citrullinated histone H3, and Cathepsin G) and complement activation markers (C1q, C3, C3a, and the terminal complement complex TCC) measured in this study are shown in the upper panel. Arrows depict the reciprocal relationship between these pathways, indicating that NETs promote complement activation, while complement fragments further stimulate NETs formation. The lower panel highlights that both EO-PE and LO-PE exhibit similar activation patterns throughout these pathways supporting a shared underlying immunopathological mechanism.
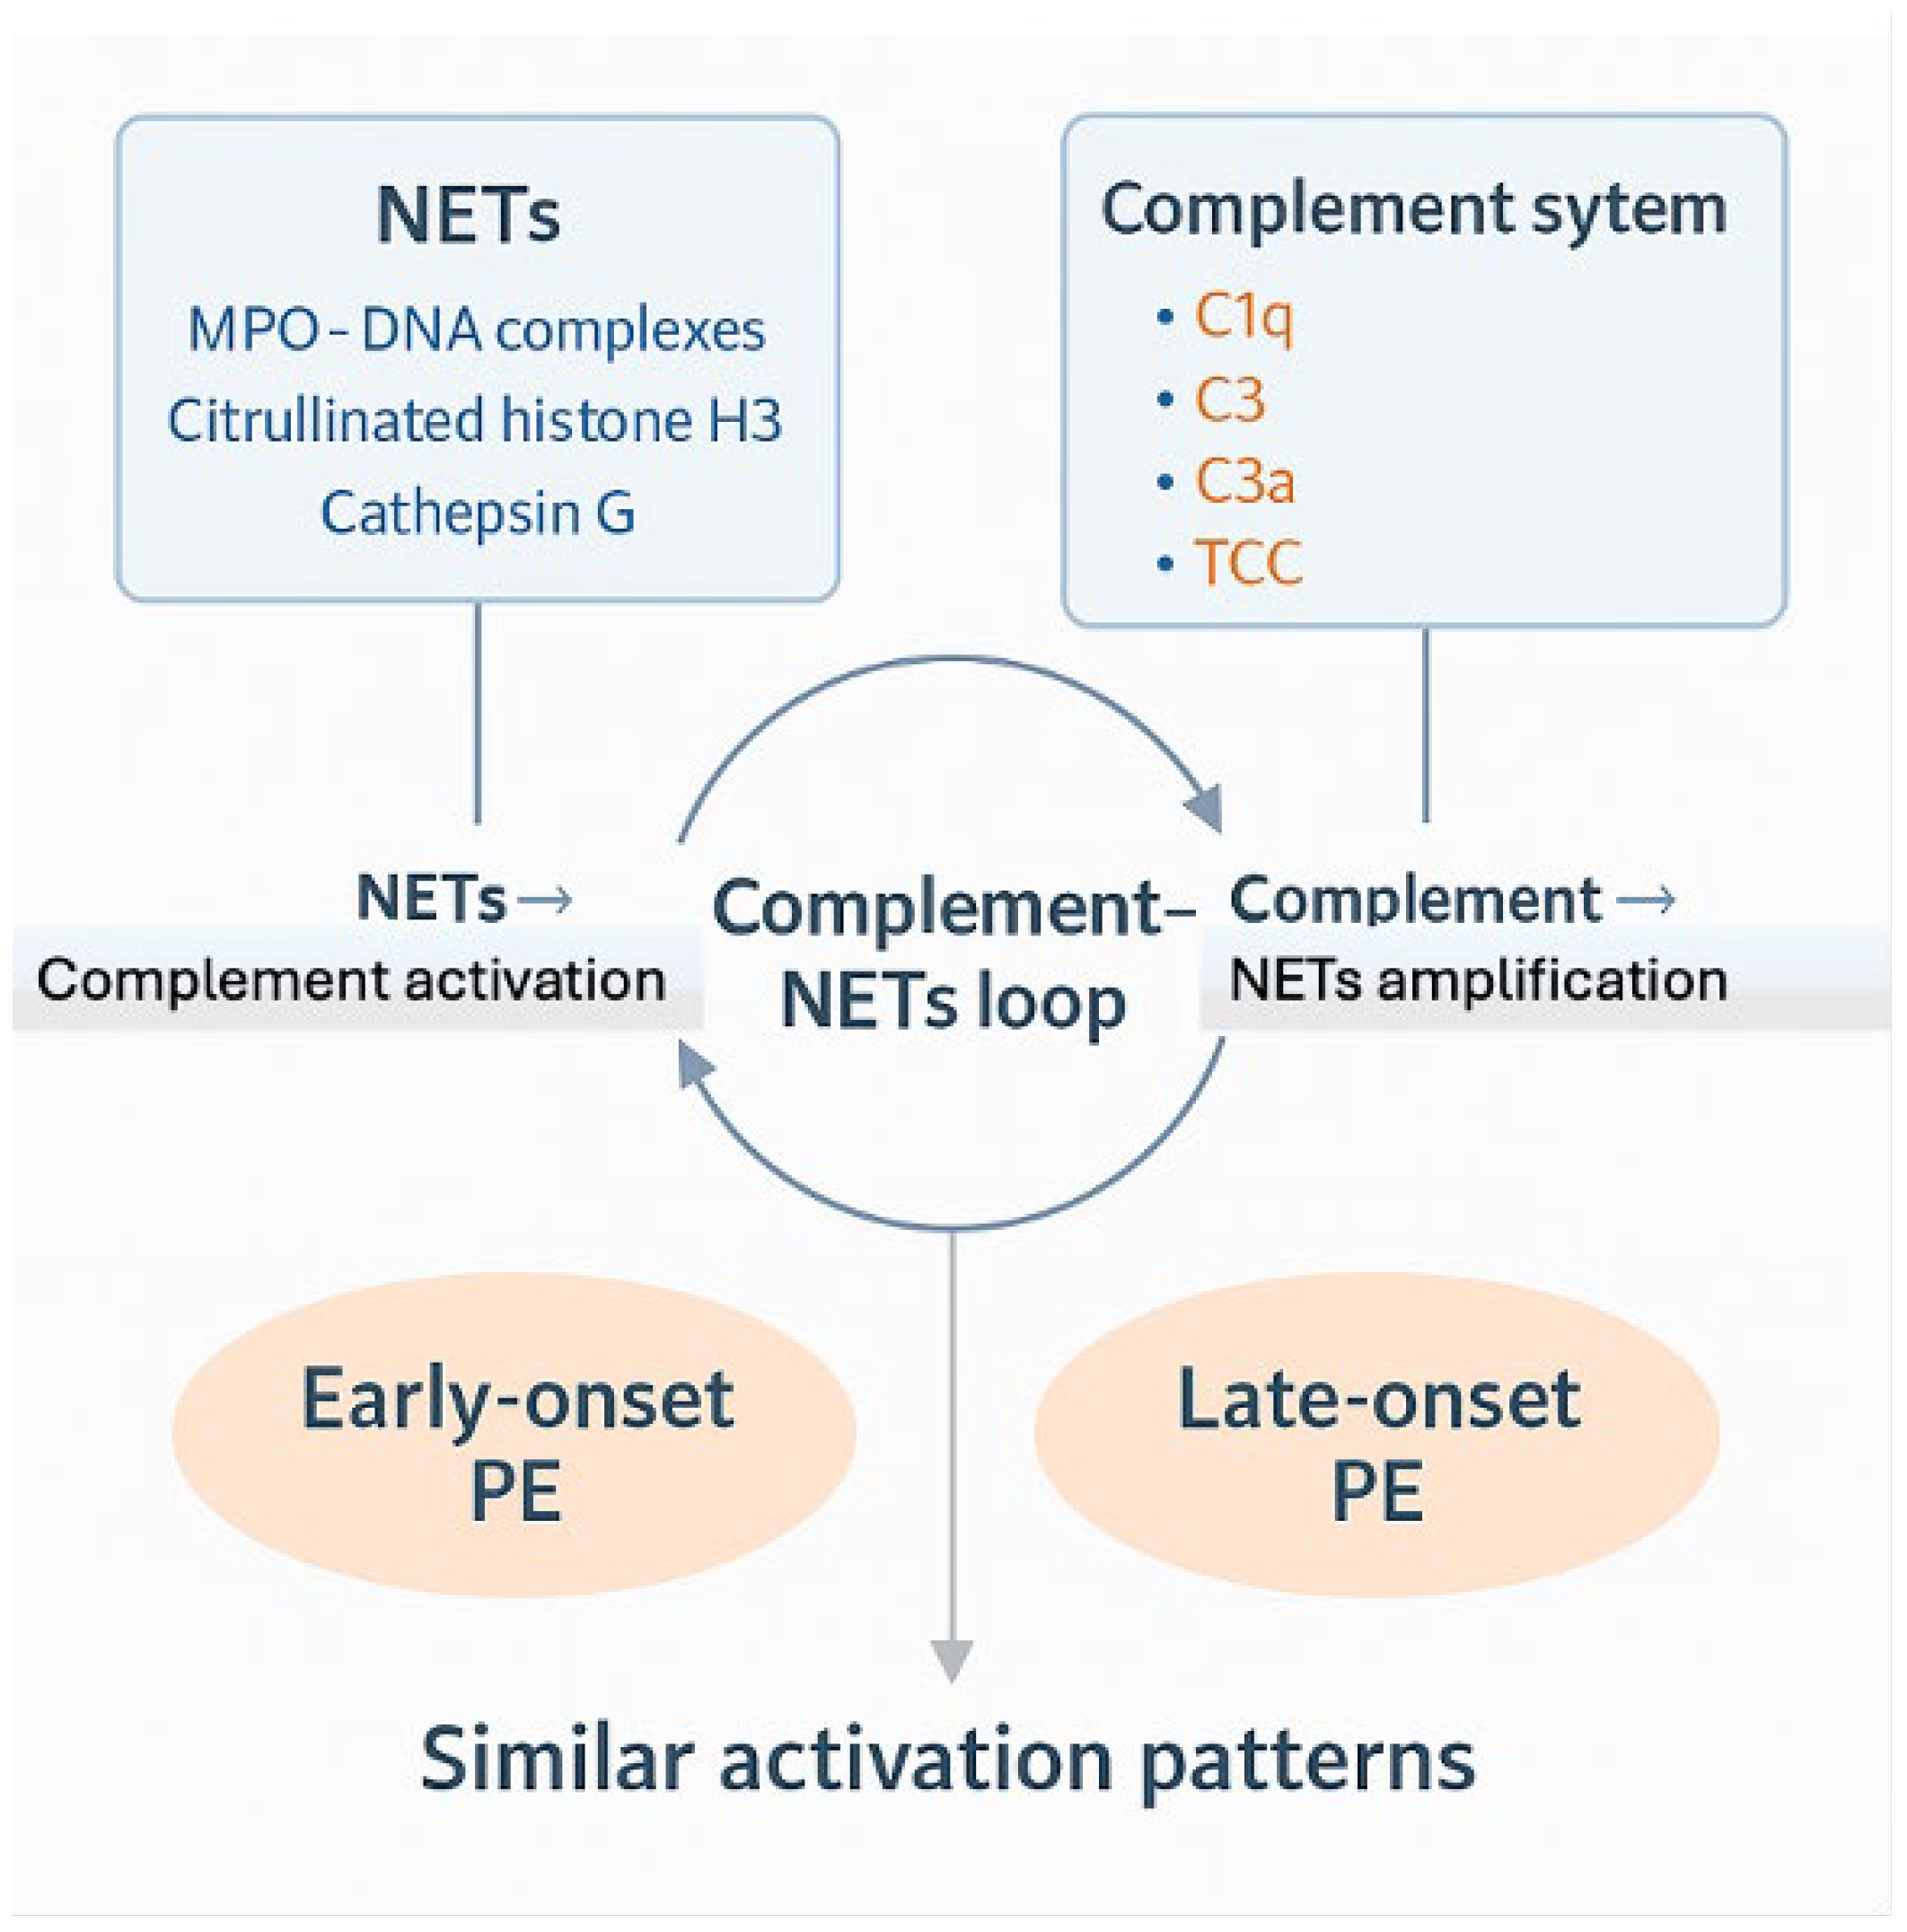

Table 1.
Complement System Activation in Study Groups. (Values are presented as median [IQR]. p-values refer to Kruskal–Wallis test).
Table 1.
Complement System Activation in Study Groups. (Values are presented as median [IQR]. p-values refer to Kruskal–Wallis test).
| Marker | Control <34 (n=17) | Control ≥34 (n=15) | EO-PE (n=56) | LO-PE (n=32) | p (KW) |
| C1q (ng/mL) | 110.10 [52.25–115.70] | 46.65 [44.78–48.52] | 272.80 [208.95–339.45] | 267.75 [254.75–283.98] | 1.4×10⁻⁸ |
| C3 (ng/mL) | 969.0 [884.25–1071.8] | 941.50 [902.8–974.3] | 1626.0 [1150.8–1953.3] | 1651.0 [1354.0–2095.0] | 6.0×10⁻⁶ |
| C3a (ng/mL) | 546.8 [535.6–569.2] | 529.0 [519.4–566.6] | 616.6 [596.8–627.0] | 624.4 [607.6–636.8] | 5.8×10⁻⁷ |
| C4 (ng/mL) | 532.0 [461.8–808.1] | 459.3 [390.1–484.2] | 645.6 [417.7–1069.5] | 418.4 [378.4–794.0] | 0.240 |
| TCC (mAU/mL) | 1742 [1447–2123] | 1382 [1151–1613] | 2473 [1915.5–2965.5] | 2982.5 [2261.5–3826.8] | 4.2×10⁻⁵ |
Table 2.
NETs Biomarkers in Study Groups. (Values are median [IQR]. p-values refer to Kruskal–Wallis test).
Table 2.
NETs Biomarkers in Study Groups. (Values are median [IQR]. p-values refer to Kruskal–Wallis test).
| Marker | Control <34 (n=17) | Control ≥34 (n=15) | EO-PE (n=56) | LO-PE (n=32) | p (KW) |
| MPO–DNA (ng/mL) | 7.62 [6.10–11.93] | 8.85 [1.73–15.97] | 13.25 [7.99–27.50] | 9.44 [6.88–25.11] | 0.051* |
| CitH3 (ng/mL) | 0.24 [0.19–0.27] | 0.31 [0.21–0.42 | 0.17 [0.14–0.27] | 0.24 [0.13–0.54] | 0.150 |
| Cathepsin G (ng/mL) | 11.80 [8.99–96.20] | 9.41 [9.06–11.80] | 22.54 [12.79–54.78] | 37.89 [11.20–60.89] | 0.060* |
*p<0.05 - statistically significant differences.
Table 3.
Spearman correlations between NETs biomarkers and complement components.
| Variable pair | Spearman ρ | p-value |
| MPO–DNA vs TCC | 0.30 | 0.013 |
| MPO–DNA vs C3a | 0.27 | 0.027 |
| Catepsin G vs C3a | 0.40 | 0.0007 |
| Catepsin G vs C1q | 0.31 | 0.011 |
| CitH3 vs Age | –0.24 | 0.048 |
| CitH3 vs C1q | –0.22 | 0.060 |
| CitH3 vs TCC | –0.21 | 0.064 |
Table 4.
Early- vs late-onset preeclampsia (EO-PE vs LO-PE). Values are median [IQR]; p-values are Mann–Whitney U-test.
Table 4.
Early- vs late-onset preeclampsia (EO-PE vs LO-PE). Values are median [IQR]; p-values are Mann–Whitney U-test.
| Marker | EO-PE (n=56) | LO-PE (n=32) | p-value |
| C1q (ng/mL) | 272.8 [208.95–339.45] | 267.75 [254.75–283.98] | 0.860 |
| C3 (ng/mL) | 1626.0 [1150.8–1953.3] | 1651.0 [1354.0–2095.0] | 0.480 |
| C3a (ng/mL) | 616.6 [596.8–627.0] | 624.4 [607.6–636.8] | 0.440 |
| C4 (ng/mL) | 645.6 [417.7–1069.5] | 418.4 [378.4–794.0] | 0.410 |
| TCC (mAU/mL) | 2473 [1915.5–2965.5] | 2982.5 [2261.5–3826.8] | 0.180 |
| MPO–DNA (ng/mL) | 13.25 [7.99–27.50] | 9.44 [6.88–25.11] | 0.330 |
| CitH3 (ng/mL) | 0.17 [0.14–0.27] | 0.24 [0.13–0.54] | 0.260 |
| Cathepsin G (ng/mL) | 22.54 [12.79–54.78] | 37.89 [11.20–60.89] | 0.520 |
Disclaimer/Publisher’s Note: The statements, opinions and data contained in all publications are solely those of the individual author(s) and contributor(s) and not of MDPI and/or the editor(s). MDPI and/or the editor(s) disclaim responsibility for any injury to people or property resulting from any ideas, methods, instructions or products referred to in the content. |
© 2025 by the authors. Licensee MDPI, Basel, Switzerland. This article is an open access article distributed under the terms and conditions of the Creative Commons Attribution (CC BY) license (http://creativecommons.org/licenses/by/4.0/).
Copyright: This open access article is published under a Creative Commons CC BY 4.0 license, which permit the free download, distribution, and reuse, provided that the author and preprint are cited in any reuse.


