
Submitted:
05 December 2025
Posted:
08 December 2025
You are already at the latest version
Abstract
Background/Objectives: Falls are a leading cause of morbidity and mortality in older adults, even among those who are physically active. This study examined the associations of skeletal muscle mass, muscle strength, and muscle power with fall risk in community-dwelling, physically active older adults. Methods: A cross-sectional analysis was conducted with 280 participants (71.9 ± 5.3 years; 75% women) enrolled in the Stay Up–Falls Prevention Project. Assessments included skeletal muscle mass (anthropometric prediction equation), handgrip strength, lower-limb strength and power (Five Times Sit-to-Stand test, 5xSTS), and fall history over the past 12 months. Muscle power was calculated from 5xSTS performance using the equation proposed by Alcazar and colleagues. Logistic regression models and receiver operating characteristic (ROC) curve analyses were performed. Results: Overall, 26.4% of participants reported at least one fall in the previous year, with a higher prevalence among women (28.9%) than men (18.8%). Fallers showed significantly lower handgrip strength (23.1 vs. 25.4 kg, p = 0.022) and poorer lower-limb strength (9.2 vs. 8.7 s, p = 0.007) compared with non-fallers. However, no significant differences were found for skeletal muscle mass or sit-to-stand–derived power. In multivariable models adjusted for age, sex, body mass index, comorbidities, and medications, lower-limb strength remained the only independent predictor of falls (OR = 1.78, 95% CI: 1.11–2.85, p = 0.016). ROC analysis confirmed fair discriminative capacity for 5xSTS performance (AUC = 0.616, p = 0.003), with an optimal cut-off of 8.62 s (sensitivity = 78.4%, specificity = 33.0%). Handgrip strength, muscle mass, and power did not show independent predictive value. Conclusions: These findings indicate that the 5xSTS test provides a simple, cost-effective, and clinically relevant measure for fall-risk screening in active older adults. Clinicians should consider the 5xSTS as a sensitive first-line screening tool, ideally combined with complementary assessments (e.g., balance, gait, cognition) to improve risk stratification and guide preventive interventions in ageing populations.
Keywords:
falls
; ageing
; muscle strength
; muscle power
; sit‐to‐stand test
1. Introduction
Aging is a complex biological process characterized by progressive and multidimensional changes in physiological systems, which contribute to increased vulnerability, functional decline, and a higher risk of disability and mortality among older adults [1]. Among the various biological systems affected by aging, the neuromuscular system undergoes some of the most critical and early changes, directly impacting mobility, autonomy, and quality of life [2]. Such neuromuscular impairments, particularly reductions in skeletal muscle mass (SMM), strength, and power, have been consistently associated with impaired balance and an increased risk of falls in older populations [3,4].
The prevalence of falls among older adults is estimated at 26.5% worldwide and 23.4% in Europe [5]. Between 2010 and 2018, in Portugal, 65.4% of hospital admissions were attributable to falls with the majority occurring among individuals aged 65 years and older [6]. Importantly, falls impose a substantial economic burden on healthcare systems, considering their strong association with morbidity, disability, hospitalization, institutionalization, and mortality [7]. Moreover, even among older adults with relatively high levels of functionality, falls can compromise autonomy, diminish confidence, and negatively impact quality of life [8].
Falls in older adults are influenced by multiple risk factors, commonly classified as intrinsic (biological) and extrinsic (environmental) [9]. Intrinsic factors include age, sex, and age-related physiological changes such as visual and auditory impairments, balance disorders, increased fat mass, decreased SMM, and other chronic conditions (e.g., cardiovascular diseases). Among these, neuromuscular impairments, particularly reductions in SMM, strength, and power are considered key determinants of mobility decline and fall risk [3,4]. Additionally, the presence of multiple comorbidities and polypharmacy further increases the likelihood of falls, both through direct physiological effects and interactions with declining neuromuscular function [10,11].
Historically, the loss of SMM in association with impaired functionality or muscle strength, classified as sarcopenia, has been considered the primary risk factor for age-related declines in physical and autonomy [12]. However, evidence suggests that reduced muscle strength (dynapenia) and potentially, muscle power, may contribute to more frequent and at faster rates to physical and autonomy decline than SMM, and strongly associated with the onset of functional limitations and adverse outcomes [13,14].
Muscle power, defined as the product of force and contraction velocity, has emerged as a stronger predictor of physical performance in older adults than maximal strength alone [15,16]. Overall, muscle power is especially relevant in daily tasks that require rapid force generation, such as rising from a chair, preventing a fall, or crossing a street, thus making its decline more functionally impactful than strength deficits itself [2,13], reductions in both muscle strength and power are not only markers of functional decline but also recognized as critical risk factors for falls, highlighting the importance of their assessment to study falls prevention [3,4]. Evidence shows that muscle power declines earlier and more steeply with age than strength or SMM and has stronger associations with mobility limitations and fall risk [13-15]. On the other hand, lower muscle strength associates moderately with increased risk of falls in community-dwelling older adults [17]. Moreover, older adults who had fallen in the previous year were shown to have significantly lower muscle mass [18,19].
However, emerging evidence suggests that muscle weakness in older individuals is primarily attributed to a decline in muscle quality rather than the loss of muscle mass itself. Muscle quality refers to the ability of muscle fibers to generate force efficiently and plays a pivotal role in the age-related decline in strength and power, independent of SMM [20]. Additionally, age-related changes in muscle fiber type and contractile properties undoubtedly contribute to neuromuscular deterioration [21].
SMM, strength, and particularly power is essential to maintaining function and therefore independence in older adults [22,23]. Regular physical activity is widely recognized as a protective factor against functional decline and falls [24,25]. Nevertheless, evidence shows that falls remain prevalent even among physically active and independent older adults [26]. This suggests that neuromuscular impairments may persist despite engagement in regular exercise, highlighting the need to investigate specific predictors of fall risk in this population. Understanding why active older adults still fall is essential to develop targeted interventions beyond general physical activity.
Therefore, this study aimed to examine the associations of SMM, strength, and muscle power with the risk of fall in physically active older adults. Specifically, we sought to: (a) compare neuromuscular characteristics between fallers and non-fallers, (b) identify independent predictors of falls through multivariate models, and (c) evaluate the discriminative ability of muscle-related variables using receiver operating characteristic (ROC) curve analysis. By addressing these objectives, the present study contributes to clarify the role of neuromuscular function in the risk of fall and provides evidence to fall preventive strategies for physically active community-dwelling older adults. From a clinical perspective, identifying objective predictors and cut-off points for neuromuscular measures (muscle strength and power), is crucial for screening and guideline fall-prevention in older adults [27,28].
2. Materials and Methods
This is a cross-sectional study integrated in the cohort Stay Up–Falls Prevention Project, an ongoing initiative launched in 2021 that investigates the determinants of fall risk among older adults. The project encompasses community-based assessments and interventions, developed in collaboration with local municipal health programs. Its overarching aim is to contribute to the development of public health strategies focused on fall prevention and the promotion of healthy ageing [29]. The study protocol received ethical clearance from the Ethics Committee of the Piaget Institute (reference: P02-S40-11/01/2023). Prior to participation, all individuals provided written informed consent in accordance with ethical guidelines. The research was conducted in strict compliance with internationally recognized ethical principles, including the Declaration of Helsinki, the Belmont Report, and the Ethical Standards for Research in Sport and Exercise Science. Data confidentiality and participant anonymity were rigorously maintained throughout the study.
2.1. Participants
All participants were recruited from a community exercise program, organized by a municipal council near the Lisboa region, Portugal, that included two sessions of multicomponent exercise per week. All individuals enrolled in the program were informed about the study one week prior to data collection and invited to voluntarily participate. No pre-calculated sample size was used; rather, all eligible individuals who agreed to participate were included. Participants were instructed to maintain their regular physical activity habits, diet, and hydration levels unchanged during the two days leading up to the visit. Data collection took place in the morning, where demographic, anthropometric and performance tests were carried out. Older adults were included in the study if they: (i) were aged 65 years or older; (ii) were not participating in any other physical exercise program; (iii) are able to move independently without assistance; (iv) had the ability to understand the study’s instructions and protocols; and (v) provided signed informed consent. Conversely, older adults were excluded if they: (i) had contraindications for physical exercise or (ii) are unable to perform the physical tests.
2.2. Instruments and Variables
Anthropometric and demographic data were collected, including sex, age, number of comorbidities and medications currently used and weight and height. Body weight was assessed with a mechanical anthropometric scale (SECA 761; Bacelar & Irmão Lda, Porto, Portugal) and height was measured using a stadiometer (Seca GmbH & Co. KG; dimensions: 337 × 2165 × 590 mm; Hamburg, Germany). Body mass index (BMI) was calculated as weight (kg)/height2 (m).
2.2.1. Assessment of Falls
Fall history was evaluated based on the recommendations of the American Geriatrics Society and the British Geriatrics Society [30], participants were asked: (1) ‘How many times have you fallen in the past 12 months?’ If the response was affirmative, follow-up questions included: (2) ‘Did you require medical attention as a result of the fall?’ and (3) ‘Did the fall cause any difficulties with walking or balance?’ Participants could report multiple events, and the total number of falls was documented accordingly.
2.2.2. Skeletal Muscle Mass
SMM was estimated using the anthropometric prediction equation proposed by Lee, et al. [31], which was developed and cross-validated against whole-body magnetic resonance imaging. The model incorporates body weight (kg), height (m), age (years), sex (male=1; female=0), and race (white/hispanic=0; african american=+1.9; Asian=−1.6). The equation is expressed as:
SMM(kg)=0.244×weight+7.8×height+6.6×sex−0.098×age+race−3.3
2.2.3. Handgrip Strength
Handgrip strength (HGS) was measured using a Saehan SH5001 mechanical hand dynamometer (Saehan Corporation, Changwon-si, Republic of Korea), a widely recognized spring-type device for assessing manual strength. Prior to testing, the device was inspected to ensure mechanical accuracy and uniform resistance. The assessment was performed on the dominant hand, with the dynamometer adjusted to fit the individual’s hand size. Participants were seated with their shoulder in a neutral position, the arm aligned with the torso, the forearm extended, and the wrist in a neutral position. Three trials were conducted, and the highest value was recorded. Participants were instructed to exert maximal force for approximately 3 seconds per attempt, with 60 seconds of rest provided between trials [32].
2.2.4. Lower Limb Strength and Power
The Five Times Sit-to-Stand Test (5xSTS), a component of the Short Physical Performance Battery (SPPB), as originally described by Guralnik, et al. [33], was utilized to assess lower limb strength (LLS) and power. Participants began the test seated on a standard-height chair, with arms crossed over the chest and lower limbs positioned approximately at a 90° angle at the hip, knee, and ankle joints. Feet were placed parallel and flat on the floor. The task consisted of standing up to full knee extension and returning to the seated position, repeating this cycle five times consecutively, as quickly as possible, without using the upper limbs. To evaluate LLS was used a stopwatch, and the total duration to complete the 5 repetitions was recorded. Power was based on 5xSTS and calculated based on the equation proposed by Alcazar et al. [16]:
where (5×STS) is the average power over 5 repetitions, m the body mass of the individual, g the gravitational acceleration, the height of the participant, the height of the chair (i.e. 43 cm), the one tenth of the time taken to complete the 5 repetitions.
2.3. Statistical Analysis
Descriptive statistics are presented as mean ± standard deviation (SD) for continuous variables and frequencies and percentages for categorical variables. Independent t-tests were used to compare differences between sexes and between fallers and non-fallers. Effect sizes were calculated by partial eta-squared to estimate the strength of relationships between variables and the results were considered as “small”, “medium” or “large” effect sizes if 0.01 ≤ η2 p < 0.06, 0.06 ≤ η2 p < 0.14 and η2 p ≥ 0.14, respectively [34]. Logistic regression models were applied to examine the explanatory effect of neuromuscular-related variables (SMM, HGS, lower limb strength, and power) and fall risk, first in crude models, followed by models adjusted for age and sex, and finally in multivariate models adjusted for all covariates. The predictive ability of significant variables was further evaluated using ROC curve analysis, with the area under the curve (AUC) and 95% confidence intervals (CI). The optimal cutoff value for strength assessed with the five-repetition sit-to-stand test was determined using the Youden Index, which maximizes the sum of sensitivity and specificity of the ROC curve [35]. This approach identifies the threshold that provides the best balance between correctly identifying true positives and minimizing false positives. Sensitivity and specificity values corresponding to this cutoff were reported. Statistical significance was set at p < 0.05.
3. Results
A total of 280 participants were included in the analysis (n = 211 female and n = 69 male; mean age = 71.88 ± 5.35 years). Men showed significantly higher values for body weight, height, SMM, HGS and power compared to women (p < 0.001). No statistically significant differences were observed between sexes for age, BMI, number of medications, number of comorbidities, and lower limb strength (Table 1).
Table 2 presents the characteristics related to fall risk. Among the 280 participants, 26.4% (n = 74) reported at least one fall in the past 12 months, with a higher proportion observed among females (28.9%) compared to males (18.8%).
Table 3 shows the comparison between fallers and non-fallers in physical variables. Fallers demonstrated significantly lower HGS compared with non-fallers (23.15 ± 6.49 vs. 25.39 ± 7.34 kgf, p = 0.022, d = 0.313), representing a small-to-moderate effect size. In addition, fallers performed significantly worse in the LLS test, with higher time to complete the test than non-fallers (9.24 ± 1.72 vs. 8.65 ± 1.53 s, p = 0.007, d = –0.371, moderate effect size). No significant differences were observed between groups for SMM (20.53 ± 5.05 vs. 19.89 ± 4.98 kg, p = 0.353, d = 0.126) or power (261.98 ± 71.89 vs. 248.88 ± 87.42, p = 0.206, d = 0.172).
Table 4 presents the results of logistic regression models predicting the risk of falls. In crude analyses, lower HGS and longer time in 5xSTS were associated with higher odds of falling. After adjustment for age and sex, only LLS remained significant (OR = 1.21; 95% CI: 1.03–1.43, p = 0.019). In the final multivariate model, LLS remained as an independent predictor of falls (OR = 1.78; 95% CI: 1.11–2.85, p = 0.016), whereas SMM, HGS, and power were not significant.
The ROC curve analysis showed that only LLS and HGS presented significant discriminative ability for predicting falls. LLS demonstrated a fair accuracy, with an AUC of 0.616 (95% CI: 0.539–0.693, p = 0.003), while HGS presented a lower discriminative capacity (AUC = 0.397, 95% CI: 0.320–0.474, p = 0.009). SMM (AUC = 0.470, 95% CI: 0.393–0.547, p = 0.393) and power (AUC = 0.424, 95% CI: 0.346–0.503, p = 0.054) did not show significant ability to differentiate fallers from non-fallers (Table 5).
Figure 1 represents the ROC curve analysis, which revealed that LLS significantly predicted falls in older adults. The (AUC) was 0.616 (95% CI: 0.539–0.693, p = 0.003), indicating a modest but significant discriminatory ability to differentiate fallers from non-fallers. The AUC value above 0.60 suggests that LLS has a fair predictive capacity, although it does not reach the threshold generally considered strong (AUC ≥ 0.70). The optimal cutoff point for the 5xSTS was 8.62 seconds, with 78.4% sensitivity and 33.0% specificity, indicating that longer completion times are associated with increased risk of falls.
4. Discussion
In a community-dwelling cohort of physically active older adults (n = 280), 26.4% reported a fall over 12 months. LLS, measured by the 5xSTS test, was the only independent neuromuscular predictor of falls, whereas SMM, HGS, and muscle power were not significant after multivariable adjustment. HGS was lower in fallers, but its association attenuated after accounting for age, sex, BMI, comorbidities, medications, and other muscle-related variables. ROC curve analysis for 5xSTS indicated fair discrimination (AUC = 0.616) with an optimal cut-off of 8.62 seconds, showing high sensitivity but low specificity.
This study holds relevance as it examined a cohort of physically active older adults, a group often assumed to be at reduced risk, but who nonetheless remain susceptible to falls. While regular physical activity is consistently recognized as a protective factor against functional decline and falls, it does not fully mitigate the intrinsic vulnerabilities associated with ageing, such as neuromuscular impairments, multimorbidity, and polypharmacy [9,25]. In our sample, the prevalence of falls over the past 12 months was 26.4%, closely aligning with the global prevalence of 26.5% and slightly exceeding the European average of 23.4% [5]. As well as prior Portuguese data reporting of 20–23% annual fall incidence, however, only 7% of fallers required medical intervention, while the majority of events were managed without healthcare assistance [6]. This finding indicates that although falls are relatively common in physically active older adults, their severity may be attenuated compared to more vulnerable populations, such as frail or institutionalized individuals, in whom falls frequently lead to hospitalization, loss of independence, and increased mortality [7,36].
Our findings highlight the growing consensus that measures of SMM quantity are insufficient to capture risk of fall, which may include other parameters such as muscle power, thereby providing a more comprehensive assessment of mobility relevant to real-life fall scenarios [16,37]. The predictive utility of the 5xSTS for LLS, in this study aligns with prior evidence demonstrating its sensitivity in identifying older adults at heightened risk of disability, institutionalization, and falls [1,33]. By contrast, HGS, although is lower in fallers, lost significance once covariates were considered in the prediction of fall models, suggesting it may be a less specific indicator of fall risk compared to LLS, particularly in physically active populations. Taken together, these results highlight that dynamic, task-specific functional assessments may outperform isolated muscle measures in discriminating fall risk among active community-dwelling older adults.
Although muscle power was not a significant predictor of falls in the present analyses, its assessment remains conceptually relevant. Muscle power declines earlier and more rapidly than muscle strength with aging and has been identified as a critical determinant of mobility and independence [15,16]. More recently, the concept of powerpenia has been proposed to denote the age-related loss of muscular power as a distinct biomarker of functional decline and fall risk [2]. In this context, the ability to estimate power from the 5xSTS, in parallel with LLS, offers a pragmatic approach to capturing two complementary aspects of neuromuscular performance within a single functional test. While no significant association was observed in our study, incorporating power estimates remains important for future longitudinal and interventional studies, as changes in muscle power may precede measurable declines in strength and provide earlier indications of vulnerability to functional limitations and falls.
In our study, the cut-off value of 8.62 seconds on the 5xSTS was substantially lower than those reported in broader or more heterogeneous cohorts, highlighting both the superior baseline capacity of physically active older adults and the need for tailored thresholds to improve the accuracy of fall-risk screening in this group. For example, Buatois, et al. [38] identified a threshold of 15 seconds as predictive of recurrent falls in community-dwelling older people, while Albalwi and Alharbi [39] reported cut-offs of > 11.5 seconds for individuals aged 65–74 years and > 12.10 seconds for those aged 75 and above. Similarly, Ramírez-Vélez, et al. [40] provided reference values for 5xSTS stratified by age and sex, further highlighting that time-based thresholds tend to be higher in less active or older populations. Taken together, these comparisons suggest that the markedly lower cut-off observed in our cohort reflects superior baseline functional capacity, emphasizing the importance of tailoring performance thresholds to the characteristics of specific populations to optimize sensitivity and specificity in fall-risk screening. However, it is important to recognize that the discriminative accuracy of the 5xSTS in our analyses was modest (AUC=0.616), which, while statistically significant, indicates limited clinical utility if used in isolation for screening and classification of functionality and risk of falling. This reinforces the notion that the 5xSTS should be regarded as a sensitive but non-specific first-line screening tool, best applied alongside with complementary assessments (e.g. SMM quantity, balance, gait, or cognitive testing) to improve risk stratification and clinical decision-making.
Sex and age-related considerations merit explicit discussion. In our cohort, men exhibited higher upper-body strength and muscle power compared with women, yet 5xSTS did not significantly differ between sex, suggesting that LLS may converge among physically active older adults. However, empirical data indicate that fall risk is differentially patterned by sex and age. For instance, Soh and Won [41] found that fall and fracture incidence were higher among older women than men, with sex-specific associations between sarcopenia components and fall outcomes. Similarly, Suh, et al. [42] reported divergent fall-risk factors based on gender, nutritional status and instrumental activity daily basis living dependence in women versus medication use and stair-climbing ability in men. These findings underscore the limitation of applying uniform cut-offs across demographic groups. Tailoring 5xSTS thresholds by sex and age could refine screening accuracy, enhancing both sensitivity and specificity in fall-risk identification.
From a clinical perspective, the findings of this study highlight the 5xSTS as a practical and cost-effective tool for screening fall risk in older adults, including those who are physically active. Instead of isolated measures of muscle mass or HGS, the 5xSTS integrates LLS, balance, coordination, and transitional mobility, all of which are directly relevant to fall scenarios. The identified cut-off value of 8.62 seconds provides a population-specific benchmark that can assist clinicians in stratifying risk with high sensitivity among physical active older adults. This is particularly valuable in primary care and community settings once is easy to administer, inexpensive, and scalable assessments are needed. Moreover, these results support the design of tailored exercise interventions emphasizing not only LLS but also movement velocity and task-specific functional training, which have been shown to reduce fall incidence and improve physical function [2,25]. Implementing these approaches may enhance preventive strategies, ultimately helping to preserve independence and quality of life in ageing populations.
Several limitations of the present study should be acknowledged. First, SMM was not directly measured using gold-standard methods such as dual-energy X-ray absorptiometry or magnetic resonance imaging. Instead, it was estimated through predictive equations based on anthropometric variables (weight, height, sex, and race), which may introduce measurement error and limit the precision of associations with fall risk. Similarly, muscle power was not assessed through direct biomechanical measurements but rather estimated using a predictive equation, which, although validated, may not fully capture the complexity of neuromuscular performance. Furthermore, the cross-sectional design and the sampling type and dimension excludes any inference of causality, restricting interpretation to associations. The sample was recruited through convenience procedures and consisted exclusively of active community-dwelling older adults, which may limit the generalizability of the findings to more sedentary, frail, or institutionalized populations. In addition, fall events were assessed retrospectively through self-report over a 12-month period, which is subject to recall bias and may underestimate minor or forgotten incidents. Finally, the study did not account for other relevant fall-related risk factors such as cognitive status, sensory impairments, environmental hazards, or fear of falling, which may act as important confounders. Taken together, these methodological and sampling considerations should be considered when interpreting the present results.
5. Conclusions
This study shows that in active community-dwelling older adults, LLS derived from the 5xSTS test was the only independent neuromuscular predictor of falls. In contrast, SMM, HGS, and muscle power that was not significant after adjustment for covariates. The derived cut-off of 8.62 seconds reflects better functional capacity compared with less active cohorts. However, its modest discriminative accuracy (AUC = 0.616) indicates that the test should not be used alone when predicting the risk of fall. Instead, the 5xSTS can be used as a sensitive first-line screening tool, to be complemented by other assessments targeting balance, cognition, and comorbidity. Future studies should validate sex- and age-specific thresholds in the assessment of risk fall and further investigate the role of muscular power decline in the fall trajectories. Our findings support the use of the 5xSTS as a quick screening tool in primary care and community settings, though it should be complemented by other assessments to ensure accurate fall-risk stratification in active older adults.
Author Contributions
Conceptualization, P.M., V.S. and V.L.; methodology, P.M., J.S. and E.M.; formal analysis, P.M., J.M., P.H. and A.L..; writing—original draft preparation, P.M., A.L., P.H. and N.C.; R.M.; writing—review and editing, P.M., J.M., V.L. and M.G.; supervision, P.M. All authors have read and agreed to the published version of the manuscript.
Funding
This research received no external funding.
Institutional Review Board Statement
The study was conducted in accordance with the Declaration of Helsinki and approved by the Piaget Institute of Portugal (P02-S40) on 11st January 2023.
Informed Consent Statement
Informed consent was obtained from all subjects involved in the study.
Data Availability Statement
Data are contained within the article.
Conflicts of Interest
The authors declare no conflicts of interest.
Abbreviations
The following abbreviations are used in this manuscript:
| AUC | Area under the curve |
| BMI | Body mass index |
| CI | Confidence intervals |
| 5xSTS | Five Times Sit-to-Stand Test |
| HGS | Handgrip strength |
| ROC | Receiver operating characteristic |
| SPPB | Short Physical Performance Battery |
| SD | Standard deviation |
| SMM | Skeletal muscle mass |
| W | Sit-to-stand Power |
References
- Reider, N.; Gaul, C. Fall risk screening in the elderly: A comparison of the minimal chair height standing ability test and 5-repetition sit-to-stand test. Archives of Gerontology and Geriatrics 2016, 65, 133–139. [Google Scholar] [CrossRef]
- Freitas, S.R.; Cruz-Montecinos, C.; Ratel, S.; Pinto, R.S. Powerpenia Should be Considered a Biomarker of Healthy Aging. Sports Med Open 2024, 10, 27. [Google Scholar] [CrossRef]
- Landi, F.; Liperoti, R.; Russo, A.; Giovannini, S.; Tosato, M.; Capoluongo, E.; Bernabei, R.; Onder, G. Sarcopenia as a risk factor for falls in elderly individuals: Results from the ilSIRENTE study. Clinical Nutrition 2012, 31, 652–658. [Google Scholar] [CrossRef] [PubMed]
- Moreland, J.D.; Richardson, J.A.; Goldsmith, C.H.; Clase, C.M. Muscle Weakness and Falls in Older Adults: A Systematic Review and Meta-Analysis. Journal of the American Geriatrics Society 2004, 52, 1121–1129. [Google Scholar] [CrossRef]
- Salari, N.; Darvishi, N.; Ahmadipanah, M.; Shohaimi, S.; Mohammadi, M. Global prevalence of falls in the older adults: a comprehensive systematic review and meta-analysis. J Orthop Surg Res 2022, 17, 334. [Google Scholar] [CrossRef] [PubMed]
- Sampaio, F.; Nogueira, P.; Ascenção, R.; Henriques, A.; Costa, A. The epidemiology of falls in Portugal: An analysis of hospital admission data. PLoS One 2021, 16, e0261456. [Google Scholar] [CrossRef]
- James, S.L.; Lucchesi, L.R.; Bisignano, C.; Castle, C.D.; Dingels, Z.V.; Fox, J.T.; Hamilton, E.B.; Henry, N.J.; Krohn, K.J.; Liu, Z.; et al. The global burden of falls: global, regional and national estimates of morbidity and mortality from the Global Burden of Disease Study 2017. Injury Prevention 2020, 26, i3. [Google Scholar] [CrossRef] [PubMed]
- Lin, C.-H.; Liu, C.-Y.; Huang, C.-C.; Rong, J.-R. Frailty and Quality of Life among Older Adults in Communities: The Mediation Effects of Daily Physical Activity and Healthy Life Self-Efficacy. Geriatrics 2022, 7, 125. [Google Scholar] [CrossRef]
- Montero-Odasso, M.; van der Velde, N.; Martin, F.C.; Petrovic, M.; Tan, M.P.; Ryg, J.; Aguilar-Navarro, S.; Alexander, N.B.; Becker, C.; Blain, H.; et al. World guidelines for falls prevention and management for older adults: a global initiative. Age and Ageing 2022, 51 . [Google Scholar] [CrossRef]
- Zia, A.; Kamaruzzaman, S.B.; Tan, M.P. Polypharmacy and falls in older people: Balancing evidence-based medicine against falls risk. Postgrad Med 2015, 127, 330–337. [Google Scholar] [CrossRef]
- Kojima, T.; Akishita, M.; Nakamura, T.; Nomura, K.; Ogawa, S.; Iijima, K.; Eto, M.; Ouchi, Y. Polypharmacy as a risk for fall occurrence in geriatric outpatients. Geriatrics & Gerontology International 2012, 12, 425–430. [Google Scholar] [CrossRef]
- Rosenberg, I.H. Summary comments: Epidemiological and methodological problems in determining nutritional status of older persons. The American Journal of Clinical Nutrition 1989, 50, 1231–1233. [Google Scholar] [CrossRef]
- Reid, K.F.; Fielding, R.A. Skeletal Muscle Power: A Critical Determinant of Physical Functioning in Older Adults. Exercise and Sport Sciences Reviews 2012, 40. [Google Scholar] [CrossRef]
- Koivunen, K.; Sillanpää, E.; von Bonsdorff, M.; Sakari, R.; Törmäkangas, T.; Rantanen, T. Mortality Risk Among Older People Who Did Versus Did Not Sustain a Fracture: Baseline Prefracture Strength and Gait Speed as Predictors in a 15-Year Follow-Up. The Journals of Gerontology: Series A 2019, 75, 1996–2002. [Google Scholar] [CrossRef]
- Bean, J.F.; Leveille, S.G.; Kiely, D.K.; Bandinelli, S.; Guralnik, J.M.; Ferrucci, L. A Comparison of Leg Power and Leg Strength Within the InCHIANTI Study: Which Influences Mobility More? The Journals of Gerontology: Series A 2003, 58, M728–M733. [Google Scholar] [CrossRef]
- Alcazar, J.; Rodriguez-Lopez, C.; Ara, I.; Alfaro-Acha, A.; Rodríguez-Gómez, I.; Navarro-Cruz, R.; Losa-Reyna, J.; García-García, F.J.; Alegre, L.M. Force-velocity profiling in older adults: An adequate tool for the management of functional trajectories with aging. Exp Gerontol 2018, 108, 1–6. [Google Scholar] [CrossRef]
- Yeung, S.S.Y.; Reijnierse, E.M.; Pham, V.K.; Trappenburg, M.C.; Lim, W.K.; Meskers, C.G.M.; Maier, A.B. Sarcopenia and its association with falls and fractures in older adults: A systematic review and meta-analysis. J Cachexia Sarcopenia Muscle 2019, 10, 485–500. [Google Scholar] [CrossRef] [PubMed]
- de Rekeneire, N.; Visser, M.; Peila, R.; Nevitt, M.C.; Cauley, J.A.; Tylavsky, F.A.; Simonsick, E.M.; Harris, T.B. Is a fall just a fall: correlates of falling in healthy older persons. The Health, Aging and Body Composition Study. J Am Geriatr Soc 2003, 51, 841–846. [Google Scholar] [CrossRef] [PubMed]
- Srikanthan, P.; Karlamangla, A.S. Muscle Mass Index As a Predictor of Longevity in Older Adults. The American Journal of Medicine 2014, 127, 547–553. [Google Scholar] [CrossRef]
- Ferraro, E.; Pin, F.; Gorini, S.; Pontecorvo, L.; Ferri, A.; Mollace, V.; Costelli, P.; Rosano, G. Improvement of skeletal muscle performance in ageing by the metabolic modulator Trimetazidine. J Cachexia Sarcopenia Muscle 2016, 7, 449–457. [Google Scholar] [CrossRef]
- Verdijk, L.B.; Koopman, R.; Schaart, G.; Meijer, K.; Savelberg, H.H.C.M.; van Loon, L.J.C. Satellite cell content is specifically reduced in type II skeletal muscle fibers in the elderly. American Journal of Physiology-Endocrinology and Metabolism 2007, 292, E151–E157. [Google Scholar] [CrossRef] [PubMed]
- Hayashida, I.; Tanimoto, Y.; Takahashi, Y.; Kusabiraki, T.; Tamaki, J. Correlation between Muscle Strength and Muscle Mass, and Their Association with Walking Speed, in Community-Dwelling Elderly Japanese Individuals. PLOS ONE 2014, 9, e111810. [Google Scholar] [CrossRef] [PubMed]
- Rodrigues, F.; Domingos, C.; Monteiro, D.; Morouço, P. A Review on Aging, Sarcopenia, Falls, and Resistance Training in Community-Dwelling Older Adults. International journal of environmental research and public health 2022, 19, 874. [Google Scholar] [CrossRef]
- Hayashi, C.; Ogata, S.; Okano, T.; Toyoda, H.; Mashino, S. Long-term participation in community group exercise improves lower extremity muscle strength and delays age-related declines in walking speed and physical function in older adults. Eur Rev Aging Phys Act 2021, 18, 6. [Google Scholar] [CrossRef]
- Sherrington, C.; Fairhall, N.J.; Wallbank, G.K.; Tiedemann, A.; Michaleff, Z.A.; Howard, K.; Clemson, L.; Hopewell, S.; Lamb, S.E. Exercise for preventing falls in older people living in the community. In Cochrane Database of Systematic Reviews; 2019. [Google Scholar] [CrossRef]
- Soares, W.J.S.; Lopes, A.D.; Nogueira, E.; Candido, V.; de Moraes, S.A.; Perracini, M.R. Physical Activity Level and Risk of Falling in Community-Dwelling Older Adults: Systematic Review and Meta-Analysis. J Aging Phys Act 2018, 1–10. [Google Scholar] [CrossRef]
- Giovannini, S.; Brau, F.; Galluzzo, V.; Santagada, D.A.; Loreti, C.; Biscotti, L.; Laudisio, A.; Zuccalà, G.; Bernabei, R. Falls among Older Adults: Screening, Identification, Rehabilitation, and Management. Applied Sciences 2022, 12, 7934. [Google Scholar] [CrossRef]
- Skelton, D.A.; Becker, C.; Lamb, S.E.; Close, J.C.T.; Zijlstra, W.; Yardley, L.; Todd, C.J. Prevention of Falls Network Europe: a thematic network aimed at introducing good practice in effective falls prevention across Europe. Eur J Ageing 2004, 1, 89–94. [Google Scholar] [CrossRef]
- Marconcin, P.; São Martinho, E.; Serpa, J.; Honório, S.; Loureiro, V.; Nascimento, M.d.M.; Flôres, F.; Santos, V. Grip Strength, Fall Efficacy, and Balance Confidence as Associated Factors with Fall Risk in Middle-Aged and Older Adults Living in the Community. Applied Sciences 2025, 15, 7617. [Google Scholar] [CrossRef]
- Society, A.G.; Society, G.; Of, A.A. On Falls Prevention, O.S.P. Guideline for the Prevention of Falls in Older Persons. Journal of the American Geriatrics Society 2001, 49, 664–672. [Google Scholar] [CrossRef]
- Lee, R.C.; Wang, Z.; Heo, M.; Ross, R.; Janssen, I.; Heymsfield, S.B. Total-body skeletal muscle mass: development and cross-validation of anthropometric prediction models123. The American Journal of Clinical Nutrition 2000, 72, 796–803. [Google Scholar] [CrossRef]
- Schlüssel, M.M.; dos Anjos, L.A.; de Vasconcellos, M.T.; Kac, G. Reference values of handgrip dynamometry of healthy adults: a population-based study. Clin Nutr 2008, 27, 601–607. [Google Scholar] [CrossRef] [PubMed]
- Guralnik, J.M.; Simonsick, E.M.; Ferrucci, L.; Glynn, R.J.; Berkman, L.F.; Blazer, D.G.; Scherr, P.A.; Wallace, R.B. A short physical performance battery assessing lower extremity function: association with self-reported disability and prediction of mortality and nursing home admission. J Gerontol 1994, 49, M85–94. [Google Scholar] [CrossRef] [PubMed]
- Cohen, J. Statistical power analysis for the behavioral sciences; routledge, 2013. [Google Scholar]
- Youden, W.J. Index for rating diagnostic tests. Cancer 1950, 3, 32–35. [Google Scholar]
- Bartosch, P.S.; Kristensson, J.; McGuigan, F.E.; Akesson, K.E. Frailty and prediction of recurrent falls over 10 years in a community cohort of 75-year-old women. Aging Clinical and Experimental Research 2020, 32, 2241–2250. [Google Scholar] [CrossRef]
- Riviati, N.; Indra, B. Relationship between muscle mass and muscle strength with physical performance in older adults: A systematic review. SAGE Open Med 2023, 11, 20503121231214650. [Google Scholar] [CrossRef]
- Buatois, S.; Perret-Guillaume, C.; Gueguen, R.; Miget, P.; Vançon, G.; Perrin, P.; Benetos, A. A Simple Clinical Scale to Stratify Risk of Recurrent Falls in Community-Dwelling Adults Aged 65 Years and Older. Physical Therapy 2010, 90, 550–560. [Google Scholar] [CrossRef]
- Albalwi, A.A.; Alharbi, A.A. Optimal procedure and characteristics in using five times sit to stand test among older adults: A systematic review. Medicine 2023, 102, e34160. [Google Scholar] [CrossRef] [PubMed]
- Ramírez-Vélez, R.; Izquierdo, M.; García-Hermoso, A.; Ordoñez-Mora, L.T.; Cano-Gutierrez, C.; Campo-Lucumí, F.; Pérez-Sousa, M.Á. Sit to stand muscle power reference values and their association with adverse events in Colombian older adults. Scientific Reports 2022, 12, 11820. [Google Scholar] [CrossRef]
- Soh, Y.; Won, C.W. Sex differences in impact of sarcopenia on falls in community-dwelling Korean older adults. BMC Geriatrics 2021, 21, 716. [Google Scholar] [CrossRef]
- Suh, M.; Kim, D.H.; Cho, I.; Ham, O.K. Age and Gender Differences in Fall-Related Factors Affecting Community-Dwelling Older Adults. Journal of Nursing Research 2023, 31, e270. [Google Scholar] [CrossRef]
Figure 1.
ROC curve for sit-to -stand time predicting falls.
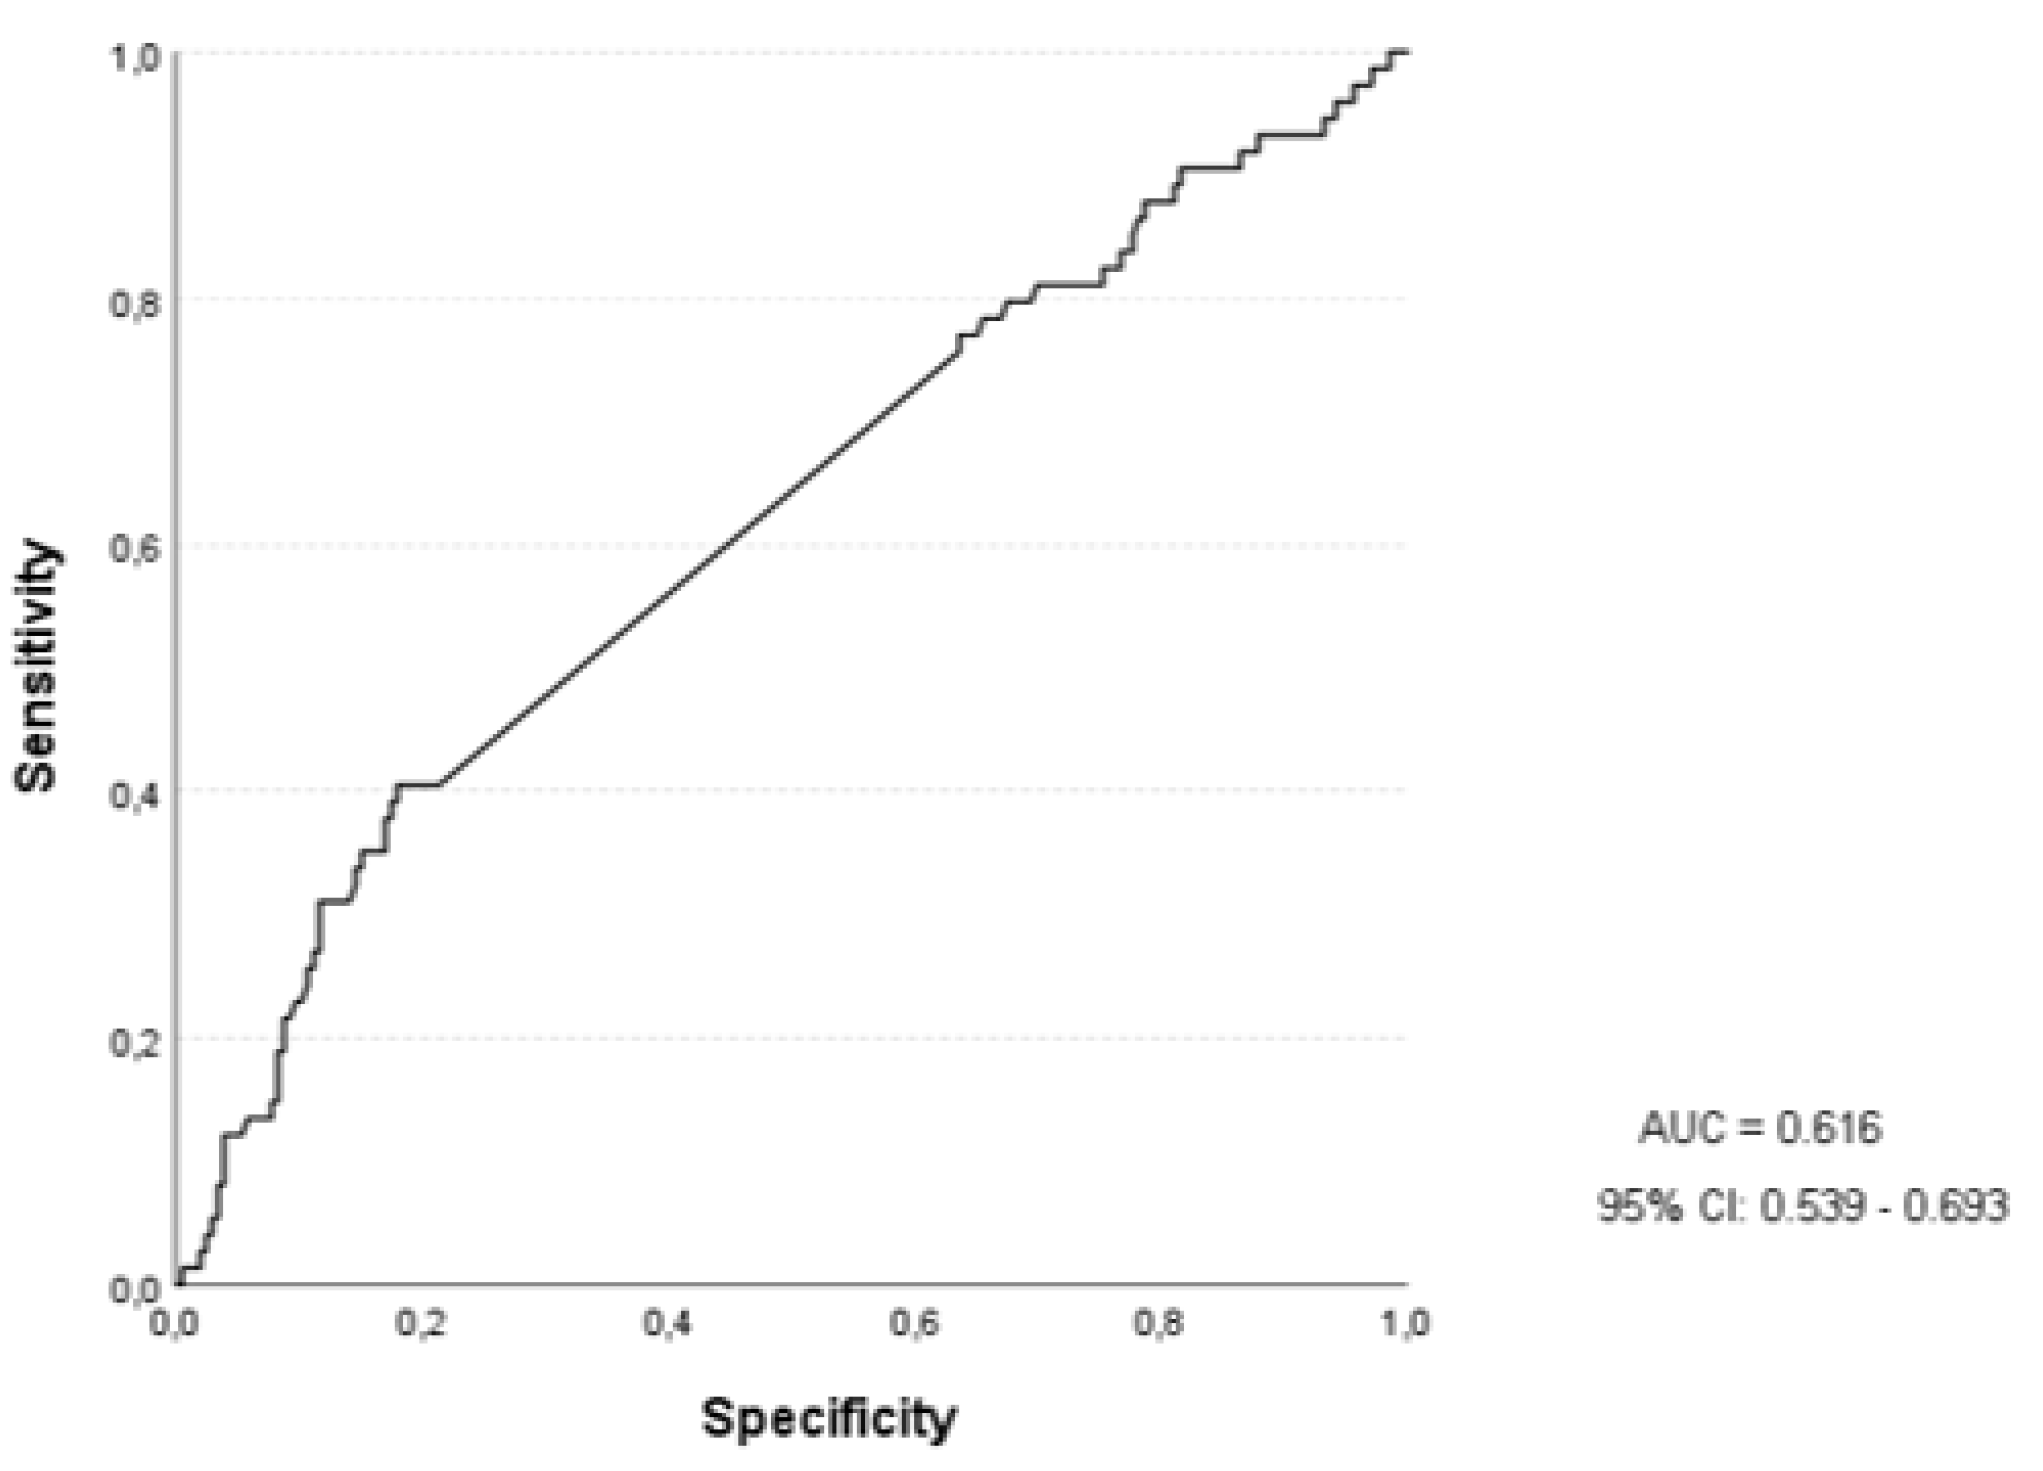

Table 1.
Sample characteristics, total and stratified by sex.
| Variables | Total (n = 280) | Male (n = 69) | Female (n = 211) | p-Value |
|---|---|---|---|---|
| Age (years) | 71.88 ± 5.35 | 73.07 ± 6.10 | 71.49 ± 5.04 | 0.055 |
| Body Weight (kg) | 68.56 ± 11.32 | 75.19 ± 10.84 | 66.40 ± 10.64 | < 0.001 |
| Height (m) | 1.58 ± 0.07 | 1.66 ± 0.06 | 1.55 ± 0.05 | < 0.001 |
| BMI (kg/m2) | 27.29 ± 4.02 | 27.21 ± 3.93 | 27.32 ± 4.06 | 0.840 |
| Nº Medications | 3.35 ± 2.55 | 3.79 ± 2.61 | 3.20 ± 2.53 | 0.105 |
| Nº Comorbidities | 2.45 ± 1.73 | 2.66 ± 2.03 | 2.33 ± 1.62 | 0.216 |
| SMM (kg) | 20.36 ± 5.03 | 27.47 ± 3.02 | 18.03 ± 2.96 | < 0.001 |
| HGS (kgf) | 24.80 ± 7.18 | 33.43 ± 7.38 | 21.97 ± 4.29 | < 0.001 |
| LLS (s) | 8.80 ± 1.60 | 8.54 ± 1.44 | 8.89 ± 1.65 | 0.087 |
| Power (W) | 258.51 ± 76.36 | 323.31 ± 83.34 | 237.33 ± 60.56 | < 0.001 |
Note: *Significant differences between sexes (p < 0.05). Data are expressed as mean ± standard deviation (SD). Abbreviations: BMI, Body Mass Index; HGS, Handgrip Strength; LLS, Lower limb strength; SMM, Skeletal Muscle Mass.
Table 2.
Fall risk characteristics, total and stratified by sex.
| Variables | Total (n=280) | Male (n=69) | Female (n=211) |
|---|---|---|---|
| Nº Falls in the last 12 months, M (±SD) | 0.52 ± 1.25 | 0.26 ± 0.61 | 0.61 ± 1.38 |
| Falls in the last 12 months, n (%) Yes No |
74 (26.4) 206 (73.6) |
13 (18.8) 56 (81.2) |
61 (28.9) 150 (71.1) |
| Require intervention, n (%) Yes No |
21 (7.5) 259 (92.5) |
6 (8.7) 63 (91.3) |
15 (7.1) 196 (92.9) |
| Have balance/gait problems, n (%) Yes No |
116 (41.4) 164 (58.6) |
21 (30.4) 48 (69.6%) |
95 (45.0) 116 (55.0) |
Abbreviations: M, mean; N.º, number; SD, standard deviation; %, percentage.
Table 3.
Comparison of skeletal muscle mass and neuromuscular variables between fallers and non-fallers.
Table 3.
Comparison of skeletal muscle mass and neuromuscular variables between fallers and non-fallers.
| Variables | Non-Fallers (n=206) | Fallers (n=74) | t | p-Value | Cohen´s d |
|---|---|---|---|---|---|
| SMM (kg) | 20.53 ± 5.05 | 19.89 ± 4.98 | 0.93 | 0.353 | 0.126 |
| HGS (kgf) | 25.39 ± 7.34 | 23.15 ± 6.49 | 2.31 | 0.022 | 0.313 |
| LLS (s) | 8.65 ± 1.53 | 9.24 ± 1.72 | -2.73 | 0.007 | -0.371 |
| Power (W) | 261.98 ± 71.89 | 248.88 ± 87.42 | 1.26 | 0.206 | 0.172 |
Data are expressed as the mean ± standard deviation or number (percentage). Abbreviations: n, number; HGS, Handgrip Strength; LLS, Lower limb strength; SMM, Skeletal Muscle Mass.
Table 4.
Association between SMM and neuromuscular variables between fallers and non-fallers.
| Variables | Crude OR (95% CI) | p-Value | Adjusted OR¹ (95% CI) | p-Value | Final Model² OR (95% CI) | p-Value |
|---|---|---|---|---|---|---|
| SMM (kg) | 0.97 (0.92 – 1.02) | 0.975 | 1.07 (0.97 – 1.18) | 0.168 | 0.77 (0.51 – 1.16) | 0.219 |
| HGS (kgf) | 0.95 (0.91- 0.99) | 0.023 | 0.96 (0.91 – 1.01) | 0.161 | 0.94 (0.88 – 1.01) | 0.119 |
| LLS (s) | 1.24 (1.05 – 1.47) | 0.008 | 1.21 (1.03 – 1.43) | 0.019 | 1.78 (1.11 – 2.85) | 0.016 |
| Power (W) | 0.99 (0.99 – 1.00) | 0.207 | 1.00 (0.99 – 1.00) | 0.882 | 1.01 (0.99 – 1.03) | 0.062 |
Odds ratios (OR); 95% confidence intervals (CI); *p < 0.05; ¹ Adjusted model controlled for age and sex. ² Final model included all muscle-related variables (SMM, HGS, LLS, Power) plus age, sex, BMI, number of comorbidities, and number of medications. Abbreviations: CI, confidence intervals; HGS, Handgrip Strength; LLS, Lower limb strength; OR, Odds ratios; SMM, Skeletal Muscle Mass.
Table 5.
ROC analysis for variables predicting risk of falls.
| Variables | AUC | 95% CI | p-Value |
|---|---|---|---|
| SMM (kg) | 0.470 | 0.393 – 0.547 | 0.393 |
| HGS (kgf) | 0.397 | 0.320 – 0.474 | 0.009 |
| LLS (s) | 0.616 | 0.539 – 0.693 | 0.003 |
| Power (W) | 0.424 | 0.346 – 0.503 | 0.054 |
Abbreviations: AUC, Area under the curve; CI, 95% confidence intervals; HGS, Handgrip Strength; LLS, Lower limb strength; OR, Odds ratios; SMM, Skeletal Muscle Mass.
Disclaimer/Publisher’s Note: The statements, opinions and data contained in all publications are solely those of the individual author(s) and contributor(s) and not of MDPI and/or the editor(s). MDPI and/or the editor(s) disclaim responsibility for any injury to people or property resulting from any ideas, methods, instructions or products referred to in the content. |
© 2025 by the authors. Licensee MDPI, Basel, Switzerland. This article is an open access article distributed under the terms and conditions of the Creative Commons Attribution (CC BY) license (http://creativecommons.org/licenses/by/4.0/).
Copyright: This open access article is published under a Creative Commons CC BY 4.0 license, which permit the free download, distribution, and reuse, provided that the author and preprint are cited in any reuse.


