
Submitted:
07 December 2025
Posted:
09 December 2025
You are already at the latest version
Abstract
There are indices for measuring the different aspects of how companies disseminate information, but none specifically assesses the level of blockchain technology adoption by financial institutions. Given the rapid development and applications of blockchain technology in finance, evaluating its adoption by financial institutions is crucial. In this context, this study develops and tests a formative blockchain technology adoption index to quantify the extent of blockchain adoption in the financial sector, based on data from the annual reports of leading banks in Africa. The research employs a triangulation methodology, which involves identifying indicators that can be combined to form a blockchain technology adoption index. These indicators were evaluated against the SMART criteria for selecting effective metrics. The index was then created based on these indicators and applied using data from 20 leading banks in Africa. These banks were chosen for their regional representation, size, and rankings derived from Africa Business data, a reputable source that uses Tier 1 capital as a key indicator of bank strength. Findings revealed that banks in West Africa lead with the highest adoption score of 72%, followed by South Africa at 66%. Furthermore, an ANOVA test at a 0.05 confidence level was used to examine whether bank size significantly influences blockchain adoption levels. The results showed no statistical difference in the average total assets between larger and smaller banks in the sample, thereby indicating the index’s broad applicability regardless of bank size. This study concludes that the developed blockchain technology adoption index in this study can be applied to banks and other financial sector companies of varying revenue sizes across different regions in Africa and beyond.
Keywords:
blockchain adoption
; indicators
; African banks
; annual reports
1. Introduction
For many years, banks have relied on Centralised Banking System (CBS) as the backbone of their operations to process transactions, keep records, and ensure regulatory compliance (Saker, 2019). While CBS has offered stability and dependability to banks, it is also plagued with inefficiencies, such as high operational costs, transaction delays, and susceptibility to fraud and cyber-attacks due to its centralised design (Saker, 2019; Bora, 2025).
However, the advent of blockchain technology introduces a transformative alternative to banking operations by leveraging a decentralised, immutable ledger that records transactions across multiple nodes, thereby eliminating a single point of failure (Rahman et al., 2024; Ogunrinde et al., 2025). This decentralised nature of blockchain technology offers several advantages compared to the CBS, as it enhances efficiency, transparency, and security of transactions. Core applications of blockchain technology in the financial sector include streamlining banking processes, which enables self-executing contracts, improves payment processing, prevents fraud, automates workflows, fosters trust, ensures regulatory compliance and auditing, facilitates asset tokenisation, reduces costs, supports decentralised exchanges, enhances data flow, transparency, and security (Weerawarna, 2023; Rahman et al., 2024).
Leading banks in Africa, such as ABSA, Standard Bank, Access Bank, Zenith Bank, among others, have experienced considerable growth in adopting blockchain technology (Jepkoech & Anyembe, 2019; Ademola, 2024). These banks are taking a multifaceted approach to blockchain adoption by focusing, not only on cryptocurrency but also on broader financial inclusion. For instance, ABSA became the first African bank to join the global R3 consortium in 2016, which has allowed it to offer cross-border trade payment solutions, hybrid financial products, institutional-grade crypto custody services, and more (International Capital Market Association, ICMA, 2024). Additionally, digital currency transactions are clearly increasing in financial institutions, which is a trend that is accompanied by a rising adoption of blockchain technology. This is because blockchain technology is the fundamental system that enables and secures digital currency transactions (Polcumpally et al., 2024).
However, the increase in digital transactions also leads to more cyberattacks and fraud. As a result, customers and investors are eager to understand the level of blockchain adoption by banks because it is a key tool for reducing risk and fraud. Blockchain is essential for mitigating fraud in banking operations as it provides trust without requiring participants to establish direct trust relationships. Instead, trust is placed in the blockchain protocol, which guarantees data integrity without intermediaries (Dong et al., 2023). The trust in blockchain protocols has made it a transformative technology that has become useful across different sectors (Dong et al., 2023; Tripathi et al, 2023). As blockchain rapidly gains momentum worldwide, Africa is no exception. This is because the continent is actively exploring the many benefits of this technology as a powerful tool to address its diverse challenges in various sectors, including financial services, telecommunications, insurance, energy management, and health, among others (Jepkoech & Anyembe, 2019).
Many studies have examined the benefits, challenges, and various factors influencing blockchain adoption across different sectors without sufficiently considering how extensively these sectors have adopted blockchain technology (Roopnarain & Mwapwele, 2025; Elkoraichi et al, 2025). Although recent annual reports of companies indicate that they are beginning to adopt blockchain to improve their operations and services, empirical evidence quantifying this adoption remains scarce, especially in Africa. This may be due to the absence of a comprehensive and standardised index for measuring the extent of blockchain adoption across sectors. To fill this gap, this study develops a robust blockchain index with 20 relevant indicators to evaluate the level of blockchain technology adoption in the financial sector. Since the financial sector leads other sectors in blockchain adoption (Javaid et al., 2022; Rahman et al., 2024), there is sufficient data to create an adaptable and testable index for this sector.
Today, more than ever, it is crucial to have clear, thoughtful, and comprehensive methods to measure how much financial institutions have adopted blockchain technology, as this would improve investors’ and depositors’ confidence in their operations and financial security. Thus, this study presents a robust blockchain adoption index that researchers and professionals can use to assess the extent of blockchain adoption in financial institutions. Therefore, this study aims to:
- Identify indicators that can be combined to create a blockchain technology adoption index and evaluate whether these indicators meet the SMART criteria for selecting metrics.
- Create a blockchain index using the evaluated indicators, and
- Test the developed blockchain index using data from leading banks in Africa.
2. Review of Related Literature
This section reviews conceptual, theoretical, and empirical literature related to blockchain adoption and index development.
2.1. Conceptual Review
2.1.1. Blockchain
Blockchain is a concept with various definitions in the literature. It is regarded as a decentralised ledger technology that records transactions across multiple computers simultaneously and ensures no single entity controls the data (Trivedi et al., 2021; Dong et al., 2023). It is characterised by trust, decentralisation, user anonymity, and consensus mechanisms that validate transactions without a central authority. According to AdelSalam (2023), it is described as an open, distributed network that quickly records transactions between parties in a verified and transparent way by enabling peer-to-peer interactions without intermediaries (AdelSalam, 2023). The ledger is immutable, meaning once data is recorded, it cannot be changed or deleted, which ensures security and transparency. Blockchain is also seen as a network of systems or platforms that support new types of digital trust and contractual practices, such as smart contracts, which automate and enforce agreements without intermediaries (Mattila, 2016). Different organisations adopt blockchain with various approaches depending on their needs and contexts. Basically, its core features, including decentralisation, security, transparency, and immutability, make it relevant in fields like finance, healthcare, supply chain, IoT, and more (Tripathi et al., 2023).
2.1.2. Indicators and Indices
Indicators and indices provide clear and thoughtful ways to measure products, individuals, and phenomena to understand our world. An indicator is a carefully designed item, a lens through which we interpret phenomena, and a tool for setting and tracking goals (Belcher et al, 2024). According to Bunge (1975), an indicator is described as an observable variable that is assumed to estimate another variable that is typically unobservable. On the other hand, an index provides a more comprehensive view as it combines multiple indicators into a composite score (Hassan, 2012; Papoutsi & Sodhi, 2020). For instance, Chainalysis used a combination of on-chain data and internet usage indicators to determine the extent of cryptocurrency adoption in different countries around the world (Colombo & Yarovaya, 2024; Chainalysis, 2025). In addition, García-Monleón et al (2023) utilised indicators such as on-chain value received, retail value transferred, and peer-to-peer exchange trade volume to assess cryptocurrency adoption.
Van Zyl and Puth (2019) provide a broad description of an index using three definitions. According to the study, first, an index is created by combining several individual items, effectively summarising them into a single measure or scale. Second, they noted that items that make up an index usually assess an underlying quantitative concept that exists along a measurement continuum. Lastly, they documented that the responses to these items are not judged as correct or incorrect. Thus, an index represents a scale that reflects an abstract concept, which generally cannot be captured by a single question or item alone. Hence, indicators are best for tracking specific aspects of adoption, while indices are useful for assessing the overall state or extent of adoption. Figure 1 is an example of indicators used by EFMA and Deloitte (as cited by Chirag, 2024) to determine top banks’ use cases for blockchain.
2.1.3. SMART Framework
The acronym SMART stands for Specific, Measurable, Achievable, Relevant, and Time-Bound (Ogbeiwi, 2021; Bahrami et al., 2021). Using these criteria when developing or creating an index ensures that the indicators are clear, realistic, and trackable within a set timeframe (Belcher et al., 2024). It also helps eliminate ambiguity and guesswork. The SMART framework guides indicator selection by making sure indicators clearly define what is measured (Specific), can be quantified (Measurable), are feasible (Achievable), align with project objectives (Relevant), and have a deadline (Time-Bound). To apply this framework, it is important to first define the goal, create precise indicators with targets and timelines, confirm their measurability and feasibility, ensure relevance, set deadlines, and establish consistent data collection and review processes (Belcher et al., 2024). This turns vague aims into concrete, actionable indicators for effective progress tracking and decision-making.
2.2. Theoretical Underpinning
Many theories have been used to explain the use and acceptance of technology. These theories include, but are not limited to, the Technology Acceptance Model (TAM), the Unified Theory of Acceptance and Use of Technology (UTAUT), Innovation Diffusion Theory (IDT), and Social Cognitive Theory (SCT). Davis (1989) used TAM to explain the determinants of technology adoption. He noted that the intention of an end user to accept and use technology is based on two theoretical constructs: perceived usefulness and perceived ease of use. Other empirical studies have shown that these theories explain technology adoption and its use (Venkatesh, 2000; Kim & Crowston, 2012). Although TAM is regarded as a valid framework for explaining technology adoption and use, some of its limitations have been identified (Kim & Crowston, 2012).
Theories such as IDT and SCT focus solely on individuals’ technology adoption behavior and have their limitations as well. However, UTAUT offers a more refined view of how the determinants of intention and behavior evolve (Kim & Crowston, 2012). It integrates elements from various models and provides a detailed framework by including factors like performance expectancy, effort expectancy, social influence, and facilitating conditions, making it broadly applicable across contexts (Salem & Ali, 2019). Among these theories, UTAUT is particularly popular in recent empirical research because it synthesises key constructs from prior models and offers a more comprehensive explanation of technology acceptance and use in different organisational and personal settings (Kim & Crowston, 2012). Studies have shown that trust and perceived risk are important additional factors influencing blockchain adoption, which are often incorporated into extended UTAUT models (Salem & Ali, 2019). Trust in blockchain technology mediates the relationship between UTUAT factors and users’ behavioural intention to adopt blockchain. Thus, UTAUT provides a robust theoretical foundation for understanding blockchain adoption, as it emphasises the roles of expectancy, trust, and facilitating conditions in shaping intentions and behaviours (Salem & Ali, 2019; Ennajeh & Najjar, 2024).
2.3. Empirical Review
Blockchain technology is transforming the way transactions and data exchanges are carried out across various sectors globally. At the core of this transformation lies the rise of digital currencies, whose underlying infrastructure is blockchain technology (Guo & Liang, 2025). Therefore, blockchain technology adoption has increased due to its ability to address several limitations inherent in the traditional banking system. For instance, Guo and Liang (2025) documented in a study carried out in China that blockchains can revolutionise payment clearing and credit information systems in banks.
Similarly, Rahman et al. (2024) observed that blockchain adoption has brought substantial transformation to the banking sector. Their comprehensive review provided historical, current, and future insights into the dynamics of blockchain in banking. They performed a bibliometric analysis of 133 blockchain-related articles published in Scopus-indexed journals from 2015 to May 2023. Their study highlights how the banking industry is evolving by integrating blockchain technology to enhance financial sector performance (Varma et al., 2022). Furthermore, Garg et al. (2021) explored blockchain’s potential in banking through a survey research design and found that participants had a positive outlook on its transformative capabilities. Other authors have also noted that blockchain technology reduces costs, improves security, and increases transparency and efficiency (Osmani, 2021; Rahman et al., 2024).
Aside from finance, blockchain technology applications extend to other critical areas such as healthcare, government, and commerce. In healthcare, blockchain is increasingly used to store and share patients’ information safely and efficiently (Ghosh et al., 2023; Bazel et al., 2025). Government agencies around the world have started leveraging blockchain-driven solutions to manage citizens’ or residents’ identity, track public funds allocation and utilisation, improve voting systems, and curb fraud and corruption (Clifton et al., 2023; Sibanda et al., 2024).
The growing interest in blockchain technology adoption has prompted numerous empirical studies globally to identify the key factors influencing its adoption. Studies have shown various interplays of technological readiness, organisational capabilities, regulatory environment, and socio-economic factors (Roopnarain & Mwapwele, 2025; Elkoraichi et al, 2025). In the African context, studies have explored the factors that determine blockchain adoption across finance, e-commerce, supply chain management, banking, and education (Alammary et al., 2019; Adams et al., 2023; Maagi, 2023; Thegeya, 2023). These studies have provided nuanced insights into the factors affecting blockchain technology adoption in Africa. However, empirical evidence regarding the extent of adoption by various sectors is still lacking. This is because extant studies have primarily focused on the factors and challenges influencing blockchain adoption without attention to the extent of adoption.
Moreover, the blockchain adoption index differs from factors that influence blockchain adoption because it is a composite measure that combines multiple factors rather than simply examining individual elements affecting adoption decisions (Van Zyl & Puth, 2019). Additionally, unlike factors that aim to understand the drivers or challenges of adoption, the blockchain index quantifies and compares levels of adoption. Also, empirical research on factors determining blockchain adoption is limited to strategy development and technological acceptance. In contrast, indices are useful for benchmarking, monitoring progress toward adoption, and making decisions (Van Zyl & Puth, 2019).
Therefore, factors are underlying components or variables, while adoption indices are composite measures or constructed metrics or indicators that combine these factors into an overall quantifiable score for ranking. Blockchain indices are also used to assess and compare the level of blockchain adoption across different entities such as countries, industries, or organisations. Despite these apparent differences, there is no known index for capturing the extent of blockchain technology adoption in the banking sector, even though indices for different areas of information disclosure by companies, such as sustainability disclosure, corporate governance disclosure, segment disclosure (Kamal, 2012; Papoutsi & Sodhi, 2020; Sule, 2025a; Sule, 2025b; Sule & Moloi, 2025), and voluntary disclosure exist (Botosan, 2000; Akinlo & Sule, 2019).
Some indices were developed to the extent of cryptocurrency adoption (Colombo & Yarovaya, 2024; Chainalysis, 2025). However, these cryptocurrency adoption indices mainly measure how much individuals and countries are using cryptocurrencies like Bitcoin and Ethereum by focusing on factors such as on-chain transaction volumes, peer-to-peer trading, retail activity, and so on (Nguyen & Nguyen, 2024; Colombo & Yarovaya, 2024; Chainalysis, 2025). Conversely, blockchain technology adoption indices evaluate the broader adoption and integration of blockchain technology beyond cryptocurrencies. It assesses countries and organisations based on multiple parameters, including public adoption such as awareness and engagement with cryptocurrency, infrastructure adoption revolving around crypto automated machines, bank integrations such as exchanges, merchant acceptance, innovation and technology development, regulatory environment, economic factors, and tax policies favorable to blockchain. For instance, the Henley Crypto Adoption Index was designed to measure the extent of blockchain technology adoption by countries, but not by organisations (Henley & Partners, 2025). To address this gap, this study develops a measurable blockchain adoption index for determining the extent of blockchain adoption in the banking sector by using data from top African banks for validation.
3. Methodology
Developing an index to measure the extent of blockchain technology adoption by banks requires a comprehensive methodology that covers different aspects, including strategic and organisational commitment, operational impact, regulatory compliance, performance, market dynamics, and customer dimensions. To develop a blockchain adoption index that accurately reflects the extent of adoption by banks, this study develops 20 indicators based on information from reviewed literature on blockchain use cases in banking.
These 20 indicators form the composite index for measuring blockchain adoption, covering operational, regulatory, technological, and market dimensions relevant to the African context. The index design follows the SMART framework (Ogbeiwi, 2021; Bahrami et al., 2021). Developing such an index involves stages including conceptualisation, data collection, normalisation, aggregation, testing, and ongoing refinement. These approaches apply to various complex phenomena, including blockchain index. Using a structured approach like the SMART framework ensures metrics are specific, measurable, achievable, relevant, and time-bound.
While constructing the index, this study identified the concepts that are relevant to blockchain adoption, selected appropriate indicators based on the concepts, and ensured the indicators comply with the SMART framework. Data for testing the reliability of the index was collected from the selected banks’ annual reports and other credible sources. A total of 20 banks that are key players in the African region were selected based on their size. This study made the selections based on Africa Business data ranking, which is a recognised source that uses Tier 1 capital as the main measure of bank strength. To test the reliability of the index, simple aggregation, averaging, or summing the indicators was used by employing statistical techniques to combine multiple variables into a single measure. This is considered sufficient at this stage because banks are in the early stages of blockchain adoption, and a weighted sum approach might introduce bias as subjective importance may be placed on certain indicators (Marston & Shrives, 1991). Therefore, this study employs dummy coding, with a score of zero for non-adoption and 1 for adoption. The analysis achieved two objectives. First, it analysed the level of blockchain adoption across banks and regions in Africa using descriptive analysis. Second, it verified the usefulness or validity of the index through One-way ANOVA tests.
4. Findings and Discussion
4.1. Objective One:
To identify indicators that can be aggregated to formulate a blockchain technology adoption index and assess whether these indicators comply with the SMART framework for selecting indicators.
4.1.1. Indicators for Determining the Composite Blockchain Adoption Index
Table 1 presents the areas explored in the study to derive the indicators that were aggregated into a blockchain technology adoption index. These areas are categorised based on bank blockchain use cases, including operational, strategic and organisational, performance and impact, and market/customer dimensions. Tracking these indicators over time provides a comprehensive view of the depth and effectiveness with which a bank integrates blockchain into its operations and strategy.
4.1.2. To Assess Whether These Indicators Comply with the SMART Framework for Selecting Indicators
“SMART” in the SMART framework is an acronym for Specific, Measurable, Achievable, Relevant, and Time-Bound. Regarding the indicators used in this study, the study assessed and selected each based on these criteria. The 20 indicators are specific because they can easily be identified in the integrated annual reports and other public information about the banks. This allows researchers to use keywords in these indicators to determine if the banks disclose relevant information. The operational indicators in this study, such as blockchain-based products and services, improvements in transaction speed and efficiency, security and fraud prevention, and the integration of blockchain into core banking systems, all comply with the SMART framework (Smith & Dhillon, 2020; Zhang et al., 2020; Javaid et al., 2023).
First, these indicators are specific because they have clearly defined targets. For instance, a company can assess whether blockchain has reduced operational costs by 15% or increased transaction speed by 20%. Additionally, these indicators are measurable because they involve quantifiable data such as costs and transaction metrics. They are also achievable since blockchain technology can be used to reach specific objectives within a company’s available financial resources. In terms of relevance, all these indicators are connected to improving daily business operations and efficiency. Finally, these indicators can be used to set time-bound goals because companies can set deadlines for achieving them. Indicators related to regulation are essential because companies or banks need regulatory approvals and compliance certificates for blockchain adoption. These include, but are not limited to, blockchain adoption for Know Your Customer (KYC) and AML processes, as well as public disclosures and reporting (Barceló, 2023; Javaid et al., 2023; Zhuk, 2025). These indicators are specific because the type or number of regulatory approvals or compliance certifications for blockchain adoption can be identified. They are measurable because the number of certificates obtained and blockchain-enabled compliance processes can be tracked. Also, they are achievable based on the banks’ interest in meeting regulatory or compliance requirements. They are relevant because regulatory compliance is critical for blockchain processes, which depend on trust and operational standards. Lastly, these indicators are time-bound because the deadlines for certification or compliance are typically specified.
Performance and impact indicators, which include customer adoption rates, volume of transactions, pilot projects, and proofs of concept, and expansion into new markets, are specific, measurable, achievable, relevant, and time-bound (Salisbury & Khvatsky, 2018; Zhou et al, 2020; Javaid et al., 2023). They are specific because the percentage of customers onboard using blockchain, transaction volume, and the number of pilots completed can be identified. Also, quantitative data on users, transactions, and market entries are measurable. They are also achievable as banks can set realistic targets based on market and operational conditions. They are also relevant as they directly reflect the impact of blockchain on performance and growth. In addition, they are time-bound as banks can choose to achieve a specific customer adoption rate within a year.
Lastly, strategic and organisational indicators that include investment in blockchain research and development, partnerships and consortium memberships, internal policy and governance changes, and adoption of blockchain for KYC and AML processes, management and staff blockchain literacy (Faccia et al., 2019; Javaid et al., 2023) are all SMART framework compliant. Table 2 provides a summary of how these indicators comply with the SMART framework for selecting metrics or indicators.
4.2. Objective 2:
To develop a blockchain index based on the assessed indicators
4.2.1. Blockchain Technology Adoption Index
Table 3 shows the indicators used to create the composite blockchain adoption index, which measures the level of blockchain adoption in the banking sector. These indicators were chosen based on blockchain use cases identified in the reviewed literature. The 20 indicators that make up the index cover operational, regulatory, technological, and market dimensions.
4.3. Objective Three:
To test the developed blockchain index using data from leading Banks in Africa. To achieve this objective, this study carried out some descriptive and inferential analyses.
4.3.1. Blockchain Technology Adoption Rate by the Banks in Africa
Figure 1 shows the blockchain technology adoption rate among leading banks in Africa using a Pareto Chart. A Pareto chart is considered suitable here because it displays the contribution of each indicator in descending order of frequency with a cumulative line on a secondary axis representing the total percentage. This visually shows where blockchain technology has been most integrated within the banking sector. The significance of each indicator can be seen from left to right of the chart, in order of importance. The graph also illustrates how these factors collectively contribute to the overall extent of blockchain adoption, with the cumulative line emphasising how quickly the most important indicators accumulate. Strategic vision has the highest score, with the tallest bar (Score = 19). This indicates that most banks have incorporated blockchain into their strategic plans to demonstrate readiness and willingness to adopt the technology. This could also be because the examined banks are leading institutions in Africa with significant growth potential for technology adoption.
In addition to prioritising blockchain as a strategic goal, these banks also align with regulatory requirements and develop blockchain-based operational frameworks. Important requisites for successful adoption and integration show a cumulative score of 18 out of 20. Next is the extent of the banks’ involvement in blockchain consortia with fintech companies, which shows a cumulative score of 17 out of 20. This shows that top banks in Africa are partnering with fintech firms to facilitate effective blockchain adoption. Figure 1 also reveals that the banks are investing in upskilling their workforce and attracting blockchain talent (Score = 17), conducting technology assessments, security audits, and incident or risk response plans for blockchain technology (Score = 17), providing staff training (Score = 17), engaging in research and development (Score = 17), and prioritizing data security (Score = 17). These high scores demonstrate that these banks are committed to sustained blockchain integration, as these components support technical deployment and innovation. Conversely, indicators with lower significance, such as interoperability with other banks or networks, show a score of 3 out of 20. Indicator on implementation for customer identity verification and AML compliance is zero (0), and use of blockchain to automate compliance and reporting processes is also zero (0). These areas show much less commitment and emphasis from the banks. The cumulative line rises sharply for the leftmost indicators (around the first 5 to 7 bars), which indicates that the banks focus on these areas first, as they account for the highest scores.
4.3.2. Descriptive Statistics of the Blockchain Technology Adoption Index by Leading Banks in Africa
Table 4 provides a descriptive analysis of the extent of blockchain technology adoption by the 20 banks examined in this study. It also presents the variation, in terms of the standard deviation, in how much these banks have adopted blockchain technology across the 20 indicators. The analysis shows that most banks have integrated blockchain into their strategic vision and digital transformation plans, given the high mean score of 0.95. This strong integration indicates that banks in Africa recognise the potential of blockchain as a transformative technology in the financial sector. This aligns with the findings of Rahman et al. (2024) and Guo and Liang (2025).
Furthermore, this study revealed that most of the examined banks comply with blockchain regulations in their various countries based on the mean result of 0.90. This high compliance indicates good regulatory alignment. However, a zero score (mean = 0.00) by the banks in the area of blockchain use for automating compliance and reporting could hamper long-term regulatory benefits like transparency and real-time oversight.
As shown in Table 4, other indicators also present high mean scores. The results for these indicators show that banks participate in blockchain consortia or fintech partnerships with a mean score of 0.85. Also, the banks invest in workforce upskilling (mean = 0.85), conduct security assessments (mean = 0.85), invest in blockchain research and development (mean = 0.85), provide staff training and literacy (mean = 0.85), improve data security, privacy, and integrity with blockchain (mean = 0.85), and use blockchain for regulatory collaboration and securities transfer (mean = 0.85). These findings show that banks have demonstrated institutional commitment to blockchain adoption. This finds support in the study of Ahmed Al-Dmour et al (2025) and Ogunrinde et al (2025). Furthermore, the results indicate that most banks have adopted blockchain in cross-border payments (mean = 0.75), customer blockchain-enabled services (mean = 0.75), and transaction cost and time reduction (mean = 0.75). In the area of digital assets and cryptocurrency services (mean = 0.40), the banks show moderate adoption. These results show the practical areas in which blockchain technology is being utilised in the banking sector, but with varying levels of maturity.
The results also revealed that some critical areas in banking have low or no adoption of blockchain technology. These include customer identity verification and AML compliance automation (mean = 0.00), compliance and reporting processes (0.00), diversity of blockchain-based products (0.15), and interoperability with other banks (0.15). This either indicates that the banks are not placing emphasis on these areas or that they are still at the early stage of blockchain implementation. Additionally, high standard deviations in blockchain usage for trade finance (mean = 0.35, standard deviation = 0.49), cross-border payments (mean = 0.75, standard deviation = 0.44), customer usage (mean = 0.75, standard deviation = 0.44), and financial improvements (mean = 0.45, standard deviation = 0.51) reflect uneven adoption among the banks. This variation implies that some banks are heavily adopting blockchain while others are lagging, which could affect their competitive position.
4.3.3. Extent of Blockchain Technology Adoption Across the Five African Regions
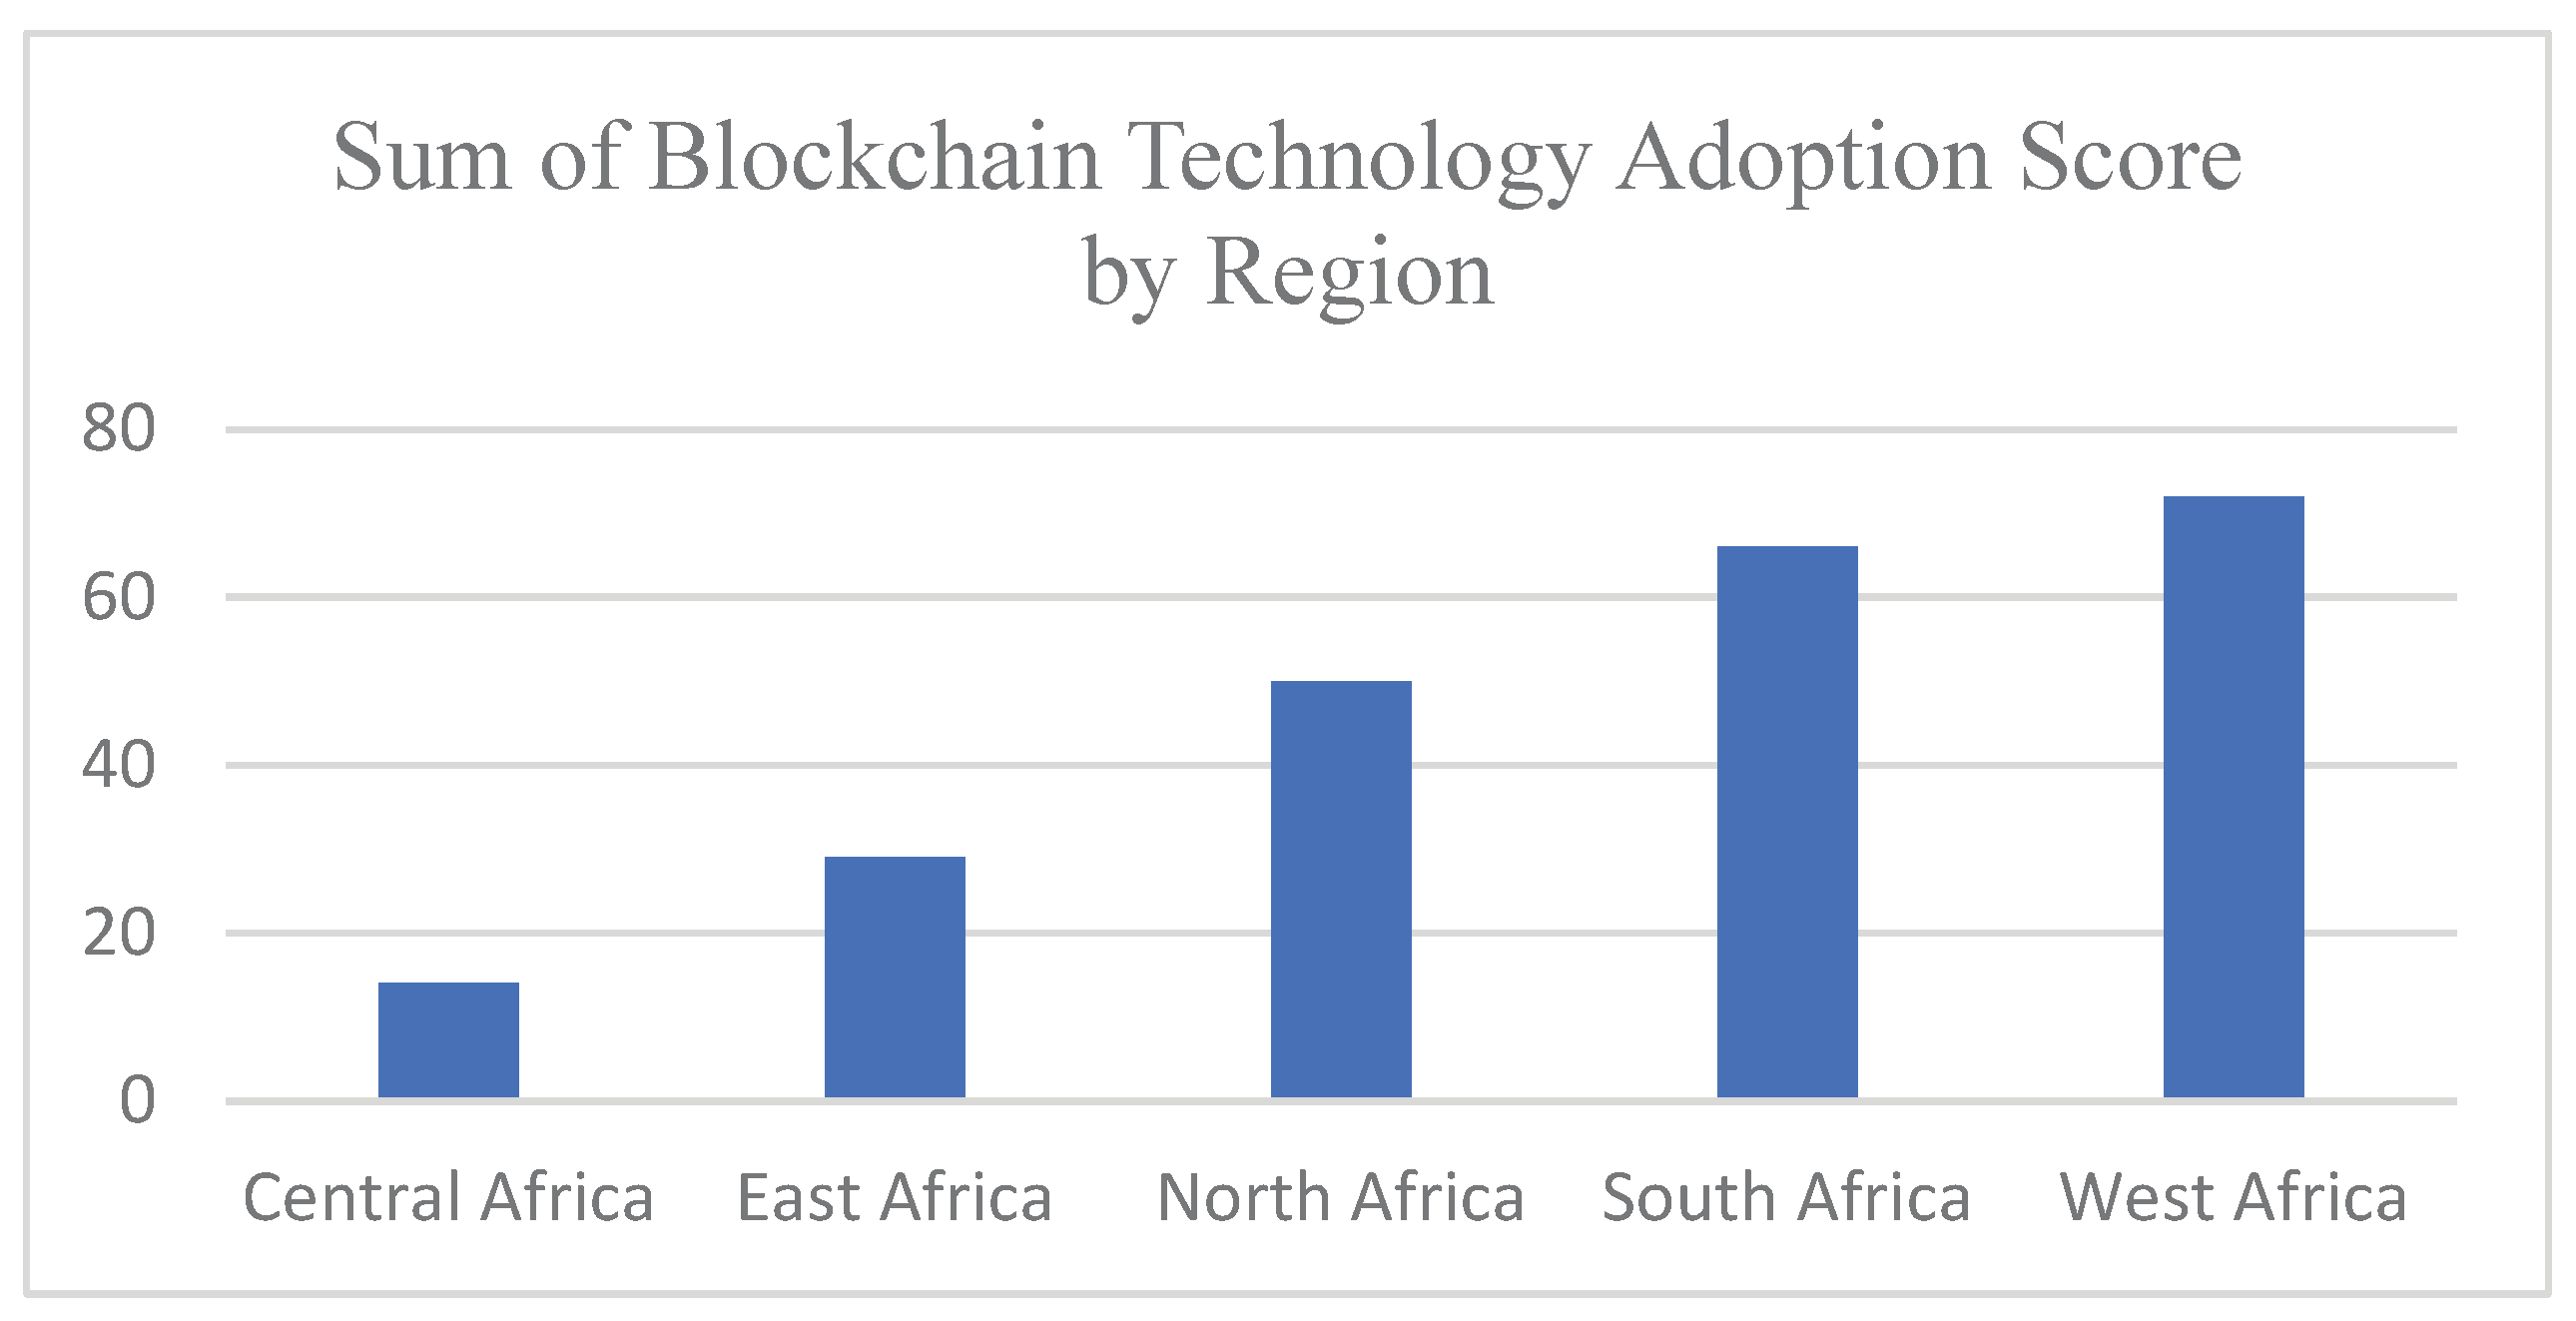
Figure 2 presents the total blockchain technology adoption scores of the examined banks across five African regions. West Africa has the highest score of 72%. This is followed closely by South Africa with a score of 66%. North Africa has a score of 50%, East Africa scores 29%, and Central Africa has the lowest score of 14%. This aligns with the empirical evidence from Thegeya (2023), which states that Nigeria and South Africa are the leading countries in blockchain and cryptocurrency adoption within Africa, as both countries account for over 80 percent of blockchain transactions in Africa. This suggests that blockchain adoption is most advanced in West Africa and South Africa, while Central Africa lags with a low score of 14%, compared to other regions. This outcome may be a reflection of differences in infrastructure, regulatory environments, investment levels, or awareness of blockchain applications across these regions.
Figure 3.
Caption.
4.3.4. Testing the Applicability of the Developed Blockchain Technology Adoption Index Across Different African Regions
This study further investigates whether the developed index is unbiased towards banks in any specific region in Africa. To do this, the study conducts an ANOVA test to compare the mean values across the different African regions. The ANOVA results indicate no statistically significant difference in blockchain technology adoption among the five regions (P-value = 0.426). These results are shown in Table 6. The Between Groups Sum of Squares (98.083) and the Within Groups Sum of Squares (358.867) represent the variability between group means and within individual groups, respectively. The p-value exceeds the standard significance level of 0.05. This suggests there is not enough evidence to conclude that the mean blockchain technology adoption differs across groups. This finding indicates that the developed index is not biased toward any region in Africa. This outcome may also be influenced by the fact that the sample was drawn from the leading banks in Africa, which are early adopters of blockchain technology.
4.3.5. Blockchain Technology Adoption and Bank Size
This study also examines whether the developed index is biased toward larger banks in the sample. This is because some studies have shown that the extent of blockchain adoption depends on the size of a company (Clohessy et al., 2025), which implies that larger companies tend to adopt blockchain technology more quickly than smaller ones. To investigate this, the study used total assets as a proxy for company size. Specifically, we compared the mean sizes of banks in each African region. If there is a statistically significant difference, then size influences the extent of blockchain technology adoption.
The descriptive statistics in Table 7 indicate that banks’ total assets vary significantly across the five regions in Africa. South Africa and North Africa have much higher average total assets compared to West, East, and Central Africa. This suggests possible differences in the financial capacity of banks in these regions to adopt blockchain technology. Specifically, South Africa, North Africa, and West Africa have the highest average total assets of $76,831 million, $92,934 million, and $27,577 million, respectively, with large standard deviations, indicating that some banks possess very large asset bases. This financial strength could support greater adoption of blockchain technology, as these banks may have more resources to invest in new technologies. Conversely, East Africa and Central Africa have substantially lower average total assets of $16,386 million and $14,924 million, respectively, implying a more limited financial capacity on average. This limitation could restrict blockchain adoption, as banks in these regions might face resource constraints. The overall average total assets across all regions is $52,476 million, with a high standard deviation showing considerable disparity between regions.
In Table 8, an ANOVA test was used at the 0.05 level of confidence to examine the significance of the size difference in blockchain adoption levels between and within banks. The test indicates that there is no statistical difference in the means between upper and lower banks when considering the range of bank sizes examined. This suggests that total assets do not directly reflect the level of blockchain adoption but may serve as a potential indicator of a company’s capacity to adopt blockchain technology, since larger companies with greater total assets might have more resources for investing in new technologies.
5. Conclusions
This study developed a formative blockchain technology adoption index for researchers and practitioners by utilising data from the annual reports of leading banks in Africa. Managers and researchers can use the blockchain adoption indices created in this study to gain an accurate understanding of the extent of blockchain technology adoption within banks, instead of depending on third-party assessments. The study demonstrated that the blockchain technology adoption index can be applied to banks of various sizes across Africa. Additionally, the index significantly explains the extent of blockchain technology adoption by leading banks in Africa. The findings revealed low interoperability among banks. This implies that the banks need to invest in interoperability solutions to enable seamless blockchain transactions across banks and ecosystems. Furthermore, banks should prioritise deploying blockchain for customer identity verification, AML, and compliance automation to improve operational efficiency and regulatory compliance. They should also develop a broader range of blockchain-based products to meet diverse customer needs and enhance market competitiveness.
The main contribution of this study is rooted in showing how researchers, managers, financial institutions, and other sectors can create their own blockchain technology adoption indices by adapting the methodology presented here. This has three practical inferences: First, banks can quantify their blockchain adoption level using the index presented in this study to (a) assess how they compare to other banks and (b) improve their adoption efforts over time. Second, other sectors willing to create their own sector-specific blockchain adoption index can explore the indicators from this study and apply the described methods to evaluate the robustness and practicality of their potential indices. Third, practitioners or managers can use this index as a component of their own rating system, complemented by other relevant information.
6. Limitations of the Study
The limitations of this study can serve as a basis for further research in the development of blockchain indices in the following ways.
- (1)
- The formative index developed in this study would gain greater reliability if it included a larger sample of banks from both within Africa and internationally.
- (2)
- This study applied an equal weight to all indicators. Future research can use a weighted approach to prioritise the indicators. Also, to create indices tailored to specific sectors, variables could be assessed using factor analysis, and distinct weights could be assigned to the variables within each identified factor.
- (3)
- Total assets were used to evaluate the size of the banks in relation to their blockchain adoption capability. Future research can use other variables like revenue and profit in this regard. This is because, total assets do not directly depict blockchain adoption; instead, it acts as a potential proxy for a bank’s capacity to adopt blockchain, as larger banks with greater total assets may have more resources for investment in new technologies.
- (4)
- This study only utilised data from leading banks in Africa because blockchain adoption is still at its early stage among banks. Hence, the index was built based on information deemed relevant to big banks.
Author Contributions
Conceptualization, D.F.S.; methodology, D.F.S.; formal analysis, D.F.S.; investigation, D.F.S.; resources, D.F.S.; data curation, D.F.S.; writing—original draft preparation, D.F.S.; writing—review and editing, D.F.S.; visualization, D.F.S. Author has read and agreed to the published version of the manuscript.
Funding
This research received no external funding.
Institutional Review Board Statement
Not applicable.
Informed Consent Statement
Not applicable.
Data Availability Statement
This study utilised secondary data of.
Conflicts of Interest
The authors declare no conflicts of interest.
References
- AbdelSalam, F. M. Blockchain revolutionising healthcare industry: A systematic review of blockchain technology benefits and threat. 2023. Available online: https://www.ncbi.nlm.nih.gov/pmc/articles/PMC10701638/.
- Adams, I. E.; Van Belle, J. P. W.; Oosterwyk, G. Investigating the state of blockchain adoption in the South African finance industry. 2023 18th Iberian Conference on Information Systems and Technologies (CISTI), 2023. [Google Scholar] [CrossRef]
- Ahmed Al-Dmour, R.; Al-Dmour, H.; Al-Adwan, A. Blockchain applications and commercial bank performance: The mediating role of AIS quality. Journal of Open Innovation:Technology, Market, and Complexity 10(2) 2024. [Google Scholar] [CrossRef]
- Akinlo, O. O.; Sule, D. F. Voluntary disclosure and cost of equity capital in Nigerian banks: An empirical study. Ife Journal of Economics and Finance 2019, 8(12), 61–72. [Google Scholar]
- Alammary, A.; Alhazmi, S.; Almasri, M.; Gillani, S. Blockchain-based applications in education: A systematic review. Applied Sciences 2019, 9(12), 2400. [Google Scholar] [CrossRef]
- Bahrami, Z.; Heidari, A.; Cranney, J. Applying SMART goal intervention leads to greater goal attainment, need satisfaction and positive effect. International Journal of Mental Health Promotion 2022, 24(6), 869–882. [Google Scholar] [CrossRef]
- Barceló, E.; Dimić-Mišić, K.; Imani, M.; Spasojević Brkić, V.; Hummel, M.; Gane, P. Regulatory paradigm and challenge for blockchain integration of decentralized systems: Example—Renewable energy grids. Sustainability 2023, 15(3), 2571. [Google Scholar] [CrossRef]
- Bazel, M. A.; Mohammed, F.; Ahmad, M.; et al. Blockchain technology adoption in healthcare: An integrated model. Scientific Reports 2025, 15, 14111. [Google Scholar] [CrossRef]
- Belcher, B. M.; Claus, R.; Davel, R.; Place, F. Indicators for monitoring and evaluating research-for-development: A critical review of a system in use. Environmental and Sustainability Indicators 2024, 24, 100526. [Google Scholar] [CrossRef]
- Bora, K. Centralised banking system. Academic Makers. 2025. Available online: https://academicmakers.com/centralised-banking-system/.
- Bunge, M. What is a quality of life indicator? Social Indicators Research 1975, 2, 65–79. [Google Scholar] [CrossRef]
- Chainalysis. The 2025 global adoption index. Chainanalysis. 28 September 2025. Available online: https://www.chainalysis.com/blog/2025-global-crypto-adoption-index.
- Clifton, J.; Fernández-Gutiérrez, M.; Cagigas, D. Beyond the hype—the actual use of blockchain in government. Policy Design and Practice 2023, 6(4), 389–396. [Google Scholar] [CrossRef]
- Clohessy, T.; Acton, T. Investigating the influence of organizational factors on blockchain adoption: An innovation theory perspective. Industrial Management & Data Systems 2019, 119(7), 1457–1491. [Google Scholar]
- Colombo, J. A.; Yarovaya, L. Are crypto and non-crypto investors alike? Evidence from a comprehensive survey in Brazil. Technology in Society 2024, 76, 102468. [Google Scholar] [CrossRef]
- Davis, F. D. Perceived usefulness, perceived ease of use, and user acceptance in information technology. MIS Quarterly 1989, 13(3), 319–340. [Google Scholar] [CrossRef]
- Dong, S.; Abbas, K.; Li, M.; Kamruzzaman, J. Blockchain technology and application: An overview. PeerJ Computer Science 9 2023, e1705. [Google Scholar] [CrossRef] [PubMed]
- Elkoraichi, Y.; Elfezazi, S.; Belhadi, A. Analysis of barriers to blockchain technology adoption in the African agri-food supply chain. Discover Sustainability 6 2025, 289. [Google Scholar] [CrossRef]
- Ennajeh, L.; Najjar, T. Blockchain technology adoption through the UTAUT model: Exploring the mediating role of trust in technology. Journal of Telecommunications and the Digital Economy 2024, 12(1), 328–355. [Google Scholar] [CrossRef]
- Faccia, A.; Al Naqbi, M. Y. K.; Lootah, S. A. Integrated cloud financial accounting cycle: How artificial intelligence, blockchain, and XBRL will change the accounting, fiscal and auditing practices. In Proceedings of the 2019 3rd International Conference on Cloud and Big Data Computing, 2019, August; pp. 31–37. [Google Scholar]
- Garg, P.; Gupta, B.; Chauhan, A. K.; Sivarajah, U.; Gupta, S.; Modgil, S. Measuring the perceived benefits of implementing blockchain technology in the banking sector. Technological Forecasting and Social Change 163 2021, 120407. [Google Scholar] [CrossRef]
- Ghosh, P. K.; Chakraborty, A.; Hasan, M.; Rashid, K.; Siddique, A. H. Blockchain application in healthcare systems: A review. Systems 2023, 11(1), 38. [Google Scholar] [CrossRef]
- García-Monleón, F.; Erdmann, A.; Arilla, R. A value-based approach to the adoption of cryptocurrencies. Journal of Innovation & Knowledge 2023, 8(2), 100342. [Google Scholar] [CrossRef]
- Gschnaidtner, C.; Dehghan, R.; Hottenrott, H.; Schwierzy, J. Adoption and diffusion of blockchain technology. ZEW Leibniz-Zentrum für Europäische Wirtschaftsforschung. 2024. Available online: https://hdl.handle.net/10419/289452.
- Guo, Y.; Liang, C. Blockchain application and outlook in the banking industry. In Blockchain, crypto assets, and financial innovation; Kou, G., Li, Y., Zhang, Z., Zhao, J. L., Zhuo, Z., Eds.; Springer, 2025. [Google Scholar] [CrossRef]
- Hassan, M. K. A disclosure index to measure the extent of corporate governance reporting by UAE listed corporations. Journal of Financial Reporting and Accounting 2012, 10(1), 4–33. [Google Scholar] [CrossRef]
- Henley; Partners. The Henley crypto adoption index. 2025. Available online: https://www.henleyglobal.com/publications/henley-crypto-adoption-index-2025.
- International Capital Market Association (ICMA). Tracker of new FinTech applications in bond markets. 10 November 2024. Available online: https://www.icmagroup.org/fintech-and-digitilisation//fintech-resources/tracker-of-new-fintech-applications-in-bond-markets/.
- Jepkoech, J.; Anyembe, S. C. Implementation of blockchain technology in Africa. European Journal of Computer Science and Information Technology 2019, 7(4), 1–4. [Google Scholar]
- Javaid, M.; Haleem, A.; Singh, R. P.; Suman, R.; Khan, S. A review of blockchain technology applications for financial services. BenchCouncil Transactions on Benchmarks, Standards and Evaluations 2022, 2(3), 100073. [Google Scholar] [CrossRef]
- Kamal Hassan, M. A disclosure index to measure the extent of corporate governance reporting by UAE listed corporations. Journal of Financial Reporting and Accounting 2012, 10(1), 4–33. [Google Scholar] [CrossRef]
- Kim, Y.; Crowston, K. Technology adoption and use theory review for studying scientists' continued use of cyber-infrastructure. In Proceedings of the American Society for Information Science and Technology, 2012. [Google Scholar] [CrossRef]
- Kumar, S.; Lim, W. M.; Sivarajah, U.; Kaur, J. Artificial intelligence and blockchain integration in business: Trends from a bibliometric-content analysis. Information Systems Frontiers 2023, 25(2), 871–896. [Google Scholar] [CrossRef]
- Maagi, B. Applicability of blockchain technology in improving efficiency in supply chain operations in public procurement in Tanzania. International Journal of Research in Business and Social Science 2023, 12(9), 91–98. [Google Scholar] [CrossRef]
- Mattila, J. The blockchain phenomenon–the disruptive potential of distributed consensus architectures. ETLA Working Paper No. 38, 2016. [Google Scholar]
- Nguyen, L. T. M.; Nguyen, P. T. Determinants of cryptocurrency and decentralized finance adoption: A configurational exploration. Technological Forecasting and Social Change 201 2024, 123244. [Google Scholar] [CrossRef]
- Ogbeiwi, O. General concepts of goals and goal-setting in healthcare: A narrative review. Journal of Management & Organization 2021, 27(2), 324–341. [Google Scholar] [CrossRef]
- Ogunrinde, A.; De-Pablos-Heredero, C.; Montes-Botella, J.-L.; Fernández-Sanz, L. The impact of blockchain technology and dynamic capabilities on banks’ performance. Big Data and Cognitive Computing 2025, 9(6), 144. [Google Scholar] [CrossRef]
- Osmani, M.; El-Haddadeh, R.; Hindi, N.; Janssen, M.; Weerakkody, V. Blockchain for next generation services in banking and finance: Cost, benefit, risk and opportunity analysis. Journal of Enterprise Information Management 2021, 34(3), 884–899. [Google Scholar] [CrossRef]
- Papoutsi, A.; Sodhi, M. S. A sustainability disclosure index using corporate sustainability reports. Journal of Sustainability Research 2020, 2(2). [Google Scholar] [CrossRef]
- Papoutsi, A.; Sodhi, M. S. A sustainability disclosure index using corporate sustainability reports. Journal of Sustainability Research 2020, 2(2), e200020. [Google Scholar] [CrossRef]
- Polcumpally, A. T.; Pandey, K. K.; Kumar, A.; Samadhiya, A. Blockchain governance and trust: A multi-sector thematic systematic review and exploration of future research directions. Heliyon 2024, 10(12), e32975. [Google Scholar] [CrossRef]
- Rahman, S. M. M.; Yii, K. J.; Masli, E. K.; Voon, M. L. The blockchain in the banking industry: A systematic review and bibliometric analysis. Cogent Business & Management 2024, 11(1). [Google Scholar] [CrossRef]
- Roopnarain, M.; Mwapwele, S. D. Factors influencing the adoption and usage of blockchain in e-commerce: A systematic literature review. African Journal of Science, Technology, Innovation and Development 2025, 17(2), 238–251. [Google Scholar] [CrossRef]
- Salem, S.; Ali, N. A proposed adoption model for blockchain technology using the unified theory of acceptance and use of technology (UTAUT). 2019. [Google Scholar]
- Saker, P. Centralized banking system; Chowdhury, M. M. H., Ed.; The Observer, 14 September 2019; Available online: https://www.scribd.com/document/464486676/Centralized-banking-system-pdf.
- Sharma, P.; Shukla, D. M.; Raj, A. Blockchain adoption and firm performance: The contingent roles of intangible capital and environmental dynamism. 2023. [Google Scholar] [CrossRef]
- Shrimali, B.; Patel, H. B. Blockchain state-of-the-art: Architecture, use cases, consensus, challenges and opportunities. Journal of King Saud University - Computer and Information Sciences 2022, 34(9), 6793–6807. [Google Scholar] [CrossRef]
- Sibanda, B.; Basheka, B.; Van Romburgh, J. Enhancing governance through blockchain technology in the South African public sector. Africa’s Public Service Delivery and Performance Review 2024, 12(1), Article a734. [Google Scholar] [CrossRef]
- Smith, K. J.; Dhillon, G. Assessing blockchain potential for improving the cybersecurity of financial transactions. Managerial Finance 2020, 46(6), 833–848. [Google Scholar] [CrossRef]
- Sule, D. F.; Moloi, T. How Do Segment Disclosure and Cost of Capital Impact the Investment Efficiency of Listed Firms in Nigeria? Journal of Risk and Financial Management 2025, 18(5), 258. [Google Scholar] [CrossRef]
- Sule, D. F. Can segment disclosure improve the investment efficiency of listed companies in Nigeria? African Journal of Business and Economic Research 2025a, 20(1), 319–340. Available online: https://hdl.handle.net/10520/ejc-aa_ajber_v20_n1_a14. [CrossRef]
- Sule, D. F. The determinants off voluntary segment disclosure by Nigerian Listed Companies: Further Evidence. African Journal of Innovation and Entrepreneurship 2025b, 4(1), 311–329. Available online: https://hdl.handle.net/10520/ejc-aa_ajie_v4_n1_a13. [CrossRef]
- Thegeya, A. The economics of blockchain within Africa. In Data governance and policy in Africa. Information Technology and Global Governance; Ndemo, B., Ndung’u, N., Odhiambo, S., Shimeles, A., Eds.; Palgrave Macmillan, 2023. [Google Scholar] [CrossRef]
- Tripathi, G.; Ahad, M. A.; Casalino, G. A comprehensive review of blockchain technology: Underlying principles and historical background with future challenges. 2023. [Google Scholar] [CrossRef]
- Trivedi, S.; Mehta, K.; Sharma, R. Systematic literature review on application of blockchain technology in e-finance and financial services. Journal of Technology Management & Innovation 2021, 16(3), Article 00089. [Google Scholar] [CrossRef]
- Varma, P.; Nijjer, S.; Sood, K.; Grima, S.; Rupeika-Apoga, R. Thematic analysis of financial technology (Fintech) influence on the banking industry. Risks 2022, 10(10), 186. [Google Scholar] [CrossRef]
- Venkatesh, V. Determinants of perceived ease of use: Integrating control, intrinsic motivation, and emotion into the technology acceptance model. Information Systems Research 2000, 11(4), 342. [Google Scholar] [CrossRef]
- Van Zyl, D.; Puth, G. Constructing a sophistication index as a method of market segmentation of commercial farming businesses in South Africa. Southern African Business Review 2019, 19(2), 99. [Google Scholar] [CrossRef] [PubMed]
- Weerawarna, R.; Miah, S. J.; Shao, X. Emerging advances of blockchain technology in finance: A content analysis. Personal and Ubiquitous Computing 2023, 27, 1495–1508. [Google Scholar] [CrossRef]
- Zhang, S.; Tang, J. A.; Hu, Q.; Liu, F. Research on blockchain financial derivatives cluster. In Proceedings of the 2020 3rd international conference on blockchain technology and applications, 2020, December; pp. 40–46. [Google Scholar]
- Zhou, Z.; Li, R.; Cao, Y.; Zheng, L.; Xiao, H. Dynamic performance evaluation of blockchain technologies. IEEE Access 2020, 8, 217762–217772. [Google Scholar] [CrossRef]
- Zhuk, A. Beyond the blockchain hype: Addressing legal and regulatory challenges. SN Social Sciences 2025, 5, 11. [Google Scholar] [CrossRef]
Figure 1.
Source: Chirag (2024, April 25 in Appinventiv).
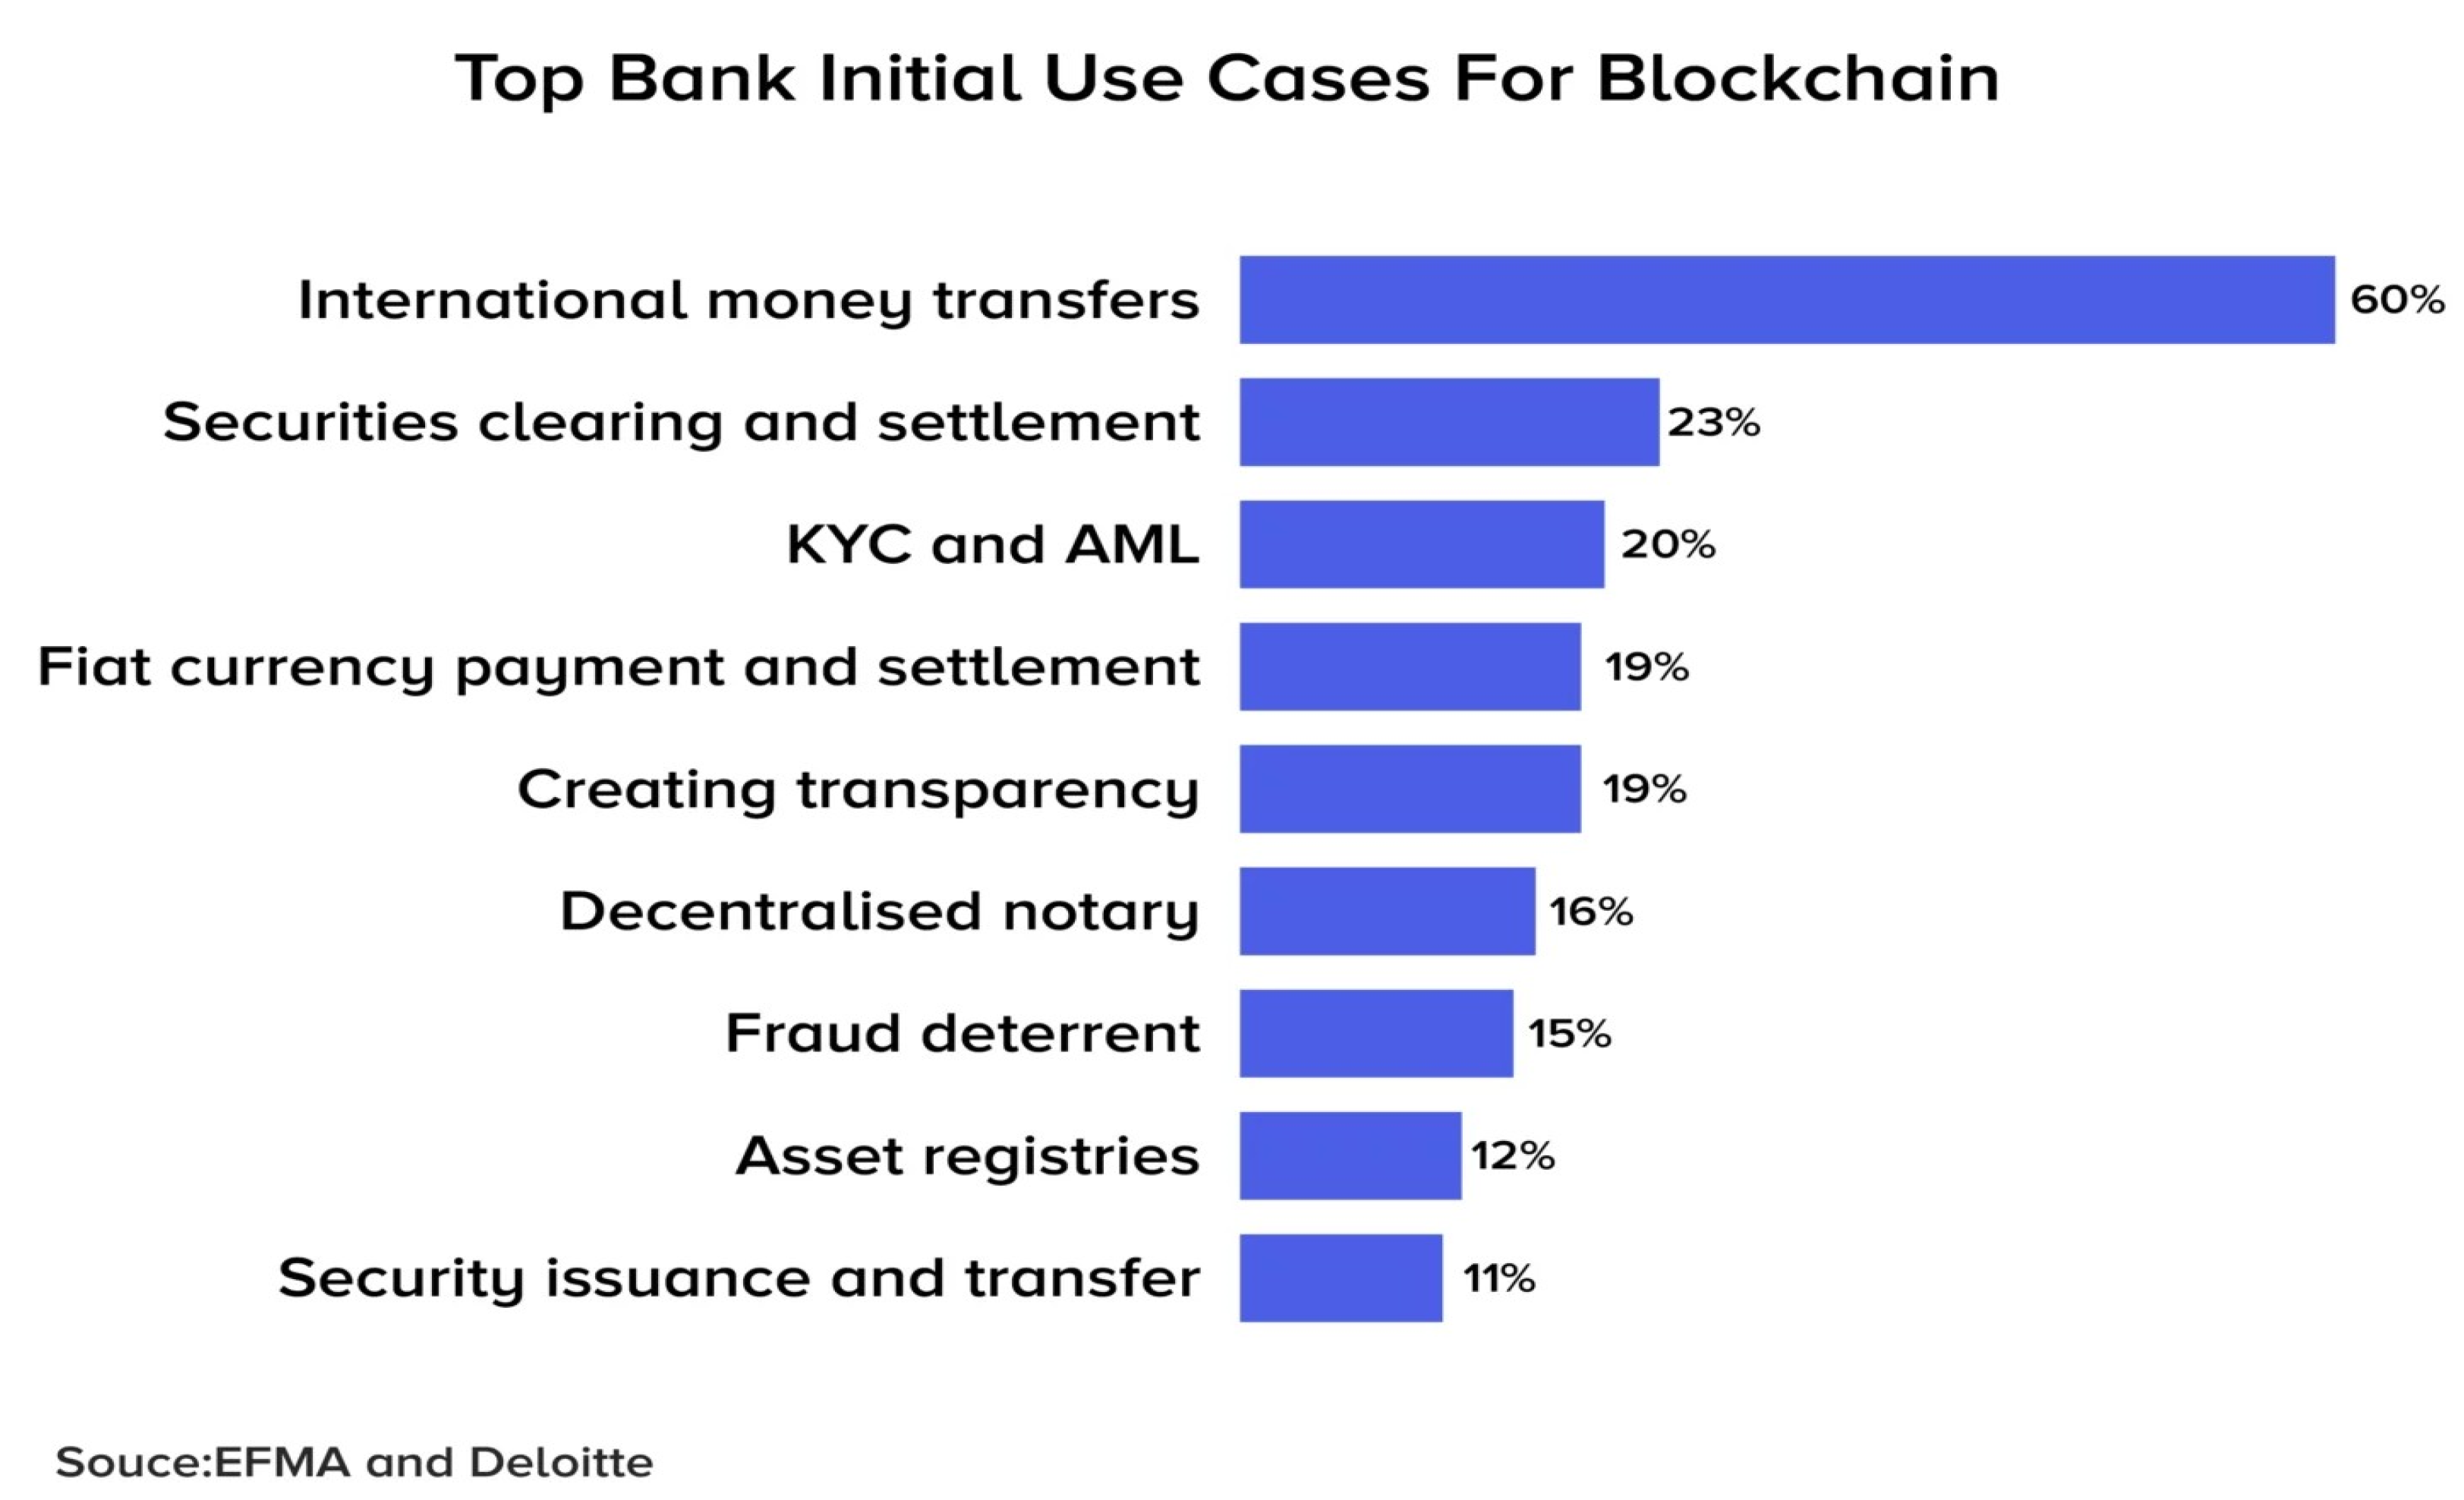
Figure 2.
Blockchain Technology Adoption Rate by Banks in Africa.
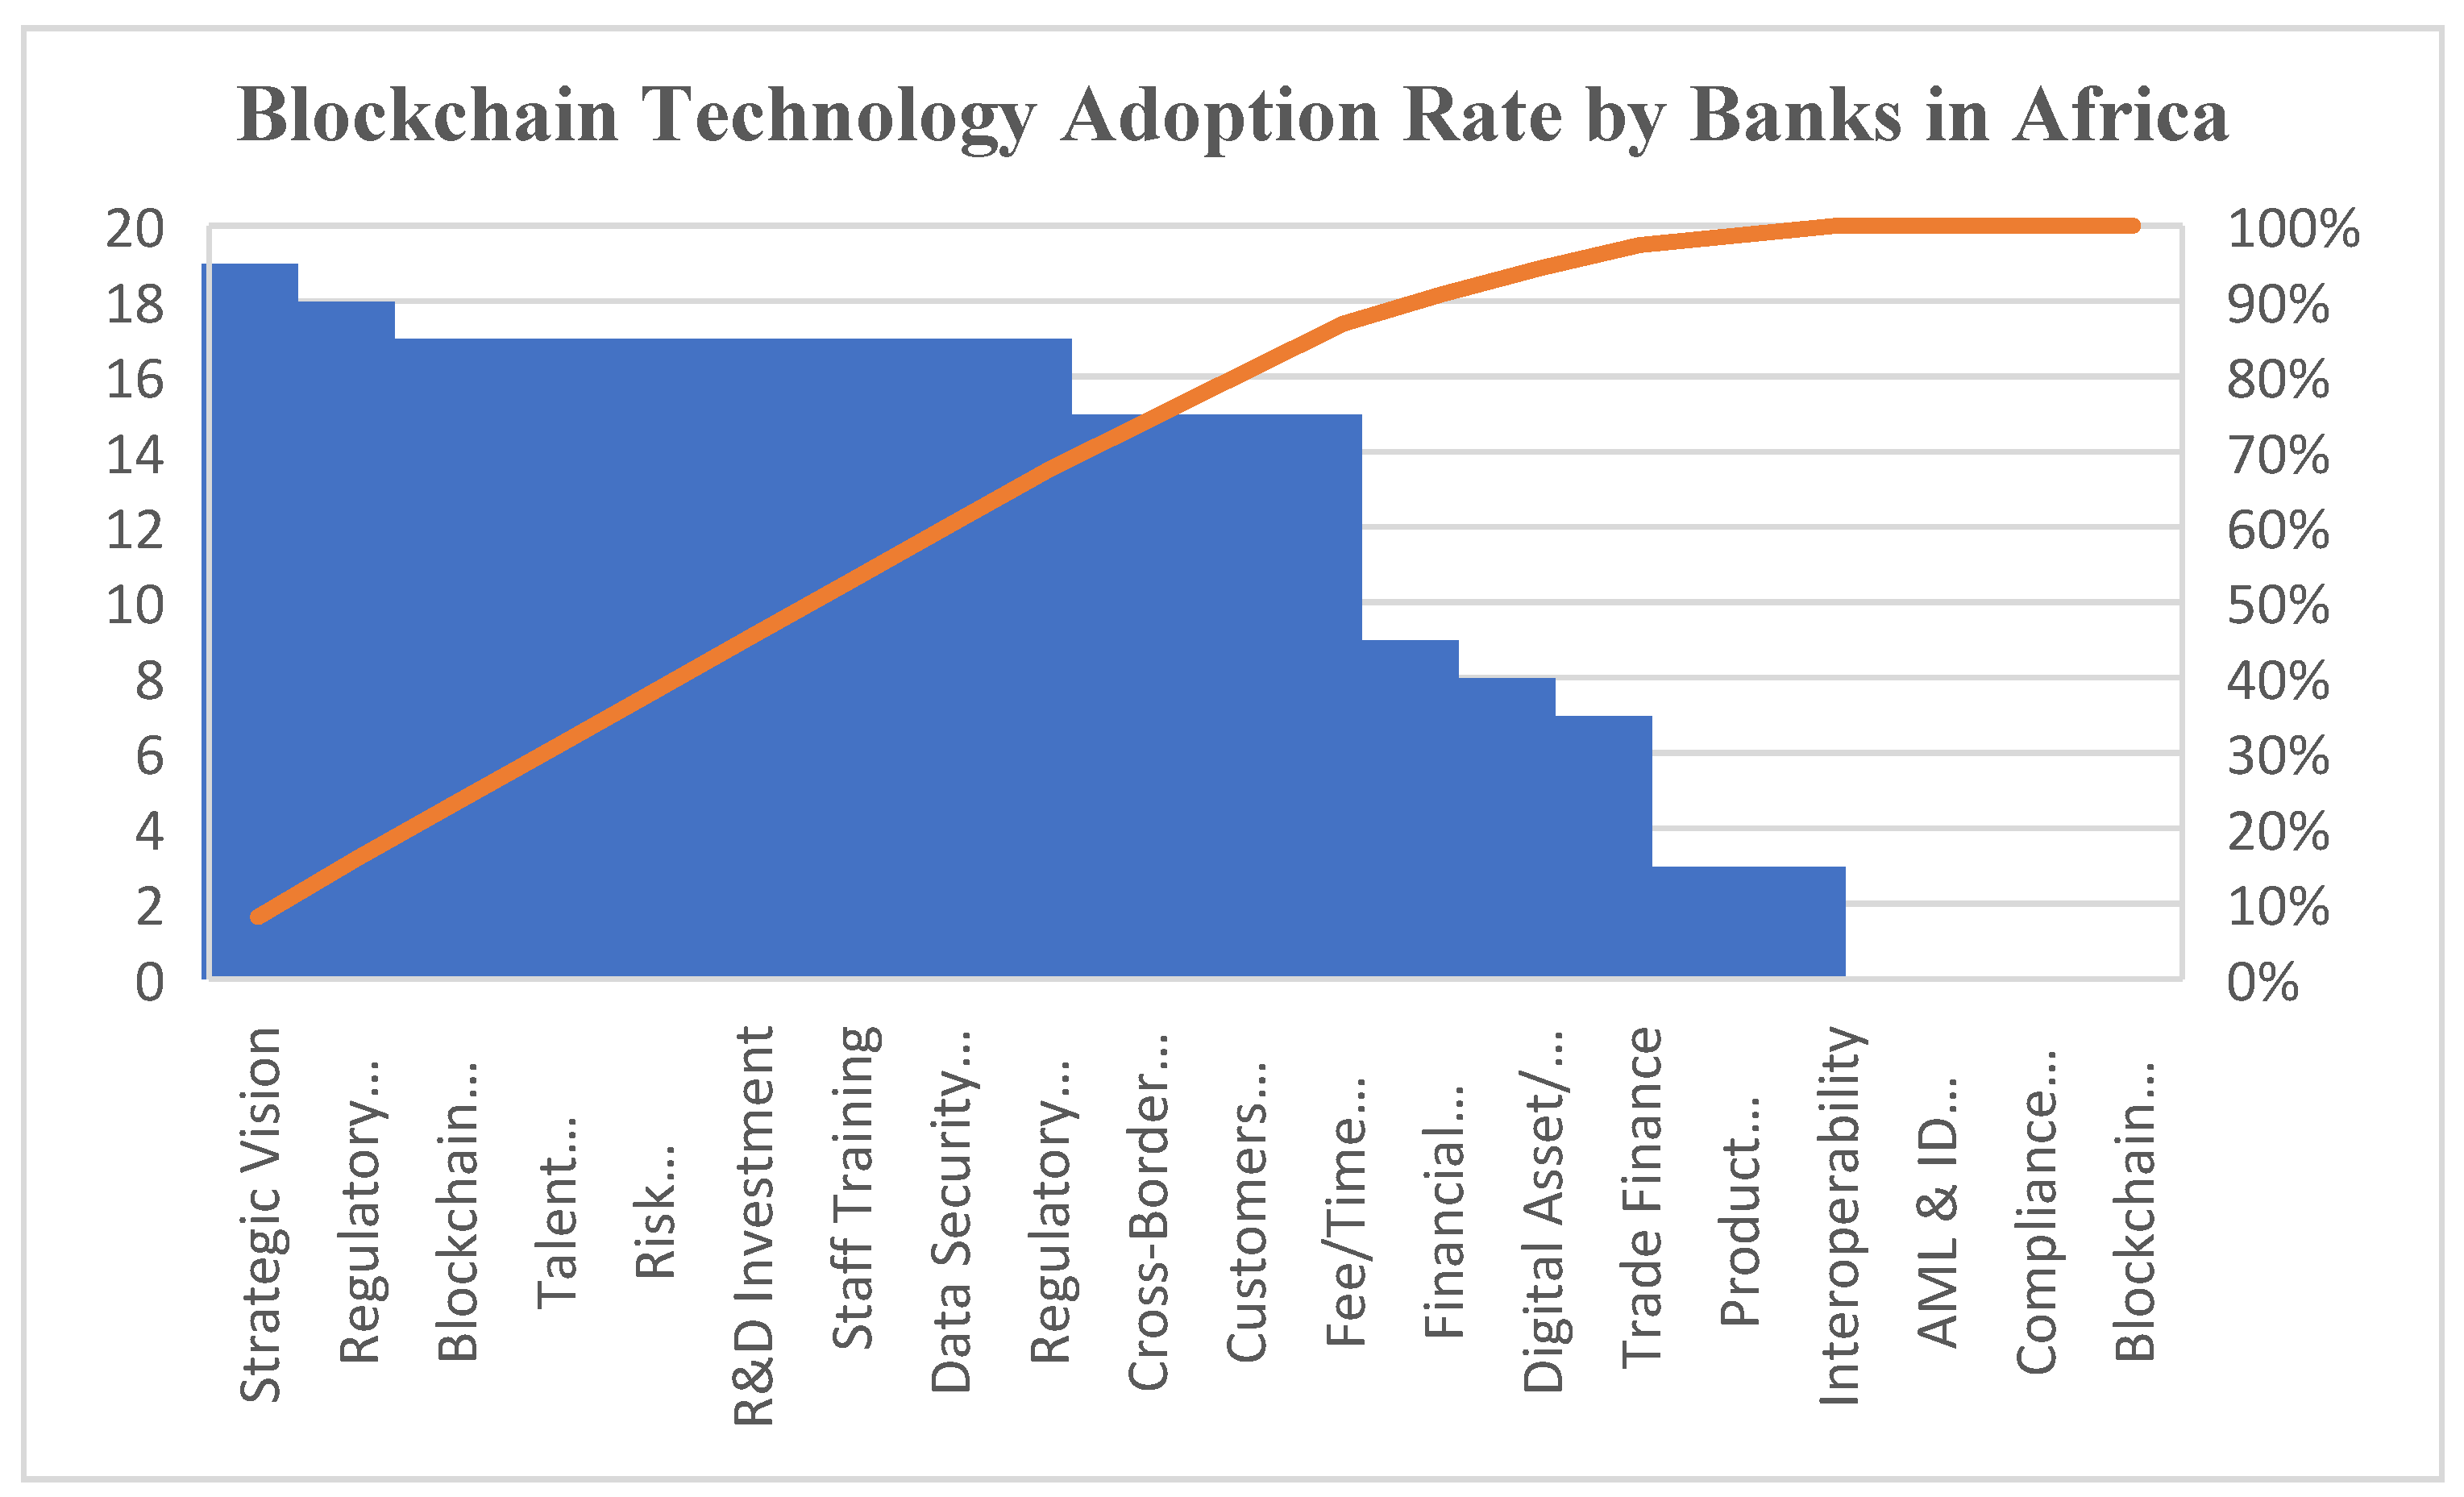

Table 1.
Indicators for Determining the Composite Blockchain Adoption Index.
| Categories of Indicator | Items/Indicator | References |
|---|---|---|
| Operational Indicators | Blockchain-based products and services Integration with core banking systems Volume and value of transactions on blockchain platforms Enhancement in security and fraud prevention Pilot projects and proofs of concept |
Smith & Dhillon, 2020; Zhang et al, 2020; Javaid et al, 2023. |
| Strategic and Organizational Indicators | Investment in blockchain research and development Partnerships and consortium memberships Internal policy and governance changes Adoption of blockchain for Know Your Customer (KYC) and Anti-Money Laundering (AML) processes Management and staff blockchain literacy |
Faccia et al., 2019; Javaid et al., 2023 |
| Regulatory and Compliance Indicators | Regulatory approvals and compliance certifications Public disclosures and reporting |
Barceló, 2023; Javaid et al., 2023; Zhuk, 2025. |
| Performance and Impact Indicators | Reduction in operational costs Improvement in transaction speed and efficiency Enhancements in security and fraud prevention Impact of blockchain adoption on financial performance indicators |
Salisbury & Khvatsky, 2018; Zhou et al, 2020; Javaid et al., 2023 |
| Market and Customer Indicators | Customer adoption rates Expansion into new markets or services |
Kumar et al., 2023; Javaid et al., 2023; Shrimali & Patel 2022 |
Source: Authors’ compilation, 2025.
Table 2.
Smart Framework for Blockchain Adoption.
| Indicator Type | Specific | Measurable | Achievable | Relevant | Time-bound |
|---|---|---|---|---|---|
| Operational Indicators | Clear cost, speed, and security goals | Cost savings, speed in milliseconds, and fraud cases | Within resource/technology limits | Direct business operations impact | Defined timelines, e.g., 6-12 months |
| Strategic and Organizational Indicators | Investment and partnership targets | Amount invested, partner count, policies | Company strategy aligned | Supports long-term roadmap | Training and policy deadlines |
| Regulatory and Compliance Indicators | Certifications, compliance steps | Certificates, audit scores | Meets regulatory standards | Ensures legality and trust | Certification deadlines |
| Performance and Impact Indicators | Customer/transaction goals | User numbers, transaction volume | Realistic growth targets | Indicates blockchain impact | 6-12 month goals |
| Market & Customer Indicators | Market expansion targets | Market penetration data | Based on research/budgets | Growing market presence | Rollout schedule |
| Blockchain Products & Services | Integration and adoption levels | System integration counts, KYC/AML uptake | Feasible with tech/regulations | Improve offerings/compliance | Project timelines |
Source: Authors’ compilation, 2025.
Table 3.
Blockchain Technology Adoption Index.
| No | Blockchain Adoption Index |
|---|---|
| 1 | Blockchain is integrated into the strategic vision and digital transformation roadmap of the bank. |
| 2 | Bank complies with blockchain-related regulations. |
| 3 | The bank is involved in blockchain consortia or partnerships with fintech companies. |
| 4 | Bank invests in upskilling the workforce and attracting blockchain talent. |
| 5 | Conducts technology assessment, security audits, and incident response plans for blockchain. |
| 6 | Uses blockchain for trade finance. |
| 7 | Use of blockchain for smart contracts |
| 8 | Use of blockchain for cross-border remittances and settlements |
| 9 | Uses blockchain for the implementation of customer identity verification and AML compliance |
| 10 | Invests in blockchain research and development |
| 11 | Staff training and blockchain literacy |
| 12 | Customers using blockchain-enabled banking services |
| 13 | Diversity of blockchain-based products available to customers |
| 14 | Interoperability with other banks or networks |
| 15 | Use of blockchain to improve data security, privacy, and integrity |
| 16 | Decreases in transaction fees and processing times due to blockchain adoption |
| 17 | Use of blockchain to automate compliance and reporting processes |
| 18 | Use of blockchain for digital asset and cryptocurrency services tokenization |
| 19 | Use of blockchain to increase the volume and value of transactions |
| 20 | Use of blockchain to expand into new markets or services |
Source: Authors’ compilation, 2025.
Table 4.
Descriptive Statistics of Blockchain Technology Adoption Index.
| Blockchain Adoption Index | Mean | Std. Deviation | |
|---|---|---|---|
| 1 | Blockchain is integrated into the strategic vision and digital transformation roadmap of the banks | 0.95 | 0.224 |
| 2 | Banks comply with blockchain-related regulations | 0.90 | 0.308 |
| 3 | The bank is involved in blockchain consortia or partnerships with fintech companies | 0.85 | 0.366 |
| 4 | Invest in upskilling the workforce and attracting blockchain talent? | 0.85 | 0.366 |
| 5 | Conduct technology assessment, security audits, and incident response plans for blockchain | 0.85 | 0.366 |
| 6 | Use blockchain for trade finance | 0.35 | 0.489 |
| 7 | Use of blockchain for smart contracts | 0.48 | 0.378 |
| 8 | Use of blockchain for cross-border remittances and settlements | 0.75 | 0.444 |
| 9 | Implementation for customer identity verification and AML compliance | 0.00 | 0.000 |
| 10 | Investment in blockchain research and development | 0.85 | 0.366 |
| 11 | Staff training and blockchain literacy | 0.85 | 0.366 |
| 12 | Customers using blockchain-enabled banking services | 0.75 | 0.444 |
| 13 | Diversity of blockchain-based products available to customers | 0.15 | 0.366 |
| 14 | Interoperability with other banks or networks | 0.15 | 0.366 |
| 15 | Use of blockchain to improve data security, privacy, and integrity | 0.85 | 0.366 |
| 16 | Decreases in transaction fees and processing times due to blockchain adoption | 0.75 | 0.444 |
| 17 | Use of blockchain to automate compliance and reporting processes | 0.00 | 0.000 |
| 18 | Use of blockchain to expand into new markets or services | 0.45 | 0.510 |
| 19 | Use of blockchain for digital asset and cryptocurrency services tokenization | 0.40 | 0.503 |
| 20 | Use of blockchain to increase the volume and value of transactions | 0.60 | 0.345 |
Source: Authors’ computation 2025.
Table 6.
ANOVA Test for Blockchain Adoption Across Africa.
| ANOVA | |||||
|---|---|---|---|---|---|
| Blockchain Technology Adoption | |||||
| Sum of Squares | Df | Mean Square | F | Sig. | |
| Between Groups | 98.083 | 4 | 24.521 | 1.025 | 0.426 |
| Within Groups | 358.867 | 15 | 23.924 | ||
| Total | 456.950 | 19 | |||
Source: Authors’ Computation, 2025. Note: The mean difference is significant at the 0.05 level.
Table 7.
ANOVA test multiple comparisons – Tukey.
| Descriptives | ||||||||
|---|---|---|---|---|---|---|---|---|
| Total Asset ($m) | ||||||||
| N | Mean | Std. Deviation | Std. Error | 95% Confidence Interval for Mean | Minimum | Maximum | ||
| Lower Bound | Upper Bound | |||||||
| South Africa | 6 | 76831.17 | 57105.101 | 23313.060 | 16903.04 | 136759.29 | 3627 | 169858 |
| North Africa | 4 | 92933.75 | 62654.638 | 31327.319 | 6763.76 | 192631.26 | 25675 | 167407 |
| West Africa | 5 | 27557.00 | 3972.408 | 1776.515 | 22624.60 | 32489.40 | 23631 | 33448 |
| East Africa | 3 | 16385.67 | 5678.503 | 3278.485 | 2279.48 | 30491.85 | 11727 | 22711 |
| Central Africa | 2 | 14924.50 | 11561.903 | 8175.500 | 88955.08 | 118804.08 | 6749 | 23100 |
| Total | 20 | 52475.65 | 50409.886 | 11271.993 | 28883.10 | 76068.20 | 3627 | 169858 |
Source: Authors’ computation, 2025. Note: The mean difference is significant at the 0.05 level.
Table 8.
ANOVA Test for Bank Size (Proxied by Total Assets).
| ANOVA | |||||
|---|---|---|---|---|---|
| Total Asset ($m) | |||||
| Sum of Squares | Df | Mean Square | F | Sig. | |
| Between Groups | 19938912587.800 | 4 | 4984728146.950 | 2.638 | 0.075 |
| Within Groups | 29343062280.750 | 16 | 1889537485.383 | ||
| Total | 48281974868.550 | 20 | |||
Source: Authors’ computation, 2025. Note: The mean difference is significant at the 0.05 level.
Disclaimer/Publisher’s Note: The statements, opinions and data contained in all publications are solely those of the individual author(s) and contributor(s) and not of MDPI and/or the editor(s). MDPI and/or the editor(s) disclaim responsibility for any injury to people or property resulting from any ideas, methods, instructions or products referred to in the content. |
© 2025 by the authors. Licensee MDPI, Basel, Switzerland. This article is an open access article distributed under the terms and conditions of the Creative Commons Attribution (CC BY) license (https://creativecommons.org/licenses/by/4.0/).
Copyright: This open access article is published under a Creative Commons CC BY 4.0 license, which permit the free download, distribution, and reuse, provided that the author and preprint are cited in any reuse.


