
Submitted:
02 December 2025
Posted:
08 December 2025
You are already at the latest version
Abstract
Financial resilience has increasingly captured the attention of scholars, as it directly impacts general well-being, inclusive education, and sustainable economic development. This study provides evidence on how university students view financial resilience, based on their perceptions, experiences, and actions taken to address difficult financial situations in recent times. Thus, it contributes to SDG 3 by promoting economic and psychological well-being; to SDG 4 by strengthening financial education as an essential element of quality education; and to SDG 8 by facilitating development. The scale is based on financial health indicators aligned with the Center for Financial Services Innovation. Data were analyzed using SEM methodology. Findings reveal a three-factor model explaining perceptions of financial health indicators, including lived experiences and resilient actions taken in the face of adverse financial situations. The three-dimensional model is not fully supported, as indicators that do not favor the final model due to low factorial loads are excluded.
Keywords:
financial resilience
; college students
; SEM methodology
; SDGs
1. Introduction
The notion of resilience, initially proposed by Holling (1973), represents a shift toward alternative thinking about stability, adopting a systemic and holistic perspective that integrates social and ecological dimensions. This concept allows us to understand the internal and external configurations and dynamics of systems, facilitating the analysis of their behavior in the face of disturbances (Gunderson, 2000; Gunderson and Holling, 2002). Resilience is defined as the capacity of a system to absorb impacts and reorganize in the face of change, while maintaining its functionality (Holling, 1996; Walker et al., 2004).
In the socioeconomic context, resilience is key to explaining the internal effects of complex systems and to coping with adversities such as the COVID-19 pandemic, which profoundly transformed human activities in sectors such as education, politics, and the economy (Becken, 2013). In particular, the global health crisis underscored the importance of strengthening financial resilience (FR), understood as the ability of individuals to withstand and recover from economic shocks. This dimension is closely related to overall well-being, which connects directly with Sustainable Development Goal (SDG) 3: Good Health and Well-being (OECD, 2021). Furthermore, the drive toward financial inclusion, enhanced by the use of digital technologies, is a fundamental aspect of promoting effective financial education, which enables individuals to manage their resources responsibly. This need links financial resilience to SDG 4: Quality Education, by emphasizing the importance of inclusive and equitable education that prepares people to face economic challenges (Hamid et al., 2023; Flores et al., 2024). Furthermore, financial resilience is also related to SDG 8: Decent Work and Economic Growth, as it strengthens individuals’ ability to maintain stable and productive employment and contribute to sustainable economic growth (Yadav and Shaikh, 2023). Data from the World Bank (2022) reveal that, although more than 1.2 billion adults accessed financial services between 2011 and 2017, approximately 1.7 billion remain excluded, primarily women in rural areas, highlighting the urgency of inclusive policies.
Recent research has demonstrated the importance of psychological and economic factors in financial resilience. For example, Kulshreshtha et al. (2023) show that financial and psychological resilience mediate the negative relationship between income shocks and financial well-being. Likewise, Mundi and Vashisht (2023) highlight that single mothers show higher levels of financial resilience, associated with their cognitive abilities. At the institutional level, the creation of the National Financial Resilience Index in the United States exemplifies the growing interest in measuring this variable to design effective public policies (Yao and Zhang, 2023).
In this context, this study focuses on characterizing financial resilience through the perceptions, experiences, and actions of university students, a key population for understanding how these capacities develop in a young, potentially vulnerable group. This research contributes to the global goals of improving overall health and well-being (SDG 3), ensuring quality education (SDG 4), and promoting economic growth with decent work (SDG 8), in line with the 2030 Agenda for Sustainable Development.
Financial resilience
Financial resilience has been conceptualized as the ability to withstand adverse financial situations. In other words, it could be understood as the capacity to face financial crises across contexts ranging from the global to the specific, whether at the individual, familial, or any other level at which people find themselves (BBVA, 2020). It is important to understand that while an individual’s capacity to confront certain economic events is crucial, financial inclusion must also be considered. Salignac et al. (2019) point out that financial inclusion constitutes an important element for those included. Yet, criticism of this concept focuses on its practical aspects, overlooking its effects and roles in adverse situations. In line with this idea, Hamid et al. (2023) propose a framework for measuring financial resilience and its relationship with sociodemographic variables, financial inclusion, financial literacy, and economic resources (Figure 1).
Financial resilience is directly related to financial inclusion, as implementing certain actions to reverse some adverse economic situations is the moment when inclusion occurs. Hence, financial inclusion has become a policy priority for many countries. For example, Finland, Denmark, Sweden, and the Netherlands have introduced the right to a bank account for all; Belgium for the unbanked population; and France for those who have been denied a bank account (Gómez-Barroso and Marban-Flores, 2013). While financial inclusion is an important concept, it has been criticized for focusing on the delivery and practical aspects of financial products and services, ignoring the iterative effects and roles played by different actors to enable individuals to function effectively in adverse financial situations, the latter in relation to financial resilience (Salignac et al., 2016).
In summary, not everything has stemmed from the pandemic; it can also be triggered by job loss and health issues, among other factors, all of which can affect a family’s economy. However, there are ways to minimize the impact of these setbacks on financial health: saving, controlling debt, having an emergency fund, and good financial education (Flores et al., 2024). Therefore, household financial resilience, according to McKnight and Rucci (2020), is a dynamic concept referring to how households can quickly recover from financial crises. These crises are tackled through savings, loans from financial institutions or family and friends. Thus, financial resilience is the ability to adapt or persevere through predictable or unpredictable financial decisions, difficulties, or life impacts. Financial resilience enables individuals to recover from negative financial events.
Regarding financial resilience, interesting findings have been reported, such as the work of Salignac et al. (2019), who conducted a study in Australia, estimating that over two million adults showed high levels of financial vulnerability in 2015. The authors also identified that while respondents show good management of financial products and services, they have low levels of financial knowledge and behavior. Moreover, high levels in the financial products and services component indicate low dissatisfaction with basic financial products such as bank accounts, credit, and insurance. On the other hand, findings suggest that having employment does not necessarily lead to financial resilience, as part-time jobs and similar incomes are insufficient to cover people’s needs.
Similarly, financial resilience has been linked to life satisfaction or well-being, once again utilizing the moderating role of non-impulsive behavior and financial satisfaction (Tahir et al., 2022). This study demonstrated complete mediation between financial resilience and life satisfaction through financial well-being. Financial resilience and non-impulsive behavior have a positive influence on financial satisfaction, which undoubtedly relates to life satisfaction.
People with high levels of financial vulnerability face greater difficulties in obtaining funds in an emergency, limited access to financial services, poor financial knowledge and behavior, increased reliance on marginal and informal products, and social isolation (Salignac et al., 2019). This is where the role of financial education plays an important role in strengthening financial resilience, especially in middle-aged individuals; conversely, in older individuals (>65), resilience tends to decrease (Bialowolski et al., 2022). Achieving financial resilience requires the development of various programs. These programs need to reduce costs and increase insurance coverage, innovate credit mechanisms to invest in risk-mitigating technology, implement behavioral design to strengthen savings (such as self-insurance or investment), and utilize digital tools to facilitate government and social responses to crises (IPA, 2019) 1.
Principio del formulario
In addition to examining financial resilience in individuals and households, there is literature that has studied the effectiveness of innovation and financial resilience, now specifically in businesses, particularly in financial institutions. In one study, they combine the characteristics of the company, innovation, and financial resilience in financial institutions, significantly enhancing the survival prospects of such institutions (Nkundabanyanga et al., 2020). In another study related to financial institutions, the authors examine the mediating role of financial capability (FC), financial literacy (FL), and financial well-being (FW), to determine if future non-impulsive behavior moderates these associations. Again, the findings provide information regarding financial services, where there is limited literature explaining this phenomenon. Financial planners help improve consumer behavior in financial matters (Tahir et al., 2021).
Hussain et al. (2019) conducted research in Bangladesh and found that people with financial accounts had greater resilience than those without accounts. A significant relationship was established between gender and financial resilience, where men showed higher resilience. Additionally, the findings confirm the positive impact of education on financial knowledge regarding the need for financial sustainability. It was recommended to establish policies to achieve financial inclusion in rural areas, low-income individuals, women who are the primary breadwinners of households, and people with low levels of education. Financial fragility also appeared with greater impact among specific groups such as African Americans and low-income households (Lusardi et al., 2021).
Later, Ahrens and Ferry (2020), who analyzed the financial resilience of the government of England in the face of the Covid-19 pandemic, conducted another study. Their findings indicate that institutional capacity to absorb the shock of events like Covid-19 and adapt services was diminished during austerity in local governments. Hence, any model of financial resilience should consider absorption and adaptation during crises. Funds distributed to local governments are not subject to a framework considering need, deprivation, financial reserves of the authority, and local demographics, among other factors.
In this idea, McKnight and Rucci (2020) conducted a study involving 22 countries, analyzing data from each to differentiate variables and indicators of financial resilience. It was found that there are variations in financial resilience indicators among countries, possibly due to differences in financial institutions, social assistance, and cultural norms. The study classified countries according to four indicators: financially insecure (having savings of less than three months’ income), financially secure (having six months’ income saved), overindebted (having debts equal to or greater than three months’ income), severely indebted (having debts greater than six months’ income). In 15 out of 22 countries, it was found that fewer than half of households had sufficient savings to cover three months’ required income, and many not only lacked savings but were also in debt.
On the other hand, women heading households are more financially insecure in the majority of the 22 countries, except for Estonia, Slovenia, and Slovakia. Households with a lower-educated head are more financially insecure. Regarding housing, homeowners are less financially insecure. However, except for Canada, Greece, and Malta, homeowners with mortgages are less financially secure than renters. Regarding the labor market, retirees and self-employed workers tend to have greater financial security. Overall, individuals with higher incomes have less financial insecurity, but there is no linear relationship in the countries under study (McKnight and Rucci, 2020).
Recently, Kass-Hanna et al., (2021) conducted a study in countries in South Asia and Africa, which focused on investigating the relationship between digital and financial literacy, as well as behavior in financial resilience, including saving, borrowing, and risk management. Findings indicate that both digital and financial literacy are key factors in building inclusivity and financial resilience. It is also emphasized that financial literacy should be redefined to include digital literacy, thereby enhancing long-term financial resilience in households.
In summary, financial resilience has been analyzed with increased interest following the recent pandemic crisis (Yadav and Shaikh, 2023). The variables contributing to understanding this phenomenon relate to financial well-being, with financial and psychological resilience as mediating variables (Kulshreshtha et al., 2023). Additionally, financial resilience has been studied to comprehend how consumers in emerging markets perceive the present and future, and its relationship with public policies (Yadav and Shaikh, 2023). Similarly, financial resilience has been evaluated based on cognitive capacities with demographic control variables such as age, gender, education, and employment status, with results demonstrating influence on financial resilience in single fathers but not in single mothers, as the latter exhibit higher levels of financial resilience, along with cognitive capacities (Mundi and Vashisht, 2023). It is evident that financial resilience has become a concern for policymakers worldwide (Klapper and Lusardi, 2019; Bialowolski et al., 2022; Erdem and Rojahn, 2022; Yadav and Shaikh, 2023).
Financial Resilience and its alignment with the SDGs
Financial resilience is a topic that has increasingly captured the attention of scholars, as it has a direct impact on general well-being, inclusive education, and sustainable economic development. Several studies have been conducted in the literature that analyze everything from financial knowledge and behavior to individual skills. This study provides evidence on how university students view financial resilience, based on their perceptions, experiences, and the actions they have taken to address difficult financial situations in recent times. Thus, it contributes to SDG 3, promoting economic and psychological well-being; to SDG 4, strengthening financial education as an essential element of quality education; and to SDG 8, facilitating the development of skills for decent work and inclusive and sustainable economic growth.
Goal 3, which focuses on health and well-being, aims to ensure that everyone, regardless of age, can lead healthy lives and enjoy comprehensive well-being. This is a challenge that encompasses both physical and psychosocial aspects. Financial resilience is fundamental to this SDG, as economic well-being is closely linked to people’s emotional and psychological stability. According to the World Health Organization (World Health Organization, 2020), financial stress and economic insecurity are factors that can negatively affect mental and physical health, creating a vicious cycle that makes it difficult to adapt to difficult situations. This study aligns with SDG 3 by examining how university students manage their financial resilience in the face of economic crises, which has a direct impact on their overall well-being. The ability to cope with economic challenges not only improves financial health but also strengthens emotional and physical health, contributing to a more balanced and healthy life (OECD, 2021).
Goal 4, on quality education, seeks to ensure that everyone has access to inclusive, equitable, and high-quality education and promotes lifelong learning opportunities. Financial education plays a crucial role in this goal, empowering people to make informed economic decisions, manage their resources effectively, and successfully confront economic challenges. Without adequate financial education, opportunities for personal and professional growth are limited, which can lead to social and economic exclusion (United Nations, 2015). This study focuses on how financial education affects the resilience of university students, helping them cope with economic crises. By analyzing students’ perceptions, experiences, and actions in the face of financial hardship, it becomes clear how financial education impacts their ability to adapt and thrive in times of economic uncertainty. Thus, this study aligns perfectly with SDG 4, underscoring the importance of a comprehensive education that includes both academic knowledge and financial skills (OECD, 2021).
Goal 8 seeks to foster sustained, inclusive, and sustainable economic growth, as well as ensuring full and productive employment and decent work for all. Financial resilience plays a fundamental role in this goal, as people who have a greater ability to adapt to economic crises are more likely to remain in the labor market and contribute to economic growth. The analysis of financial resilience among university students is closely related to SDG 8, given that young people are a group vulnerable to economic and social changes. Students’ ability to manage their personal finances, make informed decisions, and adapt to constantly changing work environments translates into better professional performance and, therefore, a greater contribution to the economic growth of their communities and countries (United Nations, 2015). By focusing the analysis on university students, this study aligns with SDG 8 by strengthening the skills necessary for decent work and creating an inclusive and sustainable economic environment through financial education.
Therefore, this study focuses on how university students view and manage economic crises through financial resilience. Emphasis is placed on their perceptions, lived experiences, and the actions they take to address these situations. In this sense, it relates to SDG 3 (Good Health and Well-being), SDG 4 (Quality Education), and SDG 8 (Decent Work and Economic Growth). It provides empirical evidence showing how financial resilience not only helps maintain stability but also helps to achieve a sustainable future.
2. Method and Materials
Study: Non-experimental study applying the hypothetic-deductive method, a cross-sectional design. Descriptive, exploratory, correlational, and confirmatory. Population: The participants were students pursuing their university studies in both public and private schools. Sample: Through non-probabilistic self-determination sampling, the participation of 256 students was achieved. Test: The instrument utilized for fieldwork was that developed by Flores et al. (2024), which derives from the financial health indicators proposed by the Center for Education and Financial Capabilities of BBVA in alignment with the Center for Financial Services Innovation (CFSI). Statistical procedure: To validate the reliability and consistency of the scale, Cronbach’s alpha and McDonald’s Omega are utilized, with the criterion of α > .7 (acceptable) based on the following equations:
|
Where: α= AC; K= No. items; Vi= Variance of e/item and Vt= total variance. |
Where: ω: is the omega coefficient symbol; ʎi , is the standardize factorial load of i. |
The omega coefficient, unlike the alpha coefficient, works with factorial loadings (Gerbing and Anderson, 1988), which are the weighted sum of standardized variables, making calculations more stable (Timmerman, 2005), and reflecting the true level of reliability. Secondly, it does not depend on the number of items as seen in its mathematical expression (McDonald, 1999).
Regarding the normality of the data, the criterion of skewness (< 2) and kurtosis (<7) is followed. For this purpose, the Fisher skewness coefficient is used, and according to the criteria of Kim (2013) described in Table 1:
Where: The greater the sum of ∑(xi–x)3, the greater the skewness will be.
If the data matrix does not have normality, it is recommended to use polychoric correlation matrices, if the skewness and kurtosis exceed the values suggested by the theory (Kim, 2013; Muthén and Kaplan, 1985; Richaud, 2005; Ogasawara, 2011; Timmerman and Lorenzo-Seva, 2011). Subsequently, the factorial solution obtained from exploratory factor analysis is confirmed using SEM methodology (García-Santillán et al., 2024), where the fit of the measurement model, structural fit, and parsimony are validated (Ho, 2006; Schreiber et al., 2006; Hooper et al., 2008; Hair et al., 1999).
In order to evaluate the data matrix, SPSS AMOS v23 software is used. The indices are: χ² (chi-square), Goodness of Fit Index (GFI), Adjusted Goodness of Fit Index (AGFI), Root Mean Square Error of Approximation (RMSEA), Root Mean Square Residuals (RMR) Tuker Lewis Index (TLI) and the Comparative Fit Index (CFI), through which the estimated model is compared with the null model that indicates the independence between the study variables.
3. Results
The analysis of the data matrix is as follows: firstly, the scale is validated using Cronbach’s alpha and McDonald’s omega to verify the reliability and internal consistency of the test items. The Cronbach’s alpha values are 0.804 overall, and for individual items, if any item is deleted, all values are greater than 0.8. In relation to McDonald’s omega coefficient, all items exceed the threshold of 0.8 (see Table 2). The annexes show tables that describe the Cronbach’s alpha values and the individual omega coefficients per item.
Table 3 shows the frequencies of indicators from the sociodemographic profile of the respondents. The highest participation percentage were women with 52.3% (n=134), followed by 43.8% (n=112) of men, with an age range between 18 to 20 years 46.1% (n=118), followed by 32.4% (n=83) aged 21 to 25 years. Regarding marital status, 85.2% (n=218) are single. 64.1% (n=164) are enrolled in public universities, and 35.9% (n=92) in private universities. Concerning the influence on their financial knowledge, 31.3% (n=80) stated it was their father, followed by 29.3% (n=75) who mentioned it was their mother, and 20.3% (n=52) reported that nobody influenced them. The status indicates that 68.8% (n=176) only study, followed by 25% (n=64) only work. Regarding seniority at work, 66% (n=169) do not work, and among those who work, 10.5% (n=27) have been working less than 1 year, 10.9% (n=28) more than 1 year but less than 3 years, and 3.5% (n=9) between 3 and 5 years. Among those employed, the highest percentage earns less than $3,000.00 USD monthly (9.8%, n=25), while for 58.2% (n=149), the question does not apply because they are not working.
Table 4 shows the total explained variance, which is composed of five factors that explain 56.89% of the total variance of the phenomenon under study, and in Table 5, the rotated factor matrix in its hierarchical structure is presented.
As seen in the rotated factor matrix, the 5-factor structure obtained differs from the three-dimensional model proposed by Flores et al., (2024).
SEM methodology for the analysis of the 5-factor structure
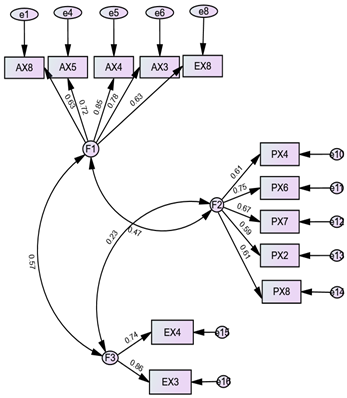
To confirm the factor solution described in Table 5, the SEM methodology is used and the measurement error model is designed to evaluate the unobserved latent variables that are incorporated (Cea, 2002). In addition, the dependency relationships between the obtained factors are verified. Diagram 1 shows the initial measurement model. In parallel, a model based on the proposal by Flores et al., (2024) is shown and compared with the rotated solution.
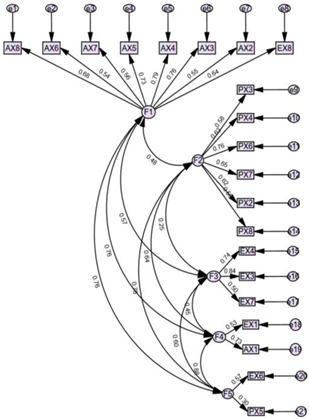 Diagramm 1. Factorial solutionChi-square = 420.027; Degrees of freedom = 179; Probability level = .000 Diagramm 1. Factorial solutionChi-square = 420.027; Degrees of freedom = 179; Probability level = .000 |
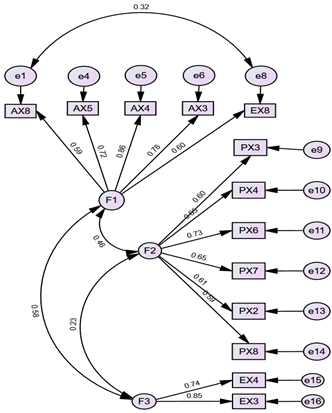
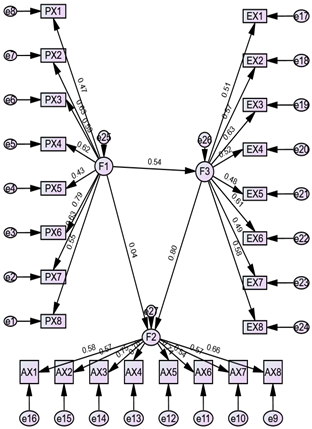 Applying the tridimensional model, we have the next representation (Flores et al., 2024) Applying the tridimensional model, we have the next representation (Flores et al., 2024) Chi-square = 659.114; Degrees of freedom = 249; Probability level = .000 |
| Diagram 1. Factorial solution | |
The values obtained from the maximum likelihood ratio show a probability level (0.000), which is less than 0.05, and Chi-square value of 420.027 with 179 degrees of freedom. On the other hand, the three-dimensional model by Flores et al. (2024) shows Chi-square values of 659.114 with 259 degrees of freedom and a probability of 0.000, which also does not allow its confirmation. Regarding the rotated solution with the Varimax criterion, the goodness-of-fit indices, structural fit, and parsimony do not align with theoretical criteria. Therefore, indicators AX6, AX7, AX2, PX1, EX2, EX6, PX5 are excluded from the analysis, because they do not show high factorial loadings (>0.5).
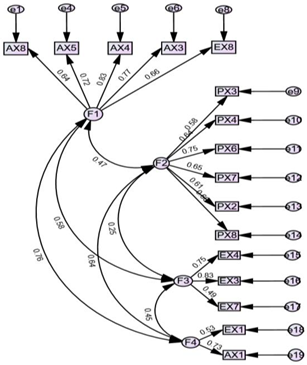
Diagrams 2, 3, 4, and 5 show adjustments to improve the model according to theoretical criteria.
 |
 |
|
Diagram 2. Adjustment to the factorial solution Chi-square = 180.186, degrees of freedom = 98, Probability level = .000 |
Diagram 3. Chi-square = 209.047, degrees of freedom = 74, Probability level = .000 |
&
 |
 |
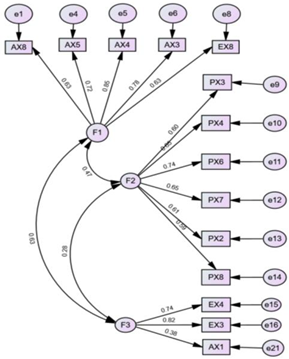
| Diagram 4. Chi-square = 96.456, degrees of freedom = 51, Probability level = .000 | Diagram 5. Adjusted final model of perception, lived experiences and financial resilience. Chi-square = 91.617, degrees of freedom = 61, Probability level = .07 |
After model adjustments, diagram 5 shows the final model with the best indices, while Table 6 shows the models obtained.
4. Discussion
As we can see, the summary of the models with SEM shows a three-factor model with better fit. In relation to the number of factors, it agrees with the model proposed by Flores et al. (2024), however, the indices of goodness of fit, structural adjustment and parsimony of the final measurement model, exclude indicators that did not provide significant factor weights. This result constitutes a finding that adds to the state of the art. The behavior of the respondents perceives the financial health indicators of the scale used differently. Furthermore, the experiences lived and the actions they took in the face of an adverse financial situation are different from the population studied by Flores et al. (2024), which undoubtedly contributes to the empirical evidence on the topic. The eight indicators of financial well-being are related to savings, spending, credit history, debt payment and financial health insurance proposed by the Center for Education and Financial Capabilities of BBVA and the Center for Financial Services Innovation (CFSI) (BBVA, 2020).
In relation to factor 1, about actions carried out
In this eight-item factor, the actions taken by participants in response to certain financial crisis are measured. The topics include saving, spending, credit history, debt repayment, and insurance. The results indicate that only five of the eight items showed significant factorial weights. This allows us to understand that the participants in the study implemented a strategy to plan their expenses in the present and in the short term (ax8). Additionally, they have defined a strategy that enables them to sustainably manage their debts and pay them when required (ax5). To do this, they adopted some measures that allowed them to have enough savings and long-term assets to face the crisis they experienced (ax4), all of this derived from the plan they implemented to increase their savings in liquid financial products, with due anticipation (ax3). These actions allowed them to face the adverse financial situation they experienced regarding their expenses, which caused them to plan the expenses they will have in the short term and in the immediate future (ex8).
Factor 2, perception toward financial health indicators
This factor collects the opinion of the participants in six of the eight indicators of financial well-being. On the other hand, they say that it is advisable to have enough savings in liquid financial products (px3), in addition to having enough savings or long-term assets (px4). Additionally, they have a healthy credit history (px6) since they consider it important to have insurance appropriate to their needs (px7). Likewise, they agree that invoices must be paid on time and in full (px2), which is why it is important to plan expenses for the future (px8).
Factor 3 on lived experiences in relation to financial health indicators
Respondents indicate that they carried out actions to have sufficient savings or assets for the long term prior to the adverse financial situation, they experienced (ex4). Furthermore, this led them to implement a plan to increase their savings in liquid financial products (ex3). These actions seem to be limited to savings, whereas it would be convenient to strengthen other areas of personal finances such as insurance, credit history, budget control for proper management of personal finances. This result is not in concordance with the proposal of Flores et al. (2024), concerning the necessary and sufficient resources to face adverse situations. This result partially coincides with the proposal of Hamid et al. (2023), based on the conceptualization they make of the variables that are directly related to financial resilience, in this specific case, that of economic resources to face crises.
The result differs from the model proposed by Flores et al., (2024). For the perception factor, only six of the eight indicators of financial well-being, were validated. The factors of experiences lived in a financial crisis validated two of the eight indicators and finally for the actions they carried out to face the adverse financial situation, only four of the eight indicators. The variability in the results could indicate how complex it is to evaluate individuals; however, this is due to other factors that could be related to the models used, the control variables, and the cultural and social traits of the people who participate in the study, just to name a few.
5. Conclusion
The study uses structural equation models to understand the financial well-being of the population. A three-factor model that aligns with a previous proposal is identified. However, the validation process excludes indicators that do not contribute significantly; hence, it is pertinent to think that the perception of financial health differs between individuals. Actions taken in the face of financial crises focus on expense planning, debt management and long-term savings. Positive perception towards financial health includes aspects such as liquid savings, credit history and adequate insurance. The experiences lived are mainly related to savings, but the need to strengthen other financial areas is suggested. These findings contrast with previous proposals and show the complexity of evaluating financial well-being due to various factors such as control variables and cultural differences.
Theoretical and Practical Implications
The theoretical and practical implications of financial resilience are truly important and encompass many aspects. Individual financial resilience has a significant theoretical impact in areas such as psychology, behavioral economics, and financial planning. These implications help us better understand how financial experiences influence people’s behavior, well-being, and development over time. Based on the findings of this study, some of these implications are presented, which are aligned with the Sustainable Development Goals (SDGs), especially SDG 3 (Good Health and Well-being), SDG 4 (Quality Education), and SDG 8 (Decent Work and Economic Growth).
Theoretical Implications
Human Capital Theory highlights how people’s knowledge, skills, and resources influence their ability to generate income and manage their finances. This directly connects to SDG 4 (Quality Education). This theory emphasizes the need for sound financial education that empowers people to make informed decisions about their economic well-being. Promoting comprehensive financial education in universities and other educational settings, especially among young people, not only strengthens their human capital but also helps them face economic challenges. This contributes to SDG 4, ensuring inclusive, equitable, and quality education for all. Financial Life Cycle Theory, meanwhile, shows us the different stages of a person’s economic life, from youth to retirement. This theory highlights how financial resilience allows people to adapt to changes in their income and needs over time. Furthermore, it is closely related to SDG 3 (Good Health and Well-being), as good financial management throughout life helps maintain economic stability and reduce the stress caused by financial insecurity. By fostering people’s ability to adapt and manage their resources effectively, financial resilience contributes to a healthier life, both physically and emotionally. Finally, Behavioral Financial Theory delves into how psychological and emotional factors affect our financial decisions and is closely related to SDG 8, which focuses on decent work and economic growth. Making well-informed and rational financial decisions can help people become more resilient in times of economic crisis, which not only supports their job stability but also contributes to a more inclusive economic environment. Fostering an understanding of these factors can open the door to decent work and ensure sustainable economic growth, empowering people to make financial decisions that benefit both their professional and personal development.
Practical Implications
Risk management and SDG 3 (Good Health and Well-being) are key issues that go hand in hand. Strategies such as insurance, emergency savings, and income diversification are essential to strengthening the financial resilience of individuals and their families. These practices not only offer a safety net in the face of economic crises, but are also closely related to SDG 3. Good financial management can reduce the stress and anxiety that arise from unexpected situations, which in turn promotes better emotional and physical health. Thus, by fostering financial resilience through risk management, we are contributing to creating healthier and stronger communities. Long-term financial planning is key to strengthening our economic resilience. Setting financial goals, creating realistic budgets, saving for the future, and diversifying investments are strategies that help individuals and families ensure their economic stability. This relates to SDG 8 (Decent Work and Economic Growth), as it enables people to access resources to start or obtain decent jobs, thus encouraging their active participation in economic growth. Furthermore, good financial planning promotes self-reliance and economic security, which is essential for a sustainable work environment.
Financial education is a fundamental tool for strengthening our economic resilience. By equipping people with the knowledge and skills needed to make informed decisions about their finances, SDG 4 (Quality Education) is supported. Good financial education enables individuals to better manage their resources, maximize their savings, and make wise choices about investments and retirement planning. Promote financial education at all levels.
Ethics statement.
This study was conducted in accordance with the Code of Ethics of Universidad Cristóbal Colón. The research protocol was approved by the Ethics Committee of the Division of Graduate Studies and Research, in compliance with the Declaration of Helsinki and alignment with the Sustainable Development Goals (SDGs) established in the United Nations 2030 Agenda for Sustainable Development. All students provided their informed consent to participate in the study.
Conflicts of interest.
The authors declare no conflict of interest.
Funding.
This research received no external funding.
Authors’ contributions
Author 1 was responsible for conceptualization, methodology, and formal analysis.
Author 2 was responsible for writing, revising, and editing the manuscript.
Author 3 was responsible for project administration, supervision, and validation.
Author 4 was responsible for data collection and curation.
Appendix 1.
Item – total Statistics
Cronbach’s Alpha
| Items | Scale Mean if Item Deleted | Scale Variance if Item Deleted | Corrected ítem-total correlation | Cronbach’s Alpha if item deleted |
| PX1 | 104.7305 | 161.092 | .310 | .798 |
| PX2 | 104.3438 | 159.803 | .485 | .792 |
| PX3 | 104.9297 | 162.042 | .415 | .795 |
| PX4 | 104.6563 | 161.866 | .406 | .795 |
| PX5 | 105.2148 | 164.342 | .302 | .799 |
| PX6 | 104.2617 | 160.272 | .532 | .792 |
| PX7 | 104.4883 | 160.698 | .508 | .792 |
| PX8 | 104.2969 | 162.704 | .435 | .795 |
| EX1 | 105.0273 | 159.376 | .436 | .793 |
| EX2 | 104.7461 | 158.865 | .520 | .791 |
| EX3 | 105.7305 | 160.480 | .447 | .793 |
| EX4 | 105.8008 | 162.717 | .336 | .797 |
| EX5 | 105.3203 | 159.999 | .428 | .794 |
| EX6 | 105.0039 | 157.141 | .532 | .789 |
| EX7 | 105.5586 | 160.028 | .379 | .795 |
| EX8 | 104.9961 | 158.945 | .516 | .791 |
| AX1 | 104.8398 | 158.566 | .554 | .790 |
| AX2 | 104.8594 | 159.557 | .529 | .791 |
| AX3 | 105.1758 | 158.106 | .555 | .790 |
| AX4 | 105.0977 | 158.073 | .584 | .789 |
| AX5 | 105.0352 | 158.787 | .585 | .790 |
| AX6 | 105.3164 | 160.994 | .438 | .794 |
| AX7 | 105.4375 | 161.620 | .435 | .794 |
| AX8 | 105.0195 | 160.576 | .487 | .793 |
Appendix 2.
Item – total Statistics
(McDonald omega)
| Items | Scale Mean if Item Deleted | Scale Variance if Item Deleted | Corrected item-total correlation | Multiple correlation square | Cronbach’s Alpha if item deleted | McDonald’s Omega if item deleted | |
| PX1 | 83.2188 | 146.893 | .304 | .297 | .892 | .887 | |
| PX2 | 82.8320 | 145.795 | .472 | .387 | .886 | .881 | |
| PX3 | 83.4180 | 147.844 | .406 | .423 | .888 | .883 | |
| PX4 | 83.1445 | 147.097 | .423 | .409 | .888 | .882 | |
| PX5 | 83.7031 | 150.657 | .265 | .310 | .891 | .886 | |
| PX6 | 82.7500 | 145.765 | .542 | .568 | .885 | .880 | |
| PX7 | 82.9766 | 146.211 | .515 | .412 | .886 | .880 | |
| PX8 | 82.7852 | 147.950 | .452 | .367 | .887 | .881 | |
| EX1 | 83.5156 | 144.345 | .465 | .326 | .887 | .880 | |
| EX2 | 83.2344 | 144.063 | .544 | .411 | .885 | .878 | |
| EX3 | 84.2188 | 145.387 | .480 | .534 | .886 | .881 | |
| EX4 | 84.2891 | 147.414 | .372 | .470 | .889 | .884 | |
| EX5 | 83.8086 | 146.030 | .413 | .366 | .888 | .882 | |
| EX6 | 83.4922 | 142.651 | .545 | .396 | .884 | .878 | |
| EX7 | 84.0469 | 145.182 | .398 | .339 | .889 | .883 | |
| EX8 | 83.4844 | 143.812 | .555 | .516 | .884 | .878 | |
| AX1 | 83.3281 | 143.578 | .588 | .458 | .884 | .877 | |
| AX2 | 83.3477 | 145.569 | .514 | .412 | .885 | .879 | |
| AX3 | 83.6641 | 143.204 | .585 | .568 | .884 | .877 | |
| AX4 | 83.5859 | 143.020 | .623 | .618 | .883 | .877 | |
| AX5 | 83.5234 | 143.866 | .618 | .529 | .883 | .877 | |
| AX6 | 83.8047 | 145.993 | .466 | .416 | .887 | .881 | |
| AX7 | 83.9258 | 146.853 | .453 | .470 | .887 | .881 | |
| AX8 | 83.5078 | 145.082 | .541 | .501 | .885 | .879 |
Appendix 3.
Financial resilience scale
Part 1: perception toward financial health indicators
| Items |
| P1.- Do you think that you should spend less than what you earn? |
| P2.- Do invoice have to be paid on time and in full? |
| P3.- Is it convenient to have enough savings in liquid financial products? |
| P4.- Have enough savings or long-term assets? |
| P5.- Have a sustainable level of debt? |
| P6.- Have a healthy credit history? |
| P7.- Have adequate insurance? |
| P8.- Plan expenses for the future? |
Part 2: Lived experience towards financial health indicators
| Items |
| Lex1.- Personally, have you experienced a situation where you spend less than you earn? |
| Lex 2.- If you had outstanding payments, did you pay the bills on time and in full? |
| Lex 3.- Do you have enough savings in liquid financial products? |
| Lex4.- Do you have enough savings or long-term assets? |
| Lex5.- Currently, do you have a sustainable level of debt? |
| Lex6.- Today, do you have a healthy credit history? |
| Lex7.- Do you currently have adequate insurance in force? |
| Lex8.- In your personal life, do you plan the expenses that you will have in the immediate future and in the short term? |
Part 3: During or after the some adverse financial situation
| Items |
| Fr1.- Personally, did you take any actions to spend less than you earn? |
| Fr2.- In the event of having had pending payments, and not having paid on time: did you take any action to resolve the payment of your invoices on time and in full? |
| Fr3.- If so, did you implement any plan to increase your savings in liquid financial products? |
| Fr4.- Did you take any action to have enough savings or long-term assets? |
| Fr5.- Have you defined any strategy to maintain your debts in a sustainable manner and that you can pay when due? |
| Fr6.- If you did not have a healthy credit history, did you carry out any plan? |
| Fr7.- In case of not having adequate insurance, or having some, did you implement any plan to modify this scheme? |
| Fr8.- In case of not doing it in your personal life, did you implement a strategy to plan the expenses that you will have in the immediate future and in the short term? |
| 1 | Innovations for Poverty Action (IPA) is a non-profit organization dedicated to research and policy design, sharing evidence with decision-makers to significantly reduce poverty. With a presence in 22 countries across Africa, Asia, and Latin America, IPA leads the field of development in quality, innovation, and cutting-edge research impact. For more information, you can visit the website: https://www.poverty-action.org/about Principio del formulario. |
References
- Ahrens, T. and Ferry, L. (2020), “Financial resilience of English local government in the aftermath of COVID-19”, Journal of Public Budgeting, Accounting and Financial Management, Vol. 32 No. 5, pp. 813-823. [CrossRef]
- BBVA (2020), Salud financiera: ocho indicadores para medirla [Financial health: eight indicators to measure]. https://www.bbva.com/es/salud-financiera/saludfinanciera-ocho-indicadores-medirla/. [In Spanish].
- Becken, S. (2013), “Developing a framework for assessing resilience of tourism sub-systems to climatic factors”, Annals of Tourism Research, Vol.43, pp. 506-528. [CrossRef]
- Bialowolski, P., Cwynar, A. and Weziak-Bialowolska, D. (2022), “The role of financial literacy for financial resilience in middle-age and older adulthood”, International Journal of Bank Marketing, Vol. 40 No. 7, pp. 1718-1748. [CrossRef]
- Kahneman, D. (2011), Thinking fast and slow. Farrar, Straus and Giroux. New York, NY.
- Erdem, D. and Rojahn, J. (2022), “The influence of financial literacy on financial resilience – New evidence from Europe during the COVID-19 crisis”, Managerial Finance, Vol. 48 No. 9/10, pp. 1453-1471. [CrossRef]
- Flores, M., Zamora-Lobato, T. and García-Santillán, A. (2024), “Three-dimensional model of financial resilience in workers: Structural equation modeling and bayesian analysis”, Economics and Sociology, Vol. 17 No. 1, pp. 69-88. [CrossRef]
- García-Santillán A., Venegas-Martínez, F., and Mendoza-Rivera, R. (2024), “Structural equations model to explain financial knowledge on workers”, Revista Mexicana de Economía y Finanzas Nueva Época REMEF, Volume 19 Issue 1, January – March 2024, pp. 1-15, e962 https://doi.org/10.21919/remef.v19i1.962.
- Gerbing, D. W. and Anderson J. C. (1988), “An update paradigm for scale development incorporating unidimensionality and its assessment”, Journal of Marketing Research, Vo 25, No.2, pp. 186-192. [CrossRef]
- Gómez-Barroso, J. L. and Marbán-Flores, R. (2013), “Basic financial services: A new service of general economic interest? Journal of European Social Policy”, Vol. 23, No. 3, pp. 332-339. [CrossRef]
- Gunderson, L. H. (2000), “Ecological resilience. In theory and application”. Annual Review of Ecology and Systematics, Vol. 31, No. 1, pp. 425-439 https://doi.org/10.1146/annurev.ecolsys.31.1.425.
- Gunderson, L. H., and Holling, C. S. (2002), Panarchy: Understanding transformations in human and natural systems. Island Press. Washington, D.C.
- Hair J, Anderson R, Tatham R, Black W. (1999), Análisis multivariante. 5a ed. [Multivariate analysis, 5th ed.] Prentice Hall. Madrid.
- Hamid, F. S., Loke, Y. J., and Chin, P. N. (2023), “Determinants of financial resilience: insights from an emerging economy”, Journal of social and economic development, Vol. 25, pp. 479–499 https://doi.org/10.1007/s40847-023-00239-y.
- Ho, R. (2006), Handbook of univariate and multivariate data analysis and interpretation with SPSS (1st ed.), Chapman and Hall/CRC. Boca Ratón, USA https://doi.org/10.1201/9781420011111.
- Holling, C. S. (1973), “Resilience and stability of ecological systems”, Annual Review of Ecology and Systematics, Vol. 4, No. 1, pp. 1-23. [CrossRef]
- Holling, C. S. (1996), Engineering resilience versus ecological resilience. In P. Schulze (ed.), Engineering within ecological constraints, National Academy Press, Washington D. C. pp. 31-44.
- Hooper, D., Coughlan, J., and Mullen, M. R. (2008), “Structural equation modelling: Guidelines for determining model fit”, The Electronic Journal of Business Research Methods, (Vol 6, No. 1, pp. 53-60. https://academic-publishing.org/index.php/ejbrm/article/view/1224.
- Belayeth Hussain, A. H. M., Endut, N., Das, S., Chowdhury, M. T. A., Haque, N., Sultana, S., and Ahmed, K. J. (2019), “Does financial inclusion increase financial resilience? Evidence from Bangladesh”, Development in Practice, Vol. 29, No. 6, pp. 798–807. [CrossRef]
- Kass-Hanna, J., Lyons, A. C., and Xi, F. L. (2021), Building financial resilience through financial and digital literacy in South Asia and Sub-Saharan Africa. SSRN, 1-43. [CrossRef]
- Kim HY. (2013), “Statistical notes for clinical researchers: assessing normal distribution (2) using skewness and kurtosis”. Restor Dent Endod. Vol. 38, No. 1, pp. 52-54. [CrossRef]
- Klapper, L., and Lusardi, A. (2019), “Financial literacy and financial resilience: Evidence from around the world”, Financial Management, Vol. 49, No.3, pp. 589–614. [CrossRef]
- Kulshreshtha, A., Raju, S., Muktineni, S.M. and Chatterjee, D. (2023), “Income shock and financial well-being in the COVID-19 pandemic: financial resilience and psychological resilience as mediators”, International Journal of Bank Marketing, Vol. 41 No. 5, pp. 1037-1058. [CrossRef]
- Lusardi, A., Hasler, A. and Yakoboski, P.J. (2021), “Building up financial literacy and financial resilience”, Mind and Society Vol. 20, pp. 181–187 https://doi.org/10.1007/s11299-020-00246-0.
- McDonald, R. P. (1999), Test theory: A unified treatment. Lawrence Erlbaum Associates, Inc. Mahwah, N.J.
- McKnight, A., and Rucci, M. (2020), “The financial resilience of households: 22 country study with new estimates breakdowns by household characteristics and a review of policy options”. Centre for Analysis of Social Exclusion London School of Economics. http://eprints.lse.ac.uk/id/eprint/121525.
- Mundi, H.S. and Vashisht, S. (2023), “Cognitive abilities and financial resilience: evidence from an emerging market”, International Journal of Bank Marketing, Vol. 41 No. 5, pp. 1010-1036. [CrossRef]
- Muthén, B., and Kaplan D. (1985), “A comparison of some methodologies for the factor analysis of non-normal Likert variables”, British Journal of Mathematical and Statistical Psychology, Vol. 38, pp. 171-189. [CrossRef]
- Nkundabanyanga, S.K., Mugumya, E., Nalukenge, I., Muhwezi, M. and Najjemba, G.M. (2020), “Firm characteristics, innovation, financial resilience and survival of financial institutions”, Journal of Accounting in Emerging Economies, Vol. 10 No. 1, pp. 48-73. [CrossRef]
- OECD (2011), Estudios económicos de la OCDE: México 2011. [OECD Economic Surveys: Mexico]. OECD Publishing. [CrossRef]
- OECD. (2021). Financial resilience and its importance for long-term well-being. Organisation for Economic Co-operation and Development. https://www.oecd.org/en/networks/infe.
- Ogasawara, H. (2011), “Asymptotic expansions of the distributions of the polyserial correlations coefficients”. Behaviormetrika, Vol. 38, No. 2, pp. 153-168. [CrossRef]
- Richaud, M. (2005), Desarrollos del análisis factorial para el estudio de ítem dicotómicos y ordinales. [Developments of factor analysis for the study of dichotomous and ordinal items.] Revista Interdisciplinaria, Vol. 22, No. 2, pp. 237-251. http://www.scielo.org.ar/scielo.php?script=sci_isoref&pid=S1668-70272005000200006&lng=es&tlng=pt.
- Salignac, F., Marjolin, A., Reeve, R., and Muir, K. (2019), “Conceptualizing and measuring financial resilience: A multidimensional framework”, Social Indicators Research, Vol. 45, pp. 17-38. [CrossRef]
- Schreiber, J. B., Nora, A., Stage, F. K., Barlow, E. A., and King, J. (2006), “Reporting structural equation modeling and confirmatory factor analysis results: A review”, Journal of Educational Research, Vol. 99, pp. 323-338. [CrossRef]
- Tahir, M.S., Ahmed, A.D. and Richards, D.W. (2021), “Financial literacy and financial well-being of Australian consumers: a moderated mediation model of impulsivity and financial capability”, International Journal of Bank Marketing, Vol. 39 No. 7, pp. 1377-1394. [CrossRef]
- Tahir, M.S., Shahid, A.U. and Richards, D.W. (2022), “The role of impulsivity and financial satisfaction in a moderated mediation model of consumer financial resilience and life satisfaction”, International Journal of Bank Marketing, Vol. 40 No. 4, pp. 773-790. [CrossRef]
- Timmerman, M. (2005), Factor analysis. http://www.ppsw.rug. nl/~metimmer/FAMET.pdf.
- Timmerman, M. E., and Lorenzo-Seva, U. (2011), “Dimensionality assessment of ordered polytomous items with parallel analysis”. Psychological Methods, Vol. 16, pp. 209-220. [CrossRef]
- Tversky, A., and Kahneman, D. (1974), “Judgment under uncertainty: Heuristics and biases”, Science, Vol. 185, pp. 1124-1131. [CrossRef]
- Tversky, A., and Kahneman, D. (1981), “The framing of decisions and the psychology of choice”, Science, Vol. 211, pp. 453-458. [CrossRef]
- United Nations. (2015). Transforming our world: The 2030 agenda for sustainable development. https://sdgs.un.org/2030agenda.
- Walker, B.H, C.S. Holling, S.R. Carpenter, and A. Kinzig. (2004), “Resilience, adaptability and transformability in social–ecological systems”, Ecology and Society Vol. 9, No. 2, p. 5. http://w ww.ecologyandsociety.org/vol9/iss2/art5.
- World Bank (2022), Financial inclusion. https://www.bancomundial.org/es/topic/financialinclusion/overview.
- World Health Organization. (2020). The impact of financial stress on health. https://www.who.int/news-room/feature-stories/detail/the-impact-of-financial-stress-on-health.
- Yadav, P. and Shaikh, I. (2023), “Measuring financial resilience with consumer sentiment data from India”, International Journal of Bank Marketing, Vol. 41 No. 5, pp. 1083-1103. [CrossRef]
- Yao, R. and Zhang, J. (2023), “Employment status and financial resilience during the COVID-19 pandemic”, International Journal of Bank Marketing, Vol. 41 No. 5, pp. 992-1009. [CrossRef]
Figure 1.
Framework to Financial resilience. (Taken from Hamid et al. (2023).
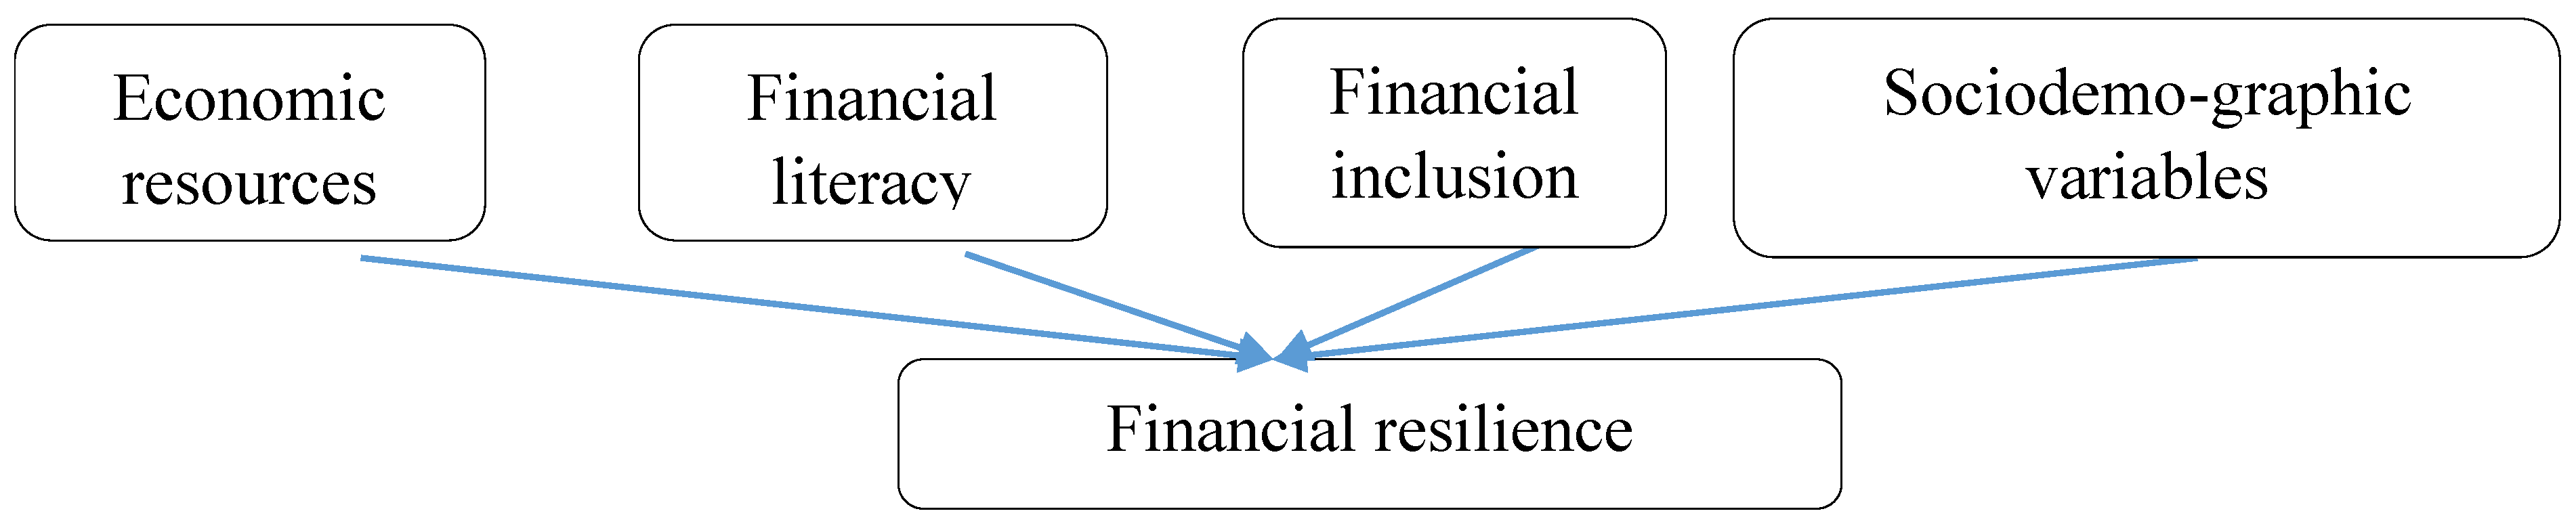

Table 1.
Skewness and kurtosis values criterion.
| Sample | Z | Skewness | Kurtosis | p-value | HO | Distribution |
| small n< 50 | > 1.96 | Ignore | Ignore | 0.05 | Reject | Nonnormal |
| medium 50 < n < 300 | > 3.29 | Ignore | Ignore | 0.05 | Reject | Nonnormal |
| large > 300 | Ignore | > 2 | > 7 | 0.05 | Reject | Nonnormal |
| Do not ignore | < 2 | < 7 | 0.05 | Do not reject | Normal |
Source: Kim (2013)
Table 2.
Reliability and internal consistency of the test, with Cronbach’s alpha and McDonald’s Omega.
Table 2.
Reliability and internal consistency of the test, with Cronbach’s alpha and McDonald’s Omega.
| Case Processing Summary | Cronbach’s Alpha | Omega | |||
| N | % | ||||
| Cases | Valid | 256 | 100.0 | .804 | .885 |
| Excludeda | 0 | .0 | |||
| Total | 256 | 100.0 | |||
| N of elements | 33 | 24 | |||
| a. List deletion is based on all procedural variables. | |||||
Table 3.
Sociodemographic profile of the respondents.
| Gender | n =256 | % |
| Male | 112 | 43.8% |
| Female | 134 | 52.3% |
| LGTBIQ+ | 10 | 3.9% |
| Type University | N | % |
| Public | 164 | 64.1% |
| Private | 92 | 35.9% |
| Age | N | % |
| 18 to 20 | 118 | 46.1% |
| 21 to 25 | 83 | 32.4% |
| 26 to 30 | 27 | 10.5% |
| 30 to 40 | 20 | 7.8% |
| > 40 | 8 | 3.1% |
| Financial knowledge influences | N | % |
| Mother | 75 | 29.3% |
| Father | 80 | 31.3% |
| Siblings | 18 | 7.0% |
| Friends | 31 | 12.1% |
| Nobody | 52 | 20.3% |
| Marital status | N | % |
| Single | 218 | 85.2% |
| Married | 13 | 5.1% |
| Free union | 21 | 8.2% |
| Separated | 1 | 0.4% |
| Divorced | 2 | 0.8% |
| Widowed | 1 | 0.4% |
| Labor status | N | % |
| Only work | 64 | 25.0% |
| Do not work but have finished their studies | 16 | 6.3% |
| Only study | 176 | 68.8% |
| Job seniority | N | % |
| Less than 1 year | 27 | 10.5% |
| >1 to 3 years | 28 | 10.9% |
| >3 to 5 years | 9 | 3.5% |
| >5 to 10 years | 13 | 5.1% |
| > to 10 years | 10 | 3.9% |
| Not applicable | 169 | 66.0% |
| Monthly income | N | % |
| Not applicable | 149 | 58.2% |
| Less than $3,000 | 25 | 9.8% |
| $3,000 to $4,999 | 19 | 7.4% |
| $5,000 to $7,999 | 17 | 6.6% |
| $8,000 to $12,999 | 21 | 8.2% |
| $13,000 to $20,000 | 8 | 3.1% |
| More than $20,000 | 17 | 0.0664063 |
Table 4.
Total explained variance.
| Factor | Sums of loads squared for extraction | Sums of loads squared for rotation | ||||
| Total | % variance | % cumulative | Total | % variance | % cumulative | |
| 1 | 7.193 | 29.973 | 29.973 | 4.017 | 16.737 | 16.737 |
| 2 | 2.528 | 10.531 | 40.504 | 3.369 | 14.037 | 30.774 |
| 3 | 1.526 | 6.360 | 46.864 | 2.488 | 10.367 | 41.141 |
| 4 | 1.251 | 5.213 | 52.077 | 2.160 | 8.998 | 50.140 |
| 5 | 1.155 | 4.814 | 56.890 | 1.620 | 6.751 | 56.890 |
| Extraction method: principal component analysis. | ||||||
Table 5.
Rotated component matrixa.
| Items | F1 | F2 | F3 | F4 | F5 |
| AX8 | .762 | ||||
| AX6 | .687 | ||||
| AX7 | .667 | ||||
| AX5 | .645 | ||||
| AX4 | .631 | ||||
| AX3 | .630 | ||||
| AX2 | .588 | ||||
| EX8 | .567 | ||||
| PX3 | .745 | ||||
| PX4 | .742 | ||||
| PX6 | .717 | ||||
| PX7 | .627 | ||||
| PX2 | .607 | ||||
| PX8 | .532 | ||||
| PX1 | |||||
| EX4 | .817 | ||||
| EX3 | .812 | ||||
| EX7 | .590 | ||||
| EX1 | .638 | ||||
| AX1 | .606 | ||||
| EX2 | |||||
| EX5 | .691 | ||||
| PX5 | .609 | ||||
| EX6 | |||||
| Average Variance Extracted (AVE) | 0.422 | 0.444 | 0.558 | 0.258 | 0.283 |
| Composite Reliability (CR) | 0.853 | 0.825 | 0.788 | 0.410 | 0.440 |
| Extraction method: principal component analysis. Rotation method: Varimax with Kaiser normalizationa. The rotation has converged in 7 iterations. | |||||
Table 6.
Models obtained.
| RMSEA | CMIN/DF | RMR | GFI | AGFI | PGFI | TLI | CFI | PRATIO | PNFI | PCFI | |
| Model 1 | .073 | 2.347 | .065 | .864 | .825 | .670 | .846 | .869 | .852 | .677 | .740 |
| Model 2 | .057 | 1.839 | .052 | .915 | .882 | .659 | .927 | .941 | .817 | .719 | .768 |
| Model 3 | .085 | 2.825 | .082 | .889 | .842 | .626 | .868 | .893 | .813 | .687 | .726 |
| Model 4 | .059 | 1.891 | .045 | .939 | .907 | .614 | .944 | .957 | .773 | .707 | .740 |
| Model 5 | .044 | 1.502 | .042 | .947 | .921 | .635 | .966 | .973 | .782 | .724 | .761 |
| *** | .080 | 2.647 | .073 | .809 | .770 | .672 | .785 | .806 | .902 | .654 | .727 |
Disclaimer/Publisher’s Note: The statements, opinions and data contained in all publications are solely those of the individual author(s) and contributor(s) and not of MDPI and/or the editor(s). MDPI and/or the editor(s) disclaim responsibility for any injury to people or property resulting from any ideas, methods, instructions or products referred to in the content. |
© 2025 by the authors. Licensee MDPI, Basel, Switzerland. This article is an open access article distributed under the terms and conditions of the Creative Commons Attribution (CC BY) license (http://creativecommons.org/licenses/by/4.0/).
Copyright: This open access article is published under a Creative Commons CC BY 4.0 license, which permit the free download, distribution, and reuse, provided that the author and preprint are cited in any reuse.


