
Submitted:
04 December 2025
Posted:
08 December 2025
You are already at the latest version
Abstract
The growing demand for high-strength and low-core-loss soft magnetic materials in high-efficiency energy conversion devices necessitates the development of novel alloys that combine excellent mechanical and soft magnetic properties. This work investigated the effect of Ta content on the microstructure and properties of as-cast (Fe₇Co₆Ni₆)93-xTaxAl7 (x=3, 5, 7) multiprincipal element alloys (MPEAs). The alloys featured an FCC matrix, in which Ta addition led to the precipitation of a Ta-rich Laves phase and significant grain refinement. The Ta5 alloy demonstrated an optimal balance of properties, with a yield strength approaching 1 GPa, an elongation of ~10%, a saturation magnetization of 92.88 emu/g, and a coercivity of 446.43 A/m, indicating good strength, ductility, and soft magnetic performance. An appropriate amount of Ta enhanced strength via precipitation and grain-boundary strengthening, while the saturation magnetization showed only a moderate reduction. The coercivity was effectively kept low by the fine, dispersed Co2Ta Laves phases, which minimized domain wall pinning.
Keywords:
multi-principal element alloys
; mechanical properties
; soft magnetic property
1. Introduction
Soft magnetic materials (SMMs) are characterized by their ease of magnetization and demagnetization, typically exhibiting high saturation magnetic flux density and low coercivity (below 1000 A/m). They play a vital role in new energy vehicle motors, air conditioning motors, and transformers [1,2,3]. Current research on SMMs primarily focuses on silicon steel [4,5,6,7,8], Fe-Ni alloys [9,10], Fe-Co alloys [11], and amorphous metallic alloys [12]. In recent years, the growing demand for SMMs under high-load conditions and the trend toward high-speed motors with compact size, high efficiency, and enhanced durability have driven research on high-strength electrical steels [13,14,15]. The development of such high-strength electrical steels often involved minor additions of other alloying elements to iron-silicon alloys. For instance, recent studies on Cu-containing high-strength electrical steels achieved a yield strength of approximately 900 MPa, although their elongation was reduced to 5%–8%, indicating relatively poor ductility [4,5]. Furthermore, although some amorphous soft magnetic materials exhibited high yield strength, they are typically limited to thin ribbons, wires, or powders due to the required high cooling rates for their synthesis, and they often suffer from high brittleness [16,17]. Therefore, designing novel alloys that combine excellent mechanical and soft magnetic properties remains an important research direction.
High entropy alloys (HEAs), also referred to as compositionally complex alloys (CCAs) [18] or multiprincipal element alloys (MPEAs) [19], are a novel class of metallic materials composed of multiple principal elements in near-equiatomic proportions. Since the concept was proposed twenty years ago [20,21], their unique four core effects [22,23] and vast compositional design space have enabled MPEAs to exhibit exceptional properties rarely achieved in conventional alloys, such as outstanding mechanical strength, fracture toughness, and corrosion resistance [24,25,26,27,28]. Based on their constitutional elements, MPEAs can be classified into distinct types, each associated with promising applications. Among the earliest systems studied were those containing 3d transition elements such as Cr, Mn, Fe, Co, and Ni. These alloys featured highly tailorable microstructures and mechanical properties [29]. It was also shown that lightweight MPEAs composed of light elements such as Al, Ti, and V exhibited high specific strength, showing great potential for weight-sensitive applications, including aerospace [18,30,31]. Refractory MPEAs based on W, Ta, Mo, and other refractory elements are suitable for extremely high-temperature environments due to their excellent high-temperature strength and thermal stability [32,33,34].
As research on MPEAs has deepened, investigators have moved beyond an exclusive focus on their mechanical properties. While pursuing breakthroughs in balancing alloy strength and ductility, extensive studies have also examined their corrosion and radiation resistance [35,36] and their physical properties (e.g., hydrogen storage, electrocatalysis, and magnetic properties) [37,38]. Scholars began investigating the magnetic properties of MPEAs around 2010 [39,40]. A series of MPEAs composed of FeCoCrNi combined with Al, Cu, or Pb exhibited saturation magnetization (<41 emu/g) significantly lower than that of pure Fe (218 emu/g). However, the coercivity of CoCrFeNiCuAl MPEA was measured at only 45 Oe, indicating its potential as a soft magnetic material and thereby initiating research into soft magnetic MPEAs.
Currently, the most common phases in soft magnetic MPEAs are FCC and BCC. Studies on FeCoNiAl MPEAs [41,42,43,44] demonstrated that with increasing Al content, the phase constitution of FeCoNi alloys transitioned progressively from a single-phase FCC structure to dual-phase FCC + BCC, and finally to a single-phase BCC structure. This phase transformation consequently led to alterations in both magnetic and mechanical properties. Regarding magnetic performance, although studies on dual-phase soft magnetic MPEAs showed that the FCC phase exhibited higher saturation magnetization than the BCC phase [45], the phase structure did not directly determine the saturation magnetization. Instead, it was passively influenced by the differences in ferromagnetic element content. Regarding coercivity, a more complex phase structure and a higher volume fraction of secondary phases generally led to increased coercivity [42]. As for mechanical properties, the FCC phase in soft magnetic MPEAs typically exhibited superior ductility but lower strength. In contrast, the BCC phase generally possessed higher strength but greater brittleness. Therefore, the design of high-strength soft magnetic MPEAs should adhere to the following strategy: a ferromagnetic FCC matrix (comprising Fe, Co, Ni) ensures high saturation magnetization, while a minor addition of non-ferromagnetic elements introduces secondary phases for strengthening. This approach enhances mechanical properties via precipitation strengthening, provided that the coercivity remains within the soft magnetic limit (e.g., <1000 A/m), thereby minimizing the detrimental impact on magnetic performance.
Building on the FeCoNiAl base system, existing research has systematically expanded the compositional space by incorporating additional alloying elements. This has led to the development of several notable soft magnetic MPEAs, such as FeCoNiAlSi [45,46,47], FeCoNiAlTa [48,49,50,51], FeCoNiAlMn [52,53,54], and FeCoNiAlCr [55,56,57]. Zhang et al. [45] studied the FeCoNiAlSi soft magnetic MPEA; the as-cast FeCoNi(AlSi)0.2 alloy achieved a saturation magnetization of 1.15 T, a coercivity of 1400 A/m, a compressive yield strength of 342 MPa, and a fracture strain of 50%. Although the coercivity slightly exceeded the limit for soft magnetic materials, it still demonstrated potential as a soft magnetic MPEA. Recently, Lu et al. [42] fabricated a FeCoNiAlMn MPEA via cold-rolling (CR) and annealing. The alloy annealed at 850 °C exhibited superior properties compared with other annealing conditions, achieving a yield strength and elongation of approximately 1 GPa and 24%, respectively, with a saturation magnetization (Ms) and coercivity of 120 emu/g and 455 A/m, respectively. Li et al. [44,48,49,50] conducted a series of studies on FeCoNiAlTa soft magnetic MPEAs. By hot rolling, they obtained fine nanoscale Ni- and Ta-rich L12 precipitates within the FCC matrix, yielding high-strength soft magnetic MPEAs. While maintaining a saturation magnetization of 88 emu/g, the alloy achieved a yield strength of 1202 MPa, ultimate tensile strength of 1526 MPa, and elongation of 15.3%. Concurrently, the role of Al in the FeCoNiAlTa system was investigated, revealing that Al addition enhanced the strength of MPEAs while reducing the saturation magnetization. In subsequent research [49], an FeCoNiTaAl alloy obtained by hot rolling followed by appropriate quenching exhibited a yield strength of 904 ± 11 MPa and an ultimate tensile strength (UTS) of 1336 ± 21 MPa, with an elongation of 53.6 ± 1.5%. It also exhibited an extremely low coercivity of 78 A/m and a moderate saturation magnetization of 100 emu/g. In the most recent study [50], the hot-rolled and homogenized non-equiatomic Fe35Co30Ni30Ta5 alloy was further processed by cold rolling, achieving a yield strength of nearly 2 GPa while maintaining an elongation of 12.6% and a saturation magnetization of 115.4 Am2·kg-1. The FeCoNiTaAl soft-magnetic MPEAs have demonstrated excellent balanced properties but still have considerable research potential. Existing studies have primarily focused on the effects of Al content, rolling, and heat treatment on microstructure and properties, whereas systematic investigations of variations in the key precipitate-forming element, Ta, remain scarce. In addition, current high-performance soft magnetic MPEAs typically rely on complex thermo-mechanical processing. Consequently, the phase constitution and microstructure of the as-cast FeCoNiTaAl system remain poorly characterized, which hinders the optimization of its composition and production processes.
The optimal Ta content in the FeCoNiTaAl system remains unclear. To elucidate the influence of Ta content on the microstructure, magnetic properties, and mechanical performance of MPEAs, and thereby provide critical guidance for subsequent alloy design, this work prepared as-cast (FeaCobNib)93-xTaxAl7 (x=3, 5, 7; a: b=7:6) alloys via arc melting. This approach aims to introduce an appropriate amount of secondary phase into the FCC matrix by adjusting the Ta content, while simultaneously controlling the quantity and size of these phases to enhance mechanical properties without causing a sharp increase in coercivity. It is expected to achieve a favorable balance between soft magnetic properties and mechanical performance while simplifying alloy fabrication. Furthermore, using microstructural characterization methods such as XRD, SEM, EPMA, and TEM, as well as vibrating sample magnetometry and tensile testing, this work investigated variations in mechanical and soft magnetic properties and the underlying microstructural causes in the FeCoNiAlTa system, thereby guiding adjustments in alloy composition and heat-treatment processes. This work systematically investigates the FeCoNiAlTa system using a combination of microstructural characterization (XRD, SEM, EPMA, TEM) and property measurements (vibrating sample magnetometry (VSM), tensile testing). The aim is to correlate the evolution of mechanical and soft magnetic properties with their underlying microstructural causes, thereby providing insights for optimizing alloy composition and heat treatment.
2. Materials and Methods
2.1. Alloy Preparation
The (FeCoNi)93-xTaxAl7 (x = 3, 5, 7; Fe: Co: Ni = 7:6:6) MPEAs were synthesized by arc-melting using high-purity (> 99.99 wt.%) constituent elements. With a fixed Al content of 7 at.%, the Ta addition was balanced by proportionally reducing the Fe, Co, and Ni content to maintain the 7:6:6 ratio (see Table 1). The resulting alloys, designated as Ta3, Ta5, and Ta7, were suction-cast into as-cast plates measuring 110×30×5 mm³ for subsequent analysis.
2.2. Microstructural Characterization
XRD analysis was performed using a Smart Lab SE X-ray diffractometer with a Cu-Kα radiation source, with a scanning speed of 2°/min over a 2θ range of 20°-100°, and operating parameters set at 40 mA and 40 kV. For electron probe microanalysis (EPMA), specimens with dimensions of 5×5×5 mm3 were prepared by first removing the surface oxide layer with 400-grit SiC paper, subsequently grinding with progressively finer sandpaper up to 5000-grit, and finally polishing with a 0.05 μm SiO2 suspension. Backscattered electron (BSE) imaging and energy-dispersive X-ray spectroscopy (EDS) analysis of the MPEAs were conducted using a Shimadzu EPMA-8050G field emission electron probe microanalyzer to characterize the microstructure and elemental distribution. For EBSD specimens, after initial mechanical polishing, they underwent a two-step finishing procedure. First, they were vibration polished with a 0.05 μm SiO2 suspension using a VibroMet™ 2 polisher. Subsequently, the surface quality was further enhanced by Ar-ion milling using a Gatan PECS II 685 system, with ion-beam energies ranging from 0.1 to 8 keV. Electron backscatter diffraction (EBSD) analysis was performed to determine grain size and to examine post-tensile fracture morphology. The analysis was conducted on an Apreo S Hivac field-emission scanning electron microscope (SEM) equipped with an EBSD system, using a step size of 1.5 μm. The acquired data were processed using Aztec software, in which grain sizes were quantified using the equivalent circle diameter method.
TEM specimens were prepared as 3 mm discs, which were mechanically ground to approximately 70 μm in thickness using 2000-5000 grit sandpaper. Thin regions were subsequently created using a Struers TenuPol-5 twin-jet electropolishing system with an electrolyte consisting of 10 vol.% perchloric acid and 90 vol.% methanol. Liquid nitrogen was used to maintain the electrolyte temperature at -20 °C during electropolishing. Microstructural characterization of the MPEAs was performed using a JEM-F200 (CF-HR) scanning transmission electron microscopy (STEM), with emphasis on STEM-EDS analysis and high-resolution imaging of the matrix and secondary phase.
2.3. Soft Magnetic Properties
The room temperature hysteresis loops of the MPEAs were measured using a Lake Shore Model 8604 vibrating sample magnetometer (VSM). Specimens measuring 2 mm3 were prepared and ground with 400-grit sandpaper to remove surface oxide layers, and their mass was then measured using a high-precision balance. The magnetic field was swept from -10000 Oe to 10000 Oe in steps of 200 Oe. To enhance the accuracy of coercivity determination, a finer step size of 10 Oe was used over the ±100 Oe range.
2.4. Mechanical Properties
Stress-strain curves were obtained using an Instron Model 3382 tensile testing machine. Dog-bone-shaped specimens with dimensions of 12 mm × 6 mm × 1.3 mm were tested at a strain rate of 3.75 × 10⁻⁴ s-1. Vickers hardness was measured with an HV-1000B microhardness tester under a 500g load and a dwell time of 10 s. Both the upper and lower surfaces were ground with sandpaper up to 5000 grit and finally polished with a 0.05 μm SiO2 polishing suspension.
3. Results and Discussion
3.1. Microstructure of MPEAs
Figure 1a shows the XRD patterns of the (Fe7Co6Ni6)93-xTaxAl7 (x=3, 5, 7) alloys. The presence of diffraction peaks from crystallographic planes such as (111), (200), and (220) indicated that the matrix of these MPEAs possessed a single-phase FCC. The lattice parameters of the FCC phase in these three alloys, calculated from the XRD results, were 3.6026 Å, 3.6134 Å, and 3.6120 Å, respectively. Figure 1b displays a magnified view of the XRD pattern for the Ta7 alloy, revealing minor diffraction peaks from a secondary phase. This phase was identified as a C14 Laves phase with a Co2Ta-type structure (PDF#15-0039), adopting the MgZn2 prototype and commonly forming in as-cast Ta-containing alloys [58,59,60]. These same diffraction peaks were less pronounced in the Ta5 alloy, being clearly observable only for the () plane. No distinct secondary phase diffraction peaks were detected in the XRD pattern of the Ta3 alloy.
Figure 2 shows BSE images at different magnifications and EDS elemental mapping results of the Ta3 alloy. The low-magnification BSE image in Figure 2a revealed a typical as-cast microstructure of the Ta3 alloy. By combining higher-magnification BSE images with corresponding EDS maps of Fe, Co, Ni, and Ta, it can be seen that the brighter and grey regions corresponded to Ta-rich areas, while the darker regions were Ta-depleted. Al element was not included in Figure 2 due to its low concentration, which prevented meaningful information from being obtained. Co and Ni were uniformly distributed in the alloy, while the Fe element showed some enrichment in the darker regions. Still, the degree of enrichment was relatively weak, thus requiring further TEM-EDS analysis for verification.
Figure 3 shows the BSE image and elemental mapping results of the Ta5 alloy. The area fraction of the brighter Ta-rich regions was increased. Although the low-magnification BSE image in Figure 3a exhibited a morphology similar to that of Ta3, the higher magnification BSE image revealed a microstructure distinct from Ta3. Finer structural features were observed within the Ta-rich regions of Ta5, as shown in the inset at the lower-left corner of Figure 3b, where alternating brighter and darker fine-scale structures were visible within the Ta-rich regions.
As observed in Figure 4a-b, the Ta7 alloy exhibited a significant increase in the area fraction of Ta-rich regions. At the same time, the proportion of the darker matrix was further reduced, resulting in a morphology in which the matrix appeared encapsulated by the Ta-rich phases. Furthermore, the fine lamellar structures within the bright Ta-rich regions in Figure 4b were more distinct than those in Ta5, as clearly visible in the inset at the lower-left corner of Figure 4b. Additionally, the Fe element (Figure 4c) showed noticeable enrichment in the matrix. However, the detailed lamellar structures within the Ta-rich regions and the elemental distribution characteristics in these regions still require further clarification through higher-resolution TEM characterization and EDS analysis.
Subsequent TEM analysis (discussed in the following section) revealed that the Ta-rich regions consisted of a lamellar interlaced structure of Ta-rich Co2Ta phase and Ta-depleted FCC phase, with individual layer widths of approximately 200 nm. The fine nature of this structure makes it challenging to analyze using EBSD. Moreover, given the alloy’s relatively large grain size, all EBSD measurements were conducted with a 1.5 μm scanning step size to mainly characterize grain morphology and determine the average grain size of the as-cast alloy. Therefore, EBSD failed to detect the Co2Ta phase, with all three alloys exhibiting a single FCC phase. The detailed microstructure and elemental distribution within Ta-rich regions will be presented in subsequent TEM characterization. To ensure statistical accuracy in grain-size measurement, EBSD analysis was conducted at lower magnification for the Ta3 alloy, which had the largest grain size, while a higher magnification was used for the Ta5 and Ta7 MPEAs. As evidenced by the inverse pole figure (IPF) maps in Figure 5a1-c1: The as-cast alloys exhibited randomly oriented grains without a pronounced texture. Further analysis revealed a progressive refinement in grain size with increasing Ta content, yielding measured grain sizes of 190.7 ± 70.4 μm for Ta3, 110.2 ± 38.5 μm for Ta5, and 51.5 ± 21.9 μm for Ta7. In the grain boundary maps, boundaries with misorientation angles between 2–15° were defined as low-angle grain boundaries (LAGBs) and were colored red. Boundaries with misorientation angles greater than 15° were defined as high-angle grain boundaries (HAGBs) and were colored black. The results indicated that a higher proportion of LAGBs was revealed in MPEA with higher Ta content.
Figure 6a shows a STEM bright-field (BF) micrograph of the Ta3 alloy, where secondary phases precipitated along the grain boundaries, without the lamellar structures observed in Ta5 and Ta7. Figure 6b-f present elemental mapping results for the region marked by the orange square in Figure 6a, revealing the distributions of Fe, Co, Ni, Al, and Ta. Consistent with the EPMA-EDS results, the secondary phases were enriched in Ta.
Figure 7a revealed the formation of lamellar structures along the grain boundaries in the Ta5 alloy. Elemental maps results provided in Figure 7b-f revealed that these lamellar structures were composed of Ta-rich secondary phases (Figure 7f) and Ta-depleted regions with compositional characteristics similar to the matrix. Combined with XRD results confirming that the alloy comprised solely an FCC matrix and a Laves phase, these Ta-depleted regions were identified as the FCC phase.
Figure 8a showed a further increase in the volume fraction of secondary phases in Ta7 alloy. Elemental mapping results (Figure 8b-f) of the lamellar structure region marked in Ta7 revealed a morphology similar to that observed in Ta5: an interlaced distribution of Ta-rich Co2Ta secondary phases and a Ta-depleted FCC matrix. The volume fraction and scale of this dual-phase structure would significantly influence the alloy’s soft magnetic and mechanical properties.
Selected area electron diffraction (SAED) patterns acquired from the matrix regions (Figure 9b1-b3) further confirmed that the matrix in all three alloys possessed an FCC structure. The SAED patterns obtained from the Ta-rich regions marked by the blue squares (Figure 9c1-c3) were consistent with diffraction along the [] zone axis of Co2Ta. Combined with the XRD results, this conclusively identified the Ta-rich phases as a hexagonal crystal structure. The diffraction patterns showed superlattice diffraction spots within the green and blue circles. This suggested that the matrix was not a single-phase FCC structure but rather likely contained L12 ordered phases. Such ordered structures have been previously reported in FeCoNiTaAl alloy systems [48,49,50,51]. The matrix may be a coherent structure consisting of FCC and L12 or a single L12 phase. Regarding the Co2Ta Laves phase, the appearance of superlattice diffraction spots in the hexagonal pattern indicated ordering within this phase [61]. The lattice parameters of the matrix in Ta3, Ta5, and Ta7 were a = 0.354 nm, 0.362 nm, and 0.354 nm, respectively. The lattice parameters of the Ta-rich secondary phase were a = 0.460 nm, 0.477 nm, and 0.476 nm, with c = 0.715 nm, 0.740 nm, and 0.731 nm, respectively.
Figure 10a shows a high-resolution TEM (HR-TEM) micrograph of the interface between the secondary phase and the matrix in the Ta3 alloy, revealing an incoherent phase boundary. The FFT (Fast Fourier Transform) pattern at the interface showed diffraction spots from the FCC (L12) and Laves phases, with green circles indicating L12 reflections and blue circles indicating Laves-phase reflections. Figure 10b-e present the FFT and IFFT (Inverse Fast Fourier Transform) patterns derived from high-resolution images of the matrix (L12) and Laves phase, respectively. The resulting crystal structures are consistent with the SAED analysis. The lattice parameter of the FCC phase is a = 0.359 nm, while the Laves phase has lattice parameters of a = 0.469 nm and c = 0.7288 nm.
3.2. Magnetic and Mechanical Properties
Figure 11a shows the room temperature saturation magnetization of Ta3, Ta5, and Ta7 alloys, while Figure 11b presents a magnified view of the region near the origin of (a). The intersection of the hysteresis loop with the negative x-axis defines the coercivity of an alloy; relevant parameters of MPEAs are summarized in Table 2. As shown in Figure 11 and Table 2, the saturation magnetization of MPEAs decreased with increasing Ta content, from 108.22 emu/g to 76.28 emu/g. Since Ta is non-ferromagnetic and cannot be magnetized, the saturation magnetization of MPEAs exhibited a positive correlation with the fraction of ferromagnetic elements (Fe, Co, Ni). Regarding coercivity, as the Ta content increased from 3 at.% to 5 at.%, the coercivity rised from 277.73 A/m to 446.43 A/m. When the Ta content reached 7 at.%, the coercivity increased sharply to 879.33 A/m. Coercivity is widely recognized to originate from the interaction between magnetic domains and various interfaces within the alloy. Both increases in precipitate size and reductions in grain size can readily lead to higher coercivity [55].
Based on the aforementioned microstructural characterization results, increasing Ta content promoted greater segregation of secondary phases at grain boundaries. The increased volume fraction of these secondary phases enhanced their interaction with magnetic domains, thereby impeding domain restoration. SEM observations confirmed that with higher Ta addition, the width of the Ta-rich secondary phases also increased (Figure 3b and Figure 4b). Furthermore, with higher Ta content, the grain size decreased from 190 μm to 49 μm, thereby increasing the grain boundary density. The simultaneous increase in the volume fraction and size of secondary phases, coupled with elevated grain-boundary density, collectively contributed to the significant rise in coercivity observed in the Ta7 alloy. With the addition of a small amount of Ta, the resulting secondary phases exhibited a low volume fraction and finer size, leading to relatively lower interactions with magnetic domains. This accounted for the low coercivity observed in Ta3 and Ta5 MPEAs. It is worth noting that the coercivity of Ta7 alloy remains below 1000 A/m, which is the limit for soft magnetic materials.
Figure 12 demonstrates the influence of Ta content on alloy hardness. The Ta3 alloy exhibited the lowest hardness (243 HV), which can be attributed to its predominant softer FCC/L12 phase and the lowest volume fraction of the Laves phase among the three alloys. As the Ta content increased, the higher proportion of the hard Laves phase contributed to enhanced alloy hardness. It is noteworthy that while the hardness of Ta7 (487.7 HV) was slightly lower than that of Ta5 (585 HV), it remained significantly higher than that of Ta3 alloy.
Figure 13a shows the tensile engineering stress-strain curves of MPEAs. The Ta3 alloy exhibited the lowest yield strength (595 MPa) but the highest ductility, with an average tensile elongation (TE) of 29.3%. The Ta5 alloy had the highest yield and ultimate tensile strengths (993 MPa and 1210 MPa, respectively), while maintaining a good elongation of 10.3%. In contrast, the Ta7 alloy underwent brittle fracture, with both yield and tensile strengths lower than those of Ta5. Regarding the mechanical properties of Ta5 and Ta3, an analysis was conducted based on the work hardening curves in Figure 13b. Evidently, Ta5 exhibited a higher work hardening rate than Ta3, which can be attributed to the finer Laves phases impeding dislocation motion and thereby inducing more substantial work hardening. Specifically, the difference in work hardening rates between Ta3 and Ta5 was primarily manifested during the early stages of deformation. Grain size is a dominant factor influencing the initial work hardening rate of alloys [62]. The smaller grain size of the Ta5 alloy (110.2 μm) compared with Ta3 (190.7 μm) was consistent with this established relationship. A smaller grain size led to a higher grain-boundary volume fraction. The interaction between grain boundaries and dislocations played a key role in the early stage of work hardening. Similarly, the interaction between Laves phases and dislocations also played a similar role. In the Ta5 alloy, the increased volume fraction of Laves phases directly enhanced their interactions with dislocations during the early stages of plastic deformation. Additionally, segregation of Laves phases at grain boundaries increased interfacial energy, promoting grain refinement and indirectly contributing to the higher work-hardening rate observed in the initial deformation stage. Furthermore, based on HRTEM results from the Ta3 alloy, the interface between Laves phases and the FCC matrix was incoherent. Such incoherent, hard secondary phases act as substantial obstacles to dislocation motion, thereby significantly enhancing the work hardening rate [63]. Moreover, the difference in work-hardening rates between Ta3 and Ta5 decreased in the later stages. This is because, in the later stages of work hardening, the initial role of grain boundaries and Laves phases no longer accounted for the sole factor affecting the work hardening rate. Instead, dislocation multiplication and interactions between dislocations gradually became the main factors in work hardening [64,65].

Table 3.
Yield strength, ultimate tensile strength, and elongation of the (Fe7Co6Ni6)93-xTaxAl7 (x=3, 5, 7) alloys.
Table 3.
Yield strength, ultimate tensile strength, and elongation of the (Fe7Co6Ni6)93-xTaxAl7 (x=3, 5, 7) alloys.
| Alloy | σs (MPa) | σUTS (MPa) | TE (%) |
|---|---|---|---|
| Ta3 | 595 ± 26 | 849 ± 38 | 29.3 ± 3.8 |
| Ta5 | 993 ± 12 | 1210 ± 83 | 10.3 ± 3.1 |
| Ta7 | -- | 799 ± 153 | 0.6 ± 0.2 |
Fracture morphologies of the three alloys (Figure 14) were analyzed to elucidate their fracture mechanisms. First, distinct dimples were observed in both Ta3 and Ta5 alloys, indicating that both alloys underwent ductile fracture. Among them, the Ta3 alloy exhibited more numerous, finer dimples, indicating superior ductility, consistent with its higher elongation. The Ta5 alloy exhibited a relatively small number of dimples, accompanied by occasional tear ridges (Figure 14f), indicating severe localized plastic deformation during the final stage of fracture. The Ta7 alloy fractured in a brittle manner. No dimples were observed in the fracture morphology shown in Figure 14c and 14g, demonstrating typical brittle fracture characteristics with intergranular features. The incoherent Laves phases in the Ta7 alloy were predominantly distributed along grain boundaries, thereby reducing grain boundary strength, promoting intergranular fracture, and thus reducing ductility. Similarly, in the study on FeCoNiCuTa MPEAs by Xu et al. [59], it was also reported that precipitation of C14 Laves phases effectively enhanced yield strength; however, the formation of a continuous network along grain boundaries significantly reduced ductility.
4. Conclusions
1. The Ta5 alloy exhibited the most superior overall performance, with a yield strength of ∼1 GPa, an elongation of ∼10%, a saturation magnetization of 92 emu/g, and a coercivity of 446 A/m.
2. The Ta addition introduced fine Co2Ta secondary phases in Ta 5 alloy, which enhanced the yield strength of the alloy while maintaining good ductility. A small quantity of Co2Ta secondary phase, which ensured that the coercivity did not exceed the limit, and a slight decrease in saturation magnetization.
3. However, excessive Ta addition led to the formation of a continuous network of Laves phases along grain boundaries, resulting in brittle fracture and hindering magnetic domain motion. The excess Ta further reduced the saturation magnetization and contributed to grain refinement, increasing the number of grain boundaries and thereby increasing coercivity.
Author Contributions
Shizhan Zhang: Data Curation, Formal analysis, Writing – original draft, Writing – review & editing. Wei Wang:Data Curation, Writing – review & editing. Mingyang Li: Data Curation, Writing – review & editing. Zhaoyang Cheng: Writing – review & editing. Jing Liu: Writing – review & editing. Yao Qiu: Formal analysis, Writing – original draft, Writing–review & editing, Project administration, Supervision.
Funding
This research was supported by the National Natural Science Foundation of China (Grant No. 52231003), the Guangdong Basic and Applied Basic Research Foundation (Grant Nos. 2023B1515120100 and 2023B1515250006), the Key R&D Program of Hubei Province 2023BAB141, and the National Natural Science Foundation of China (52274393).
Data Availability Statement
Data will be made available on reasonable request.
Acknowledgments
The authors would like to express sincere gratitude for using the instruments at the Analytical & Testing Center of Wuhan University of Science and Technology.
Conflicts of Interest
The authors declare that they have no known competing financial interests or personal relationships that could have appeared to influence the work reported in this paper.
References
- Krings, A.; Boglietti, A.; Cavagnino, A. Soft magnetic material status and trends in electric machines. IEEE Trans. Ind. Electron. 2017, 64, 2405–2414. [Google Scholar] [CrossRef]
- Prabhu, M.A.; Loh, J.Y.; Joshi, S.C. Magnetic loading of soft magnetic material selection implications for embedded machines in more electric engines. IEEE Trans. Magn. 2016, 52, 1–6. [Google Scholar] [CrossRef]
- Gutfleisch, O.; Willard, M.A.; Brück, E. Magnetic Materials and Devices for the 21st Century: Stronger, Lighter, and More Energy Efficient. Adv. Mater. 2010, 23, 821–842. [Google Scholar] [CrossRef]
- Fang, F.; Hou, D.W.; Dai, S.F. Achieving superior mechanical and magnetic properties in non-oriented electrical steel with high coherent nanoprecipitation. Mater. Res. Lett. 2025, 13, 605–613. [Google Scholar] [CrossRef]
- Zhang, B.; Liang, Y.; Han, C. High-strength low-iron-loss electrical steel accomplished by Cu-rich nanoprecipitates. Mater. Lett. 2021, 296, 129917. [Google Scholar] [CrossRef]
- Moses, A.J. Energy efficient electrical steels: Magnetic performance prediction and optimization. Scr. Mater. 2012, 67, 560–565. [Google Scholar] [CrossRef]
- Elgamli, E.; Anayi, F. Advancements in Electrical Steels: A Comprehensive Review of Microstructure, Loss Analysis, Magnetic Properties, Alloying Elements, and the Influence of Coatings. Appl. Sci. 2023, 13, 10283. [Google Scholar] [CrossRef]
- Fang, F.; Hou, D.W.; Dai, S.F. Achieving superior mechanical and magnetic properties in non-oriented electrical steel with high coherent nanoprecipitation. Mater. Res. Lett. 2025, 13, 605–613. [Google Scholar] [CrossRef]
- Marinca, T.F.; Sule, A.I.; Hirian, R. Al-Permalloy (Ni71.25Fe23.75Al5) obtained by mechanical alloying. The influence of the processing parameters on structural, microstructural, thermal, and magnetic characteristics. Adv. Powder Technol. 2022, 33, 103642. [Google Scholar] [CrossRef]
- Waeckerlé, T.; Demier, A.; Godard, F. Evolution and recent developments of 80%Ni permalloys. J. Magn. Magn. Mater. 2020, 505, 166635. [Google Scholar] [CrossRef]
- Ma, M.; Zhao, X.; Sun, X. Microstructure evolution and strengthening mechanism of FeCo-1.5V0.5Nb0.4W soft magnetic alloy rolled strip with high yield strength and low coercivity. Acta. Mater. 2024, 268, 119793. [Google Scholar] [CrossRef]
- Shen, T.D.; Xin, S.W.; Sun, B.R. Low power loss in Fe65.5Cr4Mo4Ga4P12B5.5C5 bulk metallic glasses. J. Alloy. Compd. 2016, 658, 703–708. [Google Scholar] [CrossRef]
- Tanaka, I.; Nitomi, H.; Imanishi, K. Application of High-Strength Nonoriented Electrical Steel to Interior Permanent Magnet Synchronous Motor. IEEE Trans. Magn. 2013, 49, 2997–3001. [Google Scholar] [CrossRef]
- Yamazaki, K.; Ishikawa, K.; Ohguchi, H. Magnetic Property Investigation of High-Strength Electrical Steel Sheet Applied to Interior Permanent Magnet Synchronous Motors Considering Multiaxial Stress Caused by Centrifugal Force. IEEE Trans. Magn. 2023, 59, 1–5. [Google Scholar] [CrossRef]
- Li, Y.; Wang, J.; Zhang, H. New design of electric vehicle motor based on high-strength soft magnetic materials. Compel 2022, 42, 261–270. [Google Scholar] [CrossRef]
- Wang, C.Y.; Zhuang, Z.M.; Ding, F. Plasticity and brittleness of Fe-based amorphous alloy strips assessed via a single abrasive impact method. Mater. Today Commun. 2023, 35, 105637. [Google Scholar] [CrossRef]
- Xie, C.X.; Li, W.; Shen, F.H. Plastic deformation behavior of a novel Fe-based metallic glass under different mechanical testing techniques. J. Non-cryst Solids 2018, 499, 58–61. [Google Scholar] [CrossRef]
- Qiu, Y.; Hu, Y.J.; Taylor, A. A lightweight single-phase AlTiVCr compositionally complex alloy. Acta. Mater. 2017, 123, 115–124. [Google Scholar] [CrossRef]
- Kumar, J.; Jha, S.R.; Gurao, N.P. An odyssey from high entropy alloys to complex concentrated alloys. New Horizons Metall. Mater. Manuf. 2022, 159–180. [Google Scholar]
- Yeh, J.W. Physical Metallurgy of High-Entropy Alloys. J. Met. 2015, 67, 2254–2261. [Google Scholar] [CrossRef]
- Cantor, B.; Chang, I.T.H.; Knight, P. Microstructural development in equiatomic multicomponent alloys. Mater. Sci. Eng.A 2004, 375-377 213-218. [Google Scholar] [CrossRef]
- Yeh, J.W. Alloy Design Strategies and Future Trends in High-Entropy Alloys. J. Met. 2013, 65, 1759–1771. [Google Scholar] [CrossRef]
- Hsu, W.L.; Tsai, C.W.; Yeh, A.C. Clarifying the four core effects of high-entropy materials. Nat. Rev. Chem. 2024, 8, 471–485. [Google Scholar] [CrossRef] [PubMed]
- Li, W.; Xie, D.; Li, D. Mechanical behavior of high-entropy alloys. Prog. Mater Sci. 2021, 118, 100777. [Google Scholar] [CrossRef]
- Kumari, P.; Gupta, A.K.; Mishra, R.K. A Comprehensive Review: Recent Progress on Magnetic High Entropy Alloys and Oxides. J. Magn. Magn. Mater. 2022, 554, 169142. [Google Scholar] [CrossRef]
- Zhang, Y.; Zuo, T.T.; Tang, Z. Microstructures and properties of high-entropy alloys. Prog. Mater Sci. 2014, 61, 1–93. [Google Scholar] [CrossRef]
- Li, M.Y.; Qiu, Y.; Birbilis, N. On the corrosion of a nano-oxide dispersion strengthened CoCrNi medium entropy alloy prepared by laser powder bed fusion. Corros. Sci. 2025, 257, 113341. [Google Scholar] [CrossRef]
- Li, M.Y.; Qiu, Y.; Shi, X. Nano-dispersion strengthened and twinning-mediated CoCrNi medium entropy alloy with excellent strength and ductility prepared by laser powder bed fusion. J. Alloys Compd. 2024, 1005, 176103. [Google Scholar] [CrossRef]
- Yu, B.; Ren, Y.; Zeng, Y. Recent progress in high-entropy alloys: A focused review of preparation processes and properties. J. Mater Res. Technol. 2024, 29, 2689–2719. [Google Scholar] [CrossRef]
- Feng, R.; Zhang, C.; Gao, M.C. High-throughput design of high-performance lightweight high-entropy alloys. Nat. Commun. 2021, 12, 4329. [Google Scholar] [CrossRef]
- Qiu, Y.; Thomas, S.; Gibson, M.A. Microstructure and corrosion properties of the low-density single-phase compositionally complex alloy AlTiVCr. Corros. Sci. 2018, 133, 386–396. [Google Scholar] [CrossRef]
- Ren, X.; Li, Y.; Qi, Y. Review on Preparation Technology and Properties of Refractory High Entropy Alloys. Materials 2022, 15, 2391. [Google Scholar] [CrossRef]
- Senkov, O.N.; Wilks, G.B.; Scott, J.M. Mechanical properties of Nb25Mo25Ta25W25 and V20Nb20Mo20Ta20W20 refractory high entropy alloys. Intermetallics 2011, 19, 698–706. [Google Scholar] [CrossRef]
- Senkov, O.N.; Wilks, G.B.; Miracle, D.B. Refractory high-entropy alloys. Intermetallics 2010, 18, 1758–1765. [Google Scholar] [CrossRef]
- El-Atwani, O.; Li, N.; Li, M. Outstanding radiation resistance of tungsten-based high-entropy alloys. Sci. Adv. 2019, 5, eaav2002. [Google Scholar] [CrossRef]
- Amanzhulov, B.; Ivanov, I.; Uglov, V. Composition and Structure of NiCoFeCr and NiCoFeCrMn High-Entropy Alloys Irradiated by Helium Ions. Materials 2023, 16, 3695. [Google Scholar] [CrossRef]
- Savvotin, I.; Berdonosova, E.; Korol, A. Evaluation of hydrogen storage performance of Ti0.25Zr0.25V0.15Nb0.15Ta0.2 high-entropy alloy using calorimetric technique. J. Alloys Compd. 2024, 1005, 176022. [Google Scholar] [CrossRef]
- Ganesan, S.; Bhatt, D.; Satheesh, D. High entropy alloys: A comprehensive review of synthesis, properties, and characterization for electrochemical energy conversion and storage applications. J. Mater Chem A 2025, 13, 37663–37699. [Google Scholar] [CrossRef]
- Zhang, K.B.; Fu, Z.Y.; Zhang, J.Y. Annealing on the structure and properties evolution of the CoCrFeNiCuAl high-entropy alloy. J. Alloys Compd. 2010, 502, 295–299. [Google Scholar] [CrossRef]
- Lucas, M.S.; Mauger, L.; Muñoz, J.A. Magnetic and vibrational properties of high-entropy alloys. J. Appl. Phys. 2011, 109, 07E307. [Google Scholar] [CrossRef]
- Tan, X.; Tang, Y.; Tan, Y. Correlation between microstructure and soft magnetic parameters of Fe-Co-Ni-Al medium-entropy alloys with FCC phase and BCC phase. Intermetallics 2020, 126, 106898. [Google Scholar] [CrossRef]
- Lu, T.; He, T.; Andreoli, A.F. The origin of good mechanical and soft magnetic properties in a CoFeNi-based high-entropy alloy with hierarchical structure. Mater. Charact. 2024, 215, 114237. [Google Scholar] [CrossRef]
- Deng, Q.; Tang, Y.; Tan, Y. Effect of grain boundary character distribution on soft magnetic property of face-centered cubic FeCoNiAl0.2 medium-entropy alloy. Mater. Charact. 2020, 159, 110028. [Google Scholar] [CrossRef]
- Rao, Z.; Ponge, D.; Körmann, F. Invar effects in FeNiCo medium entropy alloys: From an Invar treasure map to alloy design. Intermetallics 2019, 111, 106520. [Google Scholar] [CrossRef]
- Zhang, Y.; Zuo, T.; Cheng, Y. High-entropy Alloys with High Saturation Magnetization, Electrical Resistivity and Malleability. Sci. Rep. 2013, 3, 1455. [Google Scholar] [CrossRef]
- Zuo, T.-T.; Ren, S.-B.; Liaw, P.K. Processing effects on the magnetic and mechanical properties of FeCoNiAl0.2Si0.2 high entropy alloy. Int. J. Miner. Metall. Mater. 2013, 20, 549–555. [Google Scholar] [CrossRef]
- Zhou, K.X.; Sun, B.R.; Liu, G.Y. FeCoNiAlSi high entropy alloys with exceptional fundamental and application-oriented magnetism. Intermetallics 2020, 122, 106801. [Google Scholar] [CrossRef]
- Han, L.; Rao, Z.; Souza Filho, I.R. Ultrastrong and Ductile Soft Magnetic High--Entropy Alloys via Coherent Ordered Nanoprecipitates. Adv. Mater. 2021, 33, e2102139. [Google Scholar] [CrossRef] [PubMed]
- Han, L.; Maccari, F.; Souza Filho, I.R. A mechanically strong and ductile soft magnet with extremely low coercivity. Nature 2022, 608, 310–316. [Google Scholar] [CrossRef]
- Han, L.L.; Peter, N.J.; Maccari, F. Two-gigapascal-strong ductile soft magnets. Nat. Commun. 2024, 15, 10119. [Google Scholar] [CrossRef] [PubMed]
- Dong, P.; Huang, L.; Yang, Q. Mechanical and magnetic properties of nonequiatomic Fe33Co28Ni28Ta5Al6 high entropy alloy by laser melting deposition. Vacuum 2024, 220, 112854. [Google Scholar] [CrossRef]
- Gao, W.; Dong, Y.; Jia, X. Novel CoFeAlMn high-entropy alloys with excellent soft magnetic properties and high thermal stability. J. Mater. Sci. Technol. 2023, 153, 22–31. [Google Scholar] [CrossRef]
- Zuo, T.; Gao, M.C.; Ouyang, L. Tailoring magnetic behavior of CoFeMnNiX (X = Al, Cr, Ga, and Sn) high entropy alloys by metal doping. Acta. Mater. 2017, 130, 10–18. [Google Scholar] [CrossRef]
- Li, P.; Wang, A.; Liu, C.T. Composition dependence of structure, physical and mechanical properties of FeCoNi(MnAl)x high entropy alloys. Intermetallics 2017, 87, 21–26. [Google Scholar] [CrossRef]
- Gao, W.; Dong, Y.; Ma, Y. Effects of structural transformation on magnetic properties of AlCoFeCr high-entropy soft magnetic powder cores by adjusting Co/Fe ratio. Mater. Des. 2023, 225, 111537. [Google Scholar] [CrossRef]
- Ma, Y.; Wang, Q.; Zhou, X. A Novel Soft--Magnetic B2--Based Multiprincipal--Element Alloy with a Uniform Distribution of Coherent Body--Centered--Cubic Nanoprecipitates. Adv. Mater. 2021, 33, 2006723. [Google Scholar] [CrossRef]
- Wang, Z.; Yuan, J.; Wang, Q. Developing novel high-temperature soft-magnetic B2-based multi-principal-element alloys with coherent body-centered-cubic nanoprecipitates. Acta. Mater. 2024, 266, 119686. [Google Scholar] [CrossRef]
- Chen, C.L.; Lin, P.H. Influences of Ta content and mechanical alloying on synthesis and characteristics of CoCrNiFeTax high entropy alloys. Intermetallics 2024, 172, 108362. [Google Scholar] [CrossRef]
- Xu, T.; Lu, Y.; Cao, Z. Effects of Ta Addition on the Microstructure and Mechanical Properties of CoCu0.5FeNi High-Entropy Alloy. Mater. Eng. Perform. 2019, 28, 7642–7648. [Google Scholar] [CrossRef]
- Dragsdorf, R.D.; Foreing, W.D. The intermetallic phases in the cobalt-tantalum system. Acta. Crystallogr. 1962, 15, 531–536. [Google Scholar] [CrossRef]
- Zhao, Y.; Großwendt, F.; Rajkowski, M. Formation of an ordered phase in hcp precipitates during aging of bcc HfNbTaTiZr high-entropy alloy. Scr. Mater. 2025, 262, 116634. [Google Scholar] [CrossRef]
- Wagner, C.; Laplanche, G. Effect of grain size on critical twinning stress and work hardening behavior in the equiatomic CrMnFeCoNi high-entropy alloy. Int. J. Plast. 2023, 166, 103651. [Google Scholar] [CrossRef]
- Jiang, S.; Cong, H.; Li, H. Nanoscale core-shell particles enhance the mechanical property of additively manufactured high-entropy alloys. Mater. Charact. 2025, 230, 115791. [Google Scholar] [CrossRef]
- Schuh, B.; Mendez-Martin, F.; Völker, B. Mechanical properties, microstructure and thermal stability of a nanocrystalline CoCrFeMnNi high-entropy alloy after severe plastic deformation. Acta. Mater. 2015, 258–268. [Google Scholar] [CrossRef]
- Guo, J.M.; Zhou, B.C.; Qiu, S. Achieving ultrahigh strength and ductility in high-entropy alloys via dual precipitation. J. Mater. Sci. Technol. 2023, 166, 67–77. [Google Scholar] [CrossRef]
Figure 1.
(a) XRD patterns of (Fe7Co6Ni6)93-xTaxAl7 (x=3, 5, 7) MPEAs; (b) XRD pattern of the (Fe7Co6Ni6)86Ta7Al7 alloy in the 2θ range from 35 to 47°.
Figure 1.
(a) XRD patterns of (Fe7Co6Ni6)93-xTaxAl7 (x=3, 5, 7) MPEAs; (b) XRD pattern of the (Fe7Co6Ni6)86Ta7Al7 alloy in the 2θ range from 35 to 47°.
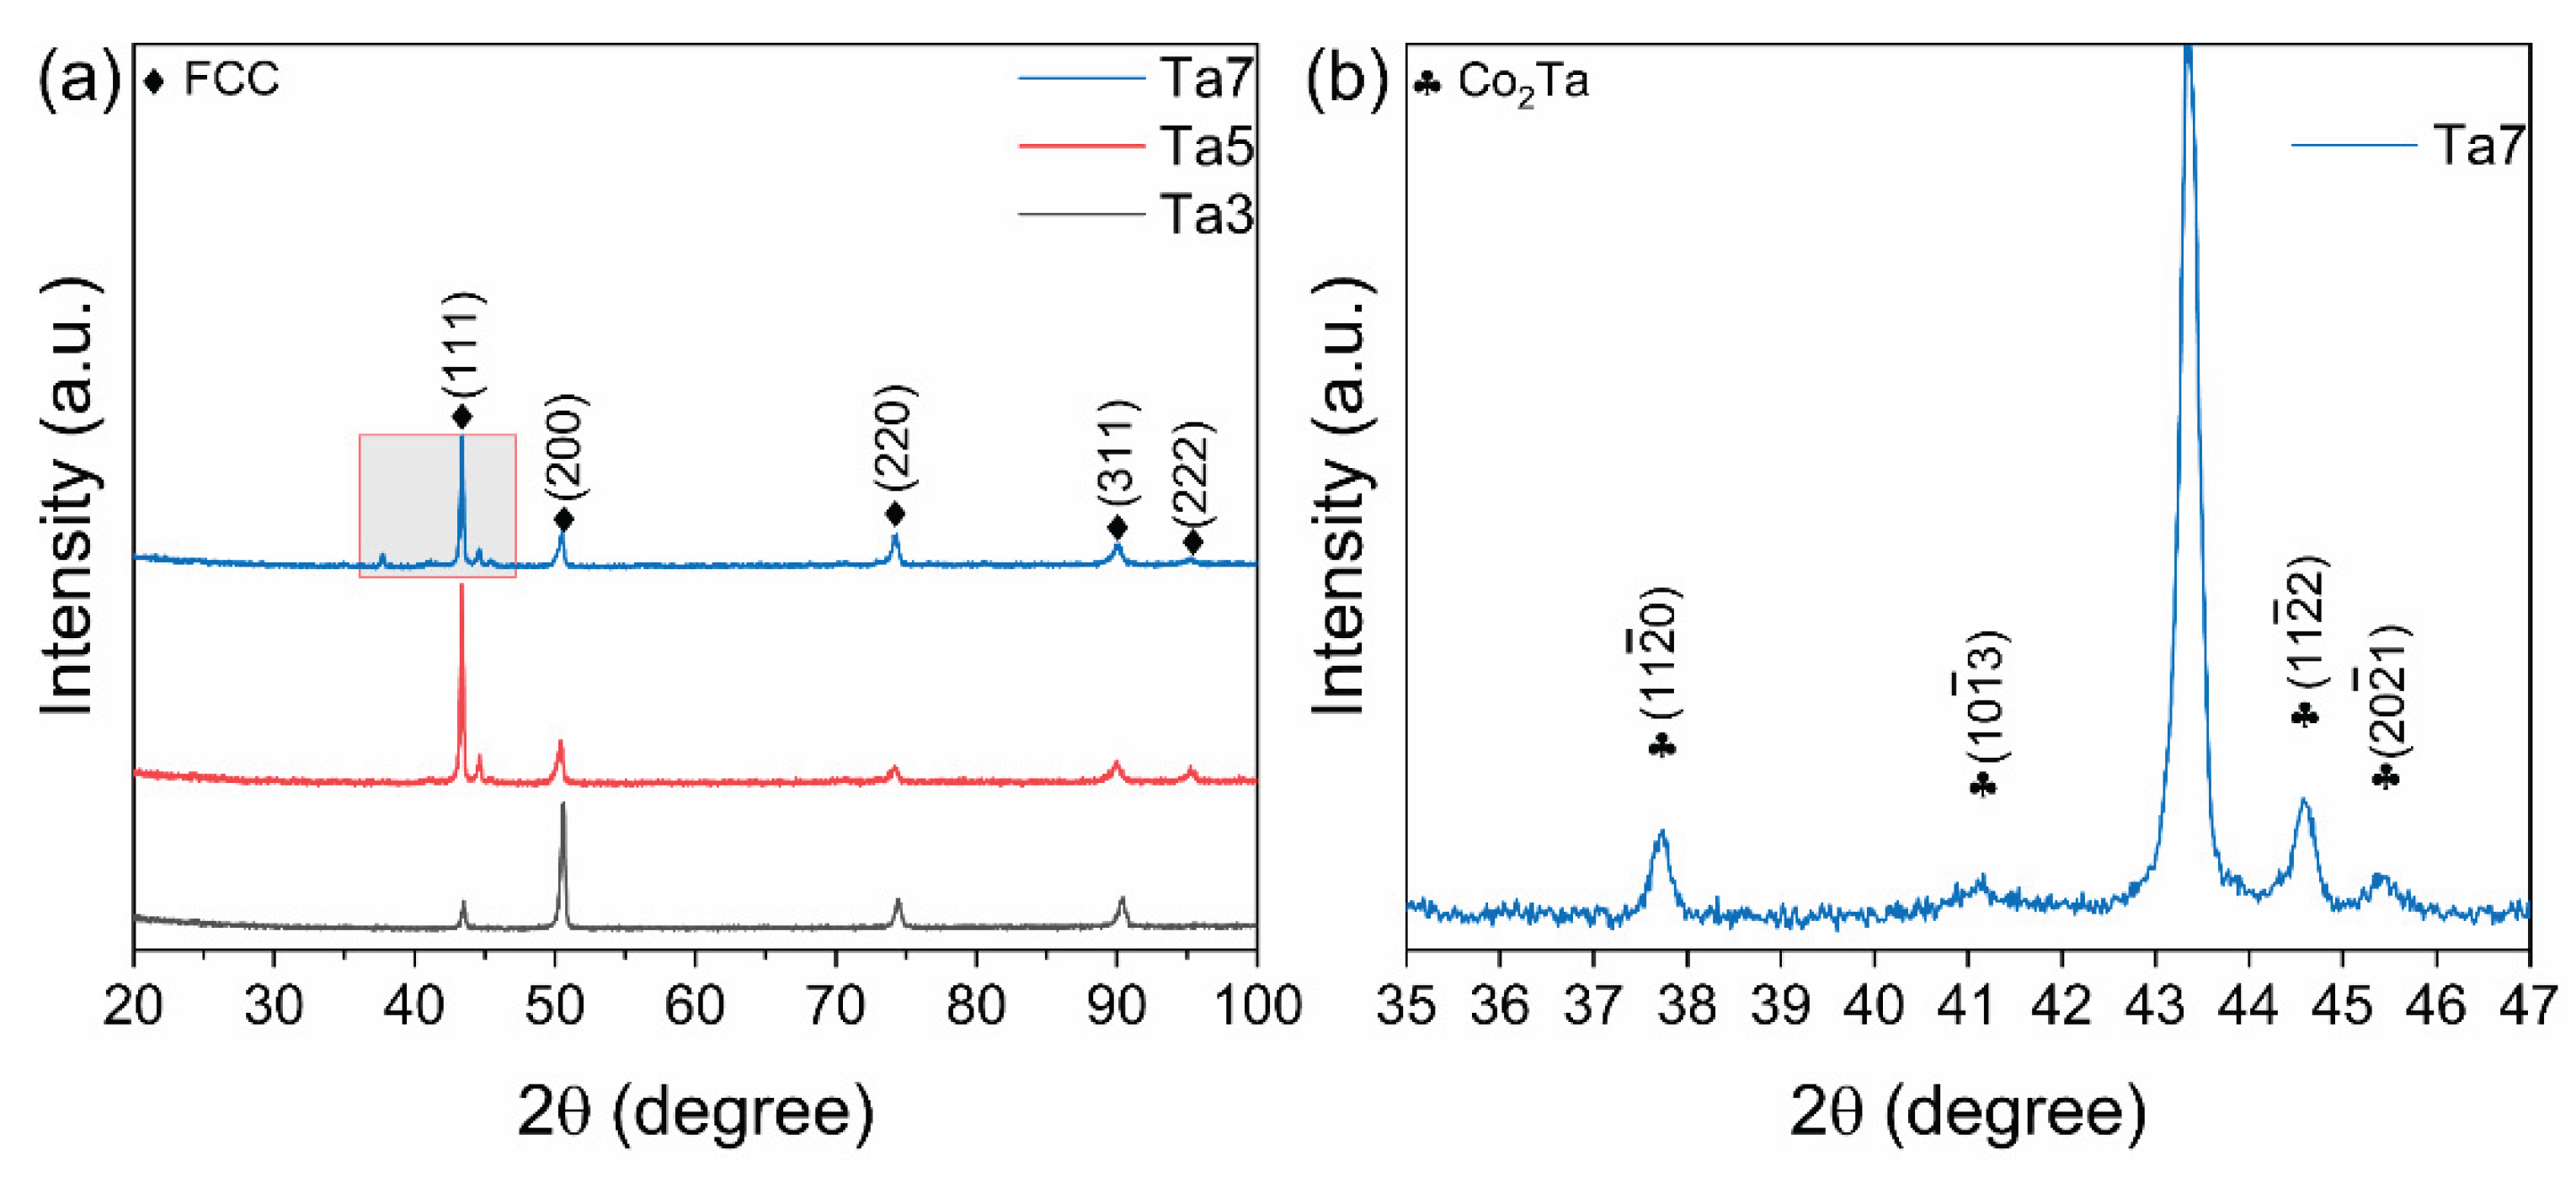
Figure 2.
(a-b) BSE images of the (Fe7Co6Ni6)90Ta3Al7 alloy at lower and higher magnifications; (c-f) EDS mapping results corresponding to the region in Figure 2b.
Figure 2.
(a-b) BSE images of the (Fe7Co6Ni6)90Ta3Al7 alloy at lower and higher magnifications; (c-f) EDS mapping results corresponding to the region in Figure 2b.
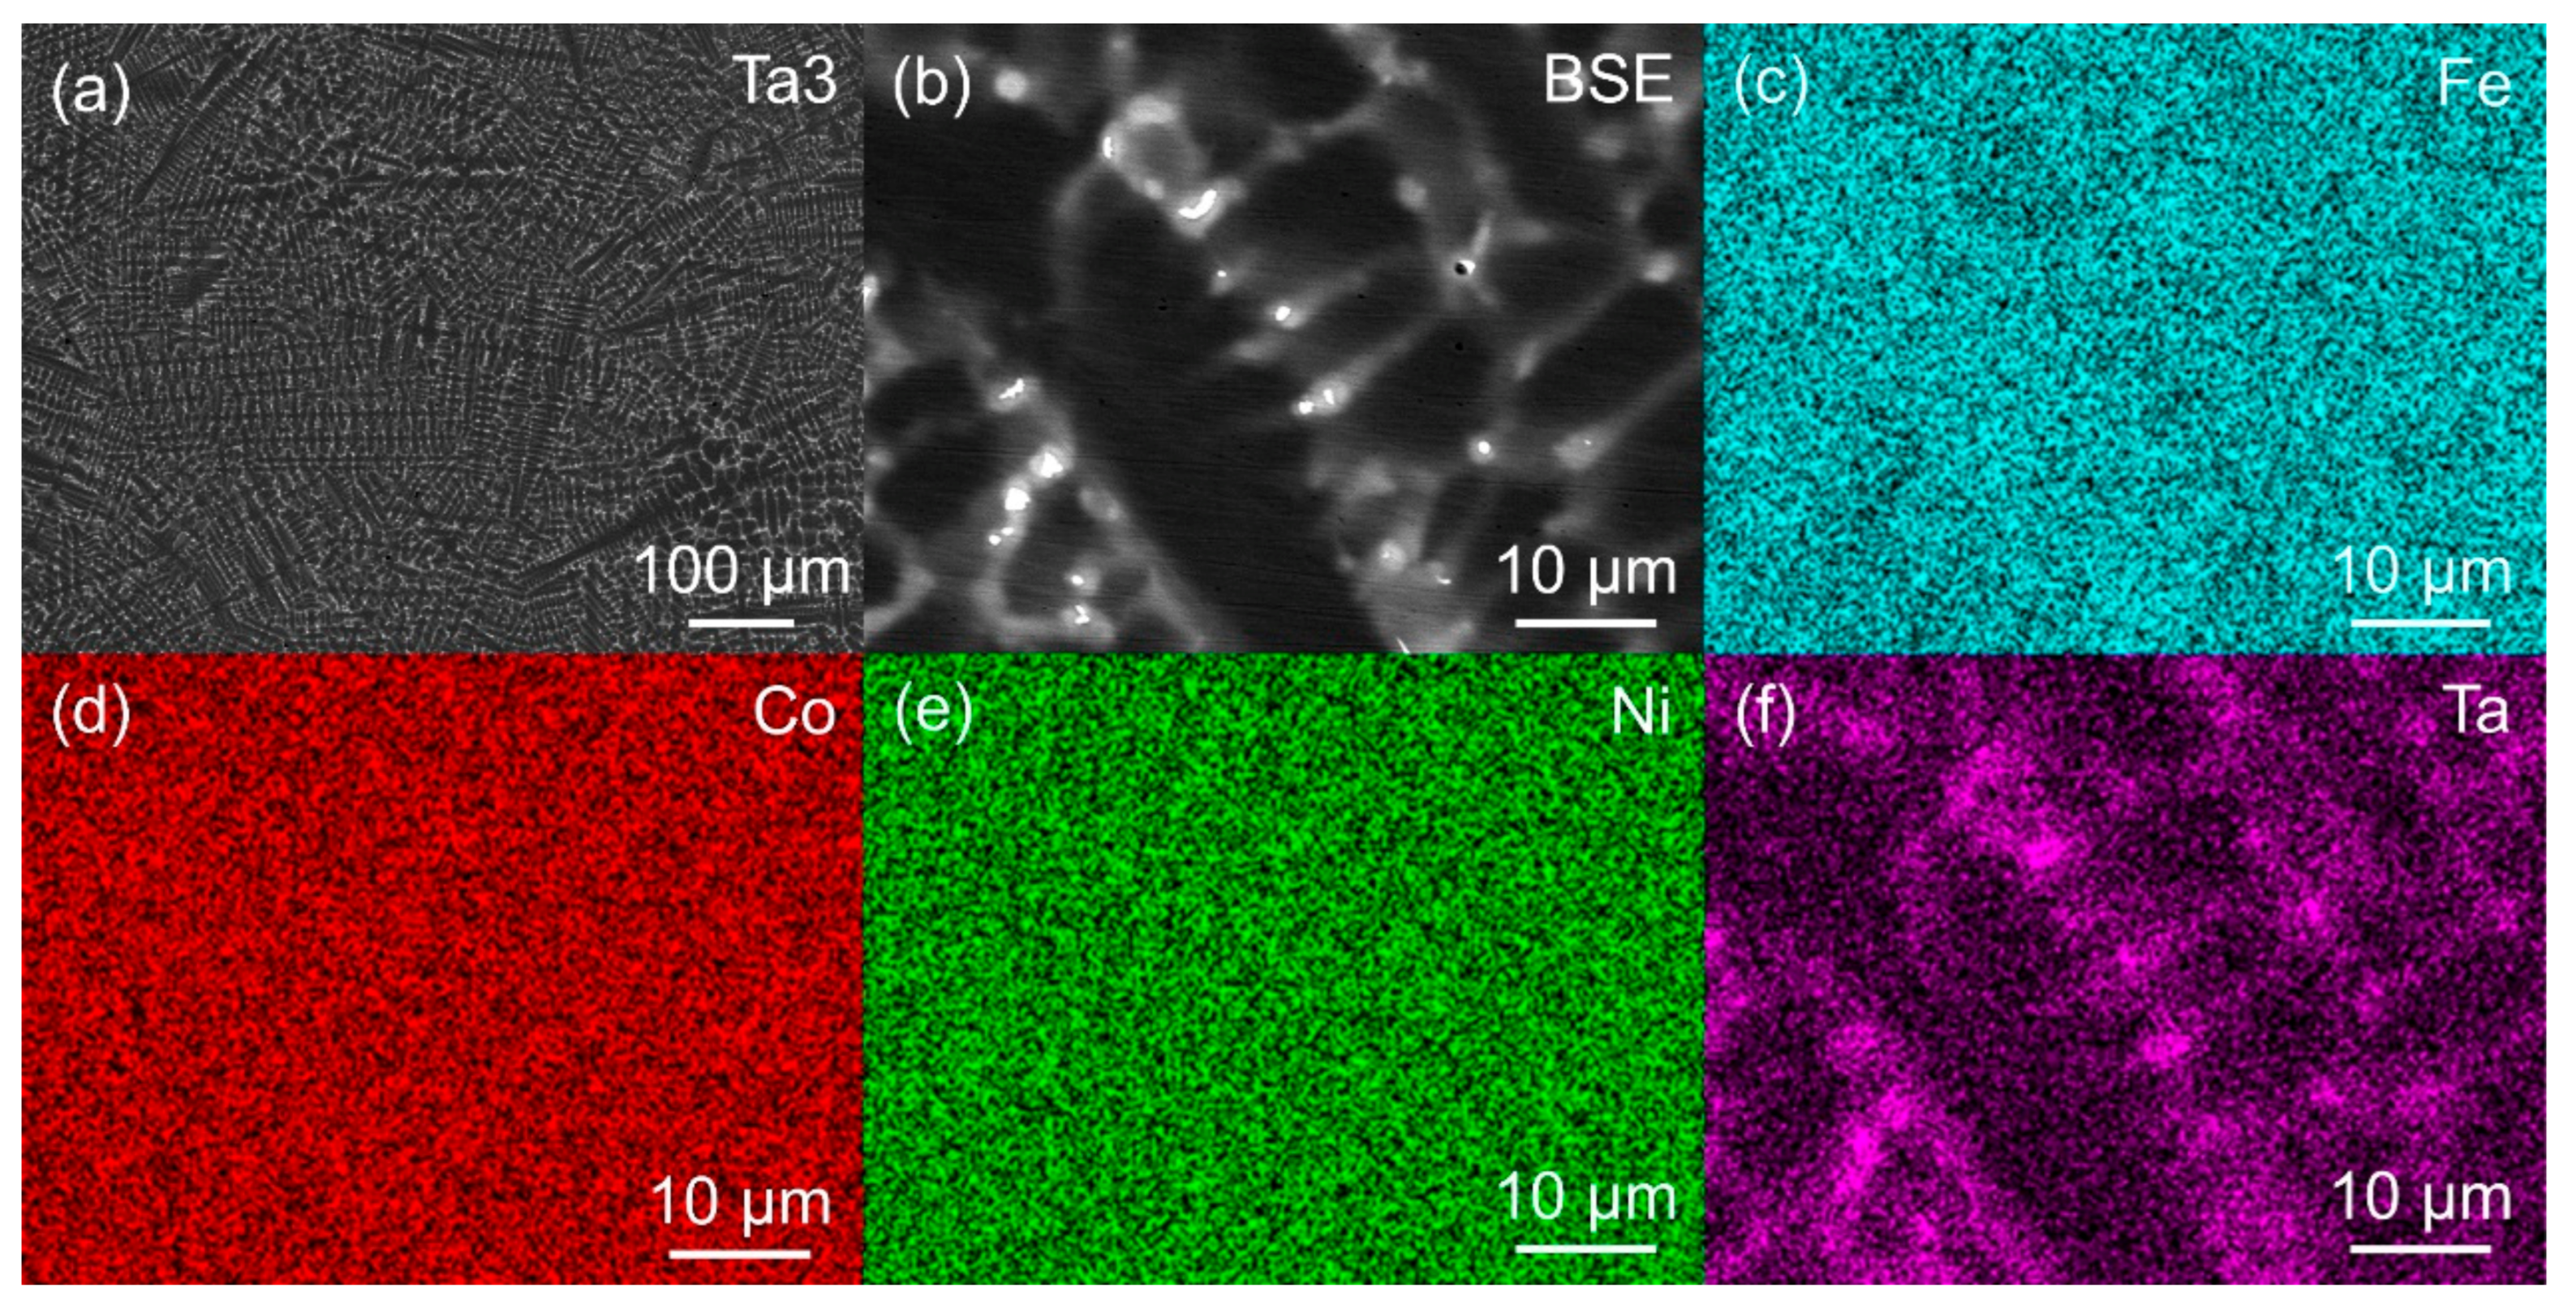
Figure 3.
(a-b) BSE images of the (Fe7Co6Ni6)88Ta5Al7 alloy at lower and higher magnifications; (c-f) EDS mapping results corresponding to the region in Figure 3b.
Figure 3.
(a-b) BSE images of the (Fe7Co6Ni6)88Ta5Al7 alloy at lower and higher magnifications; (c-f) EDS mapping results corresponding to the region in Figure 3b.
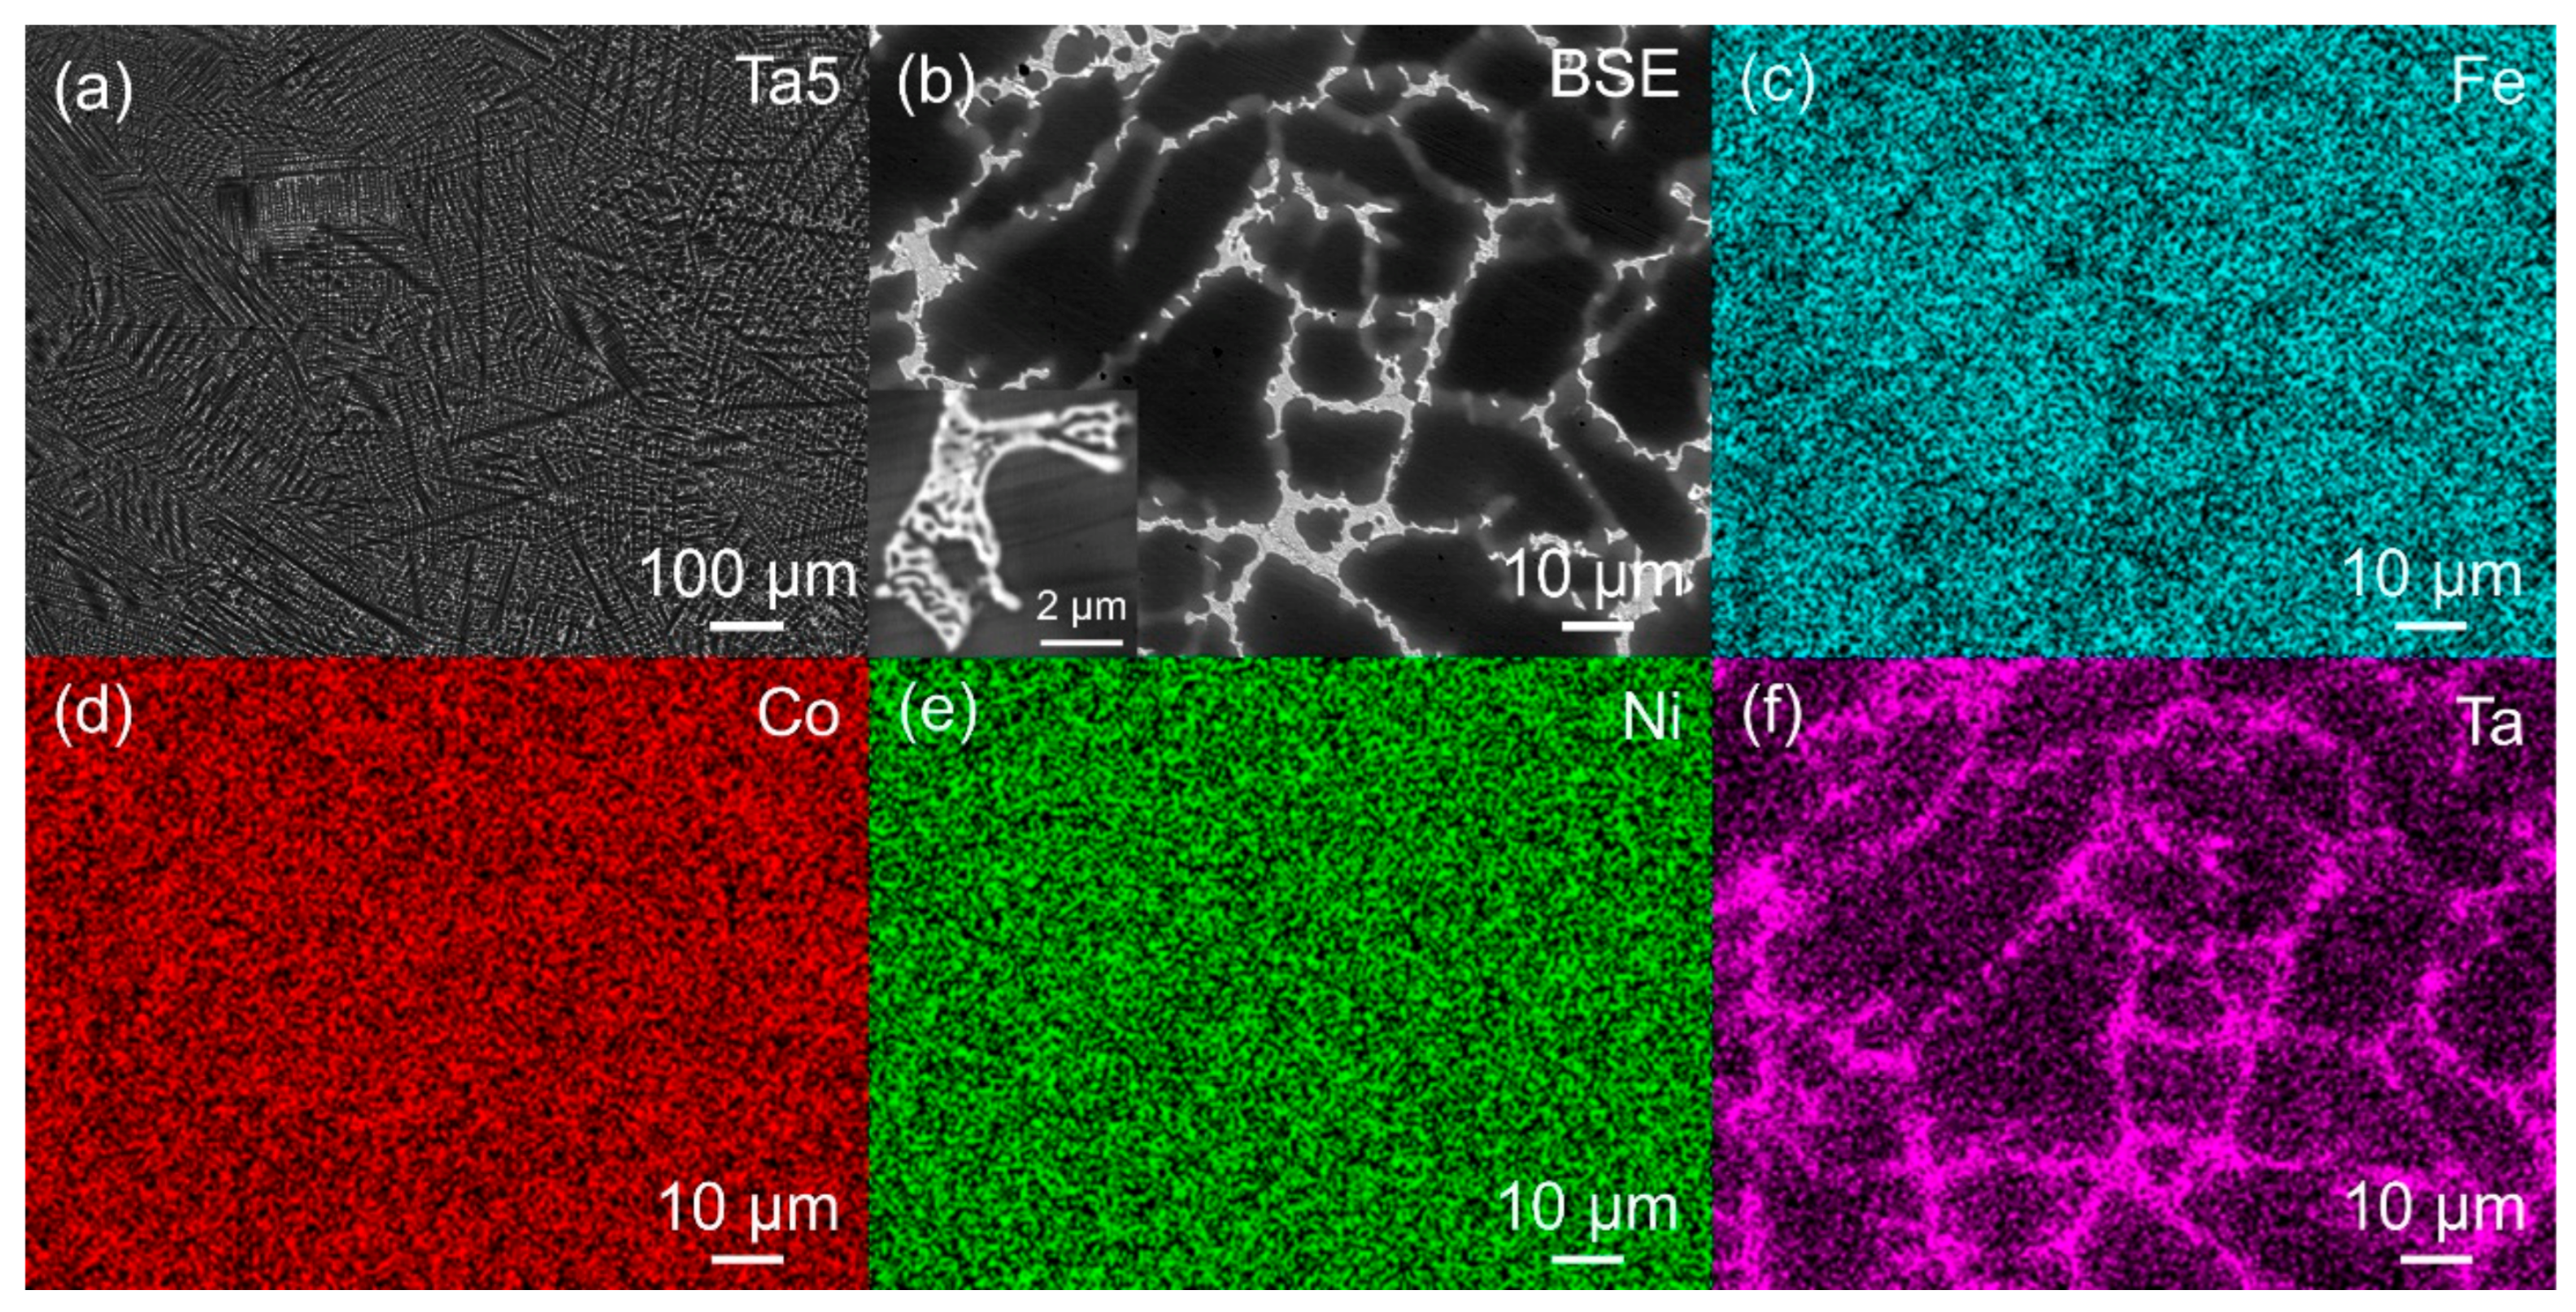
Figure 4.
(a-b) BSE images of the (Fe7Co6Ni6)86Ta7Al7 alloy at lower and higher magnifications; (c-f) EDS elemental mapping results corresponding to the region in Figure 4b.
Figure 4.
(a-b) BSE images of the (Fe7Co6Ni6)86Ta7Al7 alloy at lower and higher magnifications; (c-f) EDS elemental mapping results corresponding to the region in Figure 4b.
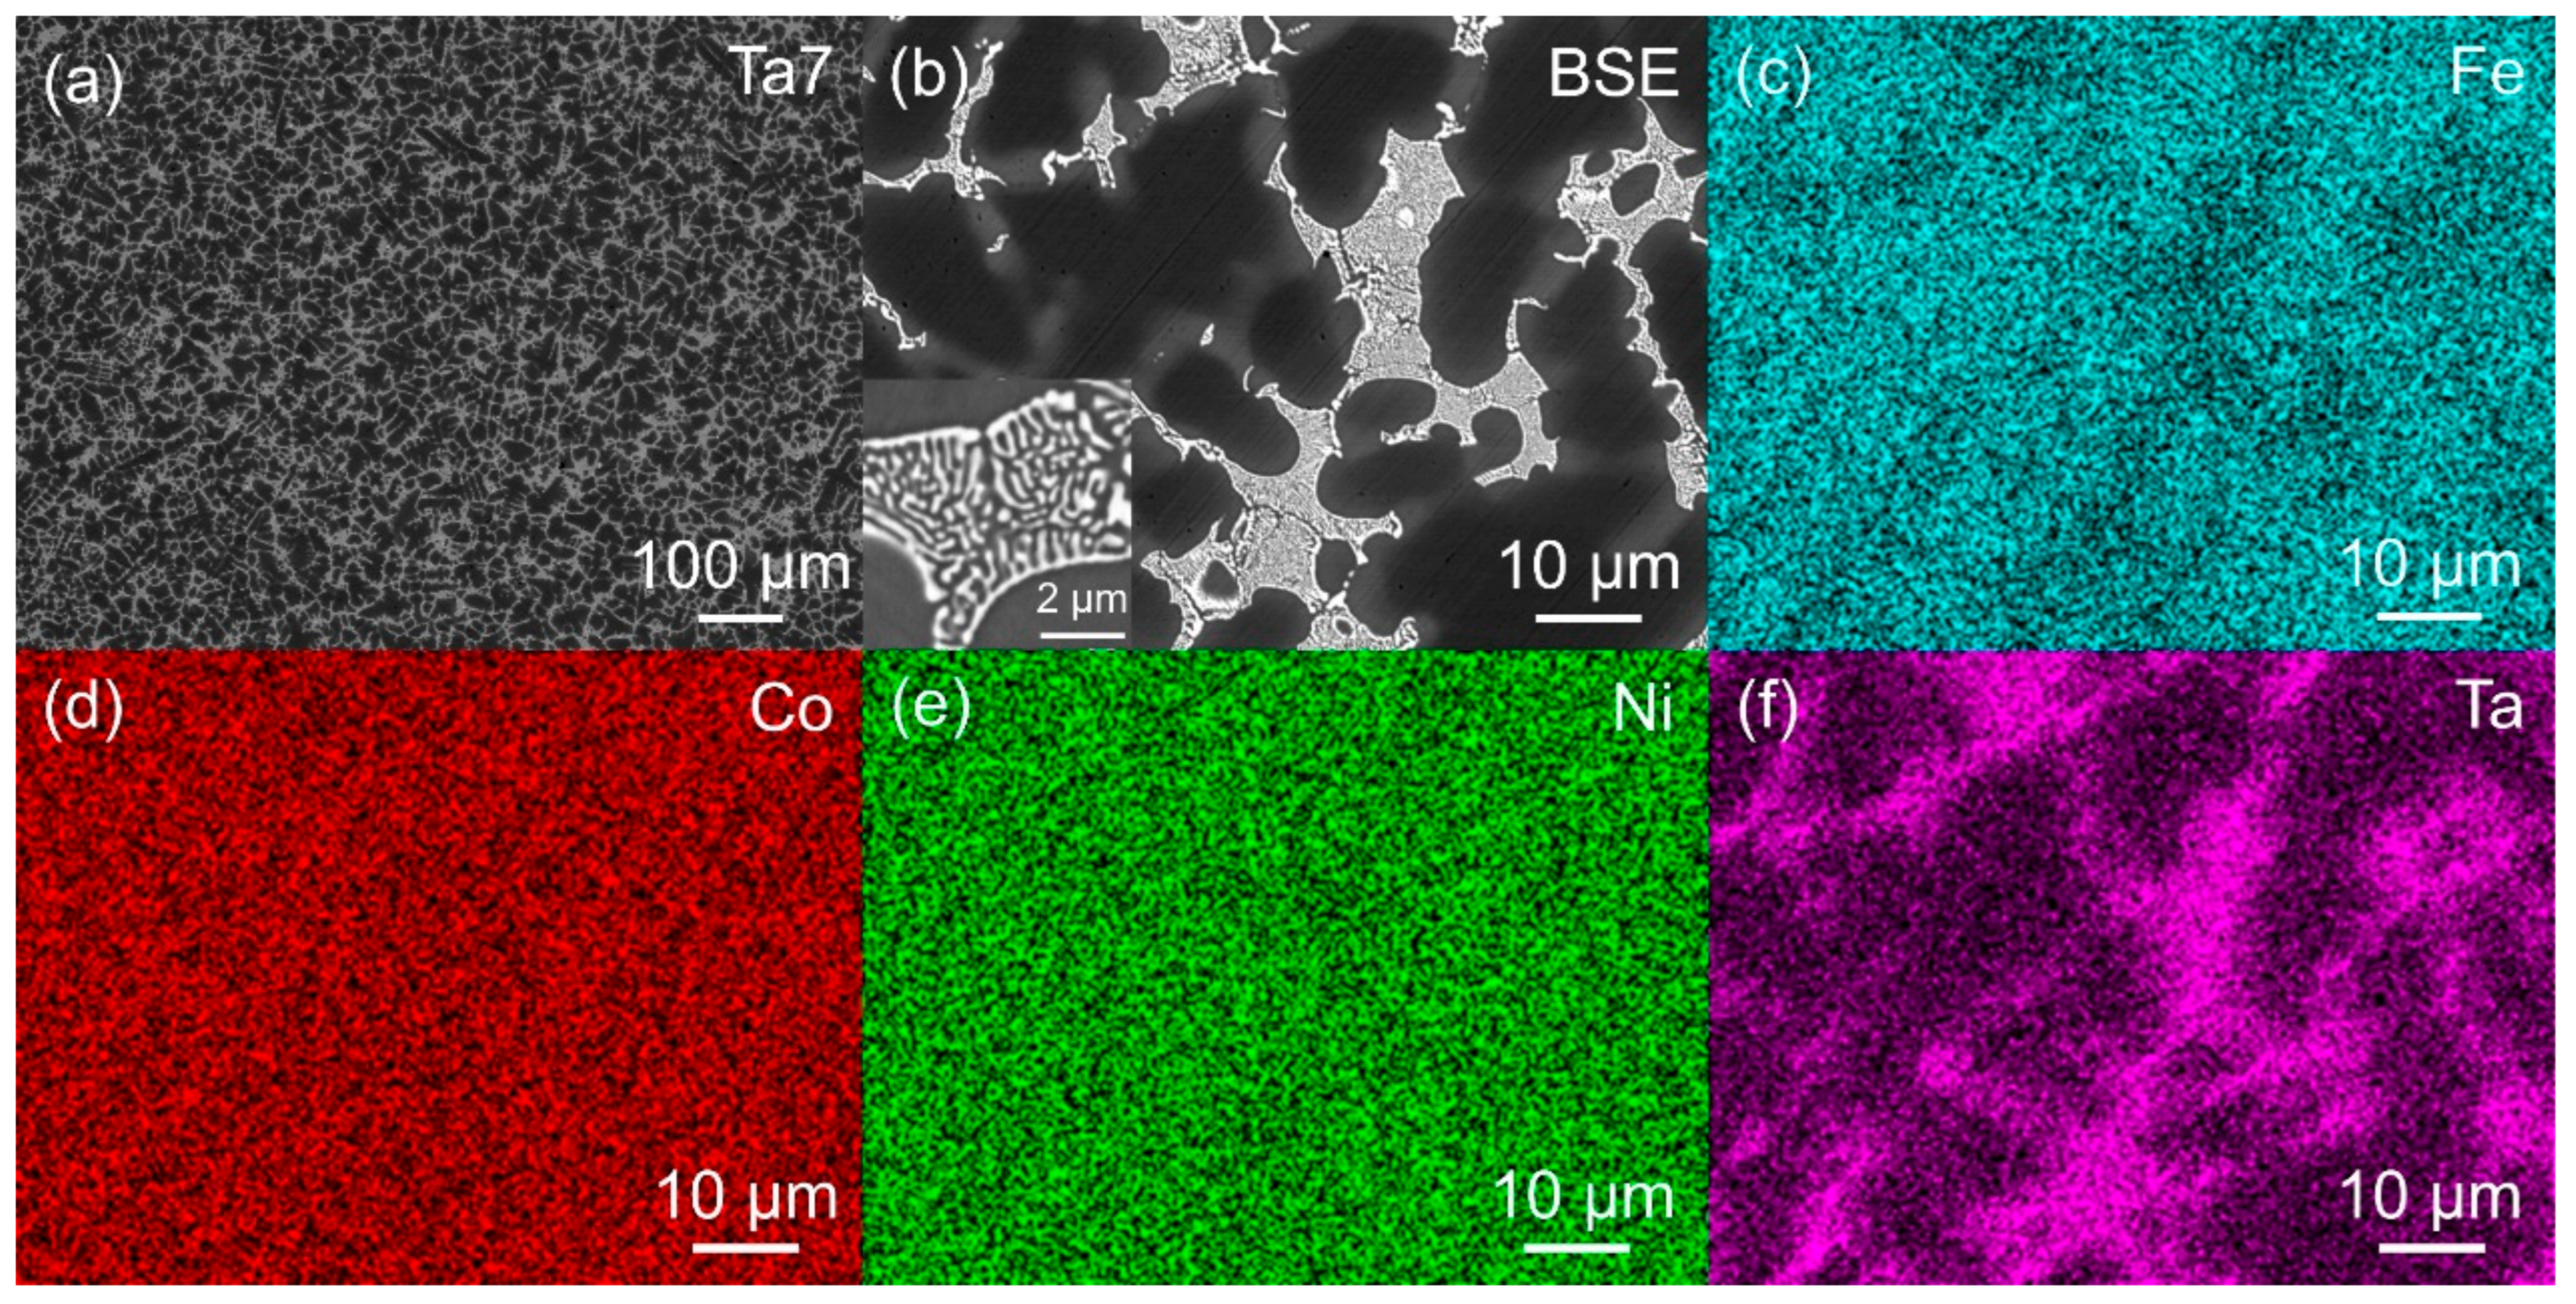
Figure 5.
(a1-c1) Inverse pole figure maps, (a2-c2) phase maps, and (a3-c3) grain boundary maps of (Fe7Co6Ni6)93-xTaxAl7 (x=3, 5, 7) MPEAs, where low-angle grain boundaries (2-15°) were colored red, while high-angle grain boundaries (>15°) were colored black.
Figure 5.
(a1-c1) Inverse pole figure maps, (a2-c2) phase maps, and (a3-c3) grain boundary maps of (Fe7Co6Ni6)93-xTaxAl7 (x=3, 5, 7) MPEAs, where low-angle grain boundaries (2-15°) were colored red, while high-angle grain boundaries (>15°) were colored black.
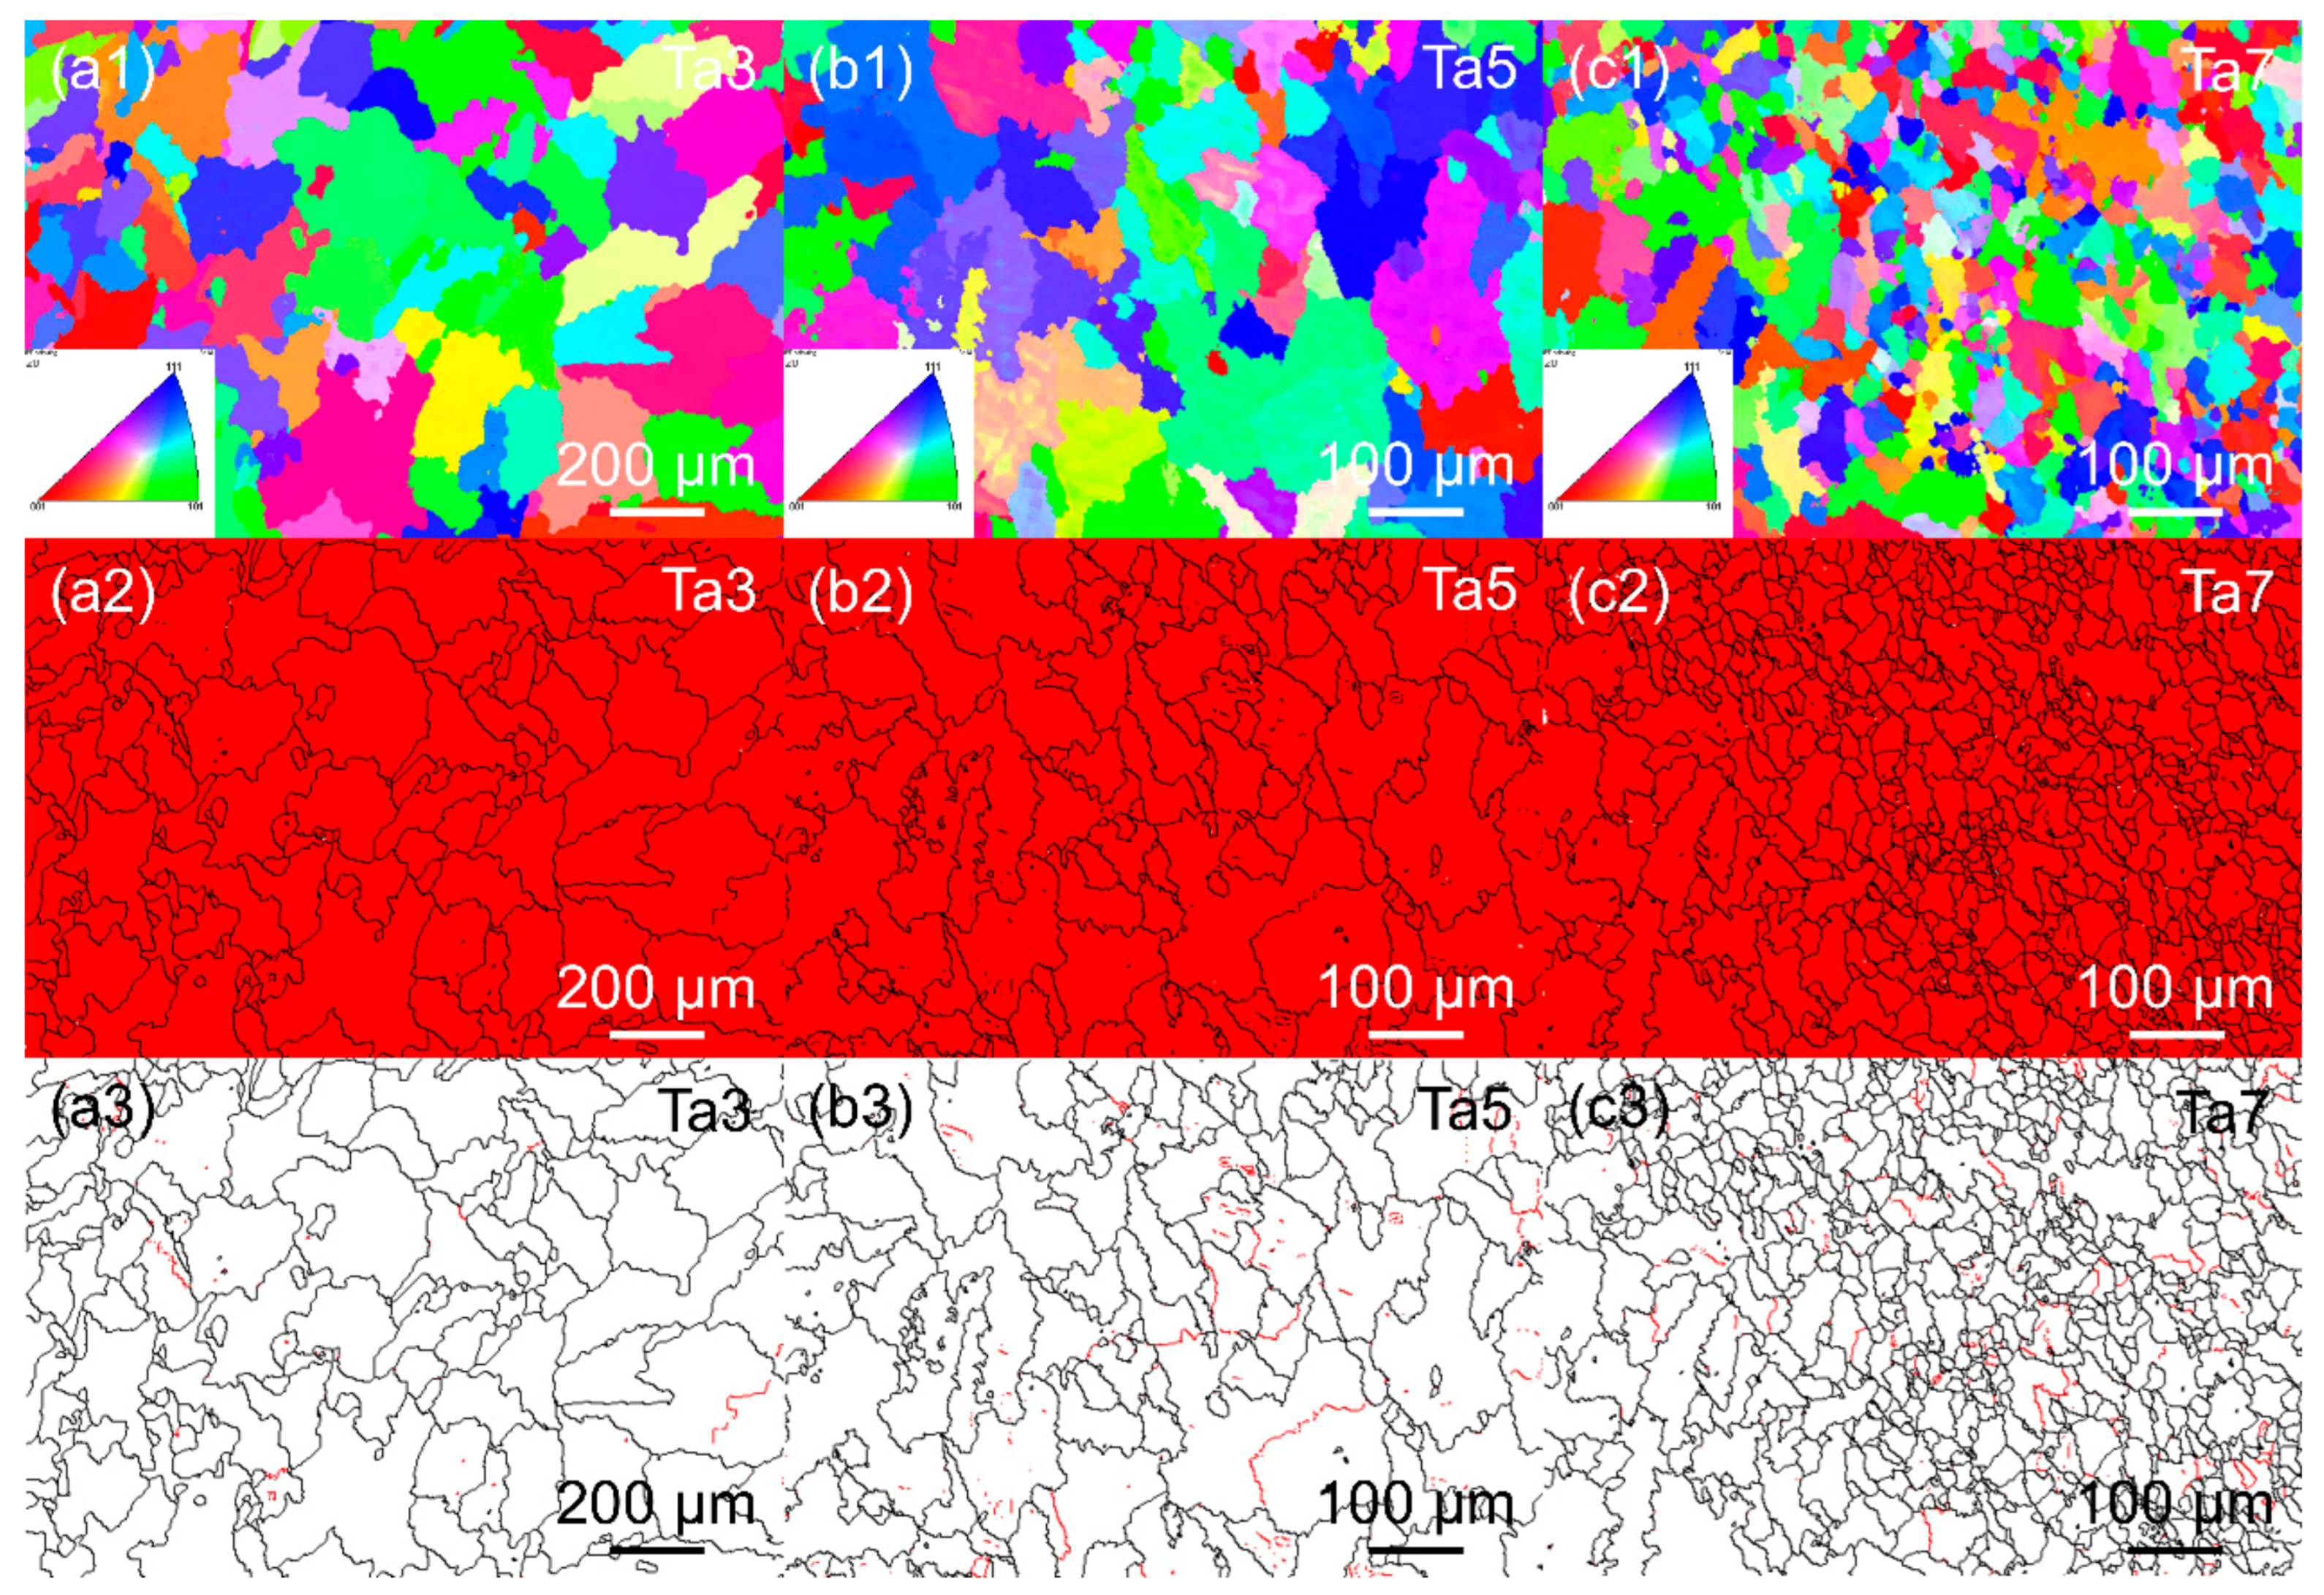
Figure 6.
(a) STEM BF micrograph of (Fe7Co6Ni6)90Ta3Al7alloy; (b-f) EDS elemental maps corresponding to the boxed region in (a).
Figure 6.
(a) STEM BF micrograph of (Fe7Co6Ni6)90Ta3Al7alloy; (b-f) EDS elemental maps corresponding to the boxed region in (a).
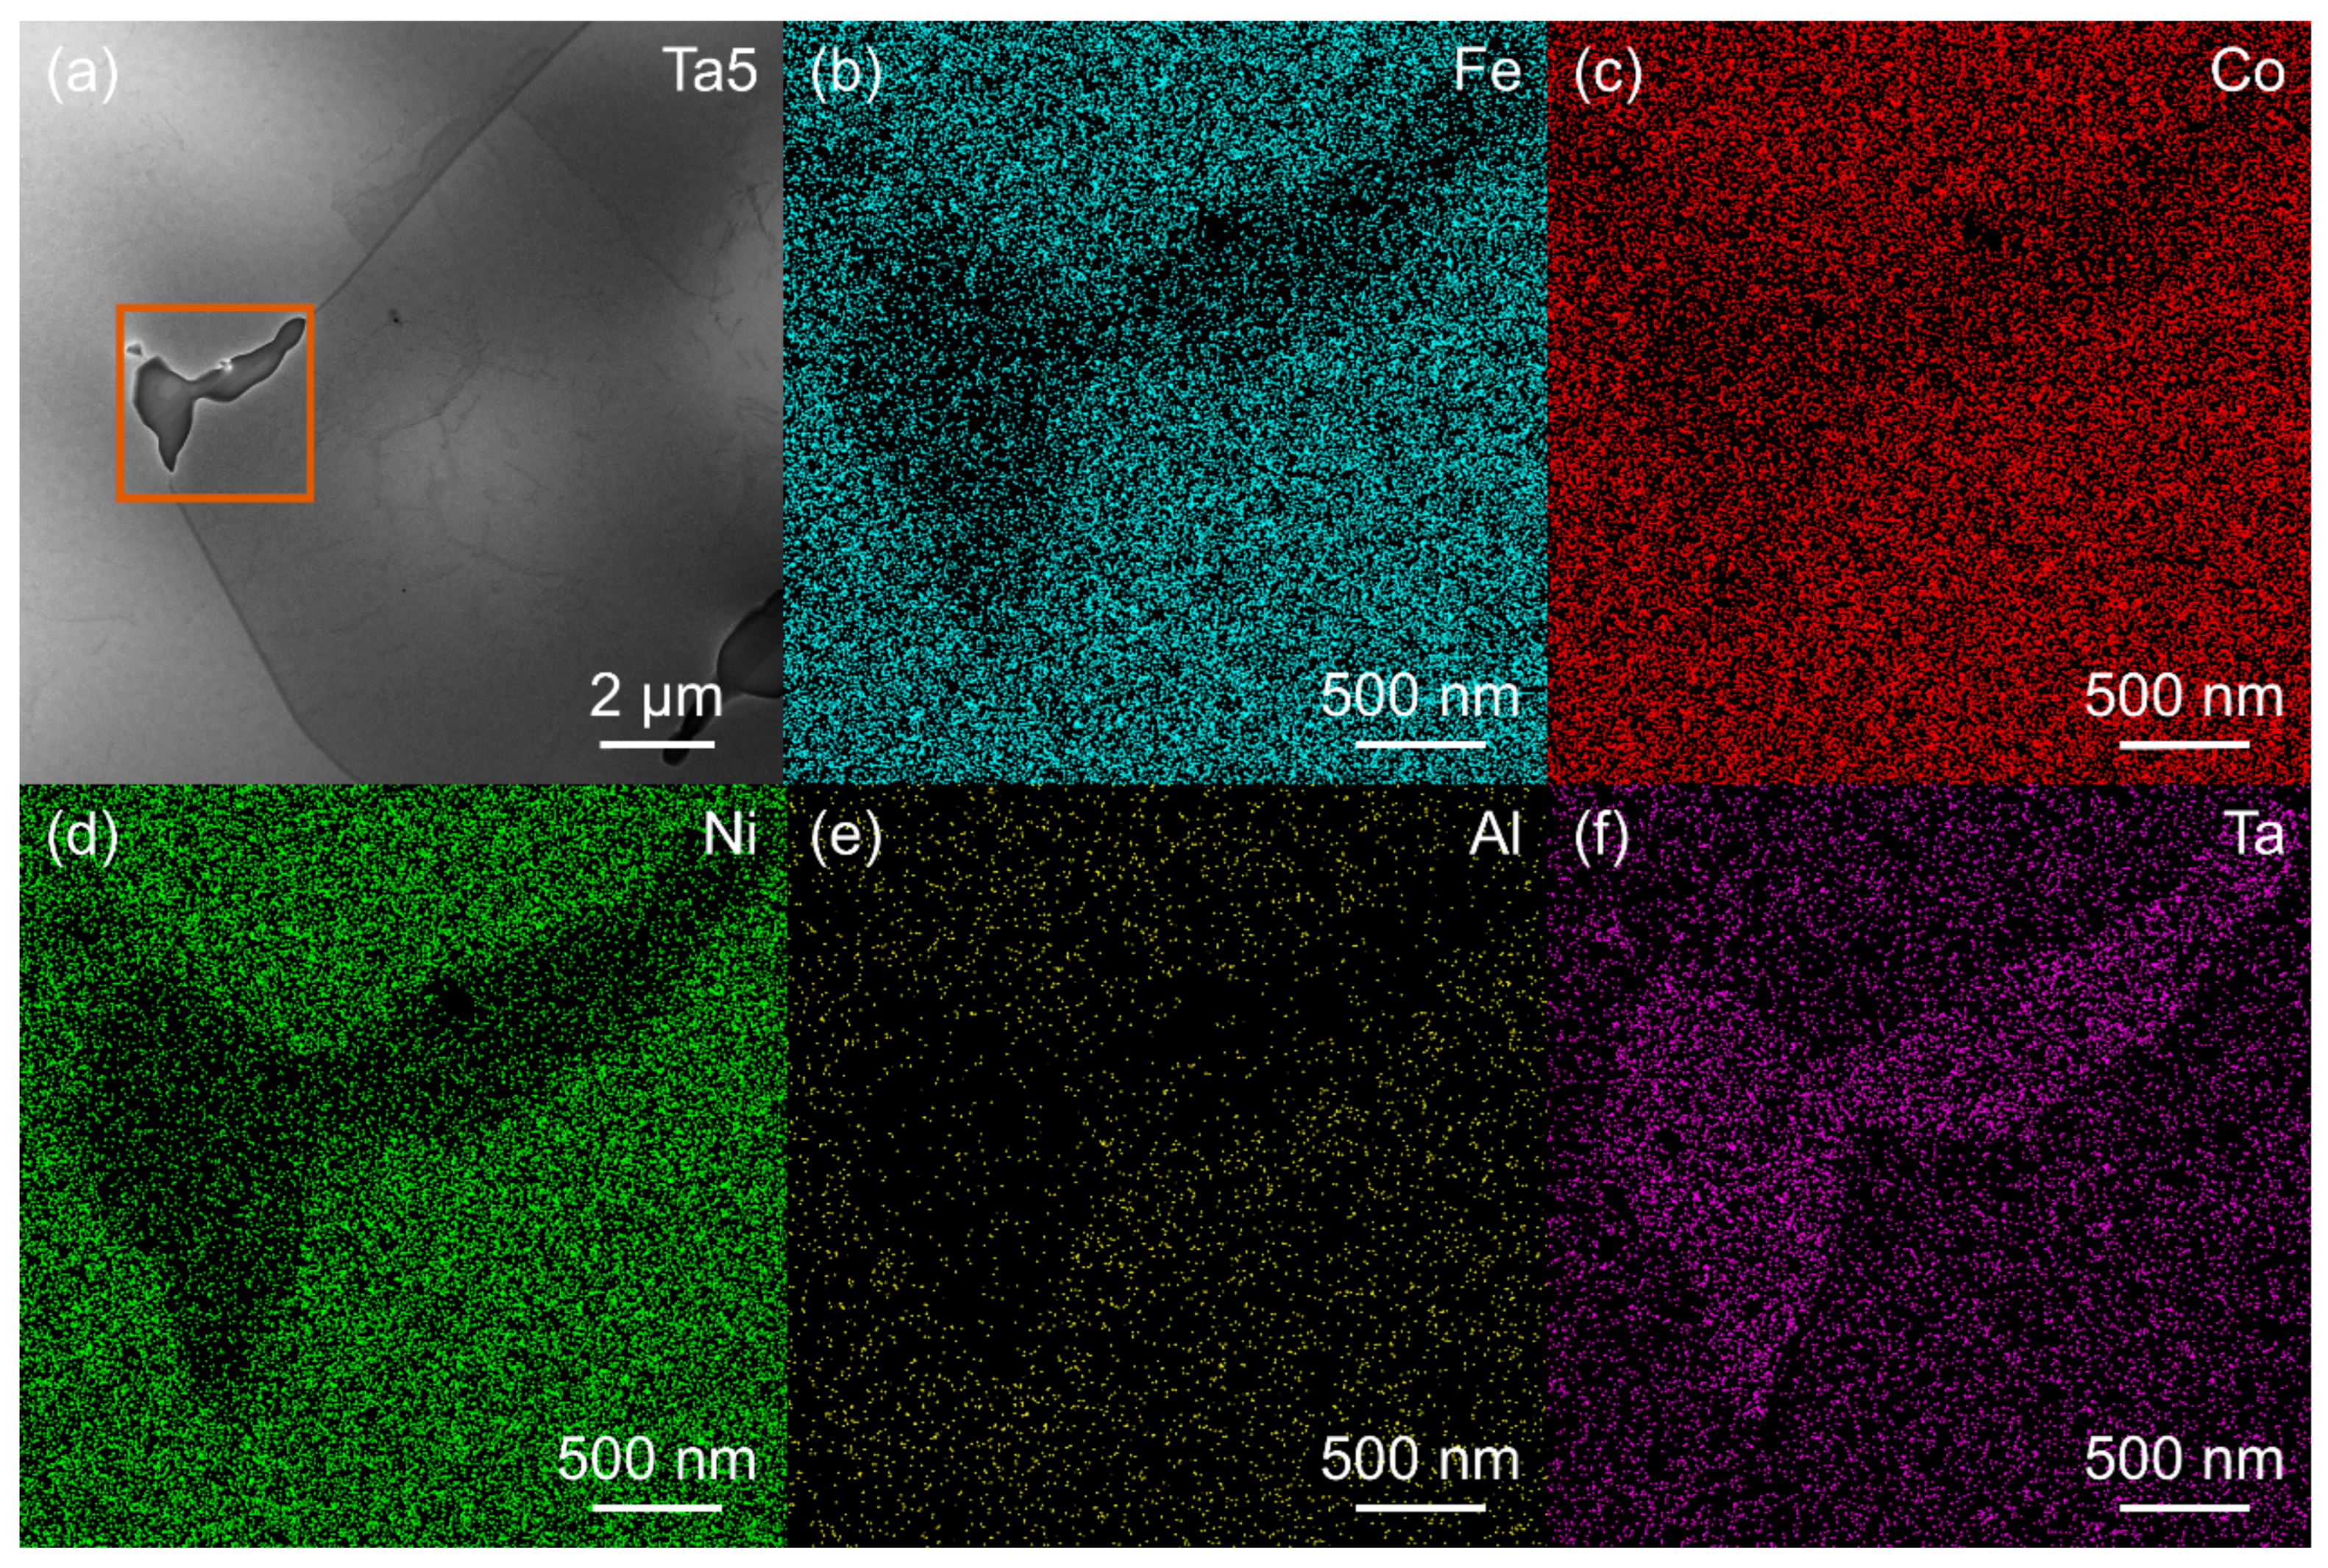
Figure 7.
(a) STEM BF micrograph of the (Fe7Co6Ni6)88Ta5Al7 alloy; (b-f) EDS elemental maps corresponding to the boxed region in (a).
Figure 7.
(a) STEM BF micrograph of the (Fe7Co6Ni6)88Ta5Al7 alloy; (b-f) EDS elemental maps corresponding to the boxed region in (a).
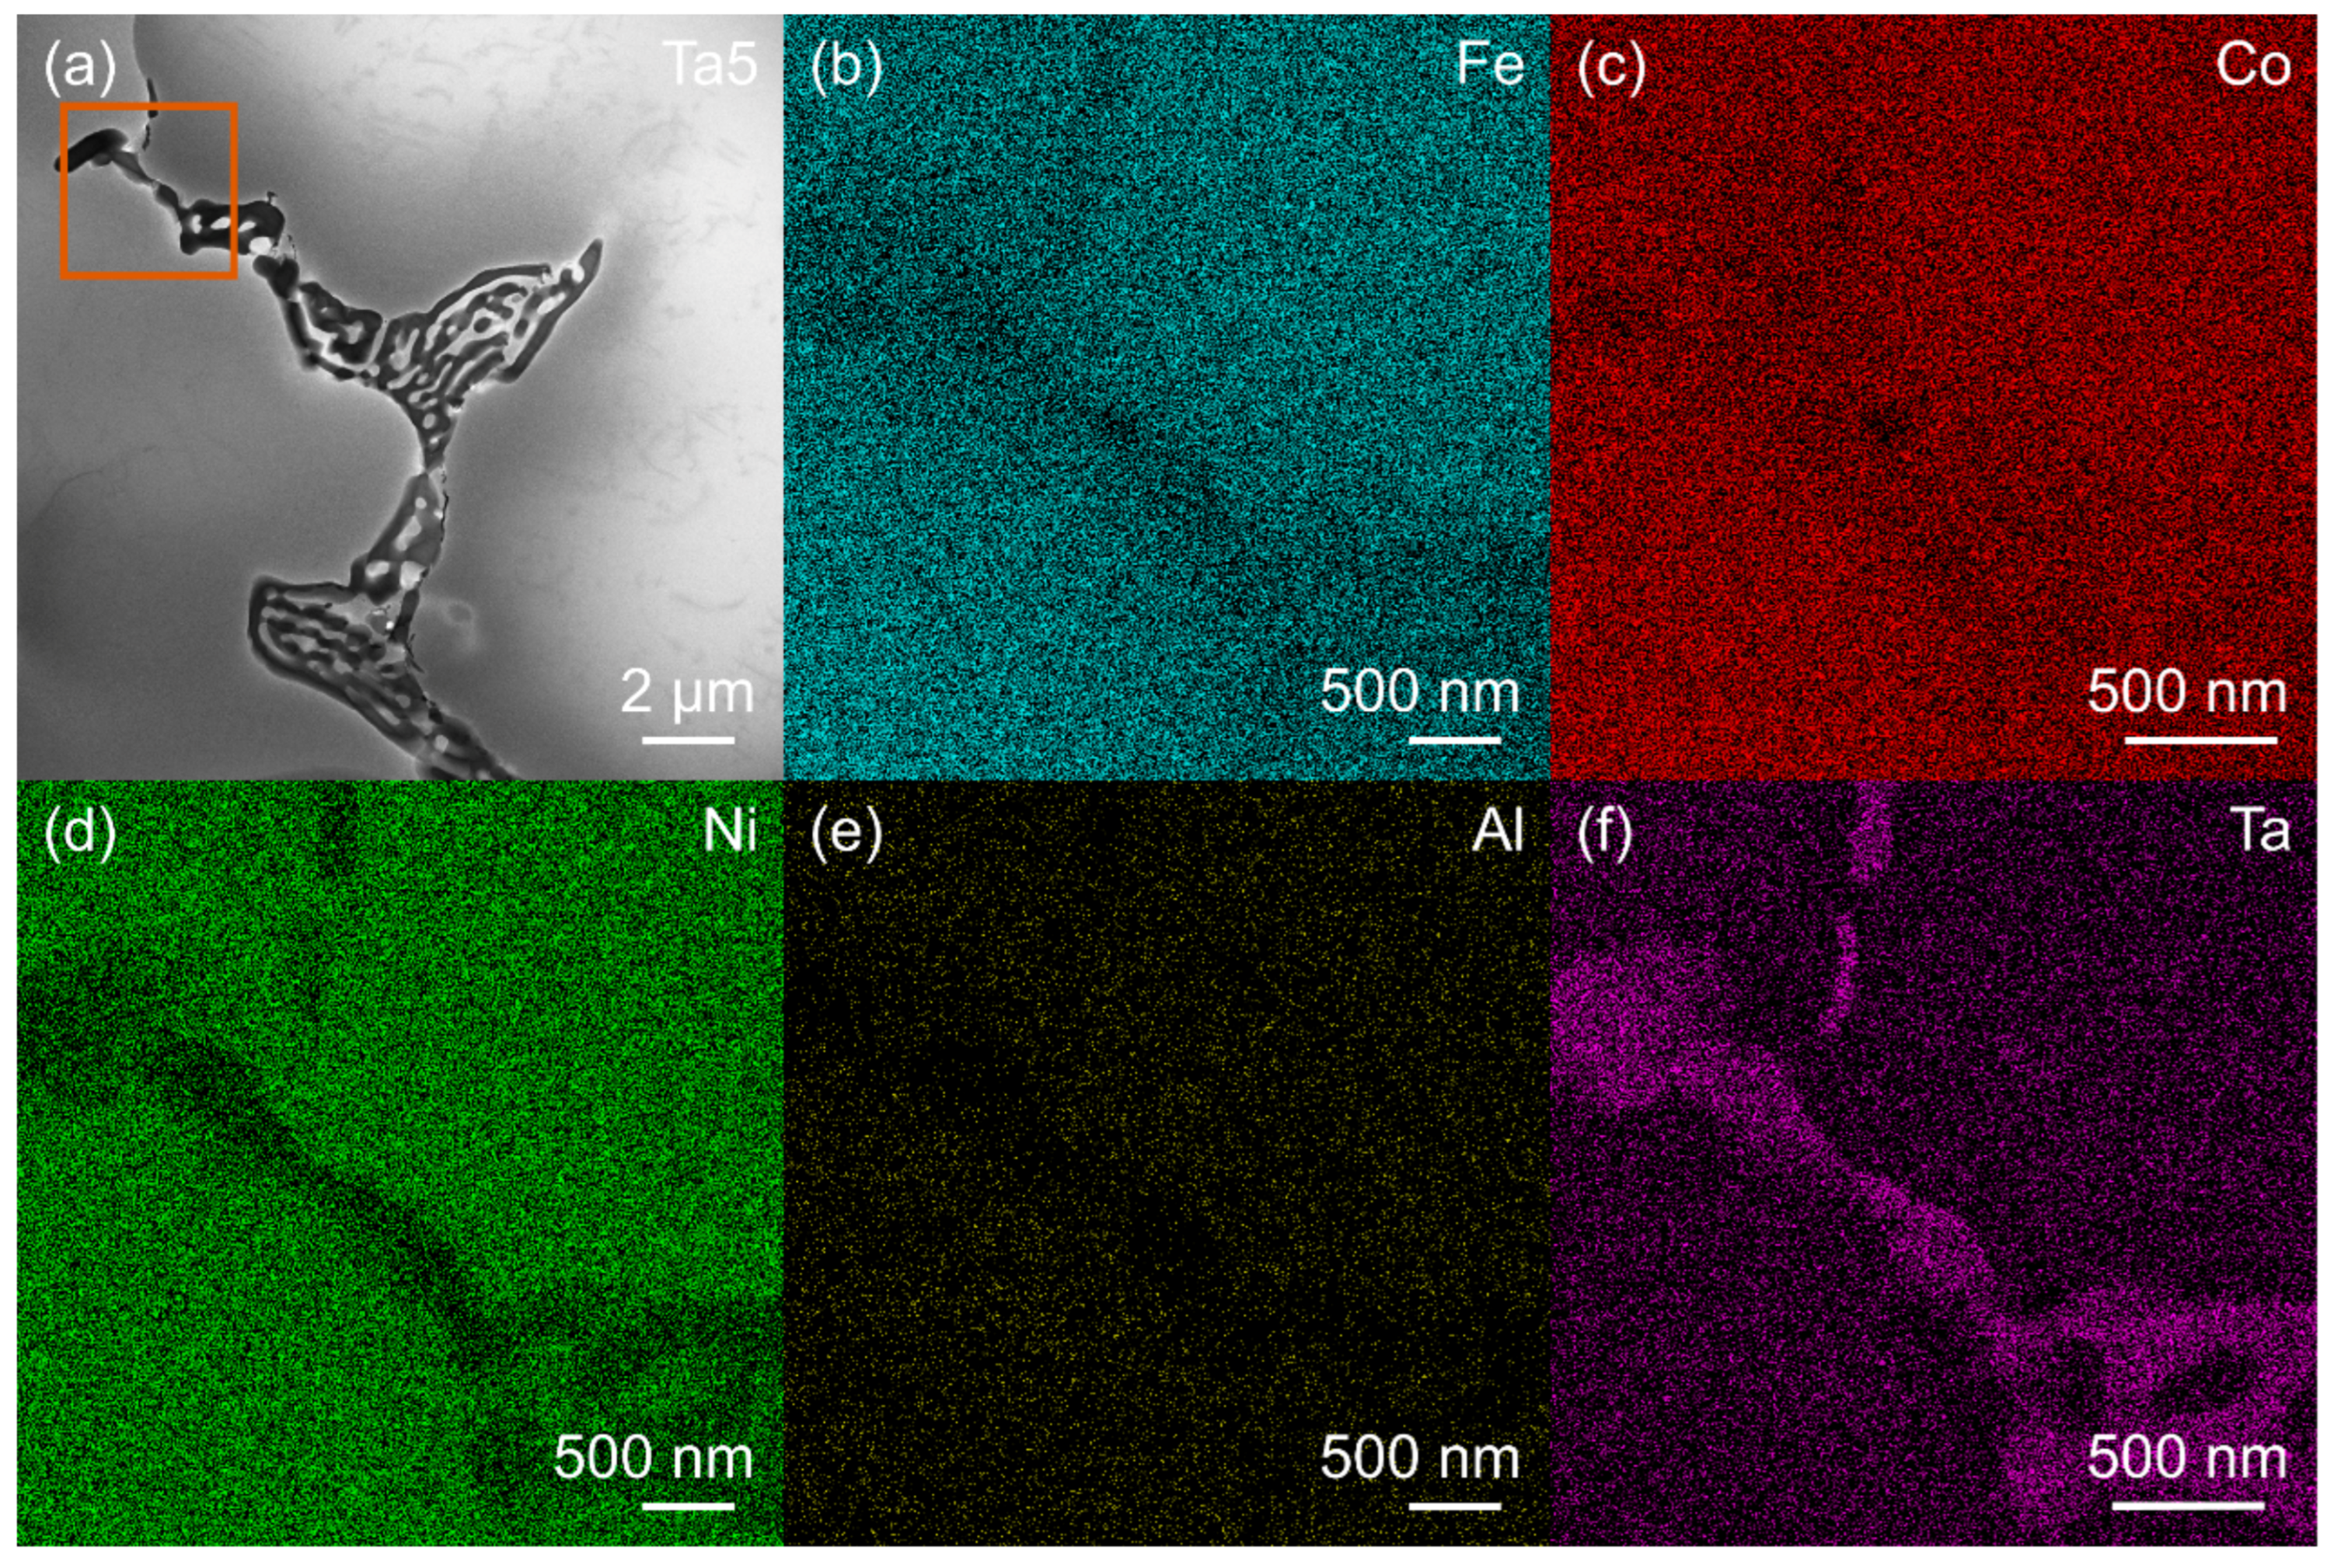
Figure 8.
(a) STEM BF micrograph of the (Fe7Co6Ni6)86Ta7Al7 alloy; (b-f) EDS elemental maps corresponding to the marked region in (a).
Figure 8.
(a) STEM BF micrograph of the (Fe7Co6Ni6)86Ta7Al7 alloy; (b-f) EDS elemental maps corresponding to the marked region in (a).
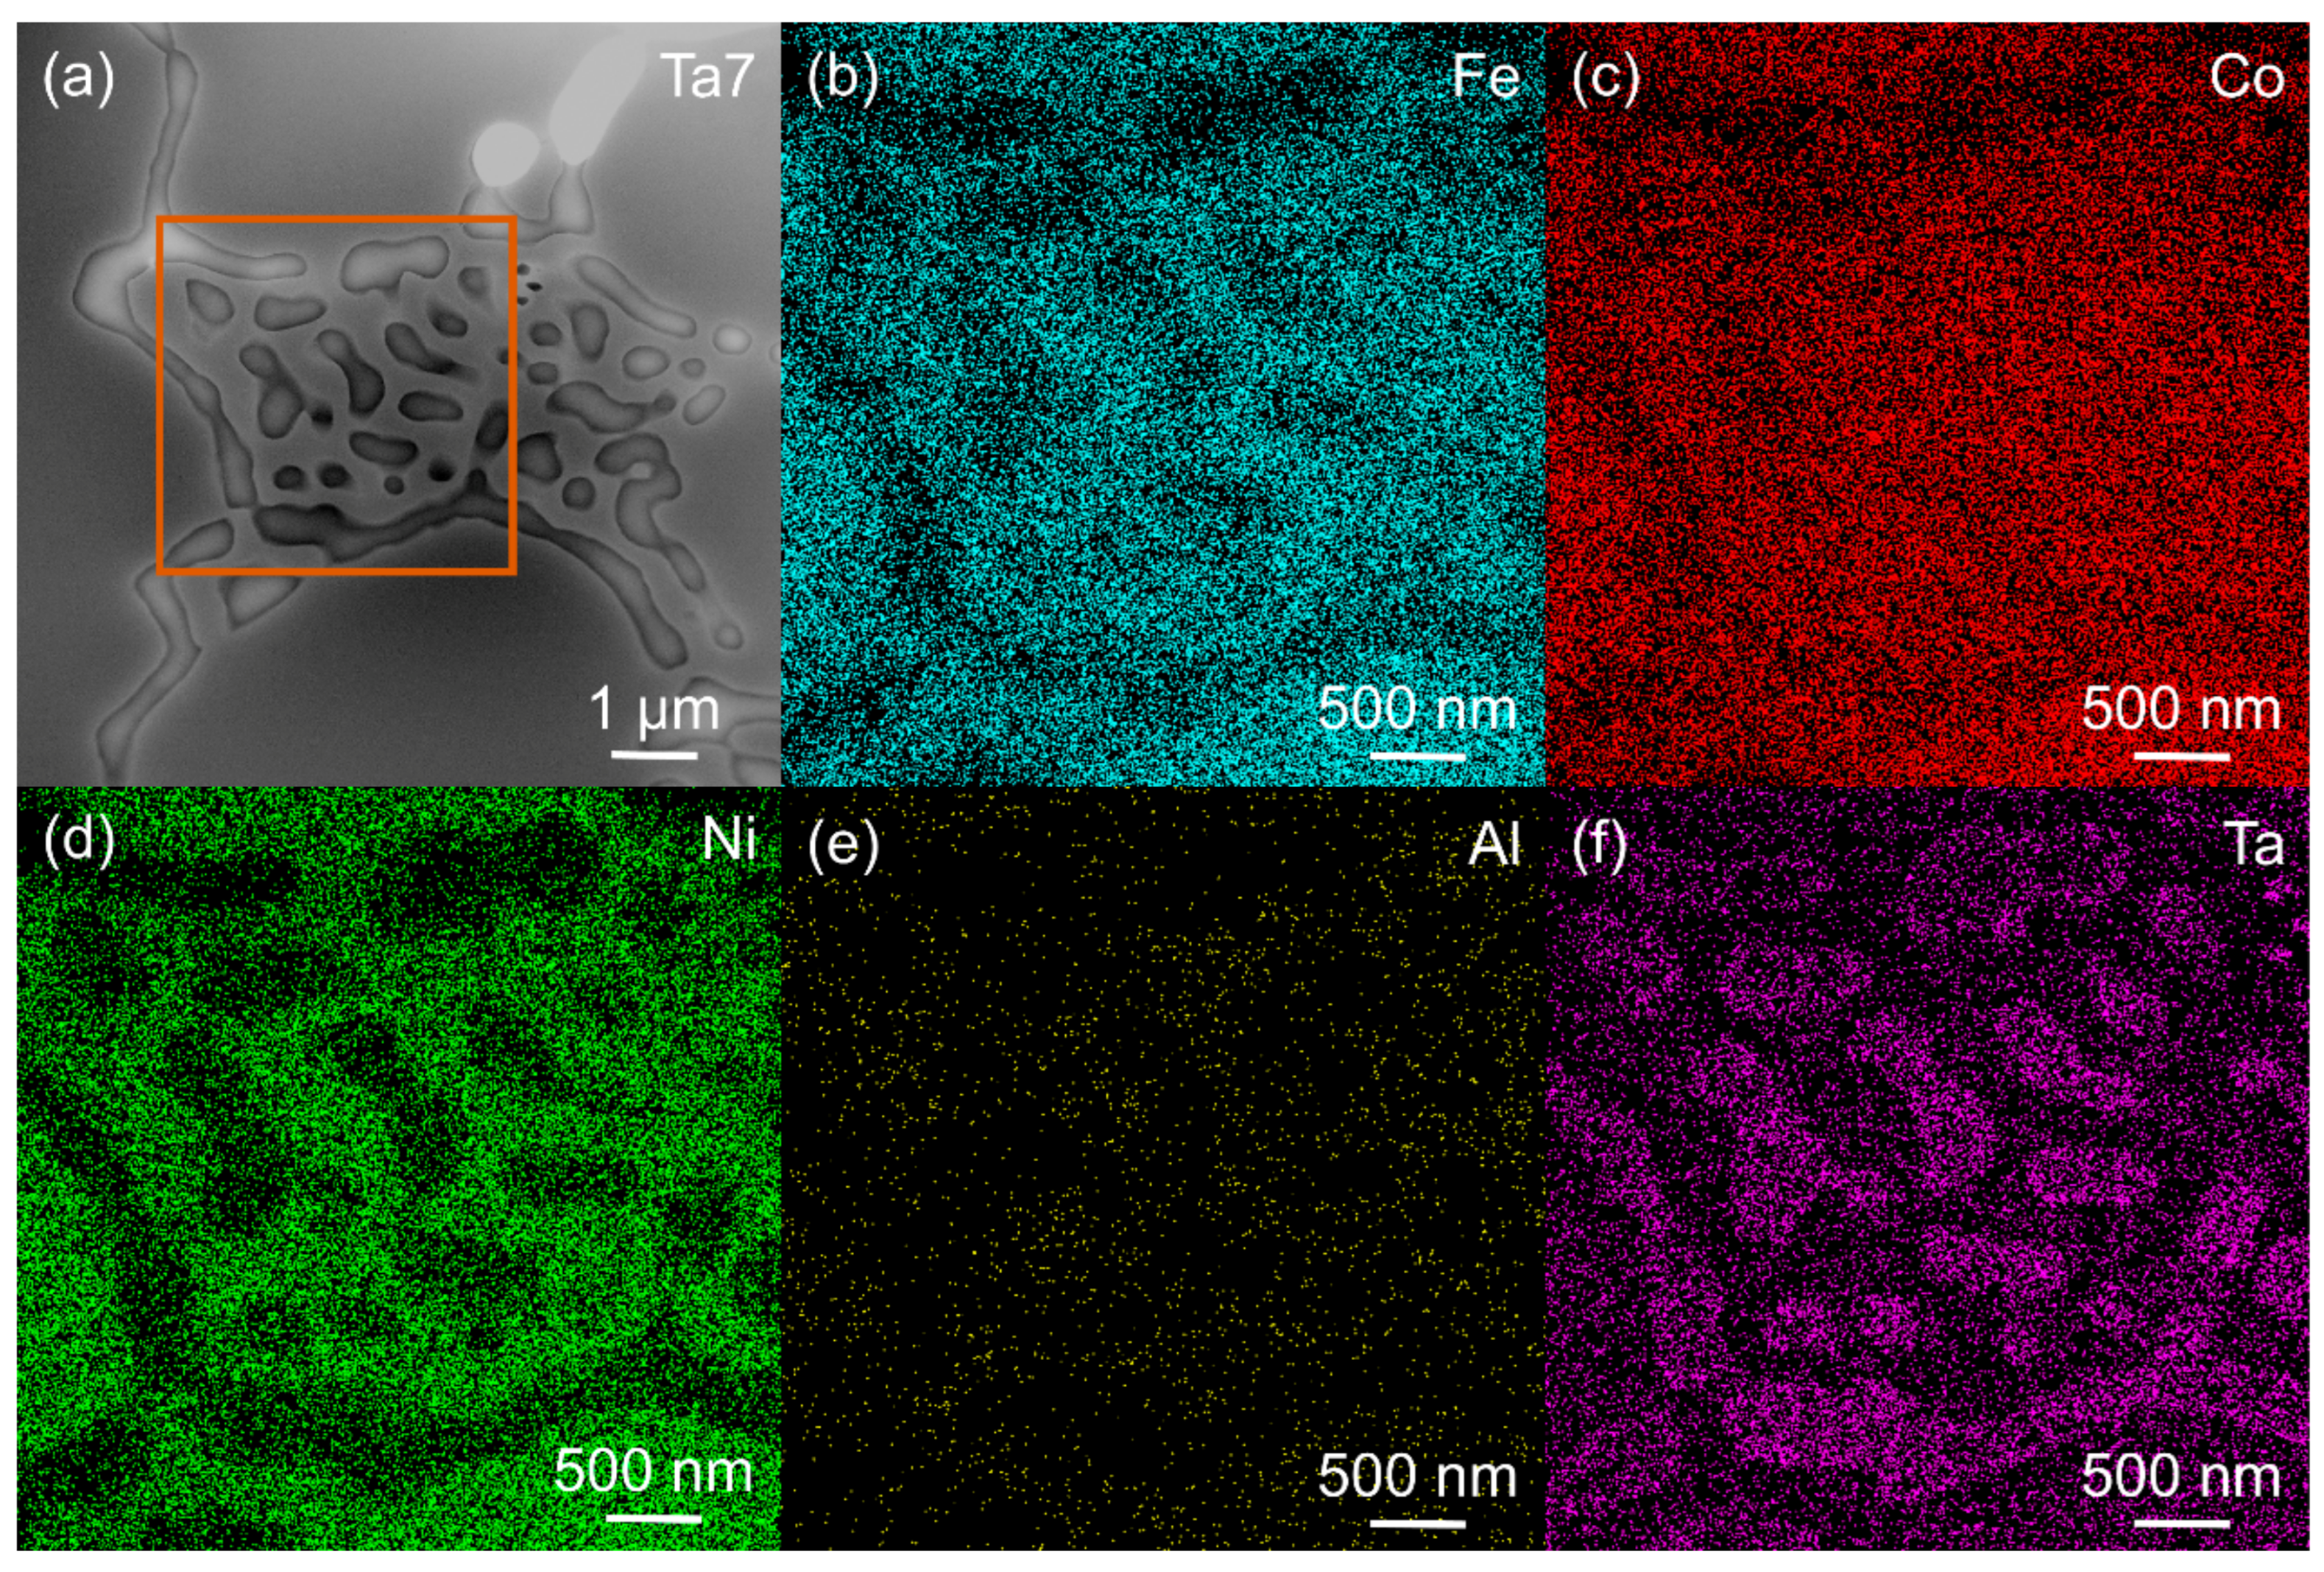
Figure 9.
(a1-a3) TEM BF micrographs of Ta3, Ta5, and Ta7 MPEAs, where the green boxes and blue boxes indicated Ta-depleted matrix regions and Ta-rich secondary phases, respectively; (b1-b3) SAED patterns corresponding to the matrix regions marked by green boxes; (c1-c3) SAED patterns from the Ta-rich secondary phase indicated by the blue boxes.
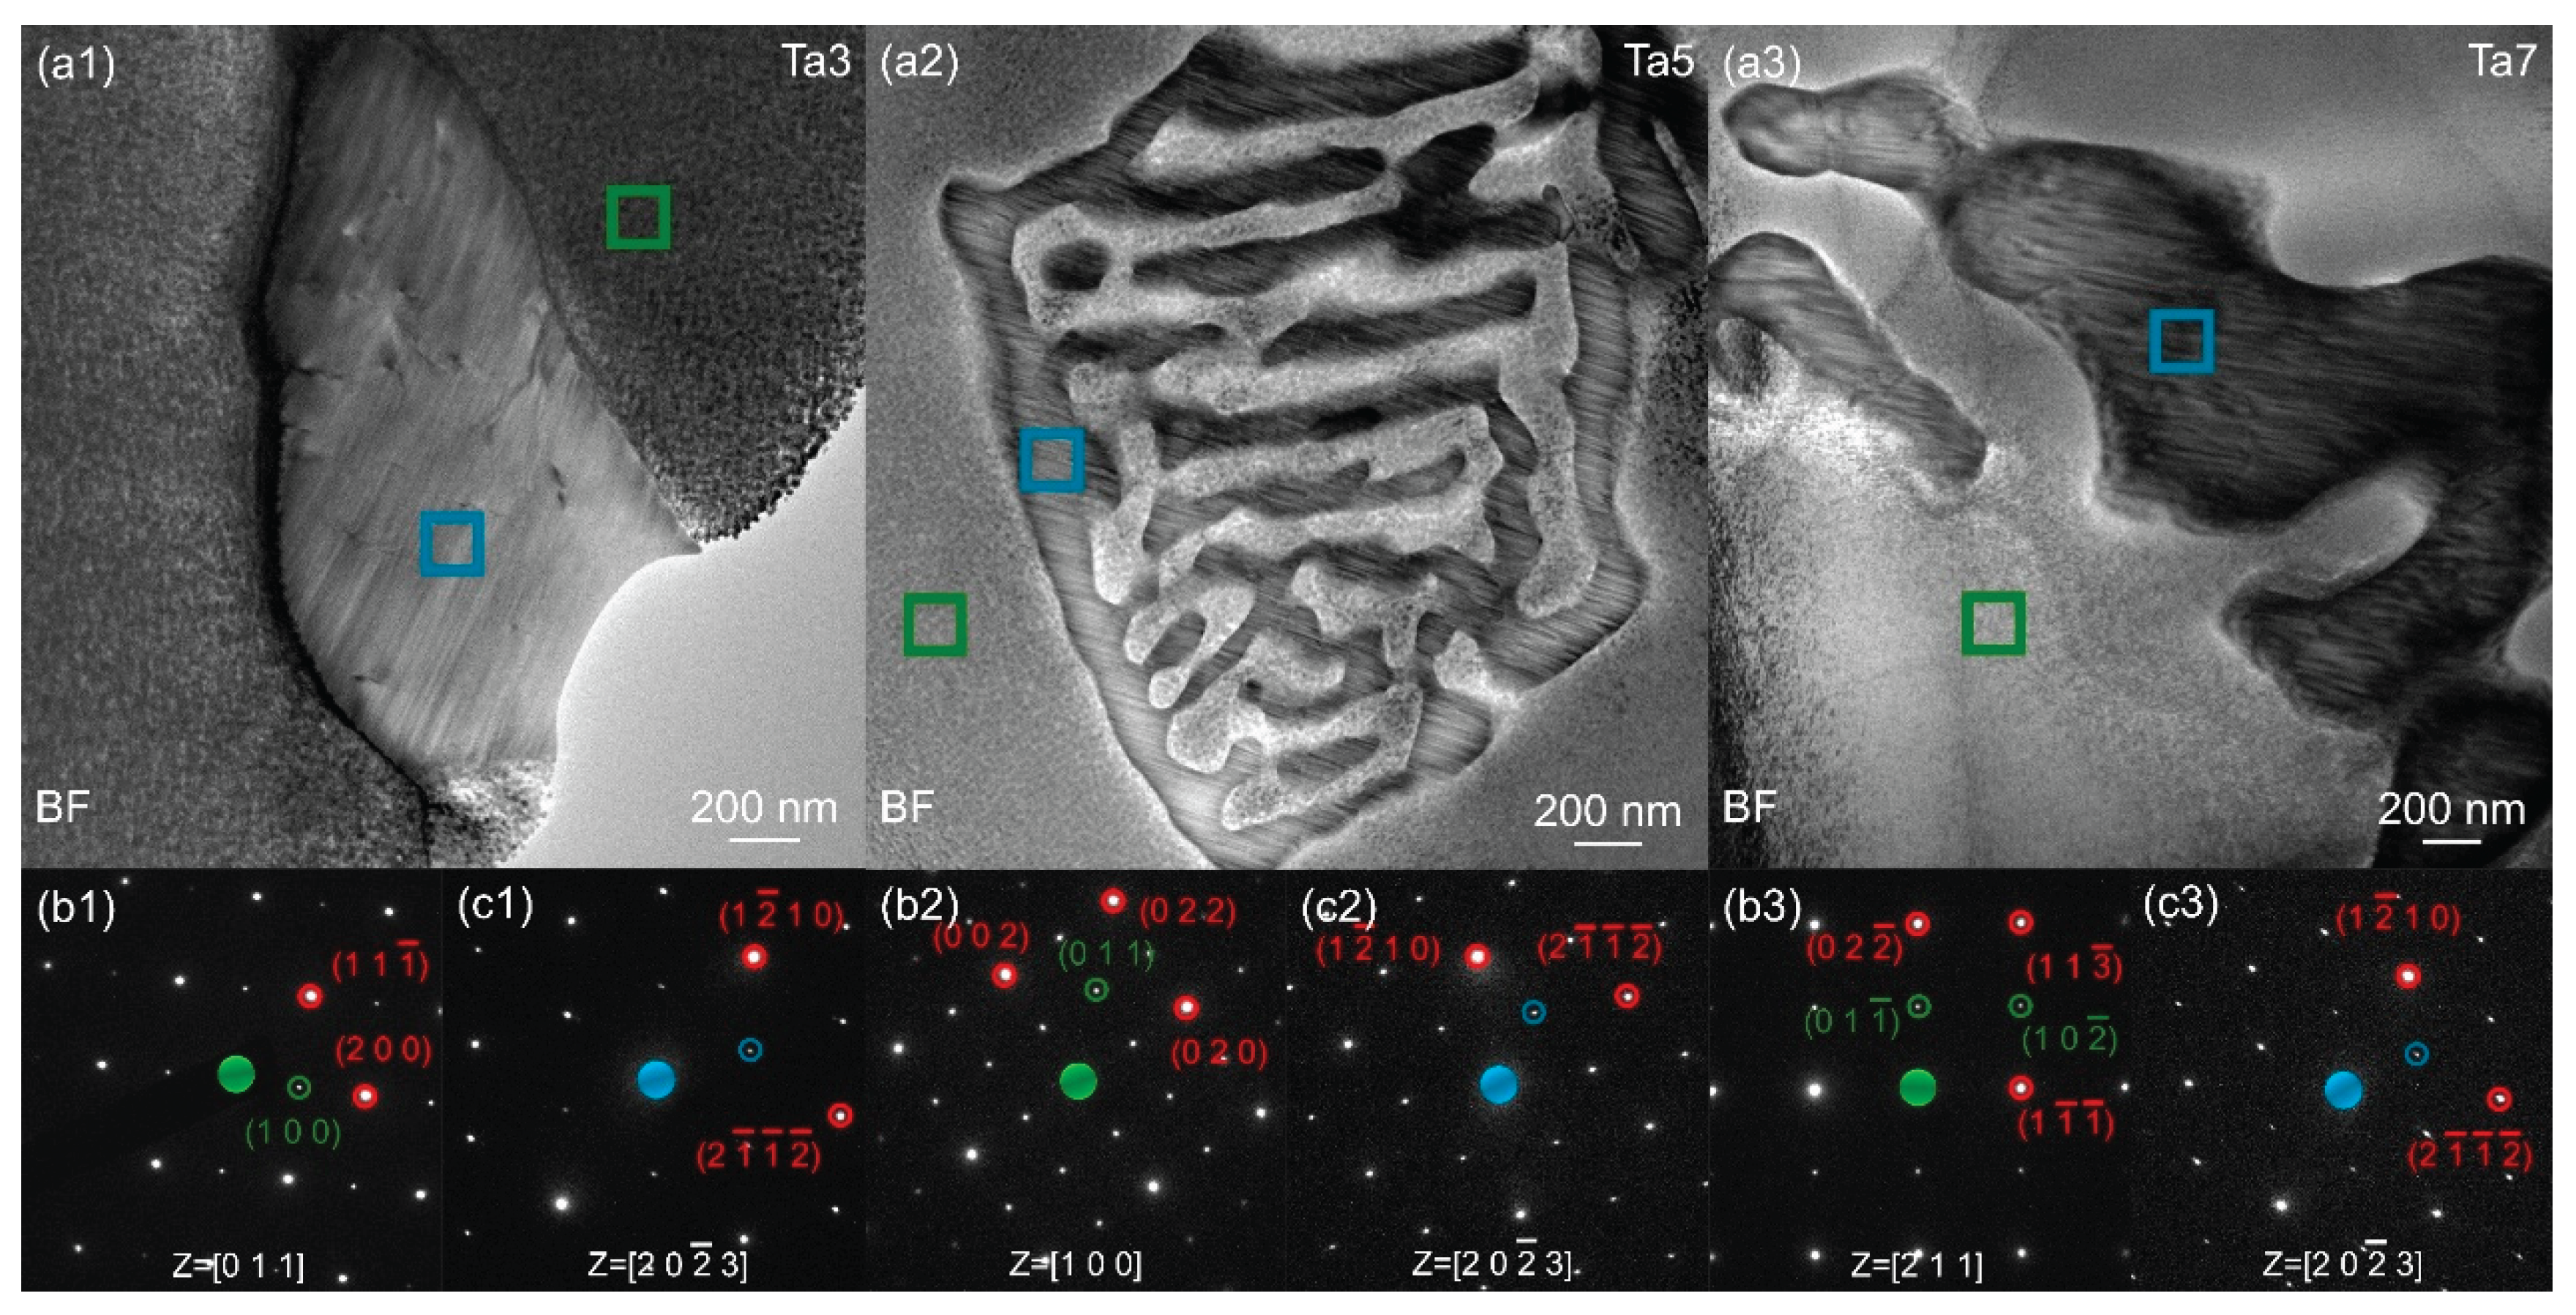
Figure 10.
(a) The HR-TEM micrograph of the (Fe7Co6Ni6)90Ta3Al7 alloy. The inset shows the FFT pattern of the interfacial region, with green and blue circles indicating diffraction spots from the FCC and Laves phases, respectively. (b-c) FFT and IFFT of the matrix, and (d-e) FFT and IFFT of the secondary phase.
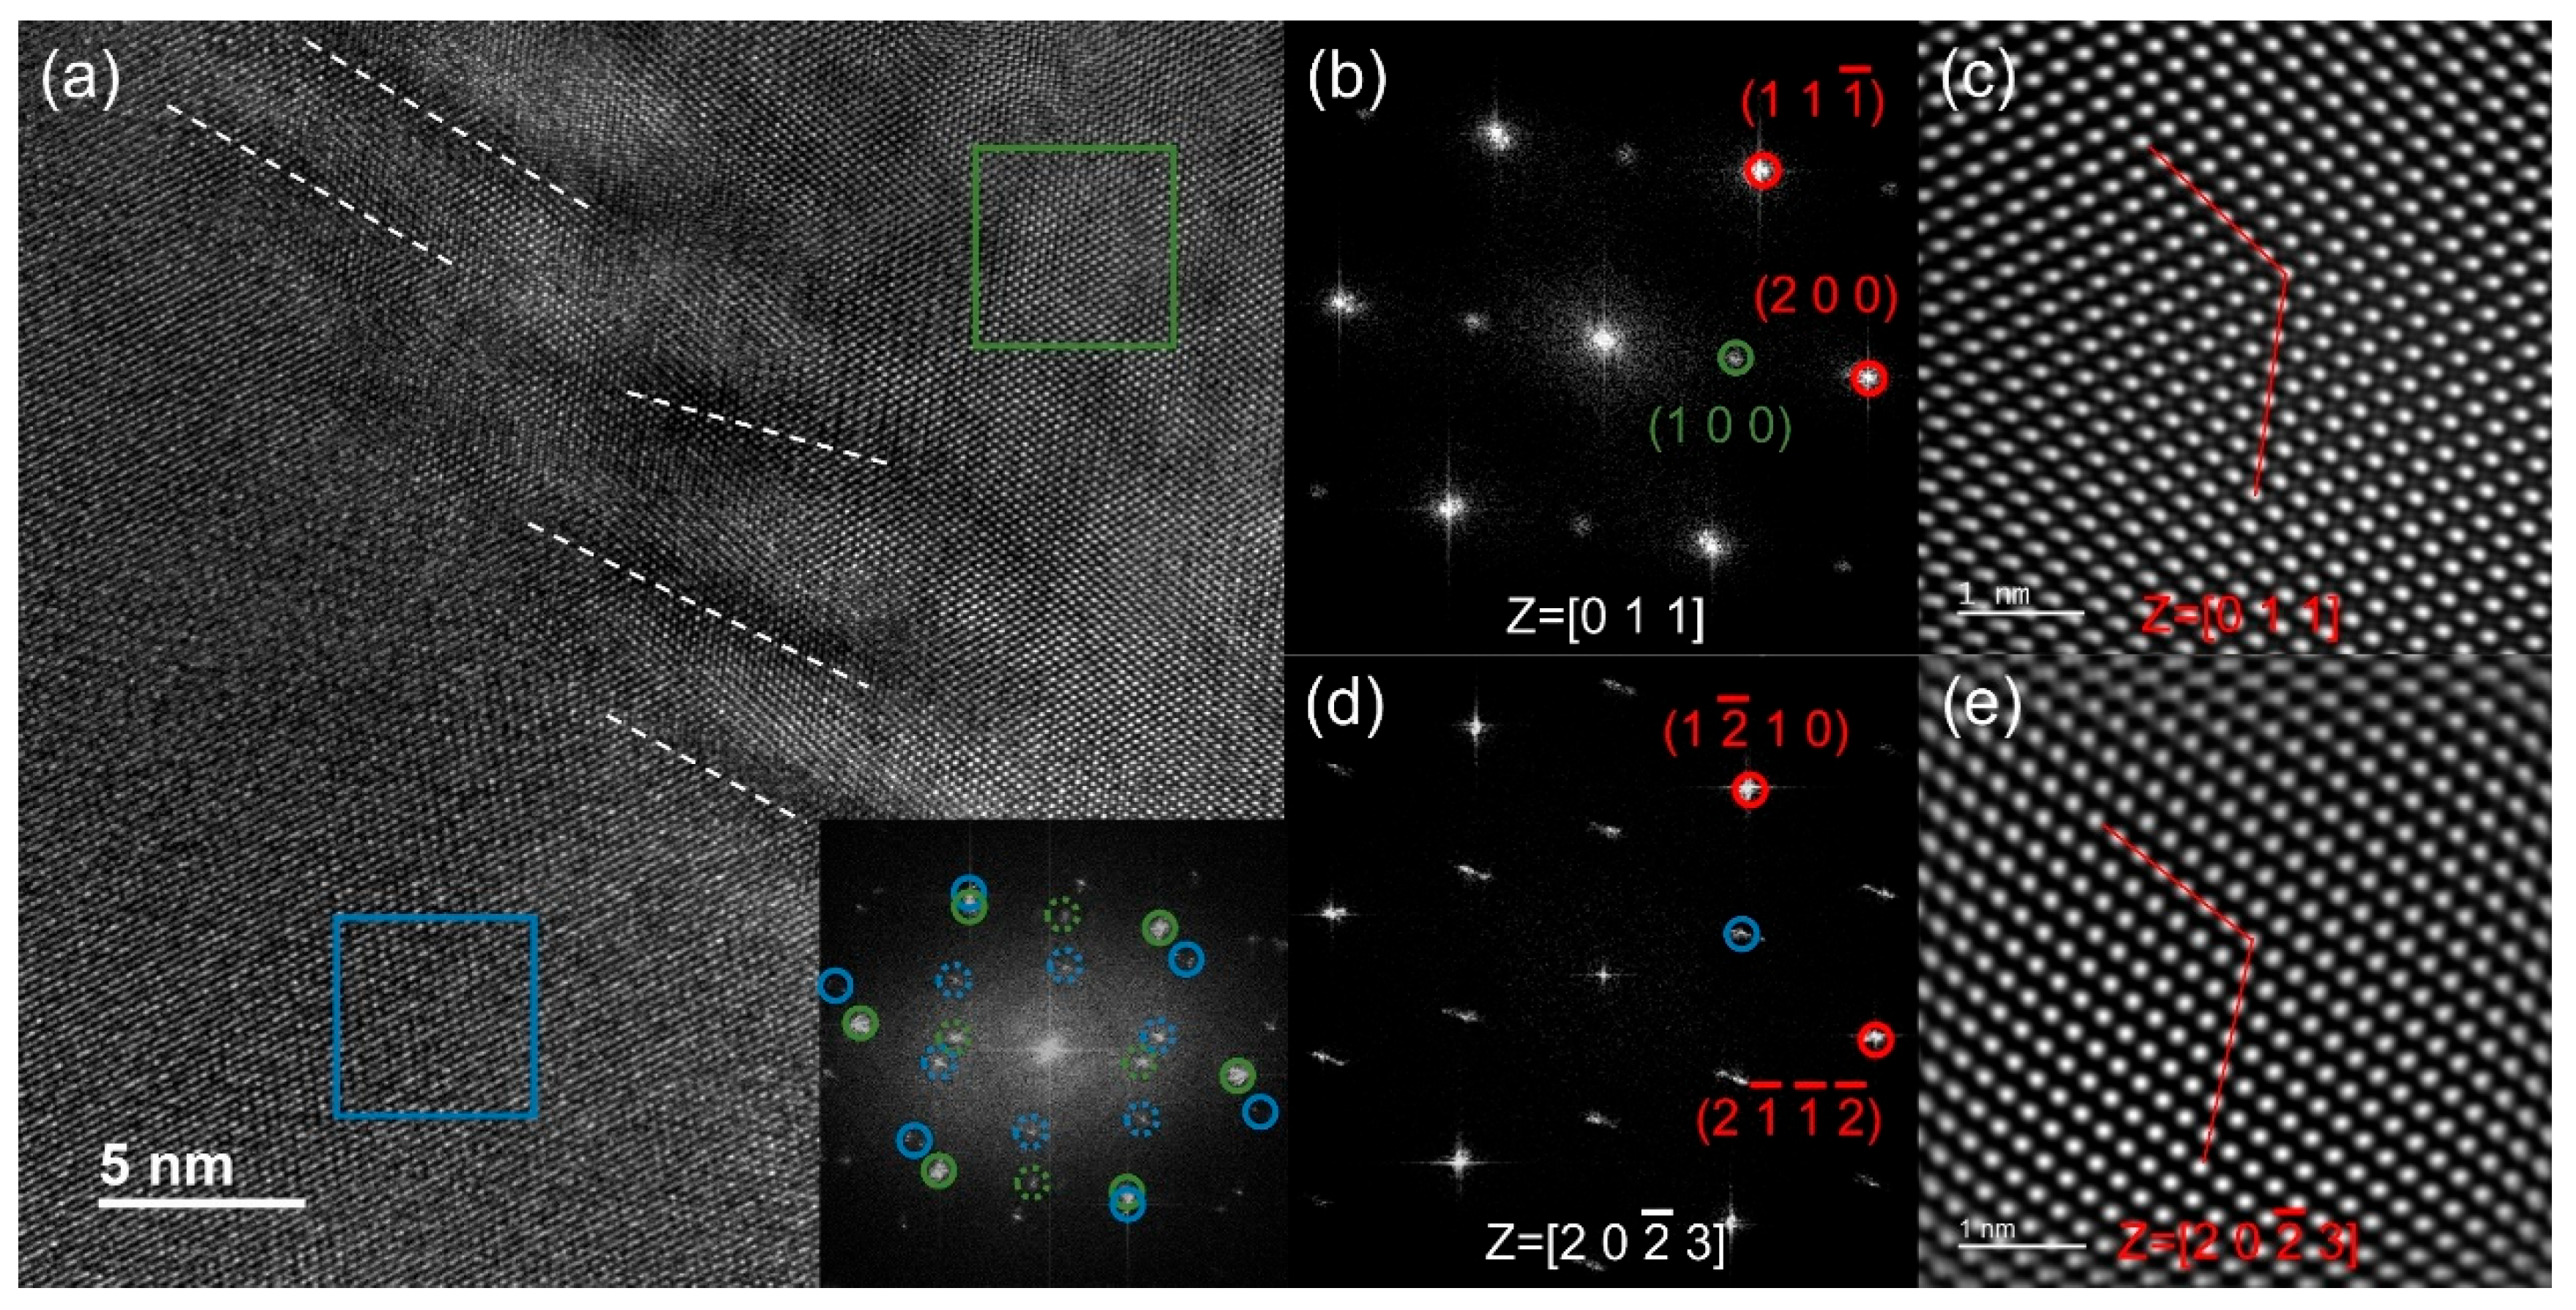
Figure 11.
(a) Room-temperature magnetization measurements of the (Fe7Co6Ni6)93-xTaxAl7(x=3、5、7) alloys; (b) A partial enlarged view of the hysteresis loops near the origin.
Figure 11.
(a) Room-temperature magnetization measurements of the (Fe7Co6Ni6)93-xTaxAl7(x=3、5、7) alloys; (b) A partial enlarged view of the hysteresis loops near the origin.
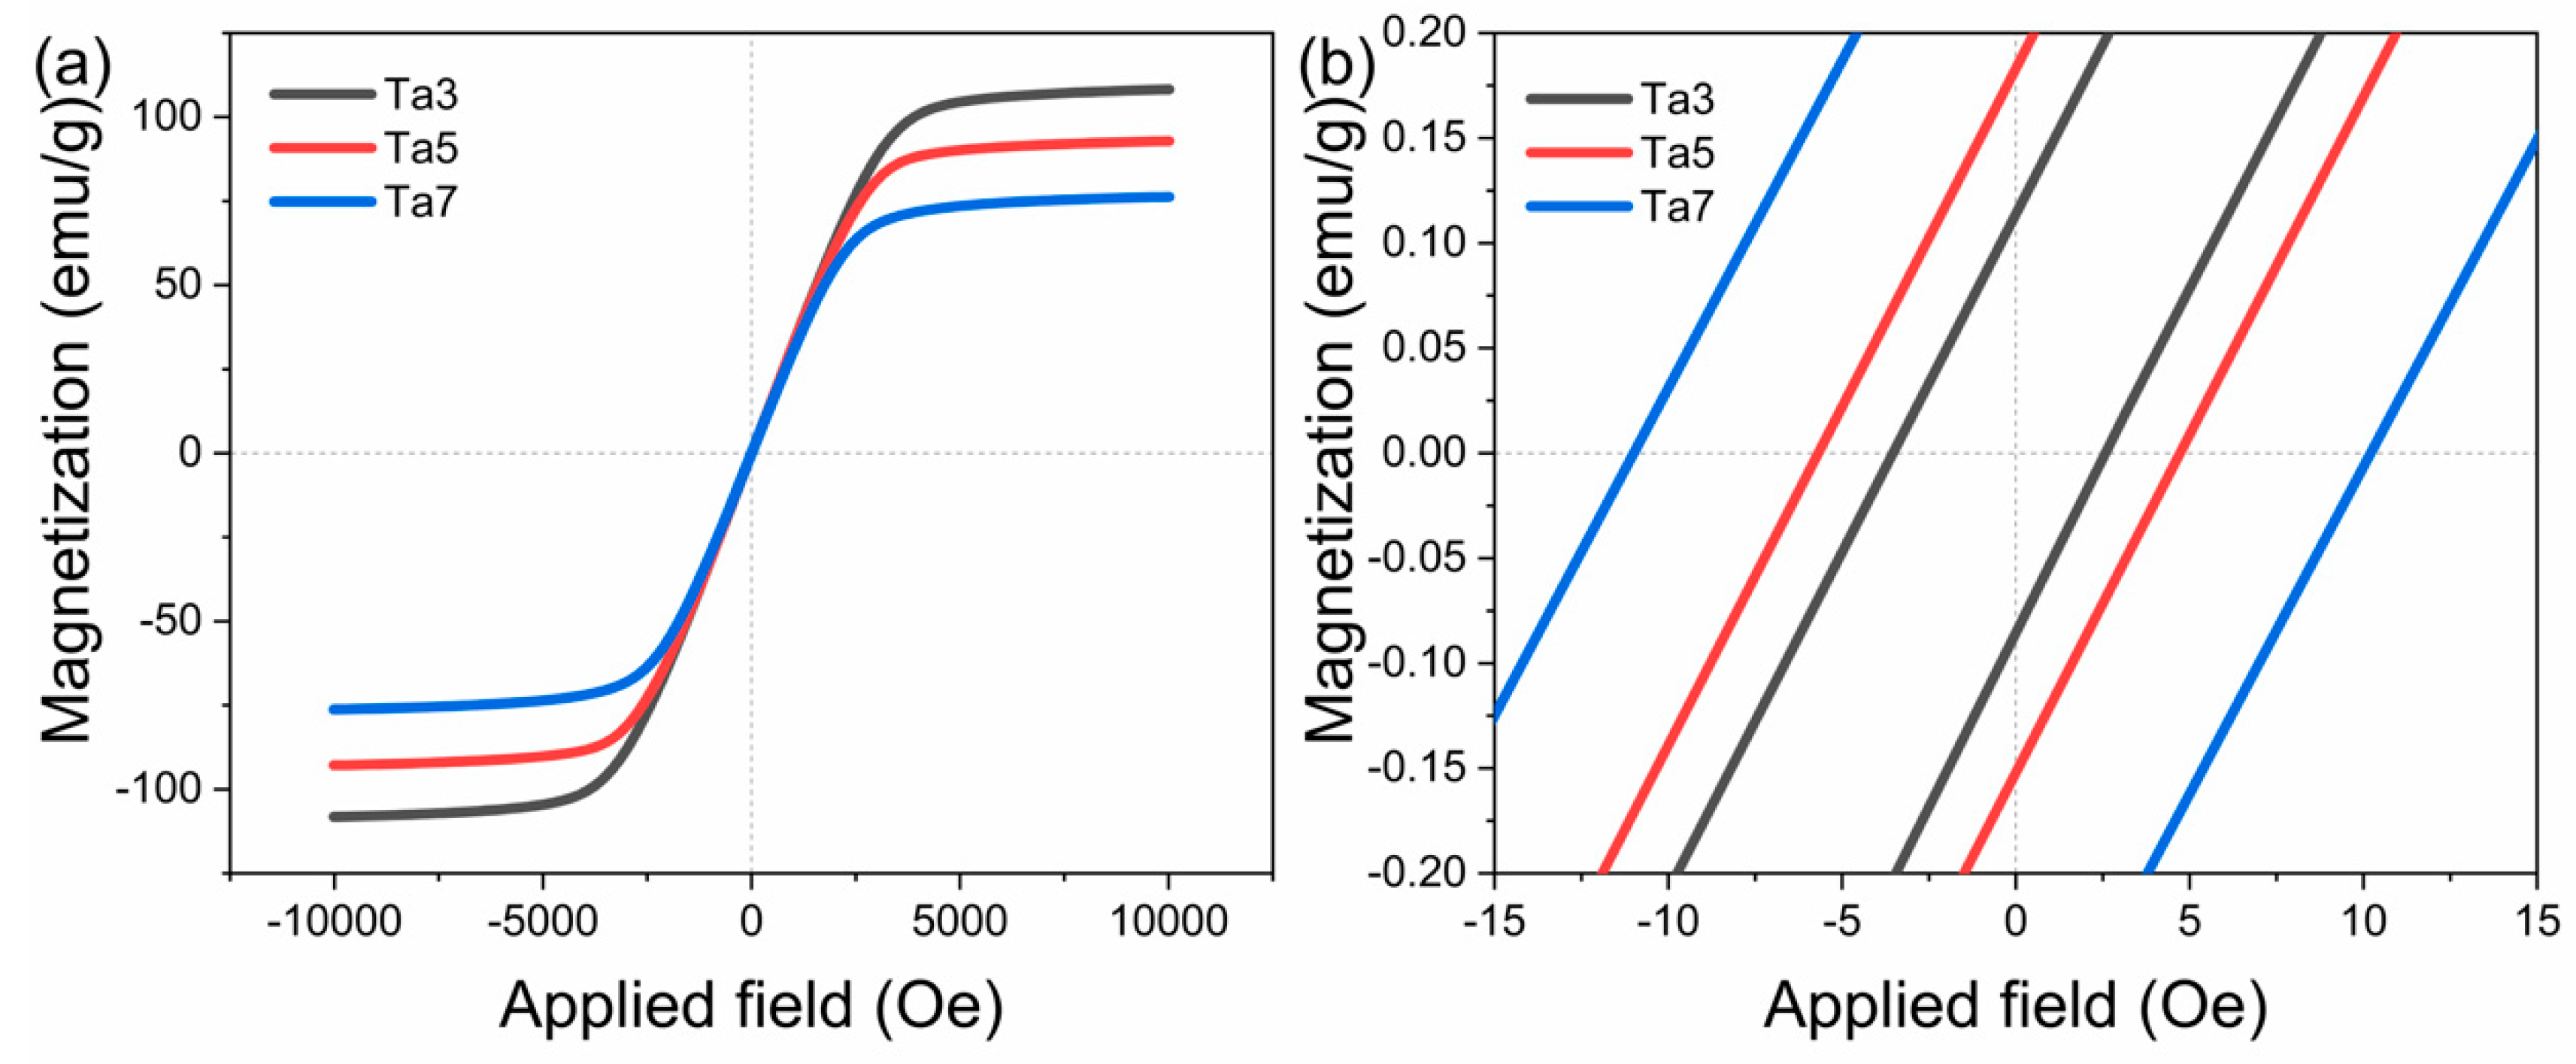
Figure 12.
(a) Vickers hardness values of the (Fe7Co6Ni6)93-xTaxAl7 (x=3、5、7) MPEAs.
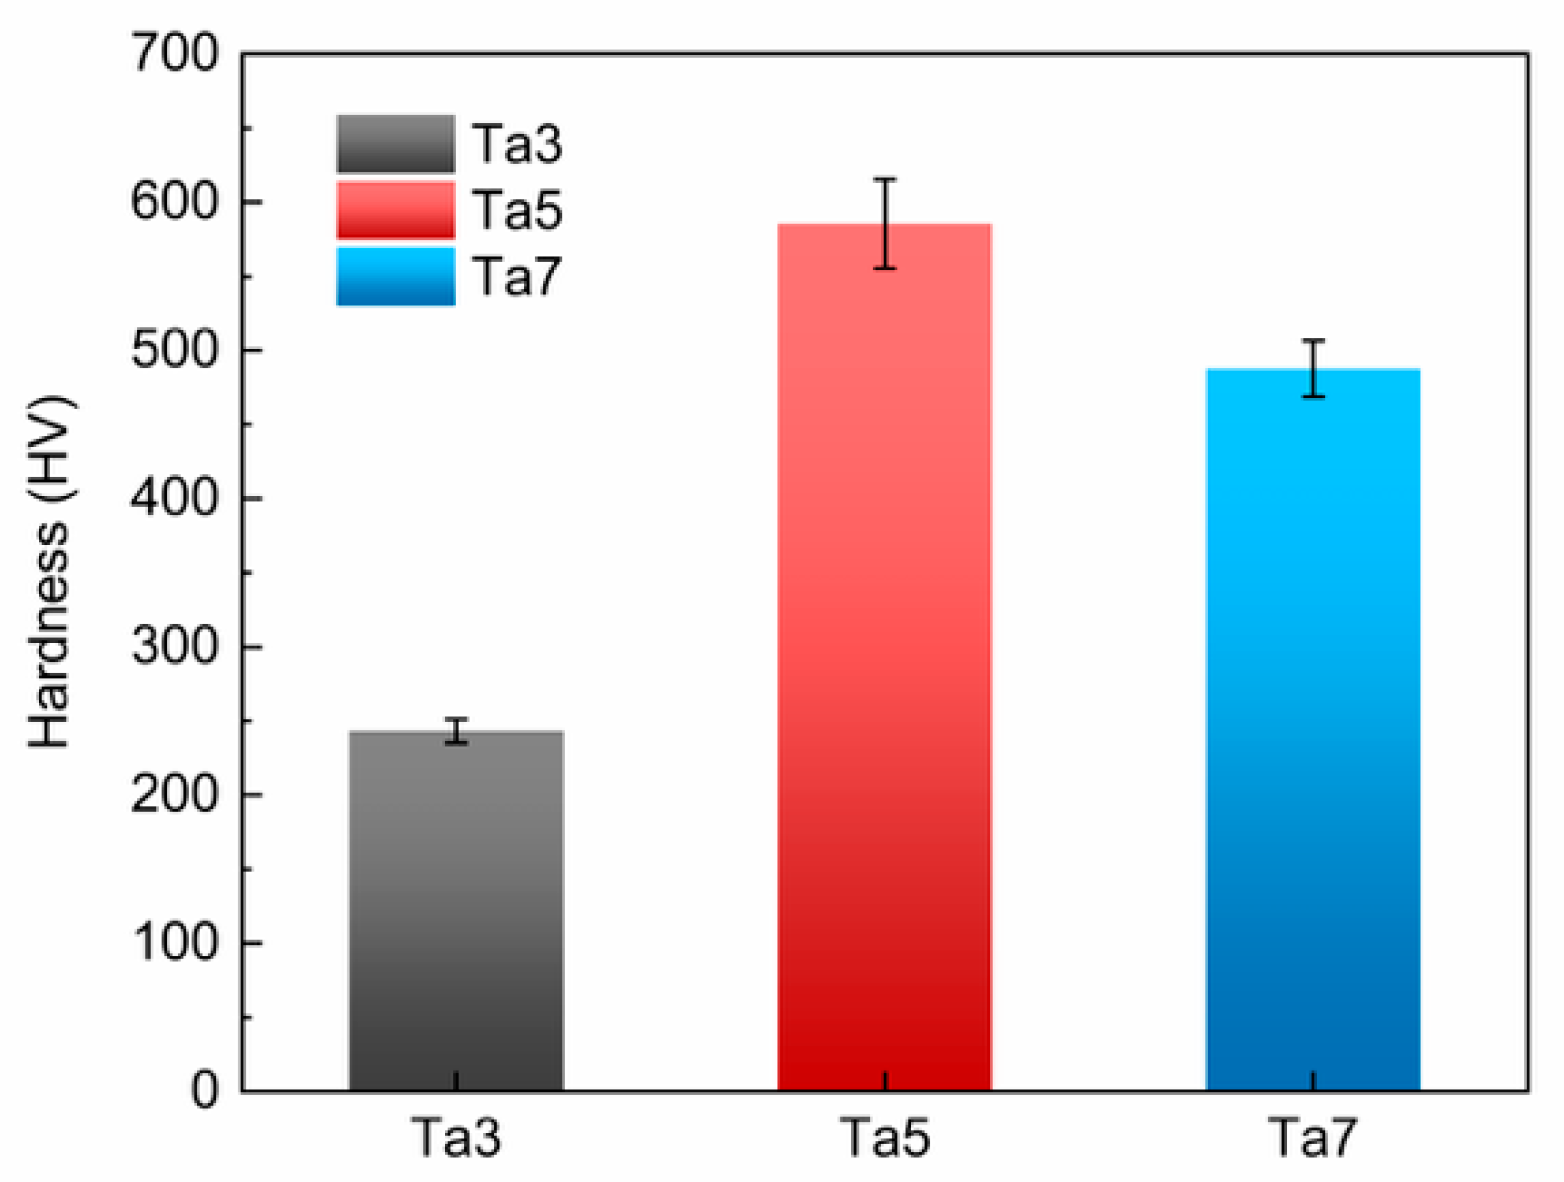
Figure 13.
(a) Engineering stress-strain curves of the (Fe7Co6Ni6)93-xTaxAl7 (x=3, 5, 7) alloys under tensile testing at a strain rate of 3.75×10⁻⁴ s-1; (b) Work hardening curves of the Ta5 and Ta3 alloys calculated from their true stress-strain curves, shown as red and black lines, respectively.
Figure 13.
(a) Engineering stress-strain curves of the (Fe7Co6Ni6)93-xTaxAl7 (x=3, 5, 7) alloys under tensile testing at a strain rate of 3.75×10⁻⁴ s-1; (b) Work hardening curves of the Ta5 and Ta3 alloys calculated from their true stress-strain curves, shown as red and black lines, respectively.
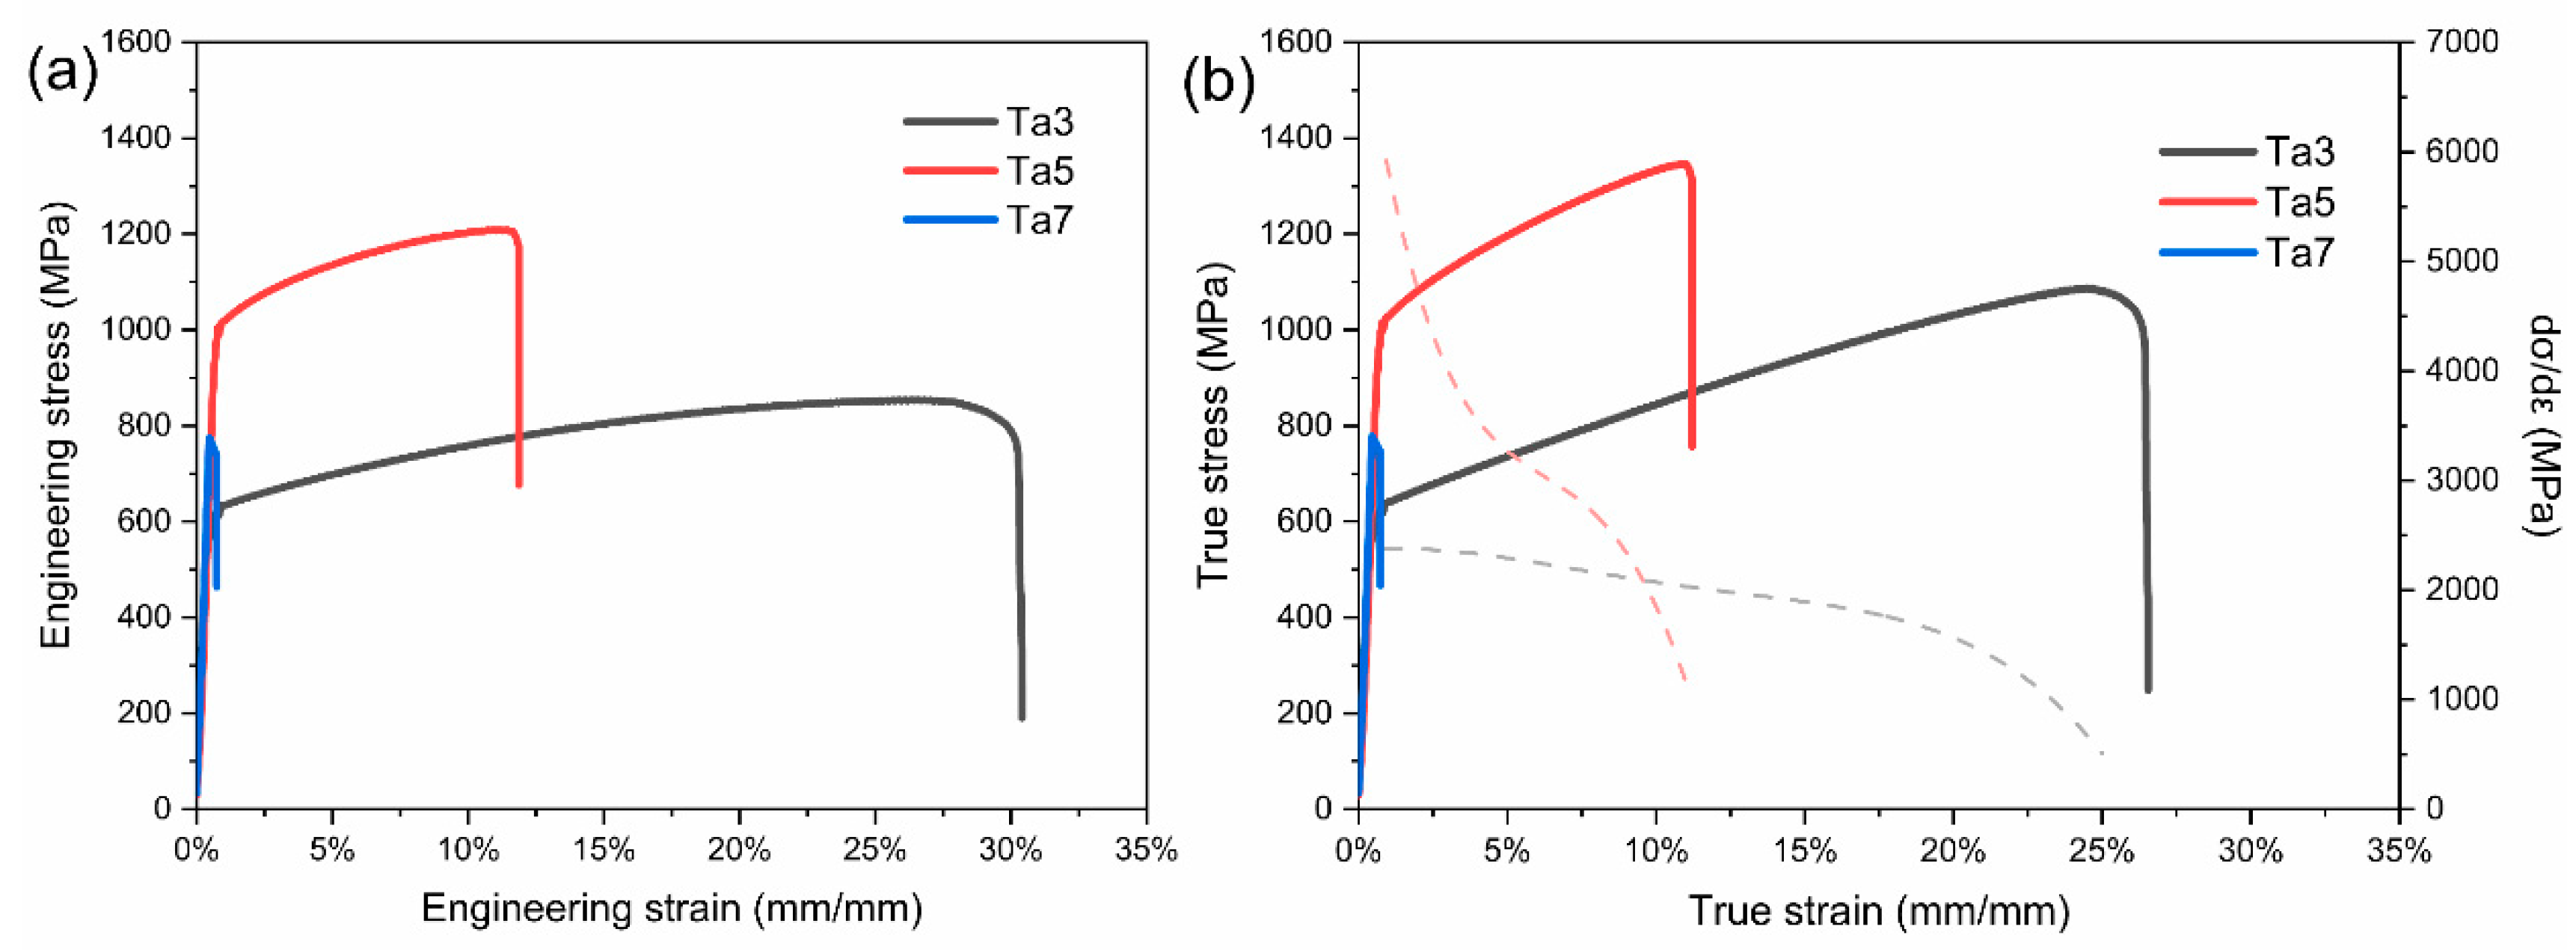
Figure 14.
(a-c) The fracture morphology after tensile testing of MPEAs at lower magnification, (e-f) the fracture morphology after tensile testing of MPEAs at higher magnification.
Figure 14.
(a-c) The fracture morphology after tensile testing of MPEAs at lower magnification, (e-f) the fracture morphology after tensile testing of MPEAs at higher magnification.
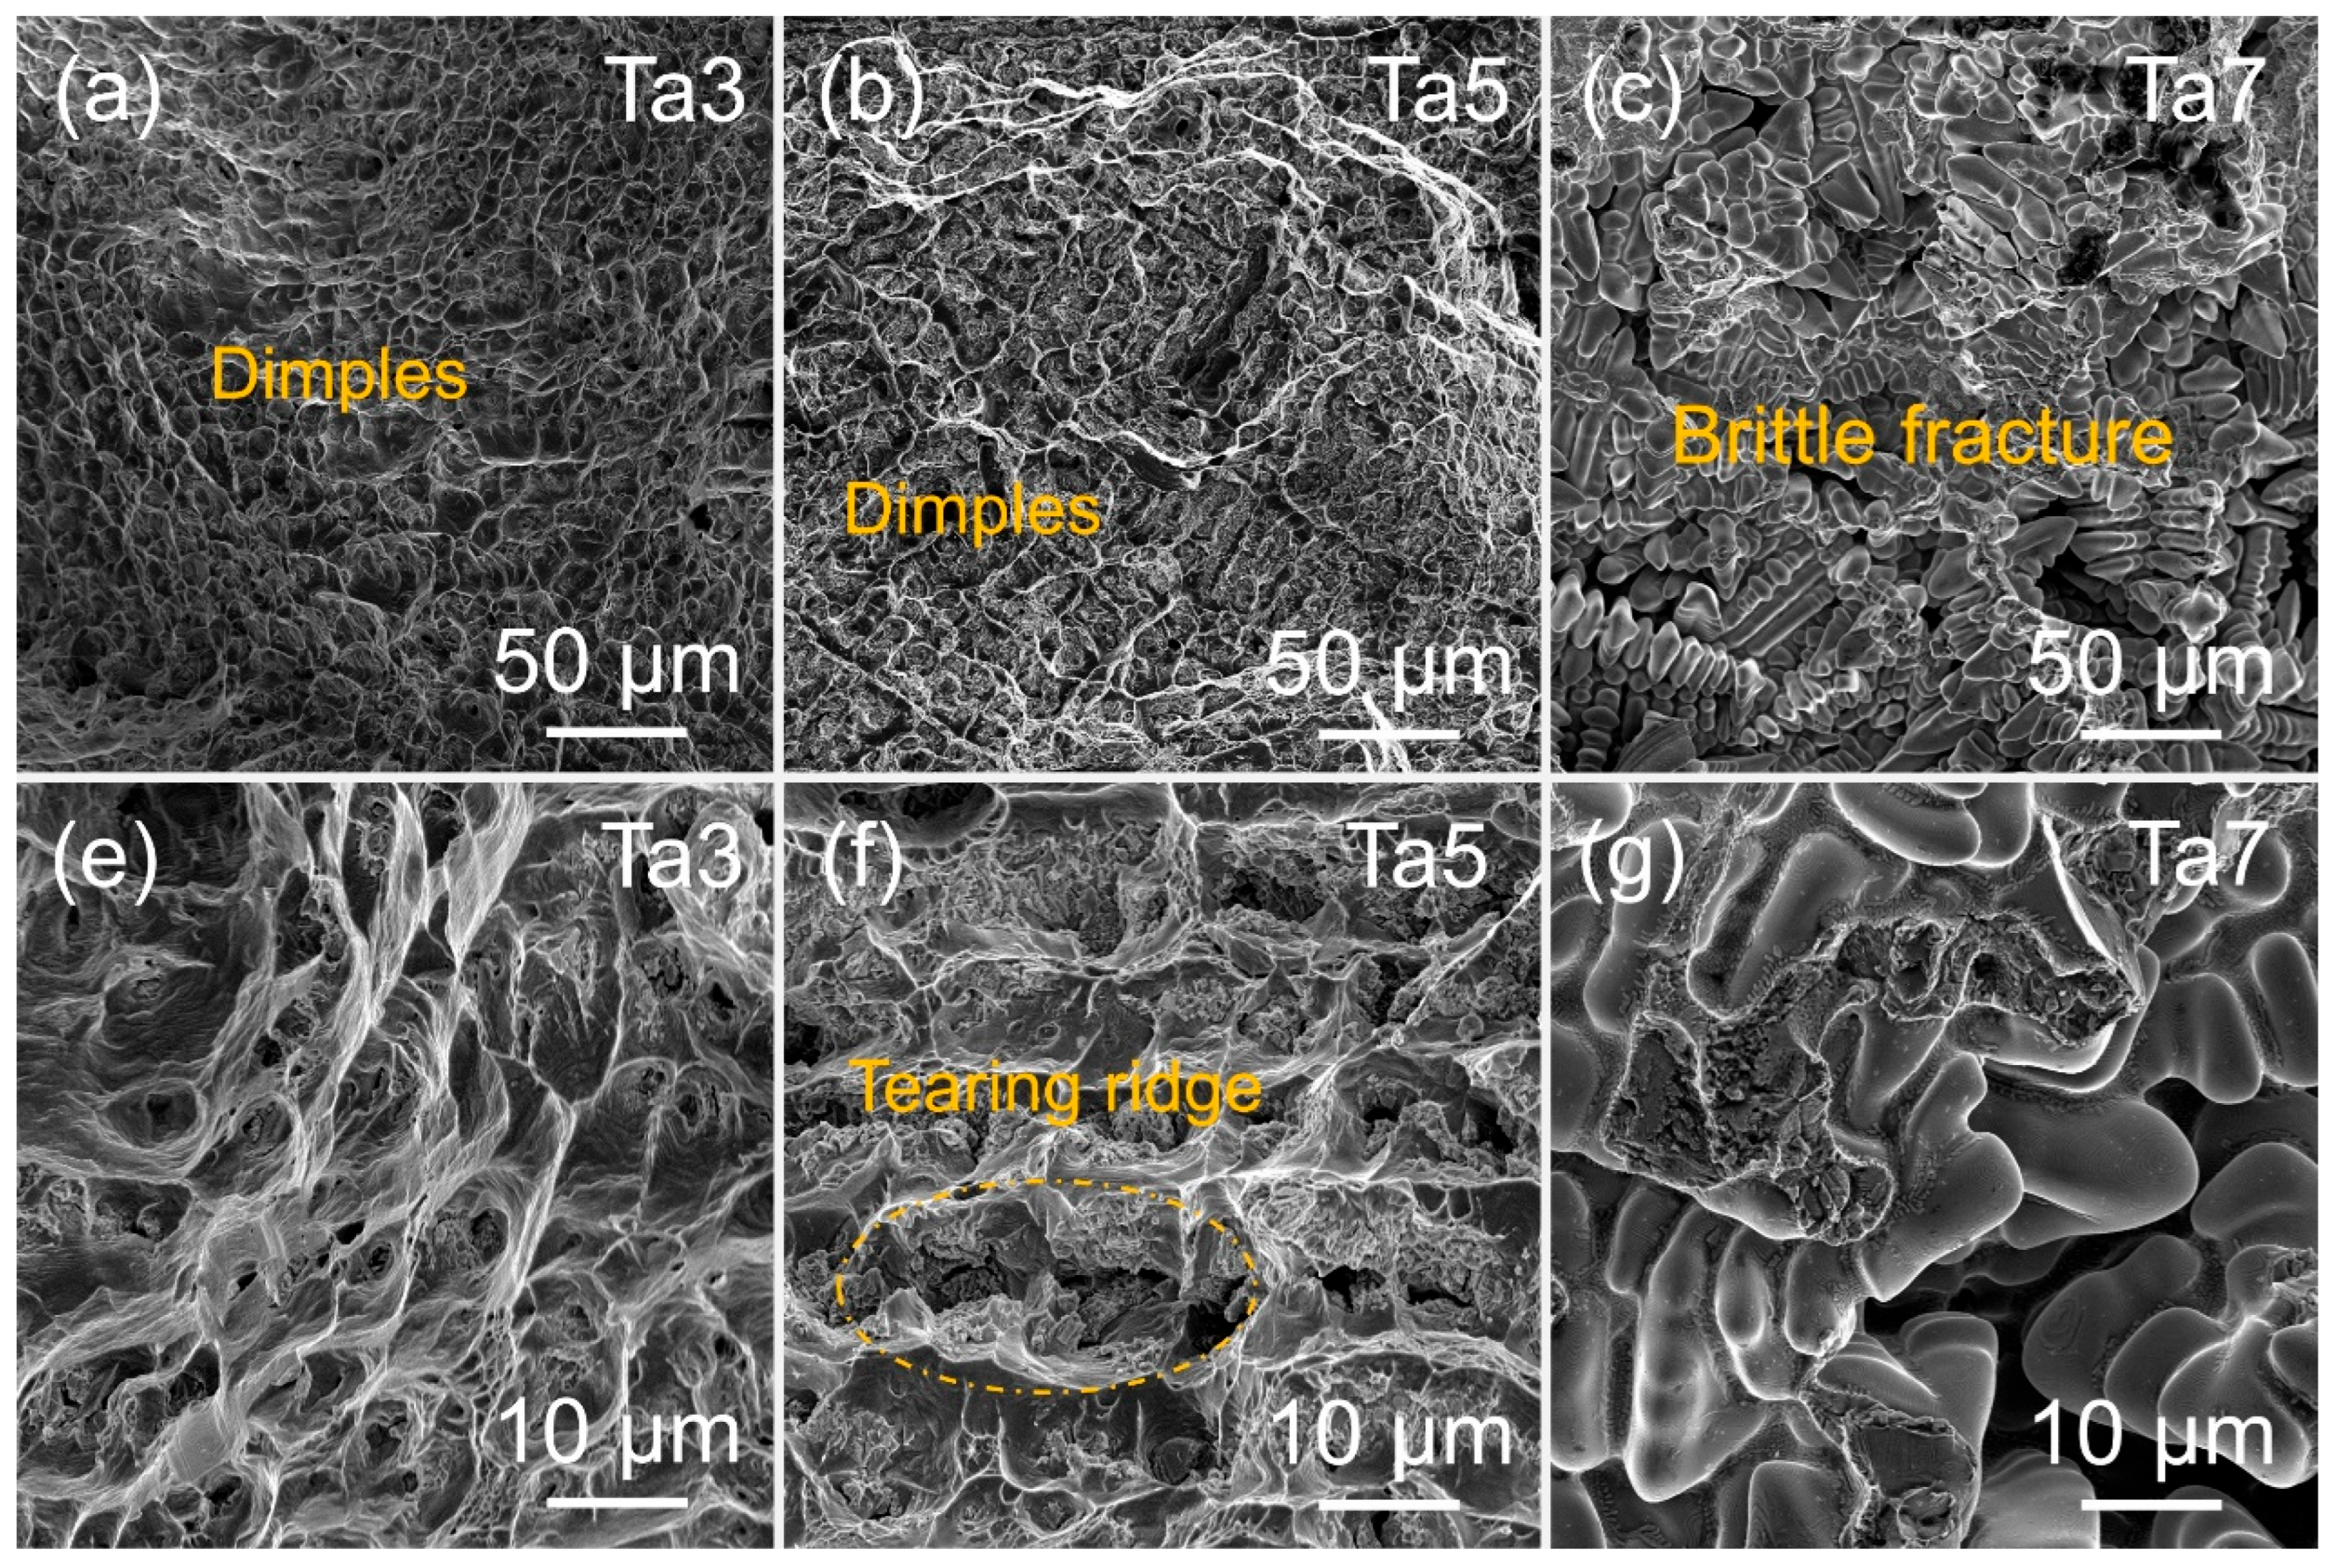
Table 1.
The atomic ratio, mass ratio, and theoretical density of MPEAs.
| Alloy | Fe (wt. %) | Co (wt. %) | Ni (wt. %) | Ta (wt. %) | Al (wt. %) | ρ (g/cm3) |
|---|---|---|---|---|---|---|
| (Fe7Co6Ni6)90Ta3Al7 | 31.25 | 28.26 | 28.15 | 9.16 | 3.19 | 8.29 |
| (Fe7Co6Ni6)88Ta5Al7 | 29.33 | 26.53 | 26.42 | 14.66 | 3.06 | 8.54 |
| (Fe7Co6Ni6)86Ta7Al7 | 27.56 | 24.93 | 24.83 | 19.73 | 2.94 | 8.78 |
Table 2.
Magnetic properties of Ta3, Ta5, and Ta7 alloys obtained from Figure 11.
Table 2.
Magnetic properties of Ta3, Ta5, and Ta7 alloys obtained from Figure 11.
| Alloy | Ms (emu/g) | Hc (Oe) | Hc (A/m) |
|---|---|---|---|
| Ta3 | 108.22 | 3.49 | 277.73 |
| Ta5 | 92.88 | 5.61 | 446.43 |
| Ta7 | 76.28 | 11.05 | 879.33 |
Disclaimer/Publisher’s Note: The statements, opinions and data contained in all publications are solely those of the individual author(s) and contributor(s) and not of MDPI and/or the editor(s). MDPI and/or the editor(s) disclaim responsibility for any injury to people or property resulting from any ideas, methods, instructions or products referred to in the content. |
© 2025 by the authors. Licensee MDPI, Basel, Switzerland. This article is an open access article distributed under the terms and conditions of the Creative Commons Attribution (CC BY) license (http://creativecommons.org/licenses/by/4.0/).
Copyright: This open access article is published under a Creative Commons CC BY 4.0 license, which permit the free download, distribution, and reuse, provided that the author and preprint are cited in any reuse.


