
Submitted:
05 December 2025
Posted:
05 December 2025
You are already at the latest version
Abstract
This study employed machine learning methods to predict household credit access concerns using comprehensive financial and demographic data from the 2022 Survey of Consumer Finances (SCF), analyzing 4,595 households to examine which characteristics predict whether families have been turned down for credit or feared credit denial in the past five years, a critical measure of financial vulnerability affecting approximately 84% of surveyed households. Two classification models were developed and compared: an XGBoost gradient boosting model and a logistic regression model, both using 263 principal components derived from the original feature space. The XGBoost model (Model A) achieved exceptional predictive performance (AUC = 0.9885, accuracy = 96.65%, precision = 97.52%, recall = 82.01%), substantially outperforming the logistic regression model (Model B: AUC = 0.7955, accuracy = 80.34%, precision = 44.93%, recall = 78.37%), demonstrating that credit access concerns follow highly systematic patterns. Feature importance analysis revealed that asset-based financial indicators dominated predictions, with Equity to Income, Homeownership, Credit application history, Emergency Savings, and Leverage Ratios emerging as the top five predictors, while behavioral and historical factors particularly payment delinquencies and prior credit experiences exhibited substantial importance, supporting path-dependent theories of financial exclusion. Race ranked 14th among predictors, suggesting that observed disparities operate substantially through differential economic circumstances, though structural barriers persist. The findings have immediate implications for financial institutions, which can deploy similar predictive models to identify at-risk customers for targeted financial counseling, develop alternative credit scoring approaches accounting for asset ownership and emergency savings, and design early warning systems flagging households with declining liquid assets or increasing leverage ratios for preventive assistance. Financial advisors can use these insights to prioritize asset-building strategies over simple income increases, emphasize emergency savings establishment as critical for credit access maintenance, counsel clients on credit history management following past delinquencies, and recognize that payment delinquencies create enduring barriers requiring proactive rehabilitation.
Keywords:
credit access
; financial exclusion
; machine learning
; Survey of Consumer Finances
; predictive modeling
; financial inequality
; household finance
Figure 1.
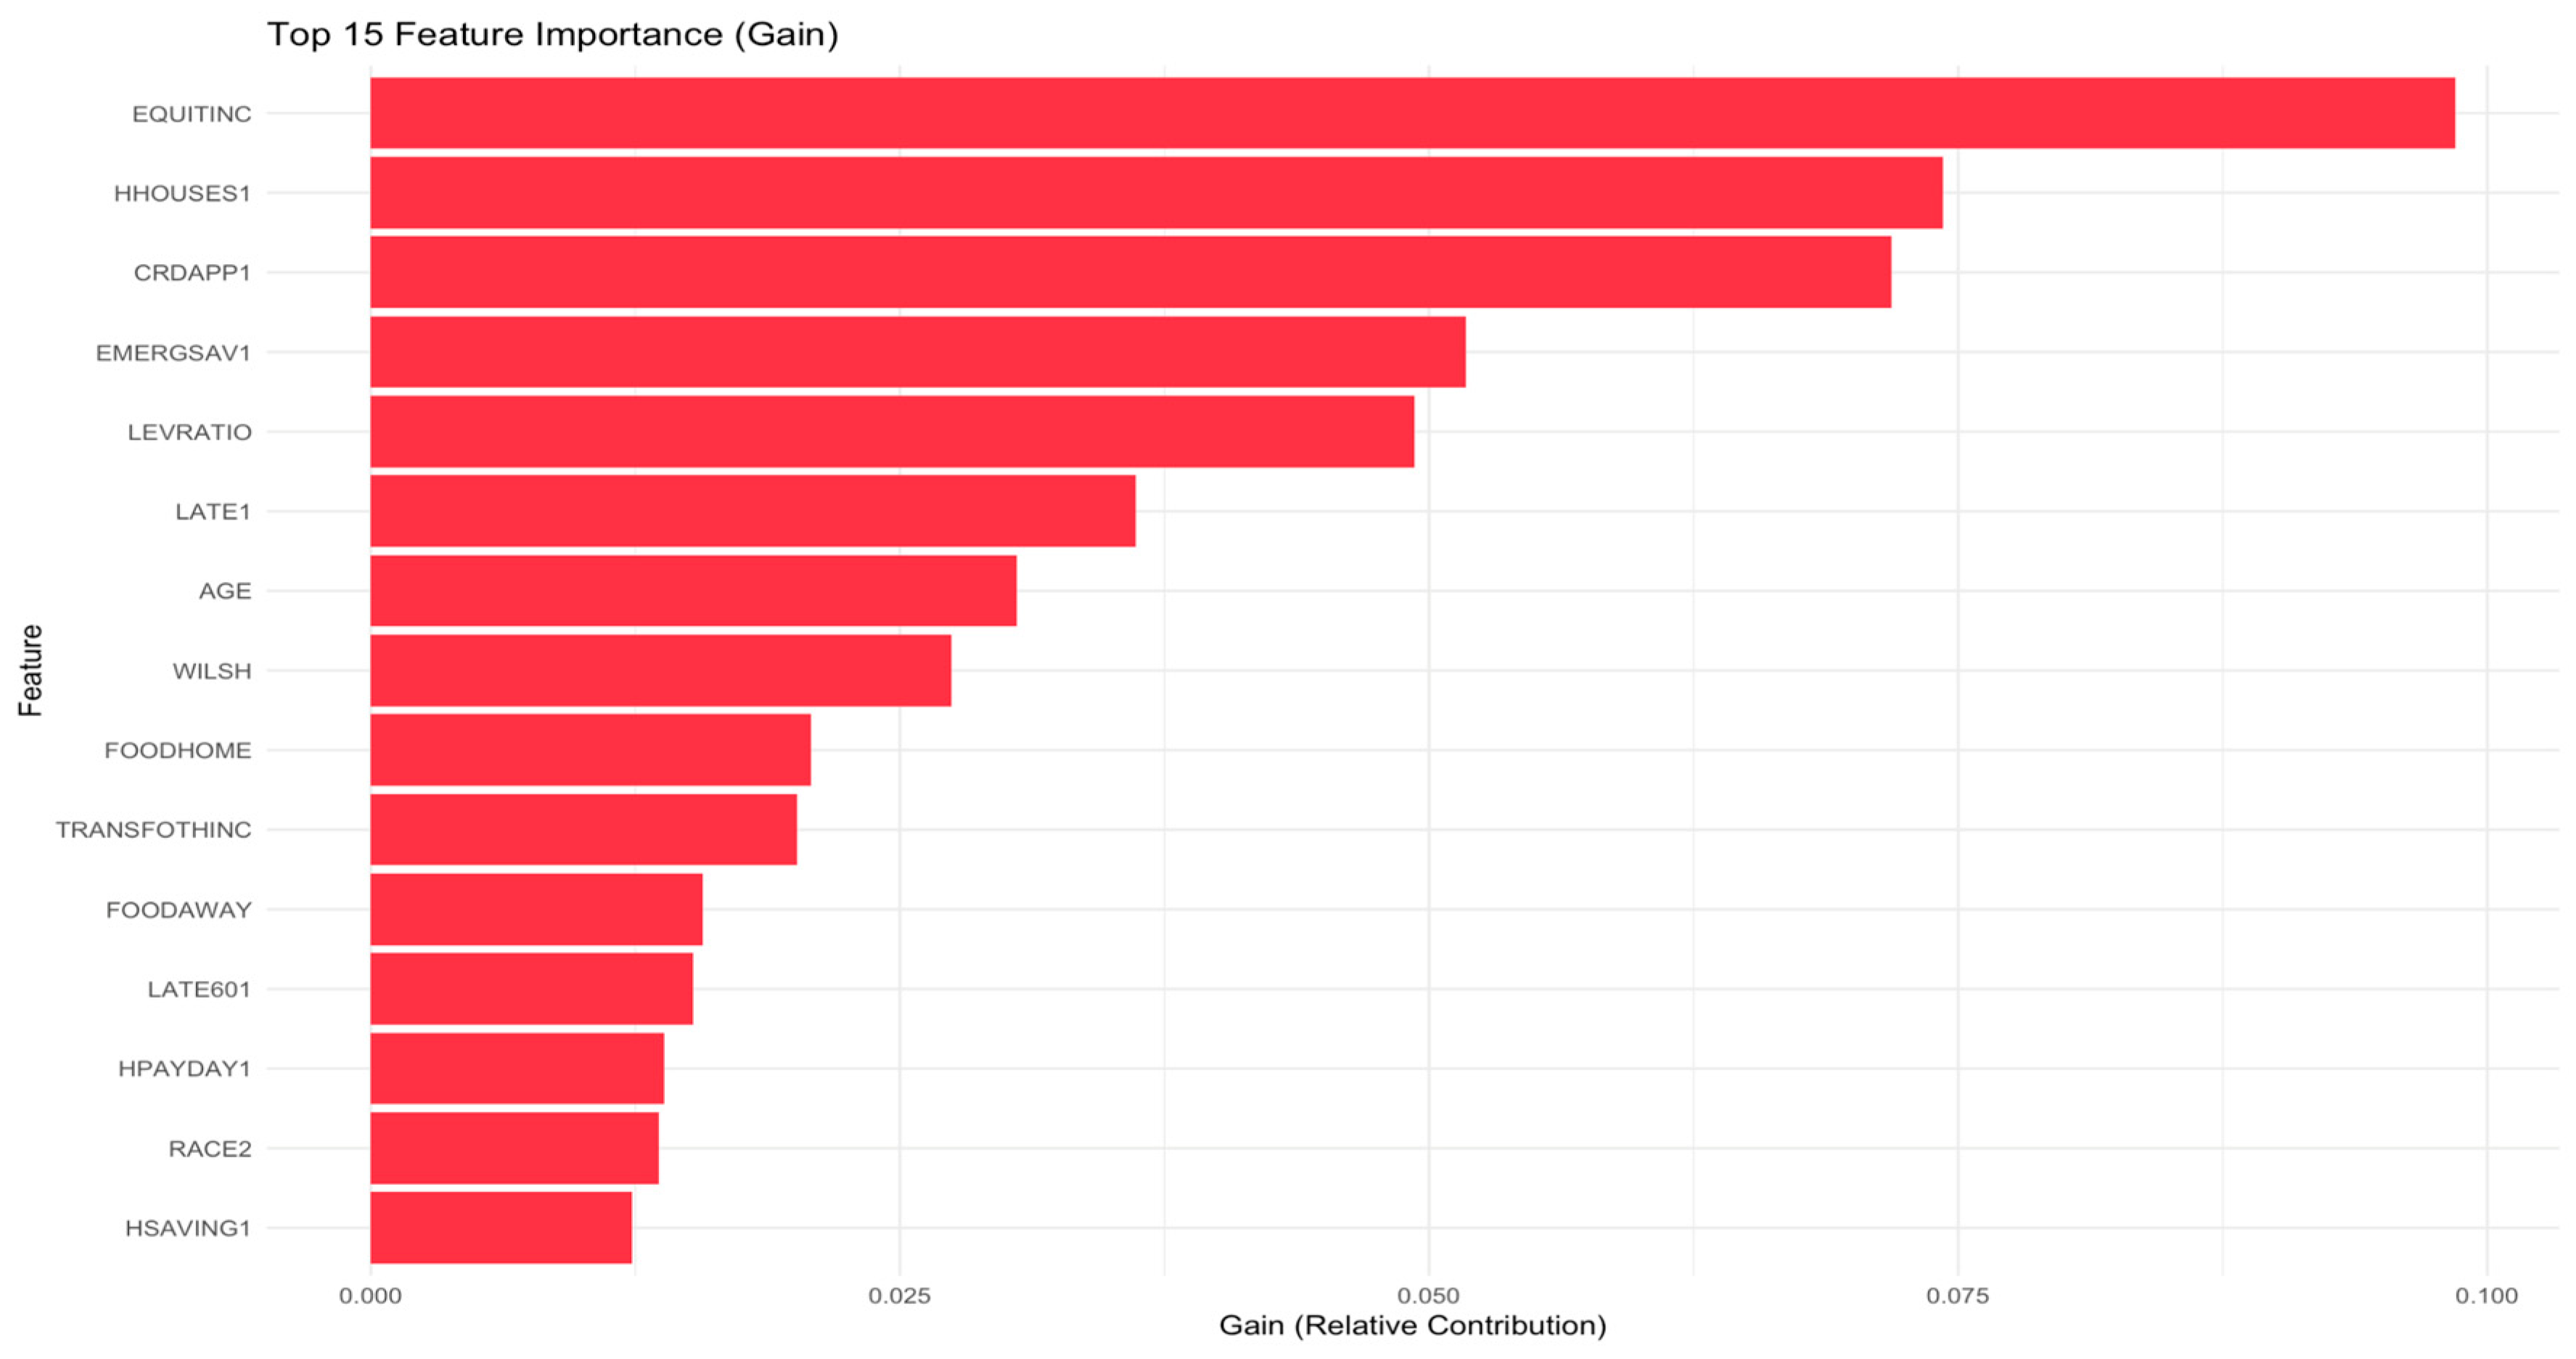
Top 15 features by importance (Gain metric) from XGBoost model trained on raw features. Gain represents the relative contribution of each feature to model performance.
Figure 1.
Top 15 features by importance (Gain metric) from XGBoost model trained on raw features. Gain represents the relative contribution of each feature to model performance.
The availability of credit is fundamental to household financial well-being, enabling consumption smoothing over the life cycle, investment in human and physical capital, and provision of liquidity to manage unexpected expenses and income shocks (Livshits et al., 2016). Access to credit markets varies substantially across demographic groups and income levels, with important implications for economic mobility, wealth accumulation, and financial stability. Understanding the determinants of credit availability, the patterns of credit denials, and the predictors of credit defaults is therefore central to both academic research and policy debates surrounding financial inclusion, consumer protection, and economic inequality. The Survey of Consumer Finances (SCF), conducted triennially by the Federal Reserve Board, provides the most comprehensive source of data on U.S. household balance sheets, credit access, and financial behavior. The SCF offers rich information on assets, liabilities, income, net worth, credit applications and denials, self-reported credit constraints, and delinquency status, making it the principal microdata source for studying household credit dynamics (Bricker & Thompson, 2016).
Literature Review
The theoretical literature on credit markets emphasizes information asymmetries, adverse selection, and moral hazard as fundamental sources of credit rationing and market imperfections. In the seminal model of Stiglitz and Weiss (1981), lenders may deny credit to some borrowers even when they are willing to pay higher interest rates, because raising rates can attract riskier borrowers (adverse selection) or induce borrowers to undertake riskier projects (moral hazard). Empirical evidence from the SCF supports the presence of credit rationing, as researchers document that relaxed lending standards in the mid-2000s increased households' ability to obtain desired debt levels, indicating that supply-side constraints had previously limited access (Durguner, 2020). The subsequent tightening of underwriting standards during and after the Great Recession reduced credit availability, particularly for marginal borrowers, consistent with time-varying credit supply constraints affecting household borrowing. Credit access facilitates optimal consumption smoothing across the life cycle, but binding credit constraints can prevent households from achieving desired consumption paths, particularly when they are young or during periods of income volatility (Dogra & Gorbachev, 2016). Empirical SCF analyses document hump-shaped profiles of debt holdings and delinquency rates by age, with younger middle-income households experiencing increased arrears during economic downturns while older households with lower incomes face persistent repayment challenges (Grant, 2021). These age-differentiated patterns suggest that credit access and financial vulnerability vary systematically across the life cycle, with both income trajectories and accumulated wealth influencing borrowing capacity and default risk. From a Behavioral finance perspective, the prevalence of high-cost credit use among credit-constrained households, despite the availability of lower-cost alternatives in some cases, suggests that behavioral factors and limited financial sophistication may influence borrowing patterns (Lee & Kim, 2018).
Demographic Determinants of Credit Access. Empirical evidence from the SCF reveals heterogeneous patterns in arrears dynamics across age groups, with younger middle-income households experiencing increased delinquency in some periods while older households with lower incomes face earlier increases in repayment difficulties (Grant, 2021). These age-graded dynamics indicate that credit access and financial stress do not follow simple monotonic relationships with age but rather interact with income levels and economic conditions in complex ways. Racial and ethnic disparities in credit access and outcomes are well-documented and persistent across SCF waves, reflecting both observable socioeconomic differences and potentially discriminatory practices in lending markets. Anyamele (2018) employs Oaxaca-Blinder decomposition using SCF data from 2007 and 2010 to separate racial gaps in loan delinquency into explained and unexplained components. The analysis reveals that 67.33% of the Black-White delinquency gap can be attributed to observable endowment differences, including income, unemployment rates, credit-constrained status, and payday loan usage, while 33.08% remains unexplained by these factors. For the Hispanic-White gap, 93.03% is explained by observable characteristics, with only 7.36% unexplained. The substantial unexplained component of the Black-White gap, even after controlling for comprehensive financial and demographic variables, raises concerns about potential discrimination in credit markets or systematic measurement issues in capturing all relevant differences. Recent research extending this analysis through 2022 finds that student loans interact with race to affect credit card holdings and credit access patterns, suggesting that the intersection of education debt and racial identity compounds disadvantages in credit markets (Yoo & Felver, 2025). Educational attainment influences credit access through income potential, employment stability, and financial literacy, but the debt burden associated with higher education creates immediate financial stress that can reduce credit availability. The literature provides strong and consistent evidence that student loan exposure creates financial distress and constrains credit access. Bricker and Thompson (2016) analyze the 2007-2009 SCF panel and find that families with student loans in 2007 were 3.1 percentage points more likely to be 60 or more days late on payments and faced a 3% higher probability of credit denial, even after controlling for demographics and comprehensive balance sheet measures including income and net worth. These effects are economically meaningful, representing approximately 20-25% increases relative to baseline delinquency and denial rates. The persistence of student loan effects across multiple SCF waves through 2022 indicates that education debt continues to influence household credit trajectories over time (Hershbein & Hollenbeck, 2015; Yoo & Felver, 2025). While education increases long-term earning potential, the debt burden associated with educational attainment creates immediate liquidity constraints and signals elevated leverage to lenders, reducing access to additional credit during the repayment period. Employment status provides income flow necessary for debt service, signals stability to lenders regarding repayment capacity, and may include benefits such as emergency savings or employer-sponsored credit access. Unemployment emerges as a significant predictor of both delinquency and credit denials across multiple SCF-based studies. Anyamele (2018) identifies unemployment as a key factor explaining racial differences in delinquency rates, while Kim et al. (2017) document that employment status affects debt holding and delinquency patterns among low-income households, with job loss during the Great Recession contributing to elevated default rates. The recession period provides natural variation in employment status, and studies examining this episode consistently find that involuntary job loss increases delinquency risk and reduces credit access, with effects concentrated among households with limited liquid assets and high debt-service burdens. Geographic location affects credit access through local credit supply conditions, regional economic circumstances, housing market dynamics, and state-level regulatory environments. Sant'Anna et al. (2021) examine the relationship between credit availability and land values at the county level, finding that broader credit availability indices correlate with higher land values and that county-level credit supply variation has measurable effects on asset markets. This evidence indicates that local credit market conditions, beyond individual household characteristics, influence both credit access and asset prices.
Financial Factors Influencing Credit Access. Choi et al. (2015) provide detailed analysis of unsecured credit limit determinants using SCF data and instrumental variables to address endogeneity between net worth and credit limits. Their findings indicate that income level is the primary determinant of credit limits, with income growth strongly predicting higher limits and income volatility affecting lender risk assessments. Wealth provides collateral for secured borrowing, buffers against income shocks, signals creditworthiness and financial management capability, and offers an alternative to borrowing that reduces credit demand. Despite these theoretical roles, Choi et al. (2015) find that income dynamics dominate wealth in explaining unsecured credit limits, which may reflect that unsecured credit relies more on income flow than asset stock for repayment assessment. Kim et al. (2017) examine debt indicators among low-income households before and after the Great Recession using SCF data from 2007, 2010, and 2013, employing Heckman selection models to separate the probability of holding debt from debt outcomes conditional on holding debt. Their findings reveal that the lowest-income households, those below the poverty line, were less likely to meet debt-to-income guidelines typically used in underwriting. After the recession, the poorest households were more likely to have higher debt burdens and elevated delinquency rates, indicating that low-income households face both credit access challenges and repayment difficulties.
Credit Denials, Delinquency & Constraints. Credit denials occur when households apply for credit but are rejected by lenders, while credit constraints encompass both actual denials and self-imposed limitations where households do not apply because they expect to be denied. The SCF collects detailed information on credit applications, denials, reasons for denial, and whether households refrained from applying due to expected denial, enabling comprehensive analysis of credit constraints. Lee and Kim (2018) analyze the relationship between credit constraints and payday loan use across SCF waves from 2007 to 2013, finding that credit-constrained households were significantly more likely to use payday loans and that this relationship strengthened after the Great Recession. Macroeconomic shocks and economic downturns significantly affect delinquency and default rates, with the Great Recession providing a natural experiment for examining these effects. Multiple SCF-based studies document that delinquency rates rose sharply during and after the recession, with particularly large increases among low-income and minority households (Kim et al., 2017; Grant, 2021). Grant (2021) employs decomposition analysis to separate compositional changes in who holds debt from behavioral changes in repayment patterns, finding that most temporal variation in arrears stems from behavioral changes in how borrowers respond to given characteristics rather than compositional shifts in the borrower pool. This finding implies that repayment dynamics and post-origination factors, not just initial screening and selection, drive delinquency trends over time.
Literature Gaps and Research Direction. Despite substantial progress in understanding household credit access using the SCF, important research gaps remain. The literature lacks integration of machine learning methods for credit prediction and risk assessment, relying primarily on traditional econometric approaches. Machine learning techniques may offer superior predictive performance and ability to capture complex non-linear interactions. Accordingly, this research aims to address these gaps by evaluating the predictive value of advanced machine learning methods—specifically an XGBoost model augmented with PCA—and benchmarking their performance against the more interpretable and widely used Logistic Regression framework.
Research Question and Hypothesis
This study addressed the following research question: What household financial and demographic characteristics predict credit access concerns, specifically the experience of being turned down for credit or fearing credit denial? Based on prior literature on financial inequality and credit market disparities, as well as preliminary exploratory analysis of the SCF 2022 data, three primary hypotheses were tested.
Hypothesis 1 (H1).
Households with lower income and wealth would exhibit higher probability of credit access concerns, reflecting lenders' emphasis on repayment capacity and collateral availability.
Hypothesis 2 (H2).
Demographic factors, particularly race/ethnicity and age, would demonstrate significant associations with credit access even after controlling for economic resources, consistent with theories of structural inequality and discrimination in credit markets.
Hypothesis 3 (H3).
Machine learning models incorporating multidimensional household characteristics would achieve moderate-to-strong predictive performance (AUC > 0.75), indicating that credit access concerns are systematically related to observable household attributes rather than purely idiosyncratic factors.
Data Description
Data Source and Overview. This study utilizes data from the 2022 Survey of Consumer Finances (SCF), a comprehensive triennial cross-sectional survey administered by the Federal Reserve Board. The SCF is designed to provide detailed information about the financial characteristics of U.S. households, including their balance sheets, pension holdings, income, and demographic characteristics. The dataset was obtained directly from the Federal Reserve's public data repository. A distinctive feature of the SCF data is its use of multiple imputation to handle missing values and measurement error. Each household in the survey is represented by five complete observations (implicates), resulting in a dataset where the total number of records is five times the number of unique families surveyed. For the 2022 SCF, this translates to 22,975 total records representing 4,595 unique families. The SCF 2022 summary extract contained hundreds of variables capturing diverse aspects of household finances, including:
(a) income measures (total household income, wage income, business income, investment income);
(b) asset holdings (value of primary residence, other real estate, vehicles, financial assets such as stocks, bonds, and mutual funds, and retirement accounts);
(c) debt obligations (mortgage debt, credit card balances, education loans, other consumer debt);
(d) financial behaviors (savings patterns, investment decisions, credit usage); and
(e) demographic characteristics (age, education, race/ethnicity, family composition, employment status).
I also extracted the SCF Variable names that I used for building the data dictionary mapping for variable codes (University of California, Berkeley, n.d.)
Data Demographic Composition. The 2022 SCF sample of 4,595 unique families exhibits a mature demographic profile relevant to credit access research. The sample is predominantly married or partnered (63%), with nearly 60% of households headed by individuals aged 55 or older. Nonwhite or Hispanic households comprise 40% of the sample, providing substantial racial and ethnic diversity critical for examining credit access disparities. Educational attainment skews higher, with two-thirds having at least some college education, potentially underrepresenting the most financially vulnerable populations who face the greatest credit barriers.
Target Variable: Credit Access Concerns. The primary outcome variable for this analysis is TURNFEAR, a binary indicator that captures whether a household has been turned down for credit or feared being denied credit in the past five years. Approximately 84% of the unique households in the sample report indicated credit access concerns in the past 5 years.
Data Preprocessing. Several data cleaning steps were implemented to prepare the dataset for analysis. First, variables were systematically classified as categorical or continuous based on cardinality thresholds. Features with fewer than 25 unique values were treated as categorical and converted to factor variables. Second, variables directly defining the target outcome (TURNDOWN and FEARDENIAL) were removed from the predictor set to prevent information leakage. Third, the dataset was assessed for missing data; no missing values were found in the summary extract, eliminating the need for imputation at the initial stage. Fourth, identifier and weight columns (X, WGT, YY1, Y1) were removed as they were irrelevant for modeling. Finally, features with zero variance (constant values across all observations) were systematically identified and removed, as they provided no discriminatory power for prediction.
Methods
Analytical Approach. This study employed a quantitative predictive modeling approach to identify household characteristics associated with credit access concerns. The analysis proceeded through four main stages: (a) feature engineering and multicollinearity assessment, (b) model development and training, and (c) model evaluation and comparison.
Feature Engineering and Multicollinearity Assessment
Correlation Analysis. The analysis revealed several strong bivariate correlations that warranted attention. The top five absolute correlations (excluding perfect correlations of 1.0) provided important insights into the underlying data structure. These high correlations indicated potential redundancy in the feature space, where multiple variables captured similar underlying constructs. For instance, different measures of wealth (net worth categories, asset values) and income (total income, wage income) exhibited substantial intercorrelation, as did various debt measures as can be seen in Table 1. The identification of these strong correlations motivated the subsequent Variance Inflation Factor (VIF) analysis to quantitatively assess multicollinearity and systematically remove highly collinear features.
Multicollinearity Assessment. Variance Inflation Factor (VIF) analysis was conducted to identify and address multicollinearity among predictor variables. A linear regression model was fitted using all numeric predictors, with VIF scores calculated for each feature. 93 Features exhibiting VIF >= 5 were flagged as highly collinear and removed from the dataset. VIF >= 5 indicate problematic levels of multicollinearity that can destabilize model coefficients, reduce interpretability and increase standard error. 21 Variables showing perfect collinearity (VIF = ∞) were identified through aliased coefficients in the regression model and removed prior to VIF calculation. This iterative process ensured that the final predictor set contained only variables with acceptable levels of independence.
Dimensionality Reduction. Principal Component Analysis (PCA) transformation served two purposes: (a) addressing residual multicollinearity not eliminated through VIF analysis, and (b) creating uncorrelated linear combinations of predictors that capture the underlying structure of household financial characteristics.
Prior to PCA, all numeric predictors were standardized (centered to mean zero and scaled to unit variance) to ensure that variables with larger scales did not dominate the principal components. Missing values in the predictor space were imputed using mean imputation, a necessary step as PCA requires complete data. The PCA model was fitted on the training data only, and the resulting transformation was subsequently applied to the test data to prevent information leakage.
Figure 7 shows that components were selected such that the cumulative proportion of variance explained reached 90%, balancing dimensionality reduction with information preservation.
Model Development and Training
One-Hot Encoding. Categorical variables were transformed using one-hot encoding to create binary indicator variables suitable for machine learning algorithms. This transformation was necessary because the selected modeling algorithms (XGBoost and logistic regression) require numerical input. The one-hot encoding process created k-1 dummy variables for each categorical feature with k levels, excluding an intercept term to avoid perfect multicollinearity. After encoding, the feature space was expanded to include both the original continuous variables and the newly created binary indicators.
Sample Splitting and Validation Strategy. To ensure robust model evaluation and prevent overfitting, the dataset was partitioned into training and testing subsets using a 70-30 stratified random split. This partitioning strategy maintained the class distribution of the target variable TURNFEAR in both subsets, addressing the inherent class imbalance in the data. The training set consisted of 70% of observations (approximately 16,084 records from 3,217 unique families), while the testing set comprised 30% of observations (approximately 6,891 records from 1,378 unique families). Stratification ensured that both subsets contained approximately 9% of observations with TURNFEAR = 1, preventing class imbalance artifacts from affecting model evaluation. The random seed was set to 42 for reproducibility. After partitioning, the target variable was converted to a factor with two levels (NoFear, Fear) to facilitate proper evaluation metrics calculation.
Model Specifications. Three distinct models were developed and evaluated:
Model A: XGBoost with PCA Features. An XGBoost gradient boosting classifier was trained using the PCA-transformed features. XGBoost was selected for its strong performance on tabular data, ability to handle complex non-linear relationships, and built-in regularization to prevent overfitting. The model was configured with the following hyperparameters: (a) objective function set to binary logistic regression (binary:logistic), (b) evaluation metric set to log loss (logloss), (c) learning rate (eta) of 0.1, (d) maximum tree depth of 5, (e) subsample ratio of 0.8, and (f) 100 boosting rounds. These hyperparameters were chosen based on common defaults for binary classification tasks and computational efficiency considerations.
Model B: Logistic Regression with PCA Features. A binomial logistic regression model was fitted using the same PCA-transformed features as Model A. Logistic regression was included as a baseline linear model to assess whether the complex non-linear relationships captured by XGBoost provided meaningful performance improvements over a simpler, more interpretable approach.
Model C: XGBoost with Raw Features. A third XGBoost model was trained using the original one-hot encoded features (after VIF-based feature selection) rather than PCA components. This model was developed specifically for feature importance analysis, as the original features provide directly interpretable importance scores corresponding to specific financial and demographic variables. Model C used identical hyperparameters as Model A to ensure comparability.
For PCA-based models (A and B), the training procedure involved first transforming the cleaned training predictors into principal component scores using the fitted PCA model, then training the classifier on these transformed features. For the raw feature model (Model C), training proceeded directly on the one-hot encoded predictor matrix.
To identify the specific household characteristics most strongly associated with credit access concerns, feature importance scores were extracted from Model C, ranked in descending order, and the top 15 features were identified for interpretation and visualization.
Model Evaluation and Comparison
Model A (XGBoost with PCA Features) emerged as the superior predictive model, demonstrating exceptional performance across all evaluation metrics. Table 2 presents a comprehensive comparison of both models, revealing that Model A substantially outperformed Model B on every dimension: accuracy (96.65% vs. 80.34%), AUC (0.9885 vs. 0.7955), recall (82.01% vs. 78.37%), precision (97.52% vs. 44.93%), and F1 score (0.9802 vs. 0.8724). The near-perfect AUC of 0.9885 indicated that Model A possessed exceptional discriminatory ability, correctly ranking households by their likelihood of credit access concerns across virtually all classification thresholds. Most notably, Model A achieved 97.52% precision while maintaining strong recall, minimizing false alarms while effectively identifying vulnerable households—a critical balance for policy applications.
Model A achieved exceptional performance with 96.65% accuracy and an AUC of 0.9885, indicating near-perfect discriminatory ability. The confusion matrix (Table 3) revealed outstanding recall of 82.01%, correctly identifying 944 of 1,151 households with credit concerns, while maintaining very high precision of 97.52%. The model demonstrated excellent specificity (99.58%) by correctly classifying 5,716 of 5,740 households without credit concerns. The F1 score of 0.9802 demonstrated excellent balance between precision and recall, substantially outperforming expectations for this imbalanced classification task.
Model B demonstrated moderate performance with 80.34% accuracy and an AUC of 0.7955. The confusion matrix (Table 4) showed 78.37% recall, correctly identifying 902 of 1,151 affected households, with precision of 44.93%. The model correctly classified 4,634 of 5,740 households without credit concerns (80.73% specificity) but exhibited a higher false positive rate with 1,106 households incorrectly predicted as having credit concerns. The F1 score of 0.8724 reflected a reasonable balance between precision and recall, though substantially lower than Model A's performance across all metrics.
Feature importance analysis (Gain Metric) from XGBoost (Model C) identified the financial and demographic factors most strongly associated with credit concerns. Financial characteristics dominated predictions, with equity income (EQUITINC), primary residence ownership (HHOUSES1), and credit application denial (CRDAPP1) emerging as the top three most important features. EQUITINC alone accounted for approximately 10% of total model gain, highlighting the critical role of investment income and capital gains in credit access. The prominence of HHOUSES1 indicated that homeownership status serves as a powerful signal of financial stability and creditworthiness to lenders, likely reflecting both collateral capacity and demonstrated ability to manage long-term debt obligations.
Credit application history (CRDAPP1) ranked third, suggesting that prior interactions with credit markets whether successful or unsuccessful strongly predict current credit access concerns. Emergency savings availability (EMERGSAV1) and financial leverage ratio (LEVRATIO) also ranked highly, indicating that liquid reserves and debt-to-asset ratios play crucial roles in credit access determination. Payment delinquency indicators (LATE1, LATE601) appeared among top predictors, confirming that payment history remains fundamental to creditworthiness assessment. The presence of WILSH (investment in stocks) suggested that Investments in stocks may signal financial sophistication and stability to lenders.
Food security measures, Unemployment, alimony/child support (TRANSFOTHINC) and Payday Loans (HPAYDAY1) emerged as important predictors, revealing how fundamental material hardships relate to credit access. These variables may capture household financial distress that extends beyond traditional balance sheet measures, indicating chronic resource constraints that impede credit access. Savings behavior (HSAVING1) rounded out the top 15, indicating that demonstrated capacity to accumulate reserves signals creditworthiness beyond current asset levels.
Demographic Factors and Disparities
Demographic characteristics showed more limited importance in the raw feature model compared to financial variables. Continuous age (AGE) ranked seventh, confirming that lifecycle stage influences credit access patterns, likely through accumulated credit history, wealth, and lender perceptions of stability. The nonwhite/Hispanic indicator (RACE2) appeared as the 14th most important feature, indicating that racial disparities persist in credit access even after controlling for the comprehensive set of financial characteristics captured in this model. While ranking lower than in previous analyses, the presence of race among top predictors confirms systematic differences in credit market experiences across racial and ethnic groups that extend beyond observable economic factors.
The relative prominence of financial over demographic factors in this analysis suggests that credit access is predominantly though not exclusively determined by economic resources and financial behaviors. However, the persistent importance of race, even amid extensive financial controls, provides continued evidence of structural barriers in credit markets.
Discussion
Three key theoretical insights emerged from the analysis. First, the dominance of asset-based and behavioral financial indicators (equity income, homeownership, credit history, emergency savings, leverage ratios) over simple income and wealth measures supports multidimensional theories of financial stratification. Credit access is not merely a function of current economic resources but reflects accumulated assets, investment capacity, payment behaviors, and prior credit market experiences. The prominence of EQUITINC representing investment income and capital gains suggests that credit markets differentially reward households with capital ownership versus labor income, potentially perpetuating wealth-based inequality. The exceptional model performance (AUC = 0.9885) indicates that credit access patterns are highly systematic and predictable from observable household characteristics.
The analysis provided strong support for all three hypotheses with important nuances. H1 predicted that households with lower income and wealth would exhibit higher credit access concerns. This was strongly confirmed, through asset-based indicators equity to income (EQUITINC), homeownership (HHOUSES1), and emergency savings (EMERGSAV1) proved more powerful than simple income or wealth measures. Descriptive analysis in Figure 2, Figure 3 and Figure 4 reveals that households experiencing credit denial or fear demonstrated substantially lower net worth, normalized income, and liquid assets compared to the overall population, supporting this expectation. This extends H1 by demonstrating that credit access depends specifically on asset ownership, investment capacity, and liquid reserves rather than economic resources generally.
H2 predicted that demographic factors, particularly race and age, would demonstrate significant associations with credit access after controlling for economic resources. This received partial support with qualifications. Age ranked seventh among predictors, confirming importance and aligning with descriptive findings. However, race ranked 14th substantially lower than anticipated given dramatic descriptive disparities (64.5% of affected households were nonwhite/Hispanic versus 40.2% overall). This suggests that observed racial disparities operate substantially through differential economic circumstances particularly homeownership, investment income, and payment history rather than as direct independent effects. Race's persistence in the top 15 nonetheless confirms remaining structural barriers. Exploratory comparisons in Figure 5 shows that nonwhite or Hispanic households comprised 64.5% of those with credit concerns despite representing only 40.2% of the sample, while younger households (under age 45) were disproportionately affected in Figure 6.
H3 predicted moderate-to-strong predictive performance (AUC > 0.75). This was dramatically exceeded, with Model A achieving AUC = 0.9885, demonstrating that credit access concerns are highly systematic and predictable from observable characteristics rather than idiosyncratic.
Policy Implications. The results suggest four policy directions. First, asset-building policies targeting homeownership and investment income generation such as down payment assistance programs, community land trusts, and expansion of matched savings accounts for securities investment represent fundamental strategies for improving credit access. Second, emergency savings programs and financial resilience initiatives addressing material hardship indicators could reduce credit vulnerability by enabling households to avoid payment delinquencies and credit denials during temporary income disruptions. Third, the importance of payment history and credit application history highlights need for credit repair programs, alternative credit scoring models that weigh recent versus historical behavior, and policies reducing barriers to credit access after past delinquencies. Fourth, addressing racial disparities requires targeted interventions through strengthened fair lending enforcement.
Limitations. The study is not without certain limitation. Key limitations include (a) sampling error (our study is based on a survey with 4595 unique families), (d) absence of credit bureau data (credit scores, detailed credit histories) that lenders actually use; (e) no examination of variation across credit product types (mortgages, auto loans, credit cards, small business loans); (f) unique 2022 economic context following COVID-19 pandemic; and (g) limited exploration of interactions among predictors (e.g., how race moderates relationships between financial factors and credit access).
Code Availability Statement
The complete R Code used for this analysis is available at https://github.com/jainrachit1008/Predictive_Modeling_of_HouseholdCreditRisk-_and_FearofDenial.
Data Availability Statement
Data used in this study was extracted from the 2022 Survey of Consumer Finances (SCF), a comprehensive triennial cross-sectional survey administered by the Federal Reserve Board. It can be accessed at: https://www.federalreserve.gov/econres/files/scfp2022s.zip.
The SCF Variable Names used for building the data dictionary can be extracted from https://sda.berkeley.edu/sdaweb/docs/scfcomb/DOC/hcbkx01.htm.
References
- Yoo, J., & Felver, J. C. (2025). Fewer Cards, Less Credit: The Role of Student Loans in Credit Access, Generally and Among Racial and Ethnic Groups, Journal of Consumer Affairs https://www.sciencedirect.com/science/article/pii/S1059056025008883. [CrossRef]
- B. J. Hershbein and K. Hollenbeck, “Student Loans and the Dynamics of Debt,” Feb. 2015.
- Sant'Anna, A. C.; Cowley, C.; Katchova, A. L. Examining the Relationship between Land Values and Credit Availability. Journal of Agricultural and Applied Economics 2021, 53, 187–205. [Google Scholar] [CrossRef]
- Durguner, S. Relaxed Lending Standards and the 2007 Mortgage Crisis: Changes in Household Debt and Borrowing Behaviors. International Journal of Central Banking 2020. [Google Scholar]
- Kim, K. T.; Wilmarth, M. J.; Henager, R. Poverty Levels and Debt Indicators Among Low-Income Households Before and After the Great Recession. Journal of Financial Counseling and Planning 2017, 28, 196–212. [Google Scholar] [CrossRef]
- Anyamele, O.D. Racial Ethnic differences in Household Loan Delinquency Rate in recent financial crisis: Evidence from 2007 and 2010 Survey of Consumer Finances. Journal of Applied Finance and Banking 2018, 8, 1–24. [Google Scholar]
- Bricker, J.; Thompson, J. P. Does education loan debt influence household financial distress? an assessment using the 2007–2009 survey of consumer finances panel. Contemporary Economic Policy 2016, 34, 660–677. [Google Scholar] [CrossRef]
- Lee, J.; Kim, K. T. The Increase in Payday Loans and Damaged Credit after the Great Recession. Early Childhood Education Journal 2018, 39, 360–369. [Google Scholar] [CrossRef]
- Kim, K. T.; Wilmarth, M. J.; Choi, S. Credit use of U.S. households after the Great Recession: The role of credit constraint. Family and Consumer Sciences Research Journal 2016, 44, 387–403. [Google Scholar] [CrossRef]
- Kim, K. T.; Wilmarth, M. J.; Henager, R. Poverty levels and debt indicators among low-income households before and after the Great Recession. Journal of Financial Counseling and Planning 2017, 28, 196–212. [Google Scholar] [CrossRef]
- Grant, C. The Evolution of Arrears among US Households 1995–2013. Journal of Risk and Financial Management 2021, 14, 43. [Google Scholar] [CrossRef]
- Choi, K. J., Koo, H. K., & Lim, B. H. (2015). The role of housing net worth in determining household credit limits. Social Science Research Network. [CrossRef]
- Dogra, K.; Gorbachev, O. Consumption volatility, liquidity constraints and household welfare. The Economic Journal 2016, 126, 2012–2037. [Google Scholar] [CrossRef]
- Exler, F., & Tertilt, M. (2020). Consumer debt and default: A macroeconomic perspective. Social Science Research Network.
- Livshits, I.; MacGee, J.; Tertilt, M. The democratization of credit and the rise in consumer bankruptcies. The Review of Economic Studies 2016, 83, 1673–1710. [Google Scholar] [CrossRef]
- Nasirzonouzi, A., & Davalos, S. (2024). Fear and finance: An unsupervised machine learning study on credit-averse households in the U.S. In Advances in Intelligent Systems and Computing (pp. 1-15). [CrossRef]
- Park, K. A. Measuring risk and access to mortgage credit with new disclosure data. The Journal of Structured Finance 2021, 26, 53–68. [Google Scholar] [CrossRef]
- Stiglitz, J. E.; Weiss, A. Credit rationing in markets with imperfect information. American Economic Review 1981, 71, 393–410. [Google Scholar]
- University of California, Berkeley. (n.d.). Survey of Consumer Finances: Variable codebook. Survey Documentation and Analysis (SDA). Retrieved from https://sda.berkeley.edu.
Figure 2.
Net Worth Distribution for Credit denied/feared Household compared to Overall Population in the survey sample. Note. Households facing credit denial or fear shows significantly lower accumulated wealth and are disproportionately clustered at the lower end of the national wealth distribution.
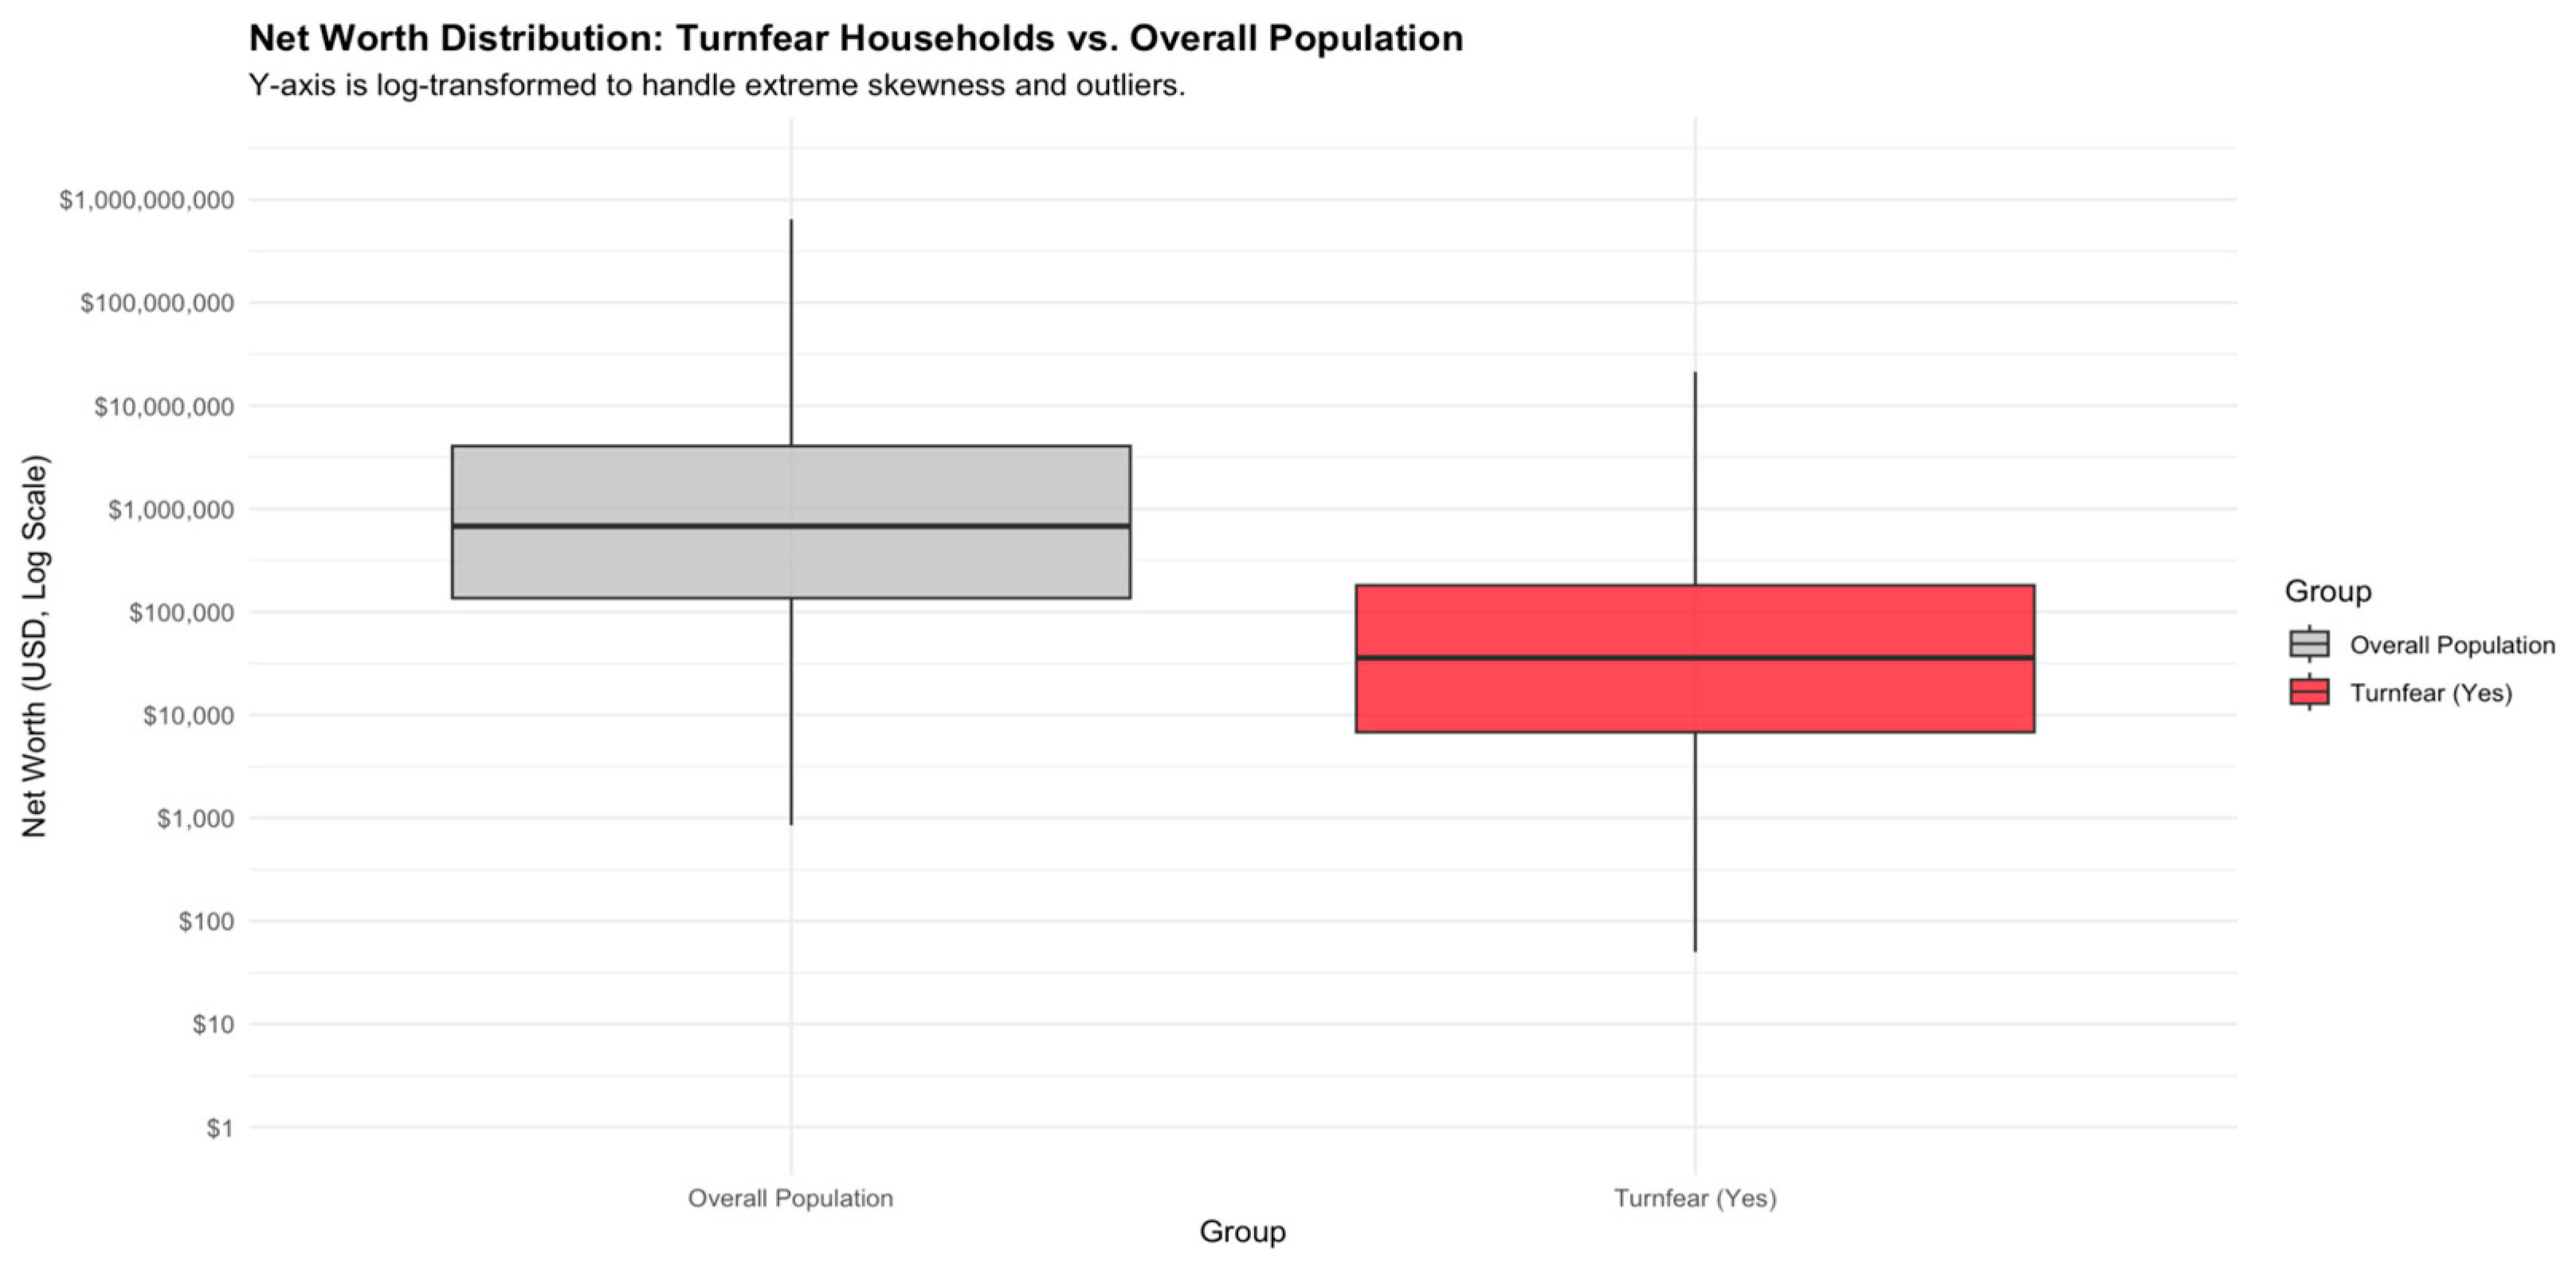
Figure 3.
Normalized Income Distribution for Credit denied/feared Household compared to Overall Population in the survey sample. Note. Lower income directly impacts borrowing capacity and credit scores, making these households more likely to be denied credit or to fear denial.
Figure 3.
Normalized Income Distribution for Credit denied/feared Household compared to Overall Population in the survey sample. Note. Lower income directly impacts borrowing capacity and credit scores, making these households more likely to be denied credit or to fear denial.
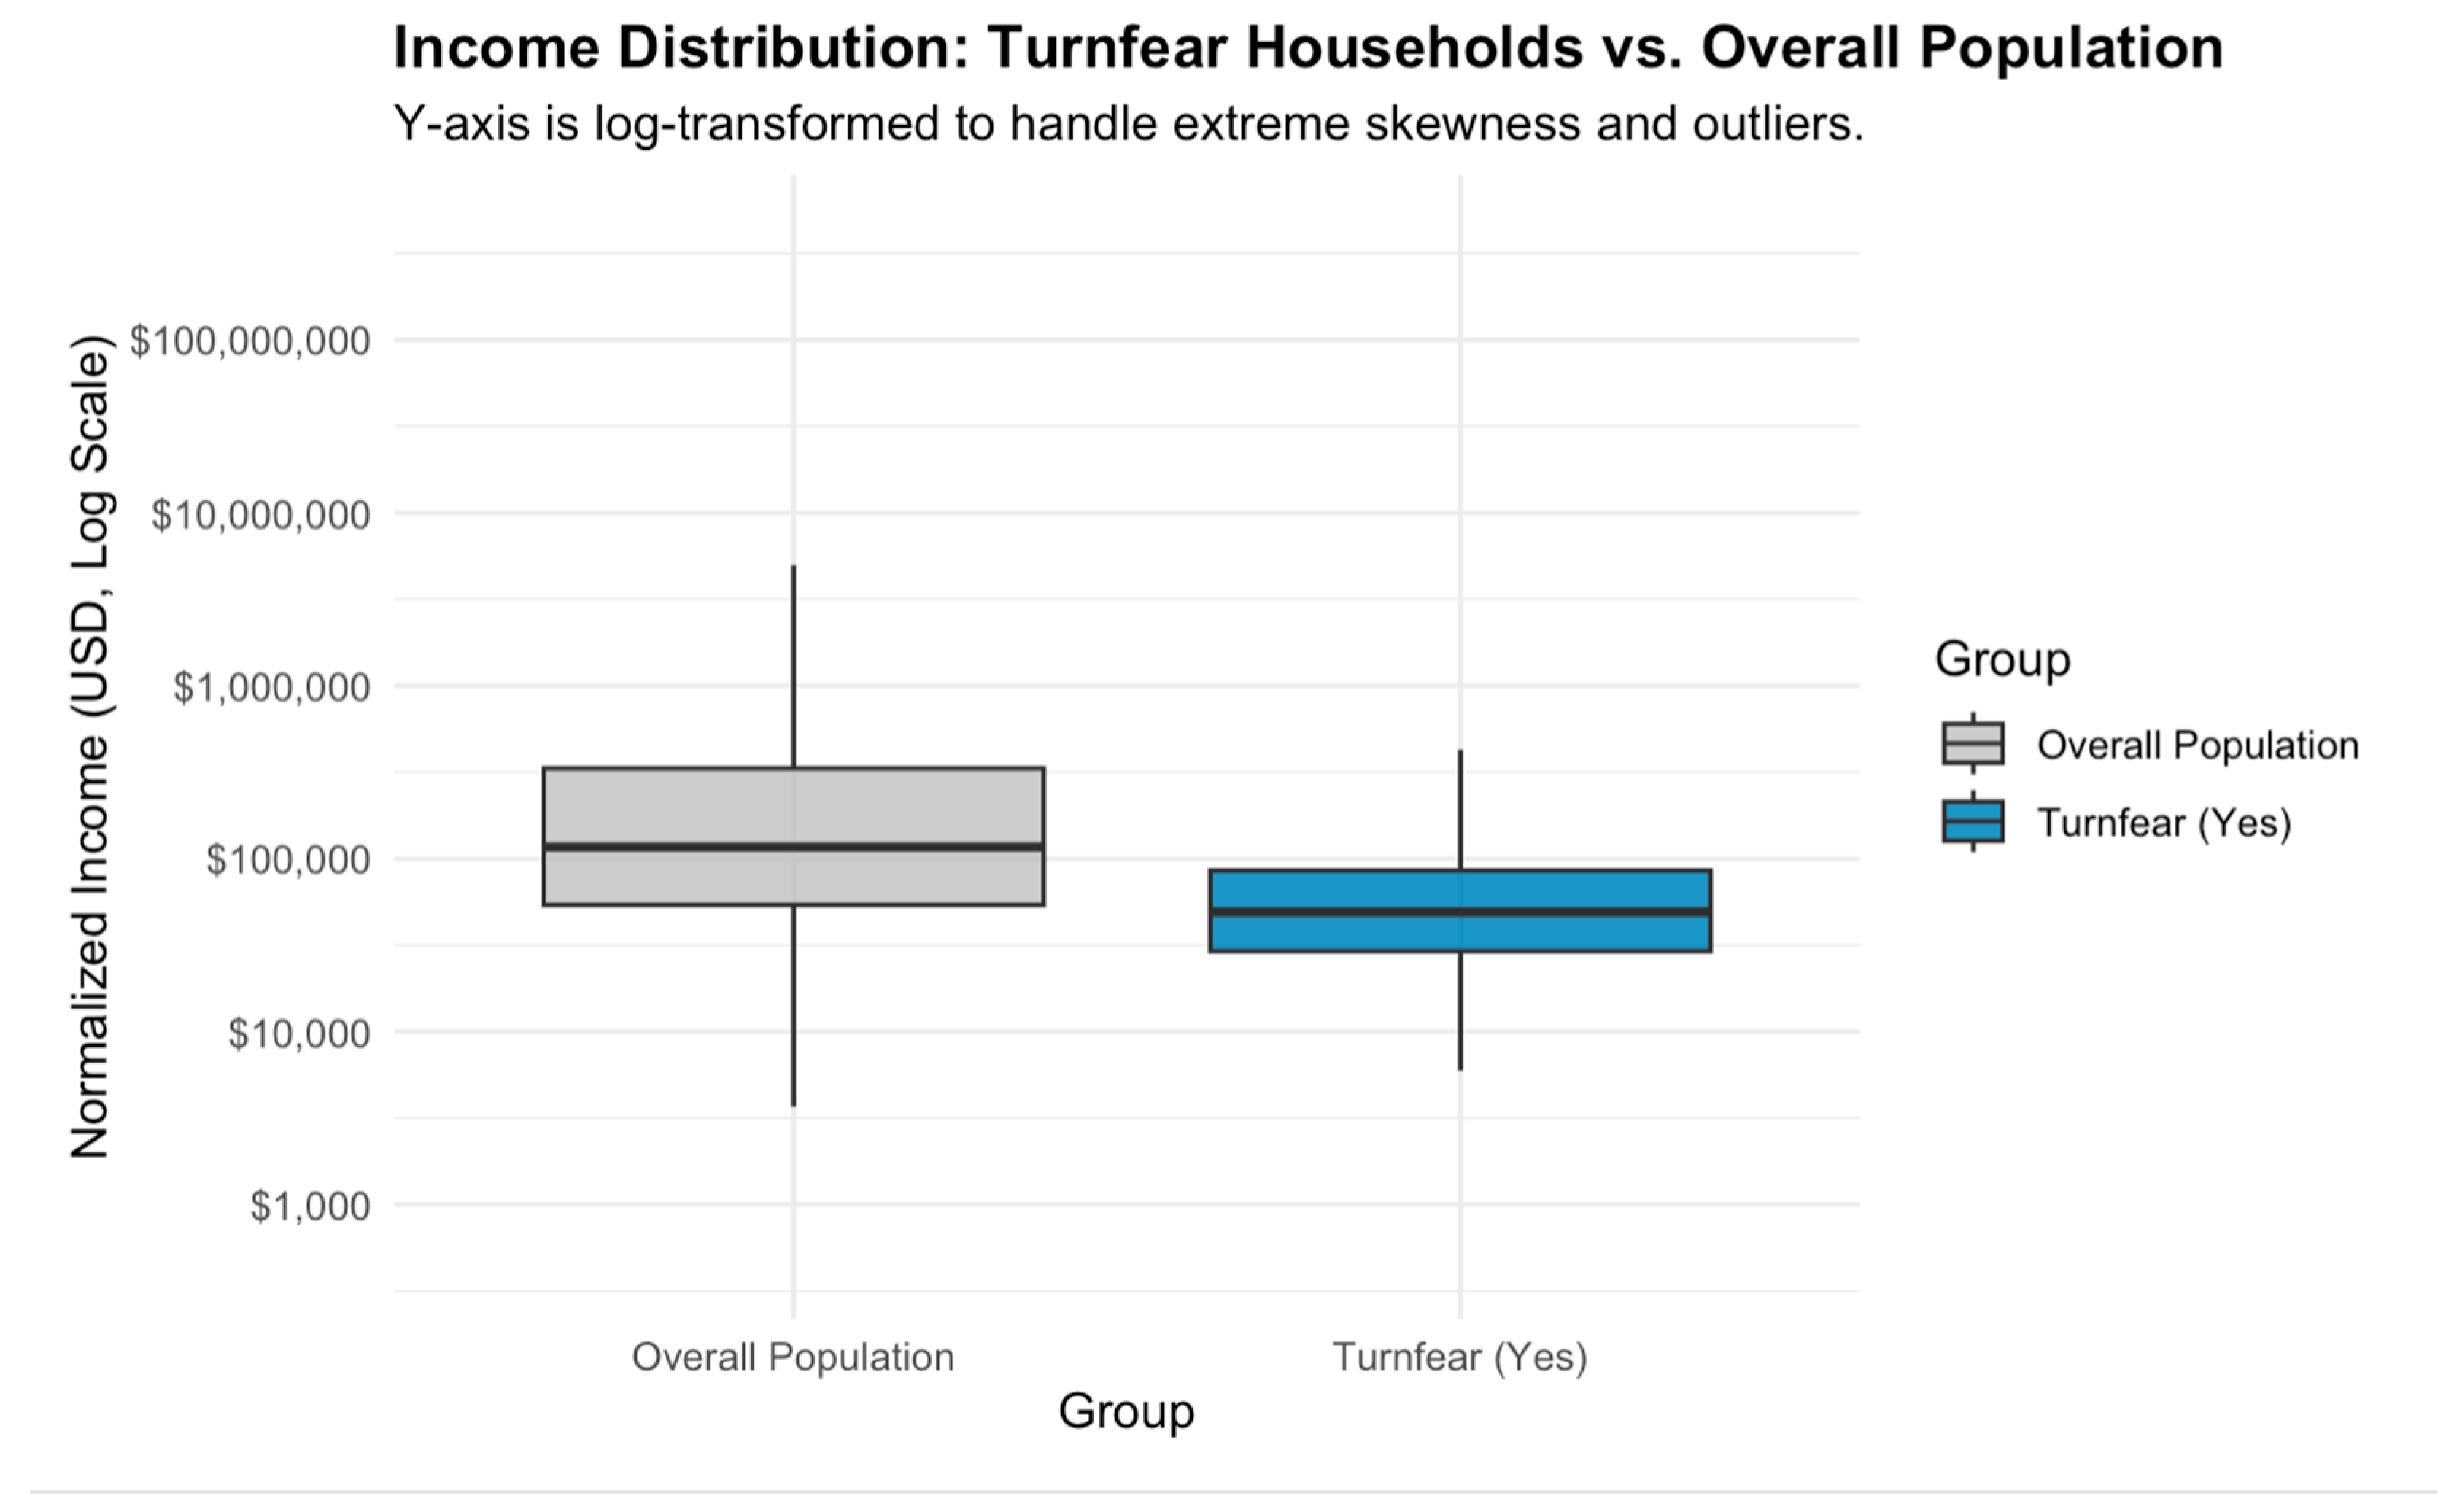
Figure 4.
Log transformed Liquid Assets Distribution for Credit denied/feared Household compared to Overall Population in the survey sample. Note. A lack of liquid assets means these households have no financial buffer, amplifying the risk for lenders and thus increasing the likelihood of credit denial.
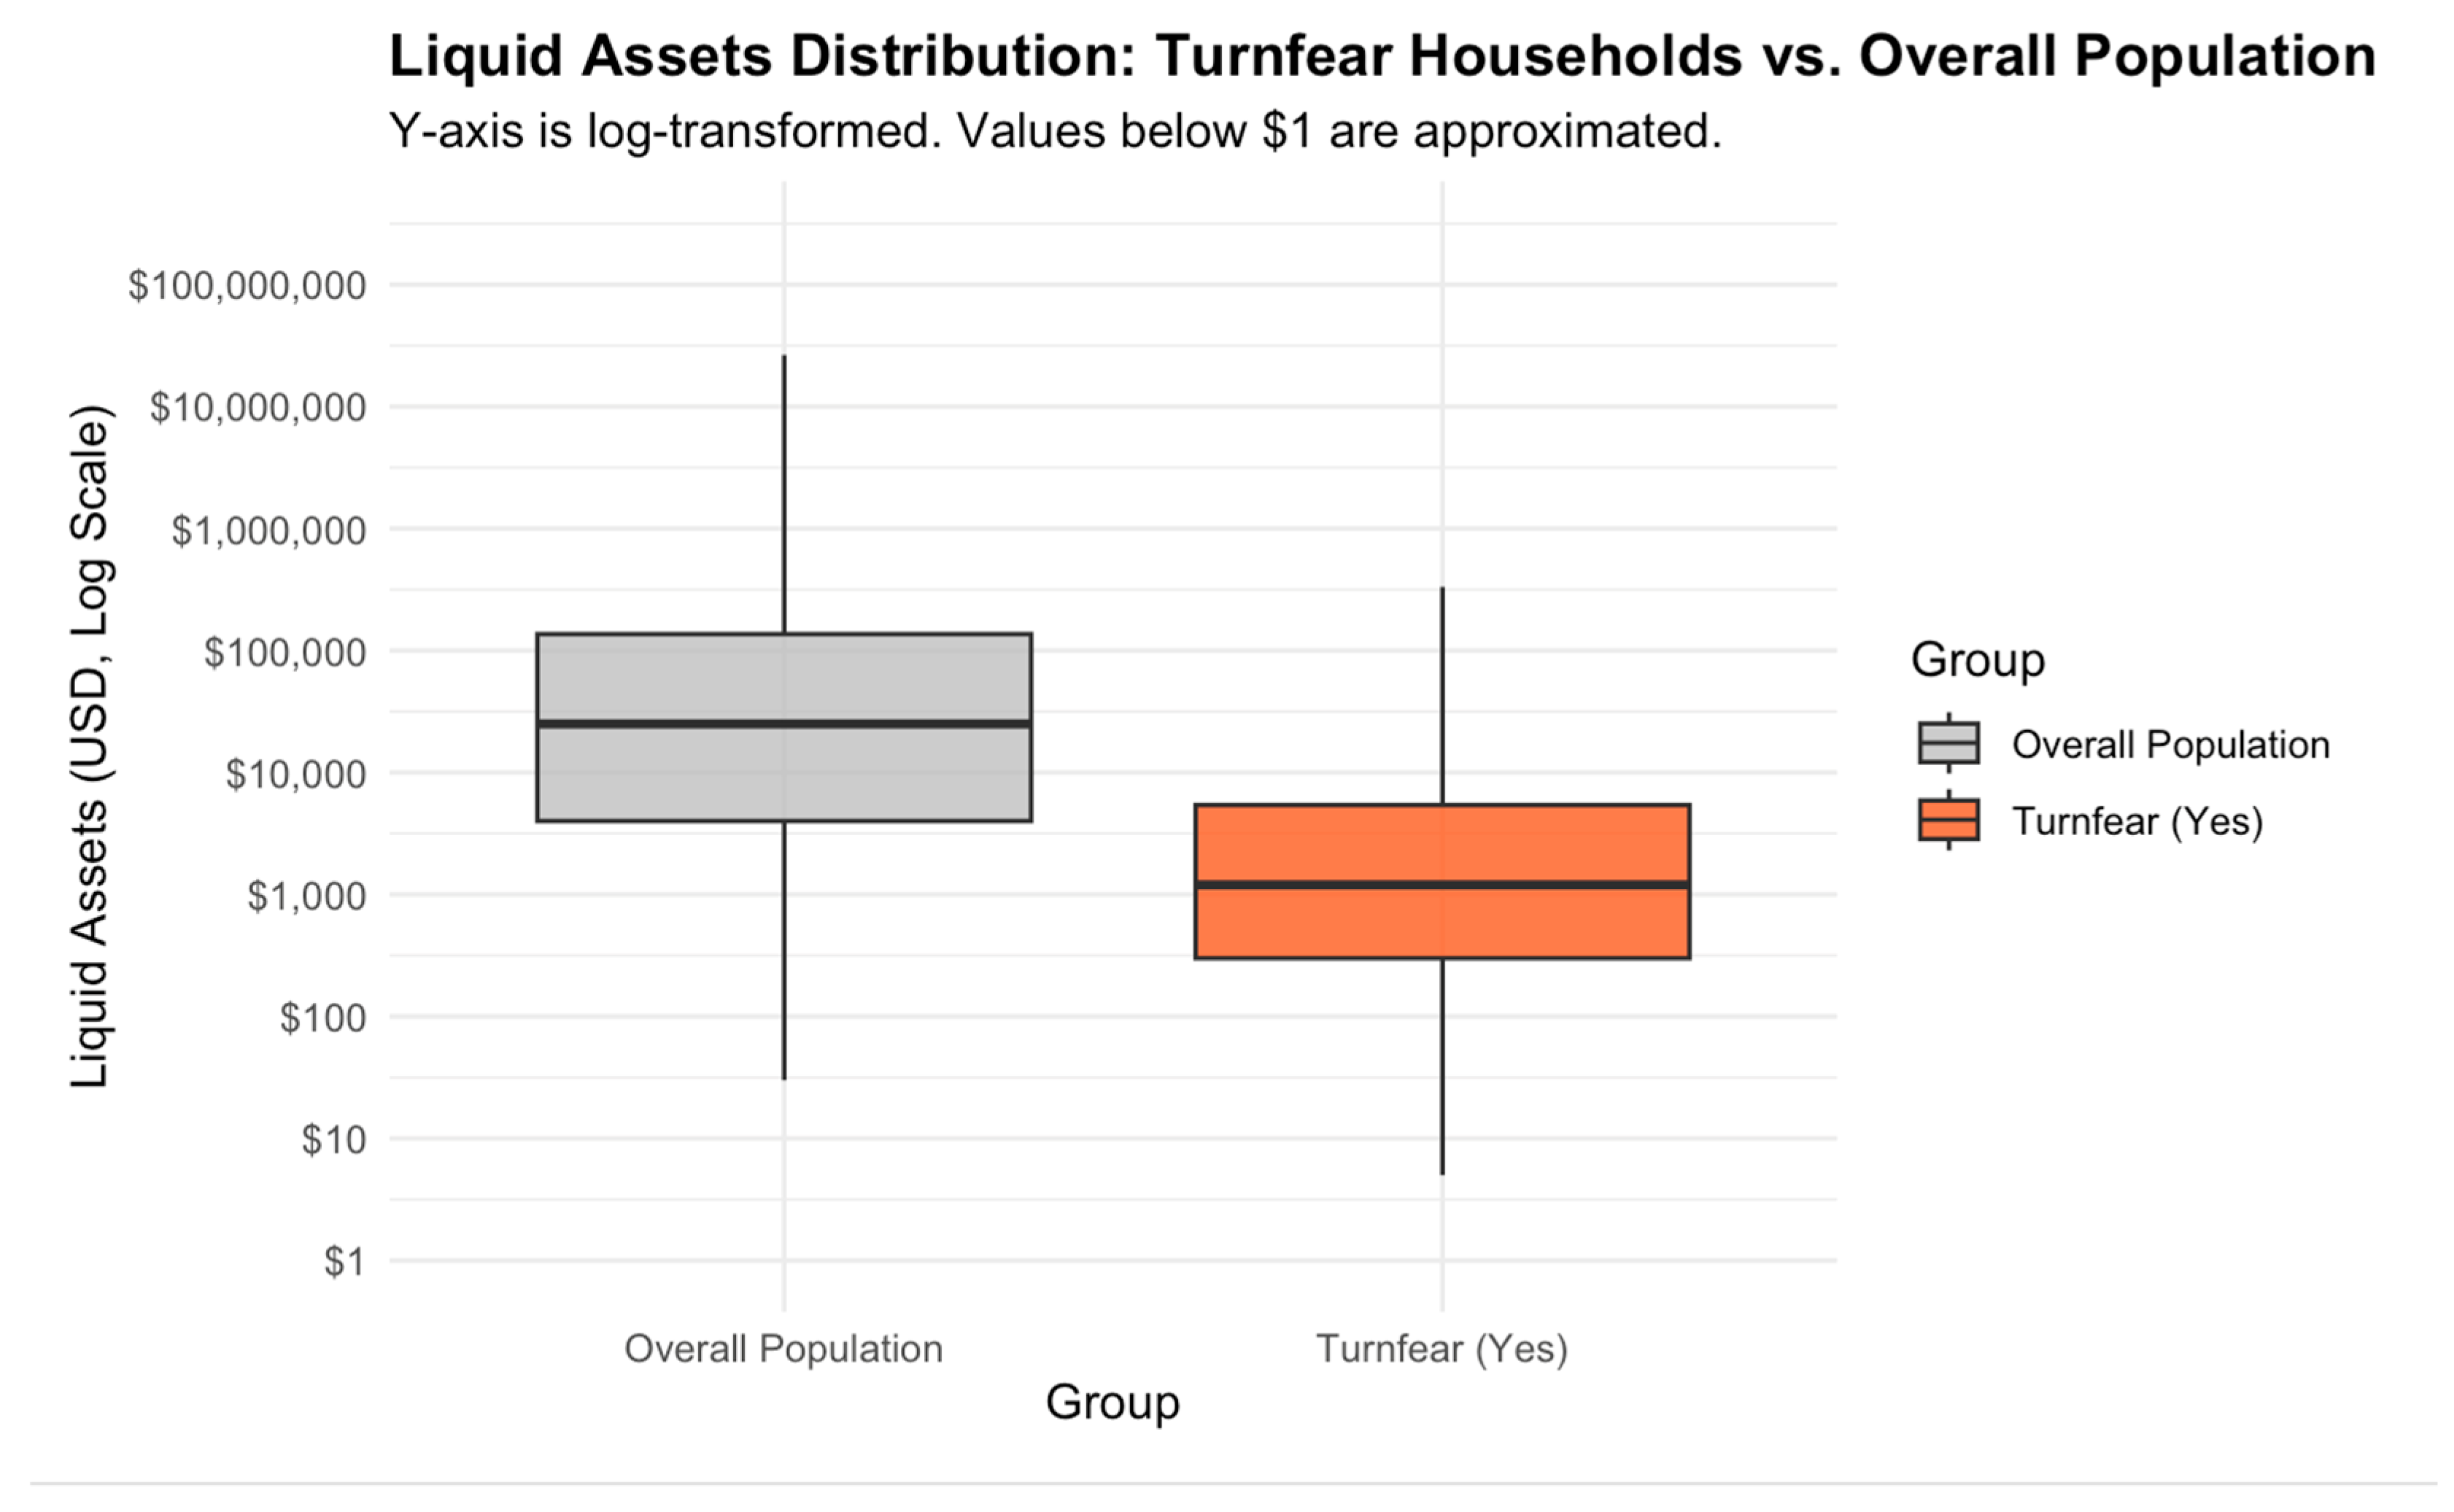
Figure 5.
Race Category Distribution for Credit denied/feared Household compared to Overall Population in the survey sample. Note. The results show a 24.25% percentage point gap, strongly suggesting that Non-white or Hispanic faces disproportionately higher systemic barriers to obtaining credit compared to the general population.
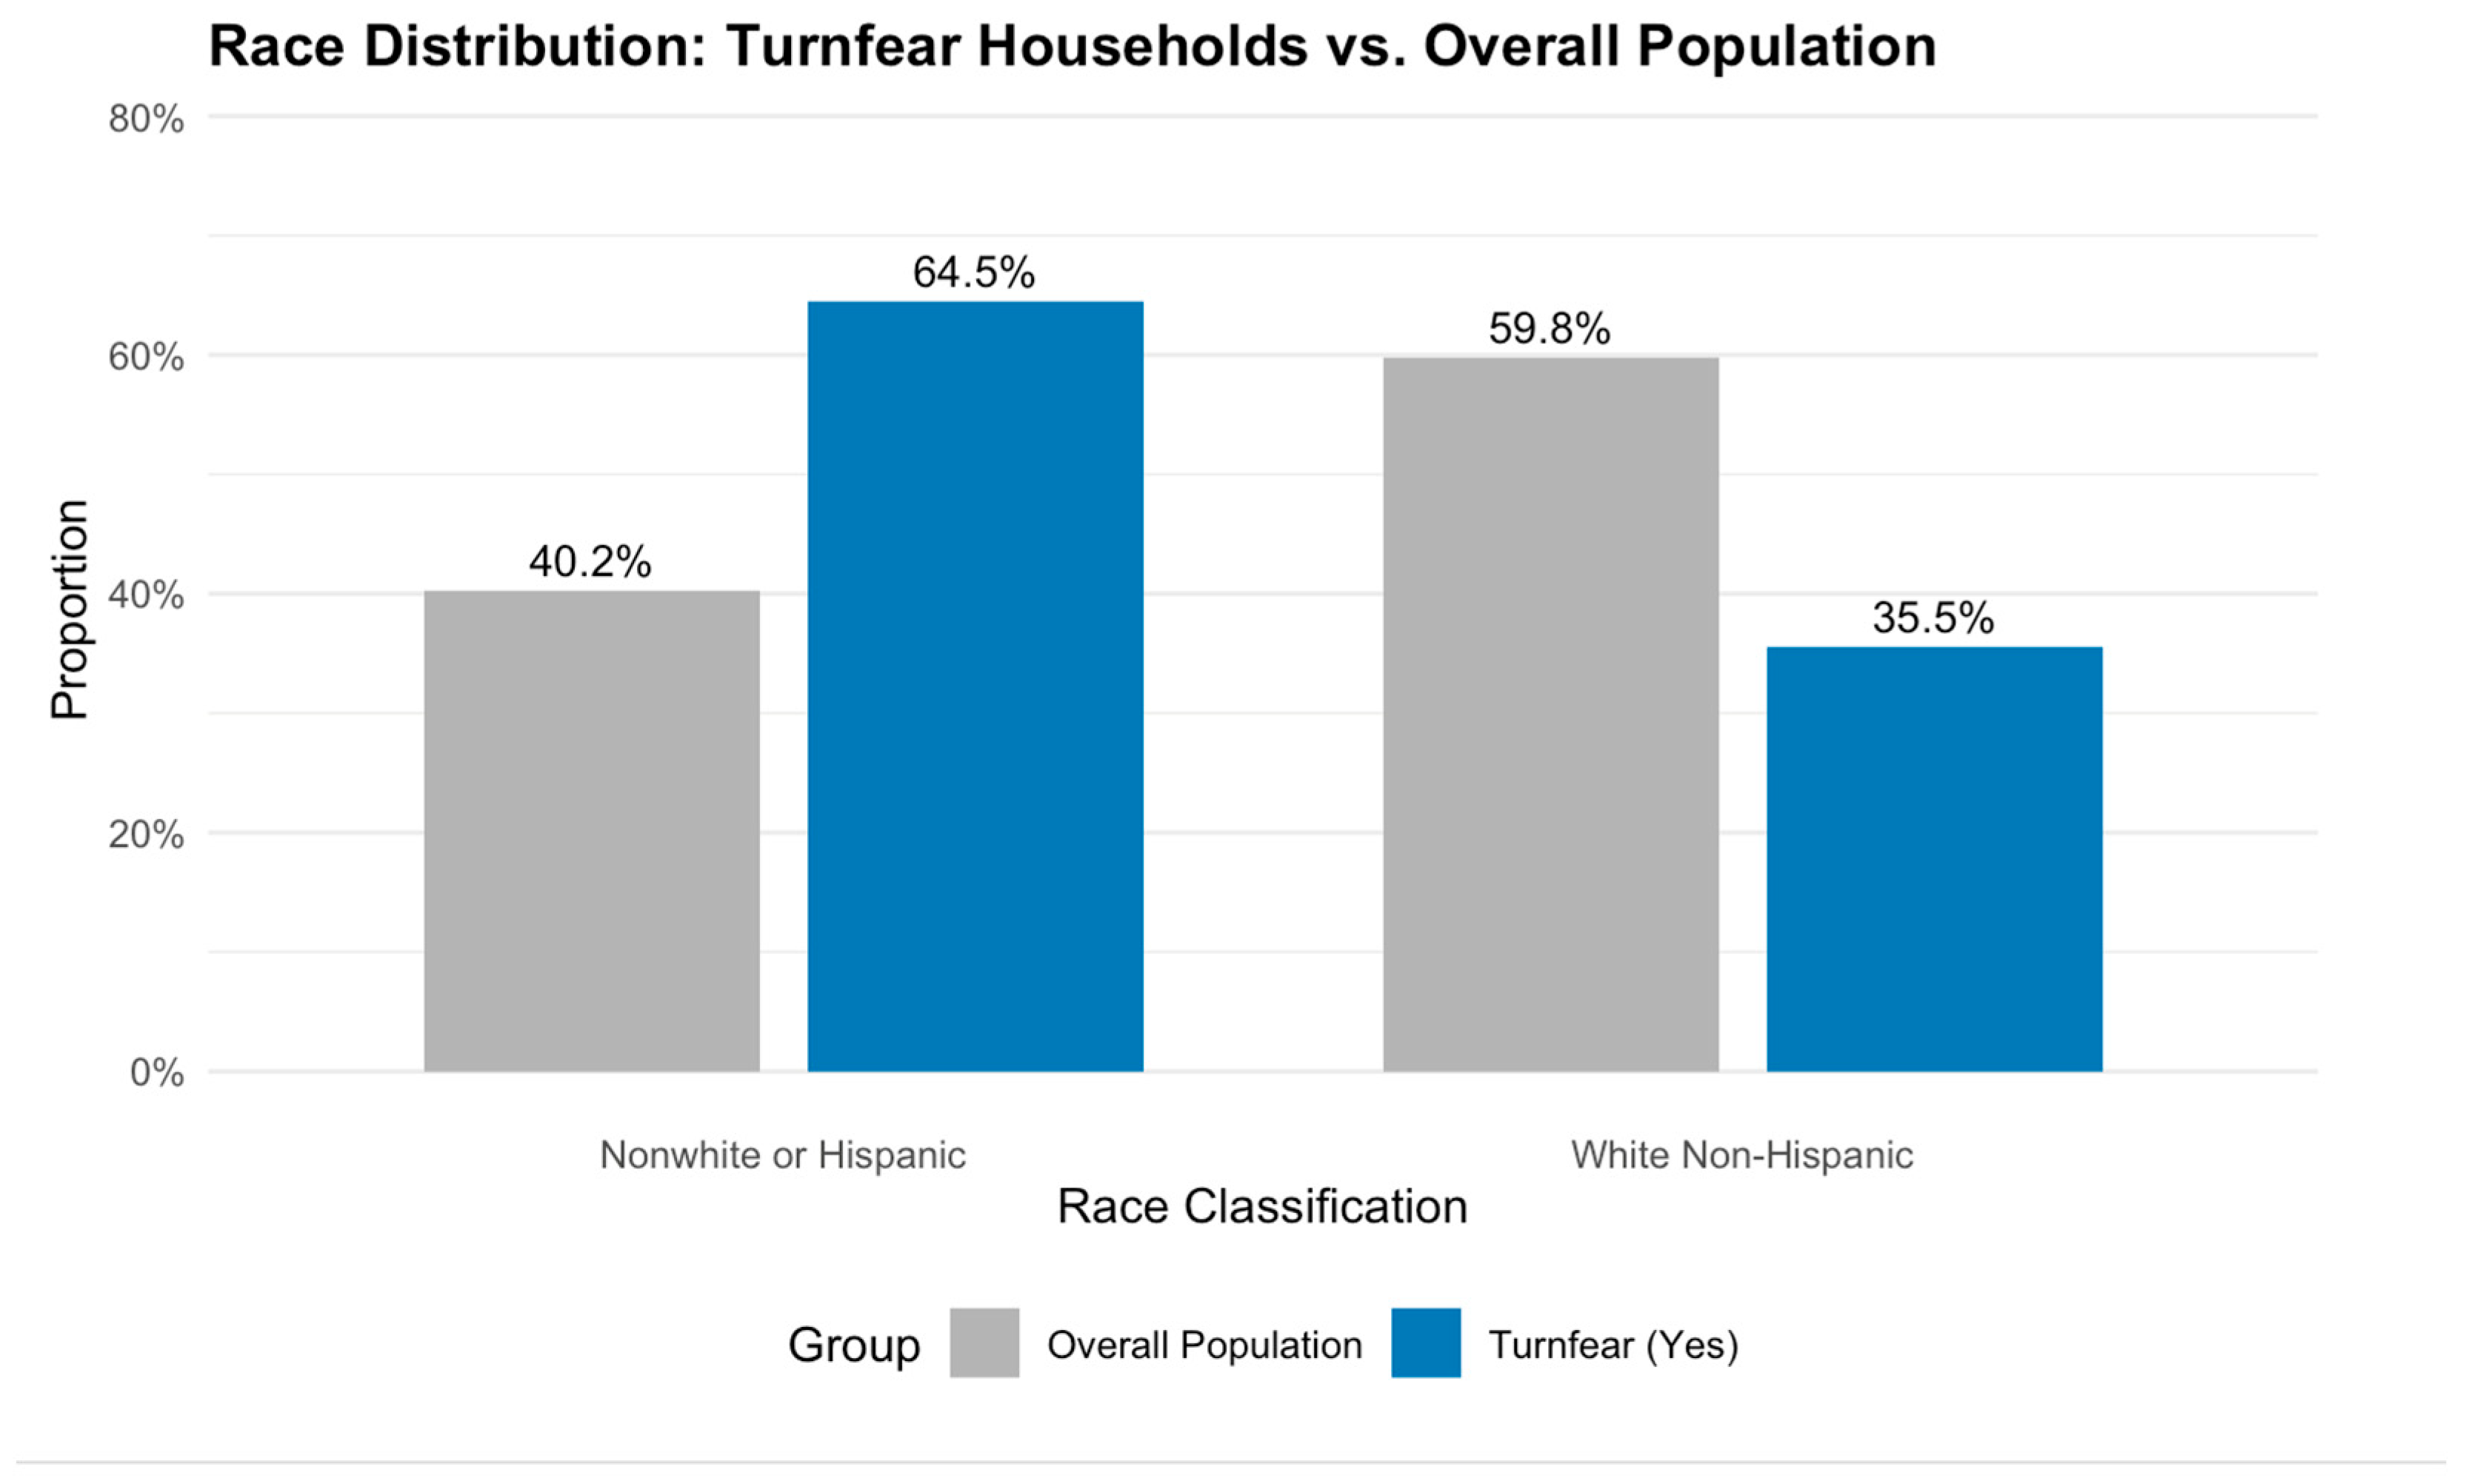
Figure 6.
Age Distribution for Credit denied/feared Household compared to Overall Population in the survey sample. Note. This suggests that households led by individuals under the age of 45 face the greatest structural barriers or reluctance to pursue credit, relative to their presence in the general public.
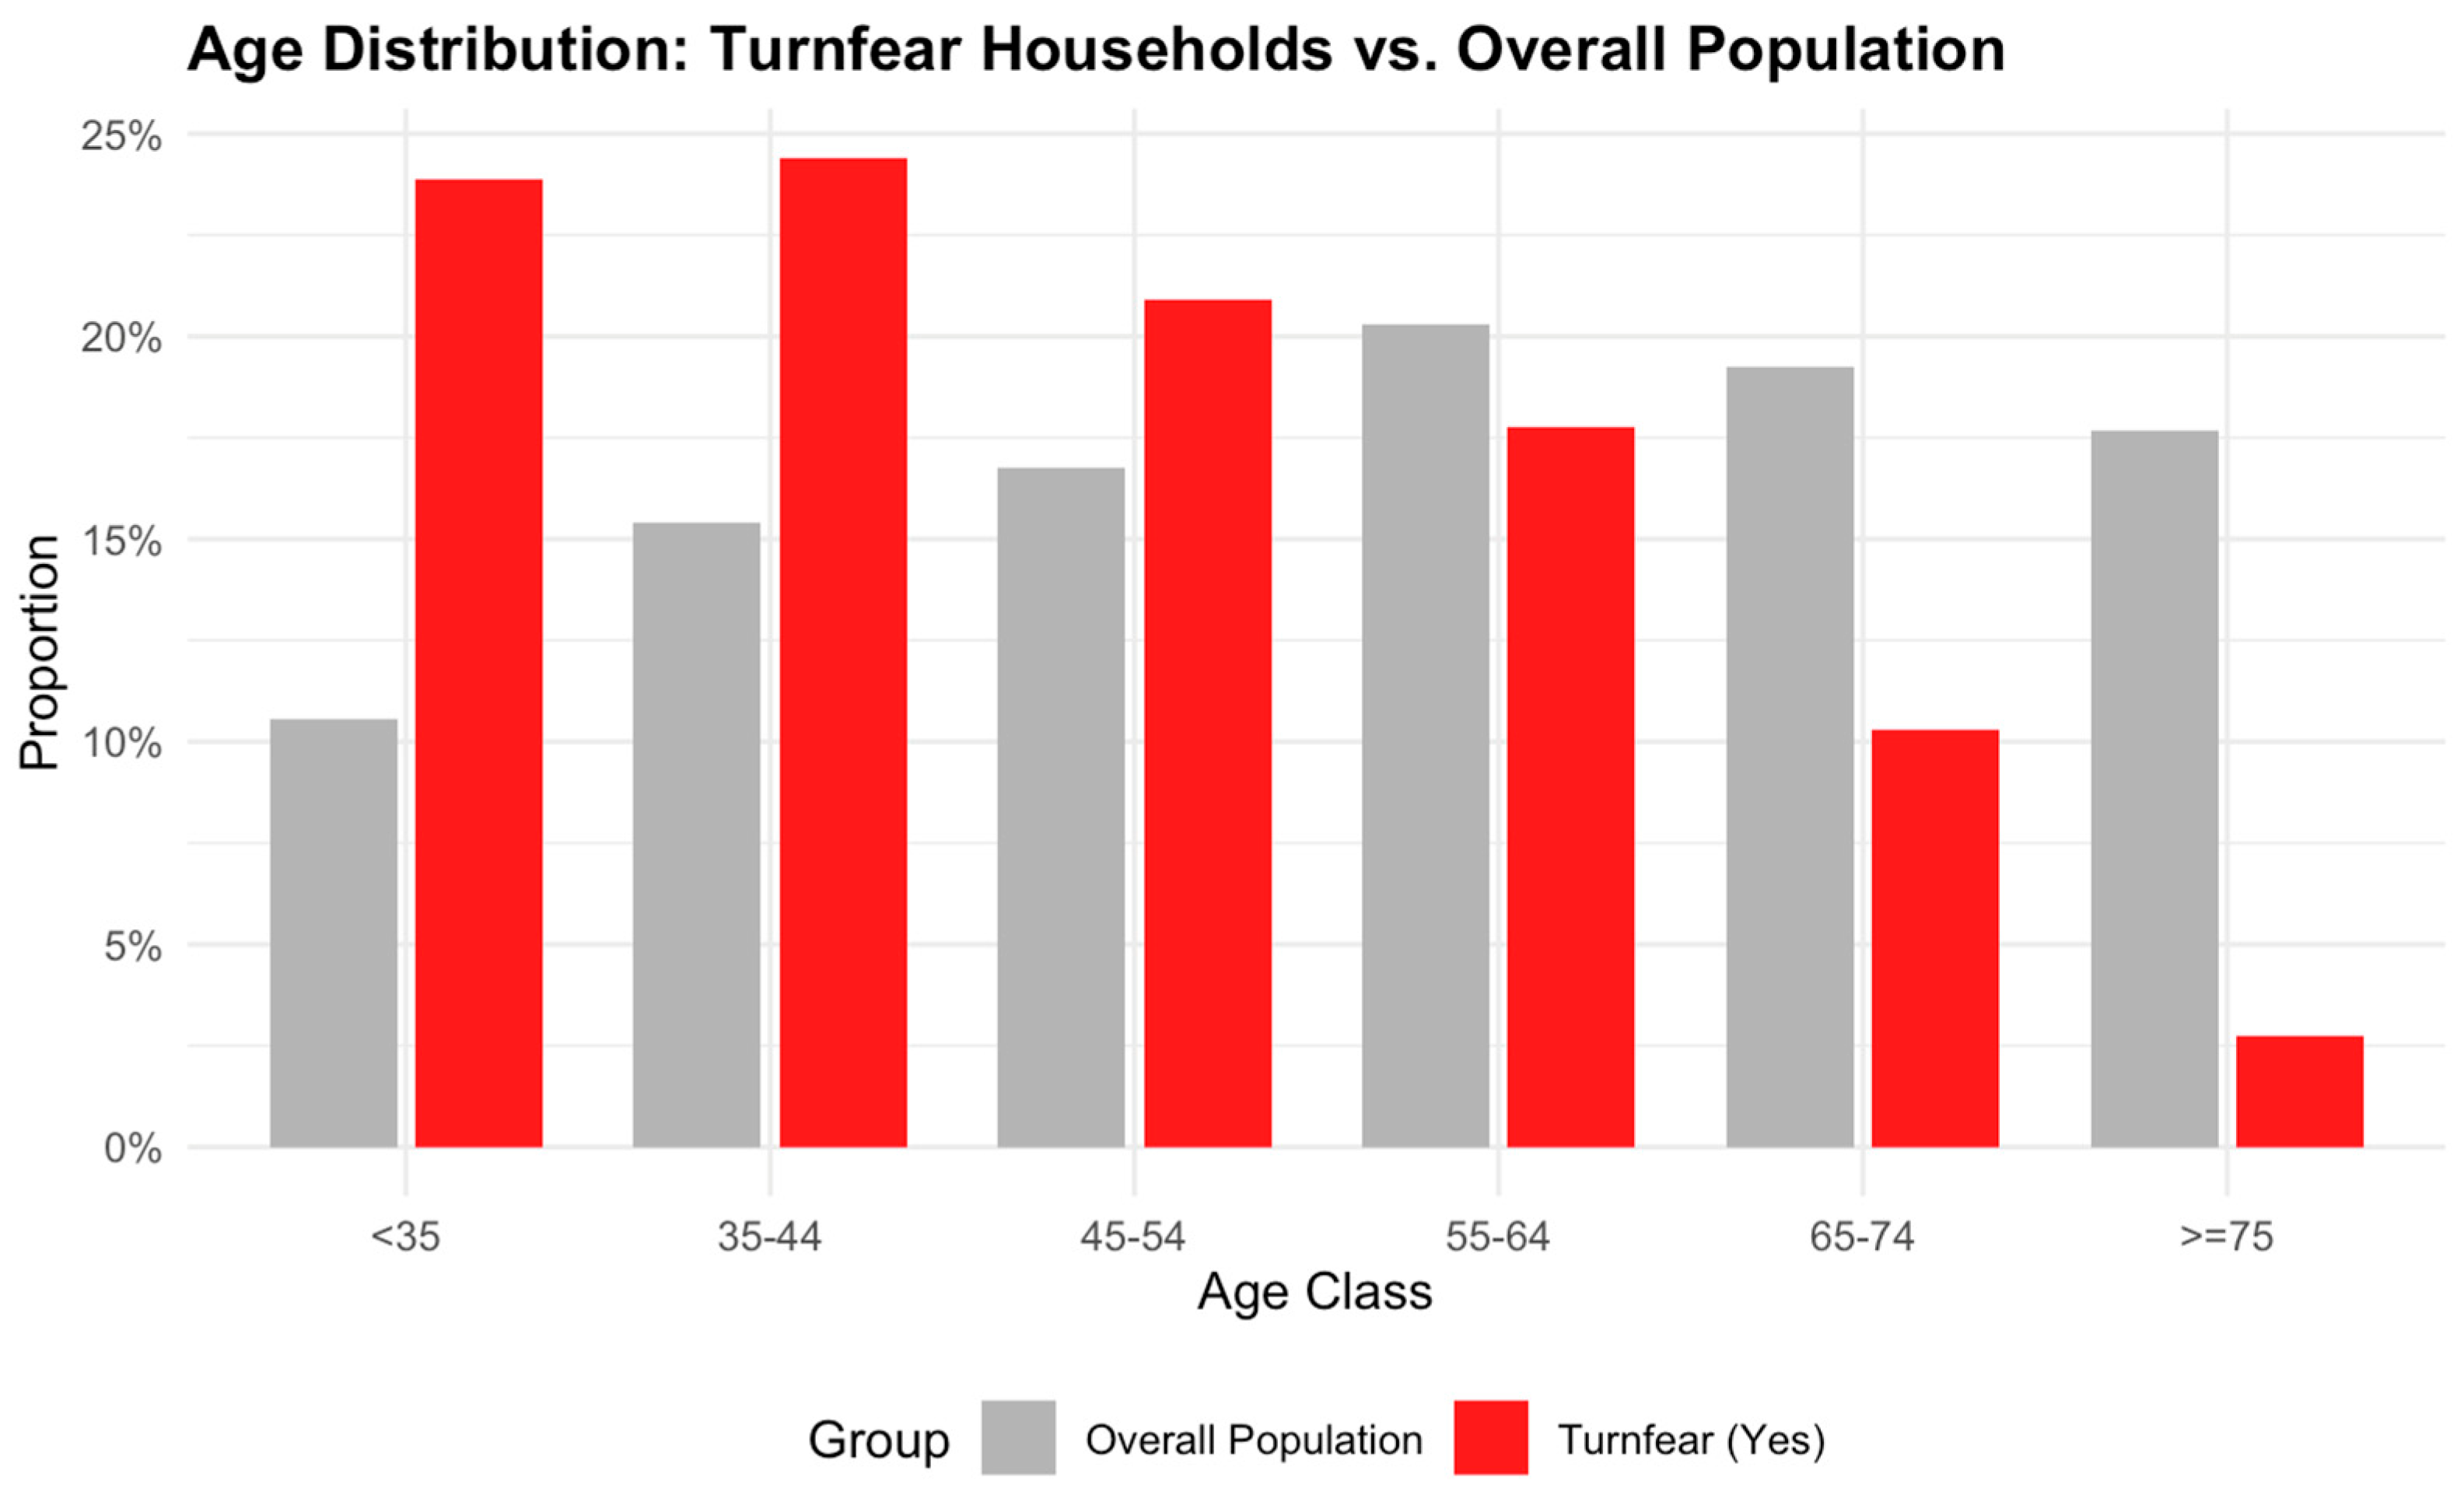
Figure 7.
Scree Plot for Principal Components shows cumulative variance explained by adding for Principal Components to the model.
Figure 7.
Scree Plot for Principal Components shows cumulative variance explained by adding for Principal Components to the model.
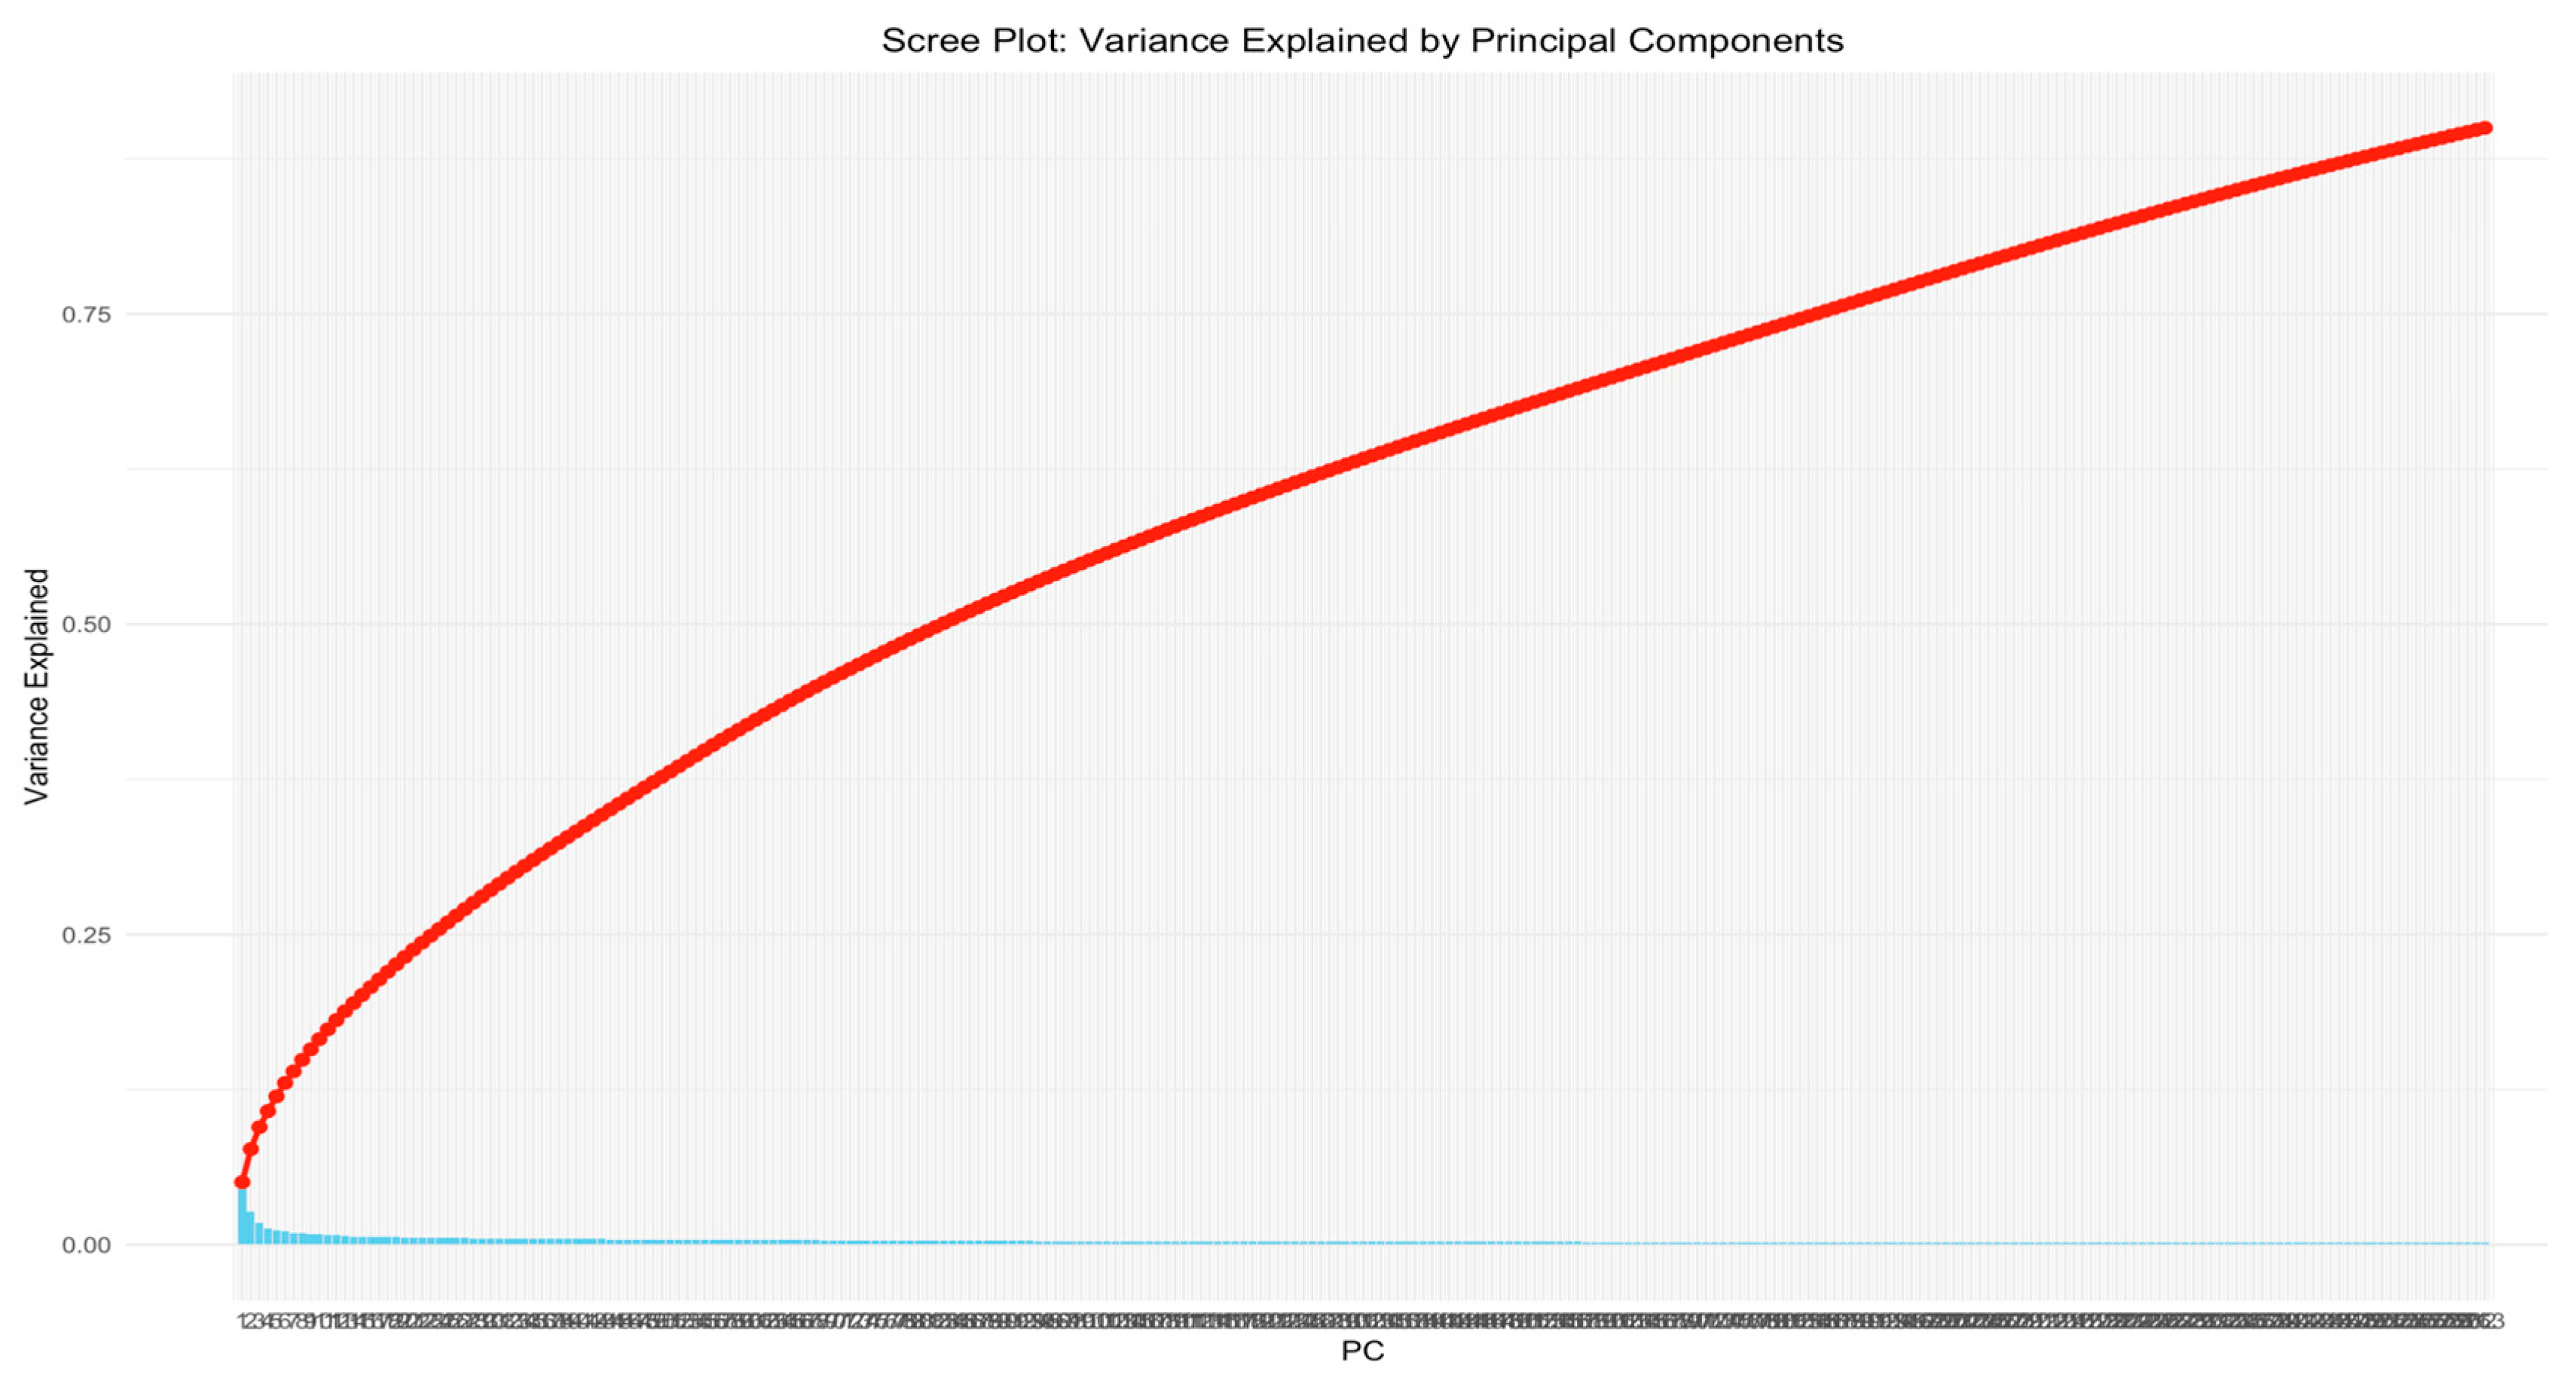

Table 1.
Top 5 Absolute Correlations between variables.
| Variable 1 | Variable 2 | Correlation |
|---|---|---|
| MRTHEL | NH_MORT | 0.9997 |
| ASSET | NETWORTH | 0.9996 |
| ODEBT | PAYMARG | 0.9995 |
| NOTXBND | BOND | 0.9994 |
| CCBAL | LLOAN10 | 0.9992 |
Table 2.
Model Performance Comparison on Test Set. Note. AUC = Area Under the Receiver Operating Characteristic Curve.
Table 2.
Model Performance Comparison on Test Set. Note. AUC = Area Under the Receiver Operating Characteristic Curve.
| Model | Features | Accuracy | AUC | Recall | Precision | F1 Score |
|---|---|---|---|---|---|---|
| A (XGBoost - PCA) | 263 | 96.65% | 0.9885 | 82.01% | 97.52% | 0.9802 |
| B (Logistic Regression - PCA) | 263 | 80.34% | 0.7955 | 78.37% | 44.93% | 0.8724 |
Table 3.
Confusion Matrix: Model A (XGBoost - PCA).
| Predicted: NoFear | Predicted: Fear | Total | |
|---|---|---|---|
| Actual: NoFear | 5,716 | 24 | 5,740 |
| Actual: Fear | 207 | 944 | 1,151 |
| Total | 5,923 | 968 | 6,891 |
Table 4.
Confusion Matrix: Model B (Logistic Regression - PCA).
| Predicted: NoFear | Predicted: Fear | Total | |
|---|---|---|---|
| Actual: NoFear | 4,634 | 1,106 | 5,740 |
| Actual: Fear | 249 | 902 | 1,151 |
| Total | 4,883 | 2,008 | 6,891 |
Disclaimer/Publisher’s Note: The statements, opinions and data contained in all publications are solely those of the individual author(s) and contributor(s) and not of MDPI and/or the editor(s). MDPI and/or the editor(s) disclaim responsibility for any injury to people or property resulting from any ideas, methods, instructions or products referred to in the content. |
© 2025 by the authors. Licensee MDPI, Basel, Switzerland. This article is an open access article distributed under the terms and conditions of the Creative Commons Attribution (CC BY) license (http://creativecommons.org/licenses/by/4.0/).
Copyright: This open access article is published under a Creative Commons CC BY 4.0 license, which permit the free download, distribution, and reuse, provided that the author and preprint are cited in any reuse.


