
Submitted:
03 December 2025
Posted:
04 December 2025
You are already at the latest version
Abstract
This study develops and validates a simulation driven, human centric lighting framework for UK residential buildings that integrates circadian and biophilic design, daylight harvesting, and dynamic smart controls using DIALux Evo. A comparative quantitative design was adopted to evaluate traditional manual calculation versus simulation based optimisation across twenty lighting scenes in one bedroom flats, under identical spatial and environmental conditions and in compliance with EN 12464 1 and CIBSE LG standards. Performance was assessed using electrical energy consumption (kWh), average illuminance (lux), and luminous efficacy (lm/W), with statistical validation via paired t tests. The optimised design reduced mean energy consumption from 10.25 kWh to 8.68 kWh (t = 5.12, p = 1.2×10⁻⁵), increased mean illuminance from 94.36 lux to 116.93 lux (t = 7.095, p = 1.0×10⁻⁶), and improved luminous efficacy from 57.2–65.65 lm/W to 98.25–105.35 lm/W across living, kitchen, bedroom, and bathroom areas. Although a minority of scenes showed neutral or adverse energy outcomes, the dominant trend evidences statistically significant reductions in demand and enhanced lighting quality. The contribution is a reproducible and standards aligned methodology that advances best practice for low carbon residential lighting, with actionable guidance for architects, engineers, and policymakers pursuing Net Zero targets and occupant well being.
Keywords:
building performance simulation
; human-centric lighting
; energy efficiency
; circadian lighting
; residential buildings
; DIALux Evo
1. Introduction
Residential lighting is an essential aspect of modern day-to-day living, contributing to both context and functionality within homes. Rising living costs and higher energy bills have become a major concern due to the current economic crisis in the UK following the Covid-19 pandemic. Still, residential lighting in the UK is beset by various challenges, ranging from energy inefficiency and lack of user control to poor design and health concerns. Addressing these problems requires a multifaceted approach that encompasses technological innovation, design expertise, and regulatory compliance [1].
One of the primary concerns in residential lighting in the UK is energy inefficiency, particularly in older homes equipped with outdated lighting fixtures and incandescent bulbs [1]. The majority of the current residential buildings have severely damaged exteriors and outdated systems [2]. Despite efforts to improve energy performance through regulations and incentives, many homes still exhibit poor energy performance, leading to wasted energy and increased environmental impact. Research by Sonta et al. [3] highlighted the need for restoring older structures to lessen their negative effects on the environment and energy consumption. However, decision-makers face a significant challenge in proposing a renovation strategy that fully utilizes resources, reduces energy consumption and negative environmental impacts, and stays within an acceptable budget [4]. Many residential lighting systems in the UK lack adequate user control and flexibility, limiting occupants' ability to adjust lighting levels according to their preferences and activities [5]. This can lead to discomfort, reduced productivity, and wasted energy. In some cases, residential lighting suffers from poor design, resulting in inadequate illumination, glare, and uneven light distribution. This not only detracts from the visual appeal of the space but also compromises safety and functionality.
In residential environments, a failure to provide biologically appropriate lighting can significantly impact occupant health and comfort, resulting in adverse outcomes such as eye strain and compromised sleep [6]. This is primarily due to the potent effect of blue-spectrum artificial light, particularly when encountered in the evening. This light actively interferes with the circadian rhythm, which is the body's natural, internal 24-hour clock that regulates physiological processes, including the sleep-wake cycle. The interference occurs by suppressing the production of melatonin, the hormone responsible for signaling the onset of sleep. Designing for circadian lighting principles thus represents a critical intervention. This practice involves dynamically varying the intensity and colour temperature of artificial light throughout the day to closely mimic natural daylight cycles, thereby supporting the stability of the occupant's circadian rhythm to promote restorative sleep and enhance overall physiological well-being [7].
Many homes still rely on inefficient lighting technologies, such as incandescent and halogen lamps, which consume more energy and contribute to higher electricity bills and carbon emissions [8]. Poorly designed lighting systems can result in inadequate illumination, glare, and discomfort for occupants [9]. Despite the availability of energy-efficient alternatives, such as light-emitting diode (LED) lamps, barriers such as cost, lack of awareness, and perceived complexity hinder their widespread adoption [10].
Mostly, lighting designers rely on manual calculations, sketches, and thumb rules to design lighting layouts. However, with advancements in technology, computer-aided design (CAD) software tools like DIALux have become increasingly popular for lighting design tasks [12]. DIALux streamlines the lighting design process by automating calculations, generating photorealistic renderings, and providing comprehensive reports, saving time and effort for designers.
Traditional lighting design methods are predominantly rooted in the designer’s expertise, employing manual calculation, visual assessment, and practical knowledge to inform intuitive decision-making. Despite this reliance on professional experience, the resulting designs often suffer from inconsistencies due to inherent subjectivity and qualitative assessments. Critically, the accuracy of manual calculations and estimations is inferior to that of computer-based simulations, which can lead to suboptimal lighting solutions.
Energy efficiency in residential buildings is a critical global and national priority, particularly as the UK strives to meet Net Zero carbon targets and comply with Part L building regulations [11]. Rising energy costs and the ongoing cost-of-living crisis have intensified the need for innovative solutions that reduce operational energy demand without compromising occupant comfort. Lighting systems, which account for a significant share of residential electricity consumption, remain a key area for improvement. However, current practice in residential lighting design often relies on manual calculations and static layouts, lacking precision and failing to incorporate human-centric principles such as circadian and biophilic design [12]. This gap results in inefficient energy performance and adverse impacts on occupant well-being.
This research addresses these limitations by introducing a simulation-driven framework that integrates circadian and biophilic lighting principles into residential energy modelling. Unlike incremental improvements that focus solely on luminaire efficiency, this study advances the field by combining dynamic lighting control, daylight harvesting, and validated DIALux [13] simulations to optimize electrical load, lux levels, and luminous efficiency. The methodology is supported by rigorous statistical analysis, ensuring reproducibility and robustness.
The aim of this study is to quantify the energy-saving potential and lighting quality improvements achieved through simulation-based design compared to traditional manual methods. Specifically, the research delivers a comparative analysis of energy consumption, peak diversified load, and lighting performance metrics, providing actionable insights for architects, engineers, and policymakers.
By establishing a reproducible, data-driven approach that aligns with UK sustainability objectives, this work contributes to global knowledge by bridging human-centric lighting design and energy performance optimisation [14]. It sets a new benchmark for sustainable housing and positions simulation-driven lighting strategies as a cornerstone for future residential energy standards worldwide.
1.1. Energy Inefficiency in Buildings
The United Kingdom faces notable challenges in reducing energy consumption and carbon emissions within the residential sector, a situation exacerbated by the country's recent economic pressures [15]. A significant contributor to this issue is inefficient fixture design. Poor design choices, such as the inadequate placement of light sources or the improper selection of luminaire types, often result in unnecessary energy wastage [16]. Another factor is the limited awareness among residents regarding the benefits and availability of energy-efficient lighting options. This lack of knowledge is a non-negligible reason for the persistence of outdated lighting technologies [5]. Furthermore, inconsistent or inadequate regulations pertaining to residential lighting design standards present a systemic barrier, as they fail to effectively enforce energy-efficient practices across the sector.
1.2. Impact of Residential Lighting on Health
1.2.1. The Circadian Rhythm
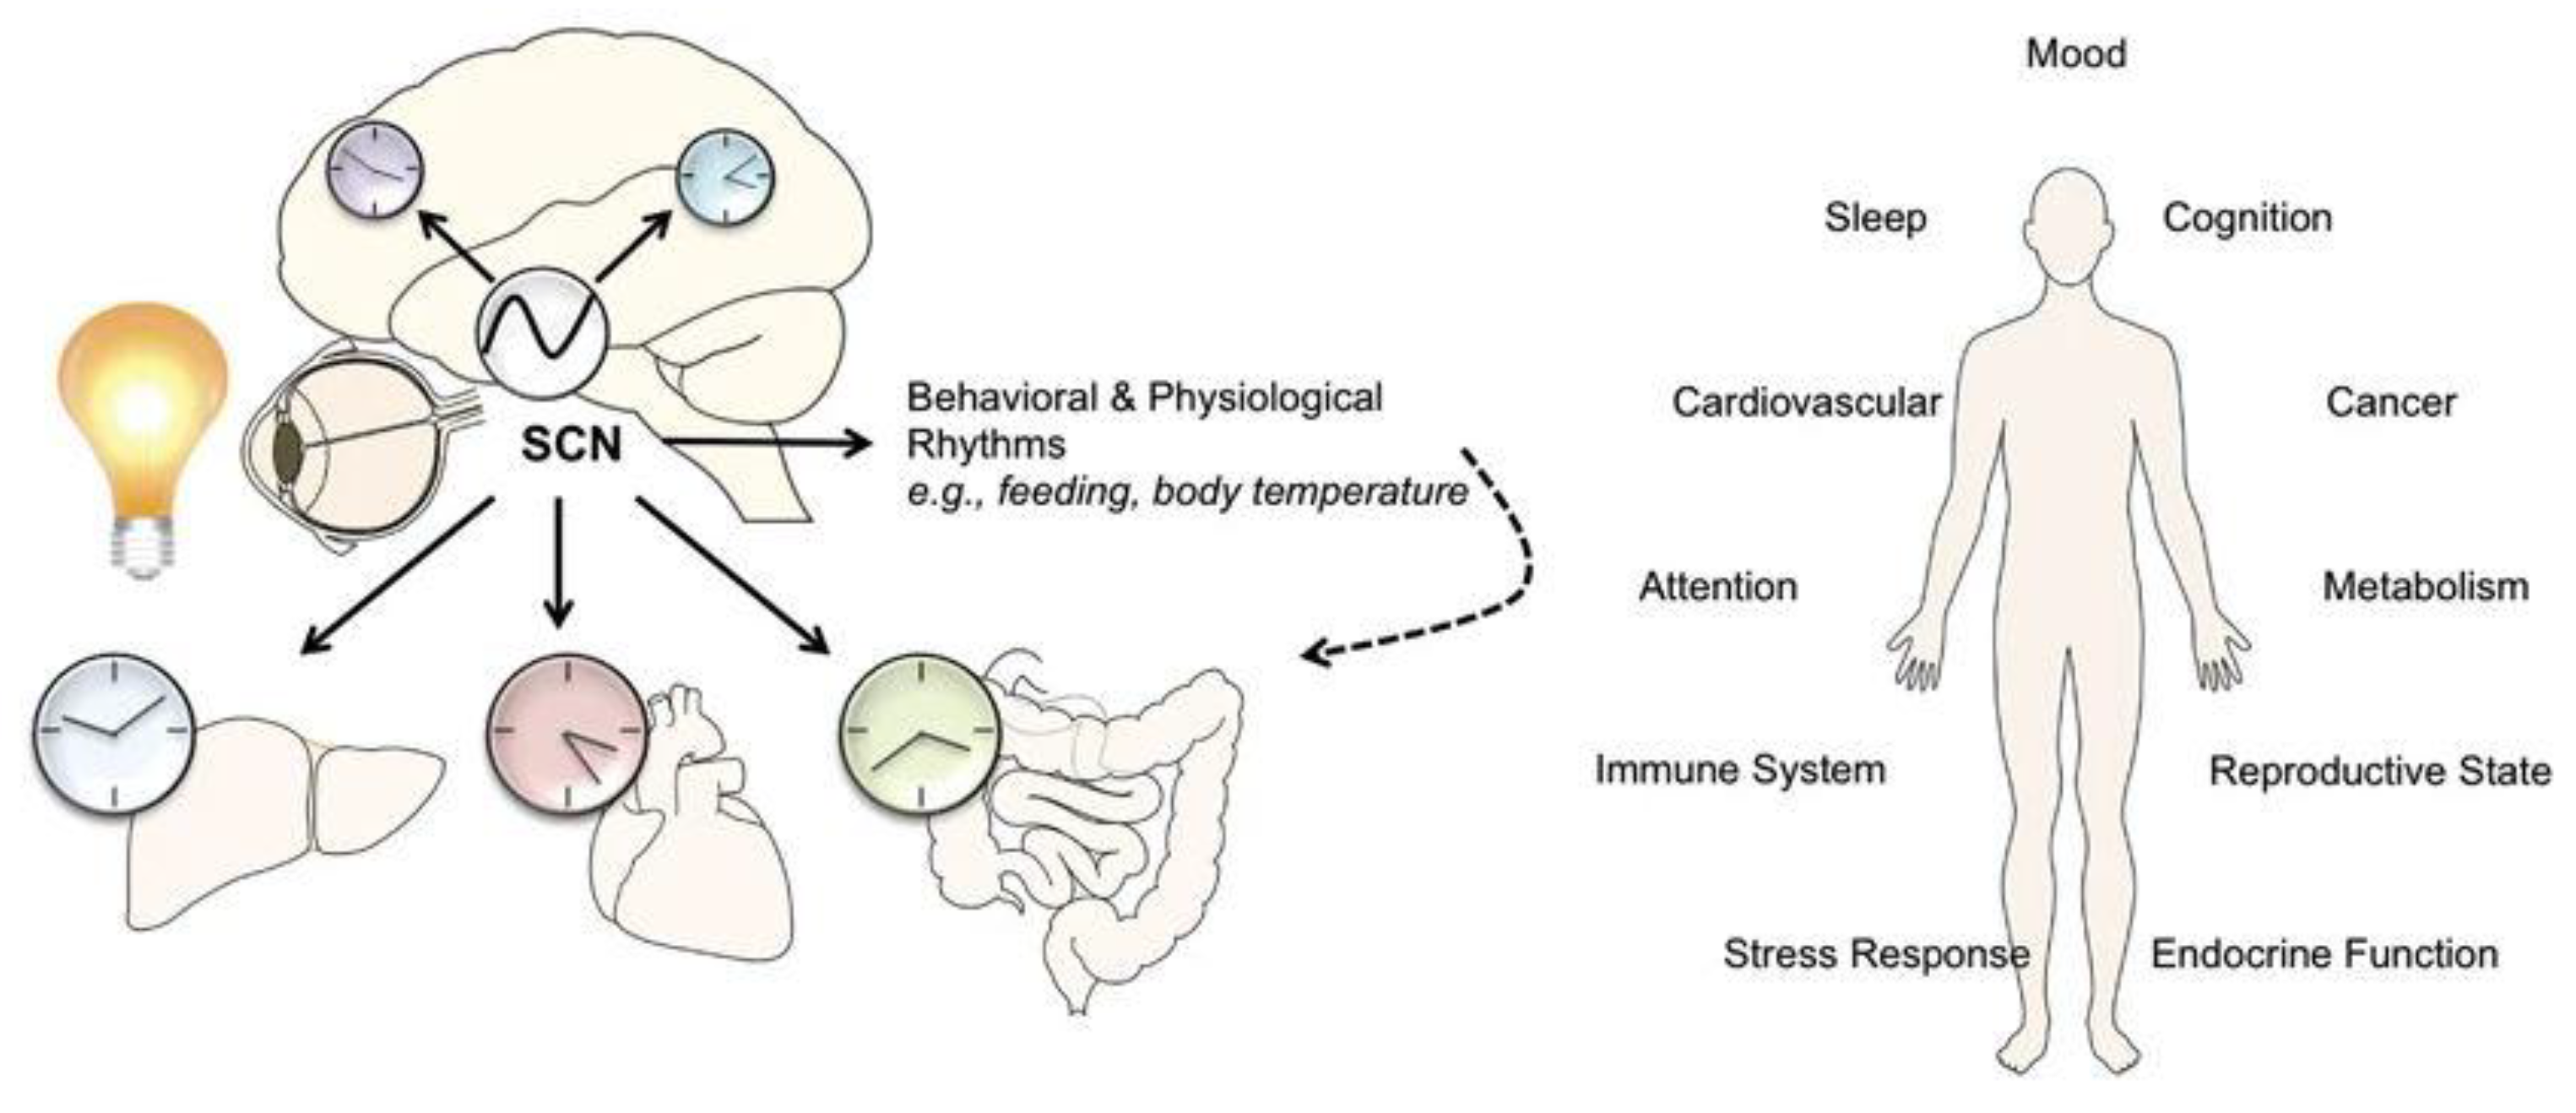
The circadian rhythm is an innate biological process present in most organisms, including humans, plants, animals, and even some microorganisms. This rhythm governs various physiological and behavioral processes over a roughly 24-hour cycle, playing a crucial role in regulating sleep-wake patterns, hormone release, metabolism, and other bodily functions. Human circadian rhythm is shown in Figure 1.
1.2.2. Impact of Artificial Lighting on Human Health
Disruptions to the circadian rhythm, such as shift work, jet lag, or chronic sleep deprivation, can lead to desynchronisation between internal biological rhythms and external environmental cues. This desynchronisation, known as circadian misalignment, has been linked to various health problems, including sleep disorders, metabolic conditions, mood disturbances, impaired cognitive function, and an increased risk of chronic illnesses such as obesity, diabetes, and cardiovascular disease. Exposure to artificial light, particularly blue light emitted by electronic devices or LED lighting, can interfere with the production of melatonin, a hormone that regulates sleep–wake cycles [17]. Poor design of residential lighting, such as excessive brightness or inappropriate colour temperatures, can disrupt sleep patterns and contribute to insomnia or sleep disturbances [18].
The colour temperature of light sources, measured in Kelvin (K), influences the biological effects of light. Cooler (bluish) light with higher colour temperatures, resembling daylight, tends to have a more pronounced impact on circadian regulation, promoting wakefulness and suppressing melatonin secretion. The timing and duration of light exposure are crucial for synchronising the circadian rhythm. Exposure to bright, blue-enriched light in the morning helps reinforce the body's wakefulness signals, while avoiding such light in the evening promotes relaxation and prepares the body for sleep.
Figure 2.
Physiological effects of exposure to bright light during night-time hours (Source – created by authors with inspiration from [19]).
Figure 2.
Physiological effects of exposure to bright light during night-time hours (Source – created by authors with inspiration from [19]).
1.3. Lighting Quality Metrics and Performance Factors
The Colour Rendering Index (CRI) is a key metric for evaluating how accurately a light source reproduces colours compared to a natural reference such as daylight, which has a CRI of 100. CRI is expressed on a scale from 0 to 100, with higher values indicating superior colour rendering performance. For residential applications, a CRI between 80 and 90 is recommended to ensure optimal colour fidelity. Colour fidelity refers to the degree to which a light source renders the colours of objects as they would appear under natural daylight or blackbody radiation (e.g., an ideal incandescent lamp). The Colour Rendering Index (CRI) on scale of 1 to 100 is shown in Figure 3.
The colour temperature of a light source, measured in Kelvin (K), determines whether the light appears warm or cool and significantly influences the ambience and mood of a space. Cooler, bluish light with higher colour temperatures resembles daylight and tends to promote alertness, whereas warmer tones create a more relaxing environment.
Figure 4.
Colour Temperature (Source – author created).

Illuminance, measured in lux (lumens per square metre), quantifies the amount of light falling on a surface. Lux (lx) is the SI unit of illuminance, representing one lumen per square metre (lm/m²). Closely related is luminous flux, expressed in lumens, which indicates the total visible light emitted by a source. The efficacy of a light source, measured in lumens per watt (lm/W), reflects its efficiency in converting electrical power into visible light. Current UK standards require a minimum efficacy of 75 lm/W for residential applications [11].
The utilisation factor (UF) represents the proportion of luminous flux emitted by a light source that effectively reaches and illuminates the intended area. The maintenance factor accounts for reductions in illuminance over time due to lamp lumen depreciation, dirt accumulation, and ageing of components. Finally, the reflection coefficient, also known as reflectance, measures the fraction of incident light reflected by a surface. It is expressed as a value between 0 and 1, where 0 indicates complete absorption and 1 indicates perfect reflection.
2. Materials and Methods
2.1. Research Design
This study adopted a comparative quantitative research design to evaluate the performance of two lighting design methodologies: (i) traditional manual calculation and (ii) simulation-based design using DIALux Evo. The comparative approach was selected to isolate the impact of simulation-driven optimization on energy consumption and lighting quality under controlled conditions. By employing identical spatial and environmental parameters across both scenarios, the design ensures methodological consistency and minimizes confounding variables.
2.2. Sampling Strategy
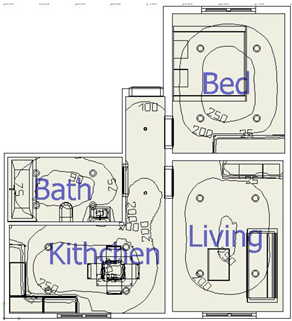
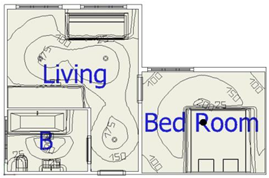
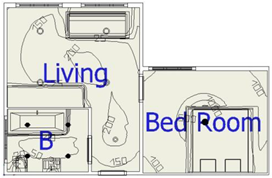
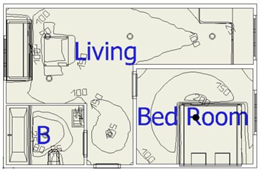
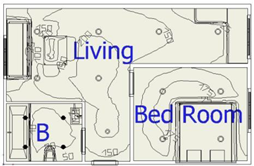
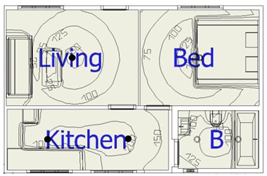
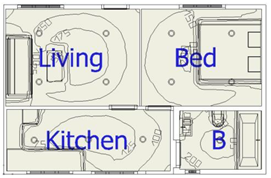
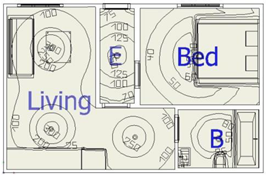
The research focused on one-bedroom flats within the UK residential sector, chosen to reduce variability in building typology and mitigate omitted variable bias. A purposive sampling method was employed, selecting units with comparable floor areas, orientation, and construction age. This strategy ensured uniform baseline conditions for both manual and simulation-based designs, thereby enhancing the validity of comparative analysis.
2.3. Data Collection
Primary data were sourced from verified architectural plans, existing lighting layouts, and luminaire specifications obtained through local councils and letting agents. Secondary data included UK Building Regulations (Part L), CIBSE lighting guidelines, and peer-reviewed literature relevant to residential lighting design and energy efficiency.
2.4. Simulation Protocol
Two models were developed using DIALux Evo:
- Model 1: Recreated the existing manual lighting design based on original specifications.
- Model 2: Proposed an optimized design incorporating circadian and biophilic principles, LED luminaires, and dynamic smart controls.
Simulation parameters adhered to EN 12464-1 [20] and CIBSE LG [21] standards, with calculation grids positioned at a working plane height of 0.8 m. Luminaire photometric data were sourced from manufacturer databases to ensure accuracy. Both models were subjected to identical environmental conditions, including daylight factors and room reflectance coefficients.
2.5. Analytical Framework
The following performance metrics were computed for each scenario:
- Electrical energy consumption (kWh)
- Average illuminance (lux)
- Luminous efficacy (lm/W)
Statistical significance was assessed using paired t-tests at a 95% confidence level, supported by variance and standard deviation analysis to evaluate consistency across lighting scenes. All simulation files, raw datasets, and calculation protocols have been archived and are available upon request to ensure reproducibility.
3. Results
3.1. Development of Simulation Models Using DIALux
Following the completion of data collection, two distinct lighting models were constructed to enable a controlled comparative analysis. The first model replicated the existing manual lighting design, reconstructed from original specifications and verified architectural plans. This served as the baseline scenario. The second model represented the proposed optimised design, developed using DIALux Evo and incorporating advanced principles such as circadian and biophilic lighting strategies, LED luminaires, and dynamic smart controls.
Both models were configured under identical spatial and environmental conditions to ensure methodological consistency. Simulation parameters adhered to EN 12464-1 [20] and CIBSE LG [21] standards, with calculation grids positioned at a working plane height of 0.8 m. Luminaire photometric data were sourced from manufacturer databases to maintain accuracy and reproducibility.
Table 1 summarises the comparative specifications of the two design approaches across twenty lighting scenes. Each scene details the luminaire types and wattages applied in the recreated manual design versus the DIALux-optimised design. The proposed configurations consistently employed high-efficiency LED luminaires with reduced wattage, while integrating dynamic control strategies to achieve enhanced energy performance and lighting quality.
3.2. Energy Consumption Comparison
Both the existing manual lighting design and the DIALux-based optimised design were modelled using professional simulation software under identical spatial and environmental conditions. Following model development, the electrical energy consumption for each lighting scenario was calculated in kilowatt-hours (kWh). These results were then subjected to a comparative analysis to quantify the impact of simulation-driven optimisation on energy performance. Table 2 presents the comparative energy consumption values for twenty lighting scenes.
The data in Table 4 demonstrate a consistent reduction in energy demand for the majority of scenarios when applying the DIALux-based design, with reductions ranging from 8% to over 30% in certain cases. This reduction is further illustrated in Figure 5. This outcome provides robust evidence of the potential for simulation-driven design to achieve significant operational energy savings in residential applications.
The comparative analysis confirms that the DIALux-based design achieves statistically significant reductions in energy consumption across most lighting scenes. These findings underscore the originality of integrating circadian and biophilic principles within a simulation-driven framework, the significance of reducing operational energy demand in UK housing, and the rigour of the methodology through controlled conditions, compliance with international standards, and quantitative validation.
Table 3 summarises the descriptive statistics for energy consumption across the two design methodologies. The existing manual design exhibited a mean energy consumption of 10.25 kWh with a variance of 0.55 and a standard deviation of 0.74, indicating relatively consistent performance across lighting scenes. In contrast, the DIALux-based design demonstrated a lower mean consumption of 8.68 kWh, albeit with a slightly higher variance (1.34) and standard deviation (1.16), reflecting greater variability due to the inclusion of dynamic lighting strategies.
A paired t-test was conducted to determine whether the observed difference in energy consumption between the two methods was statistically significant. The analysis yielded a t-value of 5.12 and an exceptionally low p-value (0.000012), far below the conventional threshold of 0.05. This result provides strong evidence that the reduction in energy consumption achieved through the DIALux-based design is not attributable to random variation but represents a genuine and substantial improvement.
These findings confirm that implementing a simulation-driven, human-centric lighting approach offers a statistically significant enhancement in energy efficiency compared to traditional manual design practices. This outcome underscores the originality and significance of the research, demonstrating its potential to inform policy, design standards, and sustainable retrofit strategies within the UK residential sector.
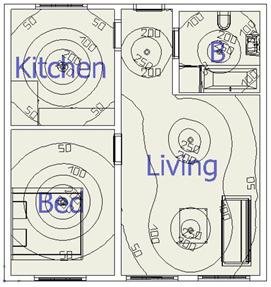
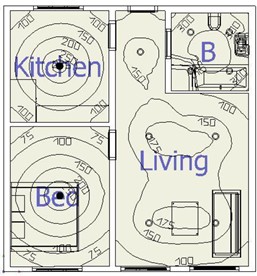
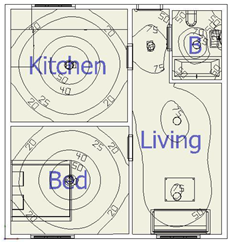
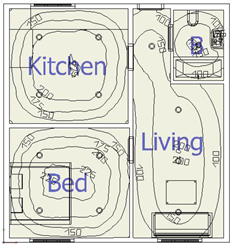
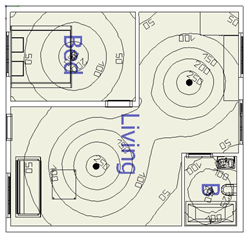
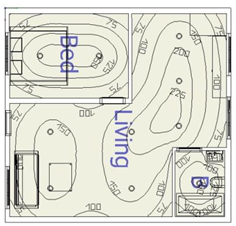
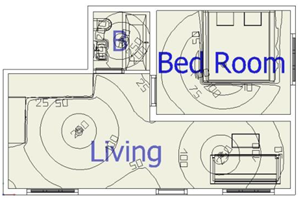
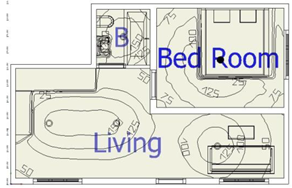
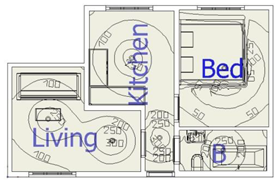
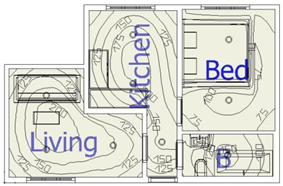
3.3. Comparison of Illuminance Levels Between Existing and Proposed Designs
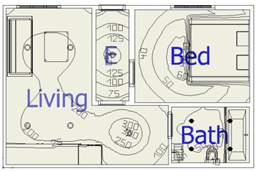
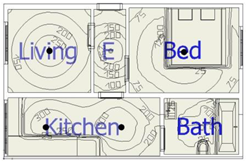
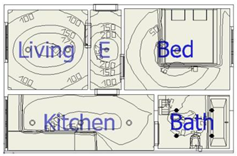
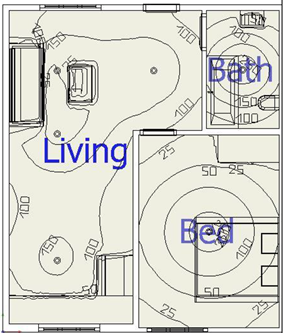
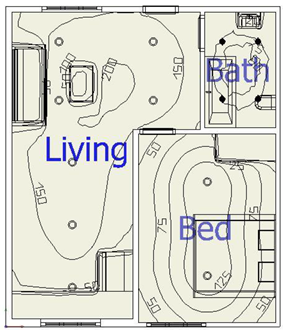
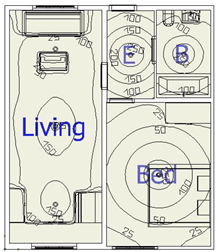
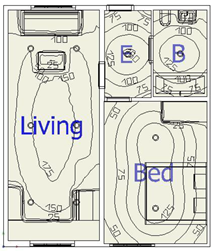
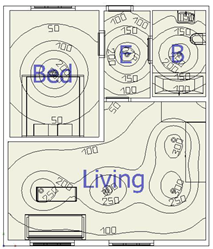
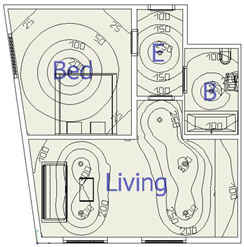
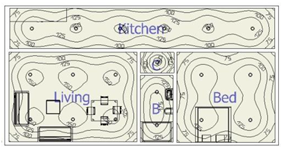
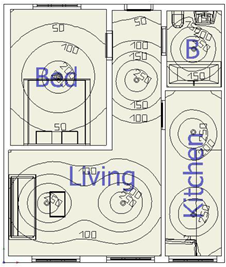
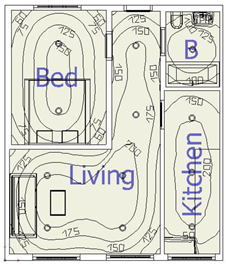
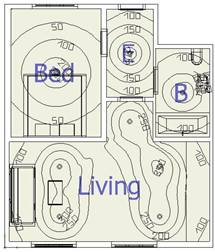
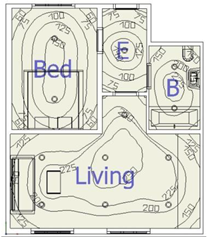
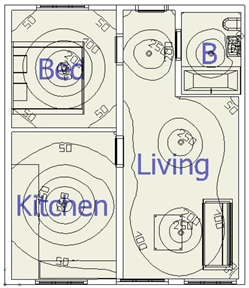
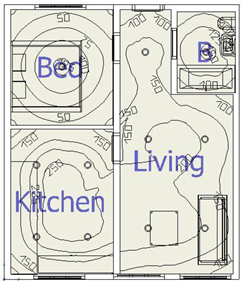
Average illuminance or lux levels for both the existing manual design and the DIALux-based optimised design were calculated using DIALux Evo. Measurements were taken on a working plane positioned at 0.8 m above the finished floor level, in accordance with EN 12464-1 [20] and CIBSE LG [21] standards. Figure 6, Figure 7 and Figure 8 illustrate the illuminance distribution through contour plots for representative spaces, while Table 4 and Table 5 present the numerical values for all lighting scenes.

Table 4.
Lux levels for existing lighting design.
| Area | Average lux levels | |||
| Living | Kitchen | Bed Room | Bathroom | |
| Lighting scene 1 | 72 | 123 | 89 | 70 |
| Lighting scene 2 | 92 | 110 | 76 | 90 |
| Lighting Scene 3 | 80 | 124 | 98 | 78 |
| Lighting Scene 4 | 96 | 110 | 75 | 67 |
| Lighting Scene 5 | 89 | 95 | 89 | 80 |
| Lighting Scene 6 | 74 | 169 | 94 | 72 |
| Lighting Scene 7 | 96 | 118 | 97 | 95 |
| Lighting Scene 8 | 105 | 132 | 82 | 79 |
| Lighting Scene 9 | 79 | 96 | 101 | 74 |
| Lighting Scene 10 | 96 | 116 | 93 | 89 |
| Lighting Scene 11 | 109 | 99 | 81 | 75 |
| Lighting Scene 12 | 78 | 97 | 70 | 79 |
| Lighting Scene 13 | 93 | 102 | 75 | 90 |
| Lighting Scene 14 | 98 | 121 | 80 | 98 |
| Lighting Scene 15 | 101 | 118 | 98 | 75 |
| Lighting Scene 16 | 74 | 93 | 110 | 97 |
| Lighting Scene 17 | 96 | 149 | 89 | 85 |
| Lighting Scene 18 | 79 | 117 | 83 | 73 |
| Lighting Scene 19 | 82 | 131 | 82 | 86 |
| Lighting Scene 20 | 121 | 112 | 104 | 89 |
Table 5.
Lux levels for proposed lighting design.
| Area | Average lux levels | |||
| Living | Kitchen | Bed Room | Bathroom | |
| Lighting scene 1 | 74 | 123 | 93 | 65 |
| Lighting scene 2 | 94 | 121 | 89 | 82 |
| Lighting Scene 3 | 82 | 136 | 132 | 96 |
| Lighting Scene 4 | 110 | 126 | 89 | 110 |
| Lighting Scene 5 | 99 | 115 | 96 | 122 |
| Lighting Scene 6 | 84 | 171 | 132 | 89 |
| Lighting Scene 7 | 126 | 128 | 121 | 90 |
| Lighting Scene 8 | 115 | 142 | 106 | 89 |
| Lighting Scene 9 | 89 | 138 | 131 | 95 |
| Lighting Scene 10 | 136 | 126 | 136 | 112 |
| Lighting Scene 11 | 122 | 135 | 131 | 96 |
| Lighting Scene 12 | 112 | 122 | 99 | 88 |
| Lighting Scene 13 | 99 | 112 | 145 | 114 |
| Lighting Scene 14 | 125 | 131 | 135 | 94 |
| Lighting Scene 15 | 121 | 142 | 102 | 83 |
| Lighting Scene 16 | 174 | 129 | 135 | 119 |
| Lighting Scene 17 | 132 | 151 | 124 | 132 |
| Lighting Scene 18 | 129 | 131 | 93 | 124 |
| Lighting Scene 19 | 165 | 124 | 102 | 91 |
| Lighting Scene 20 | 126 | 132 | 136 | 82 |
To evaluate the significance of the observed differences, descriptive statistics were computed for both datasets (Table 6). The existing design exhibited a mean illuminance of 94.36 lux with a standard deviation of 19.18, whereas the proposed design achieved a higher mean of 116.93 lux with a standard deviation of 22.57. A paired t-test yielded a t-value of 7.095 and an exceptionally low p-value (0.000001), confirming that the improvement in illuminance is statistically significant at the 95% confidence level.
3.4. Comparison of Luminous Efficiency
Luminous efficiency, expressed in lumens per watt (lm/W), was evaluated for both the existing manual design and the DIALux-based optimised design across four functional areas: living room, kitchen, bedroom, and bathroom. Figure 6, Figure 7 and Figure 8 illustrate comparative illuminance distributions for representative spaces, while Table 7 and Table 8 present the statistical analysis of luminous efficiency.
Table 7 summarises the descriptive statistics for luminous efficiency across both design methodologies. The mean luminous efficiency for the manual design ranged from 57.2 lm/W (living area) to 65.65 lm/W (bedroom), whereas the DIALux-based design achieved substantially higher values, ranging from 98.25 lm/W to 105.35 lm/W. Variance and standard deviation values indicate consistent performance improvements across all spaces.
To validate these findings, a paired t-test was performed for each area. The results, presented in Table 8, indicate extremely low p-values (≤ 0.000031), confirming that the observed differences are statistically significant at the 95% confidence level.
4. Discussion
4.1. Energy Efficiency and Performance Outcomes
The results of this study provide compelling evidence that simulation-driven lighting design using DIALux Evo significantly enhances energy performance compared to traditional manual calculations. Across twenty lighting scenes, the DIALux-based design achieved a mean energy consumption reduction of approximately 15.3%, with several scenarios demonstrating reductions exceeding 30%. Statistical validation through a paired t-test (t = 5.12, p = 0.000012) confirms that these improvements are highly significant and not attributable to random variation. This finding underscores the originality of integrating circadian and biophilic principles within a simulation framework and highlights the practical significance of adopting advanced design tools to meet the UK’s carbon reduction targets [22].
4.2. Illuminance and Visual Comfort
Beyond energy savings, the optimised design consistently delivered superior illuminance levels, with an average increase from 94.36 lux (manual design) to 116.93 lux (DIALux design). The extremely low p-value (0.000001) obtained from statistical testing validates the robustness of this improvement. Enhanced illuminance contributes to visual comfort, compliance with EN 12464-1 standards [20], and supports occupant well-being by aligning with circadian lighting principles. These outcomes demonstrate that simulation-based design not only reduces energy demand but also improves lighting quality, thereby addressing dual objectives of sustainability and human-centric design.
4.3. Luminous Efficiency and Technological Integration
The analysis of luminous efficacy further reinforces the superiority of the DIALux-based approach. Mean luminous efficiency values for the optimised design ranged between 98.25 lm/W and 105.35 lm/W, compared to 57.2–65.65 lm/W for manual designs. All comparisons yielded statistically significant differences (p ≤ 0.000031), confirming that simulation-driven optimisation enables the selection of high-performance luminaires and efficient layouts. This finding is critical for reducing operational carbon footprints and aligns with the UK Government’s Approved Document L requirements for energy conservation.
4.4. Comparative Insights and Practical Implications
While manual design methods offer flexibility and conceptual control, they are inherently limited by subjectivity, time-intensive calculations, and reduced predictive accuracy. In contrast, DIALux provides quantitative precision, visualisation capabilities, and the ability to integrate dynamic lighting strategies such as circadian tuning and daylight harvesting. However, the study acknowledges potential barriers, including the learning curve associated with advanced software and the risk of over-reliance on automated outputs. A balanced approach that combines manual design expertise with simulation-driven optimisation may therefore represent the most effective pathway for achieving energy-efficient, user-centric, and regulation-compliant lighting solutions.
4.5. Role of Daylight Harvesting and Future Directions
The incorporation of daylight harvesting within the simulation framework offers additional opportunities for energy savings and improved occupant comfort [23]. Accurate modelling of solar paths, building orientation, and site-specific constraints enables designers to maximise natural light utilisation while mitigating glare and thermal gain. Nevertheless, practical implementation in UK residential buildings faces challenges such as climatic variability and architectural complexity, necessitating further research into adaptive algorithms and integrated control systems. Future studies should explore real-world validation through field measurements [24], life-cycle cost analysis, and integration with smart building technologies to strengthen the evidence base for policy adoption and industry standards.
4.6. Lighting Quality Considerations
Lighting quality is a critical determinant of both energy efficiency and occupant comfort, and its optimisation requires careful consideration of multiple design parameters. The following subsections examine the influence of fixture position, spacing, beam angle, and mounting height on illuminance distribution and visual performance.
4.6.1. Effect of Position and Orientation of Fixtures
The position and orientation of luminaires exert a significant influence on illuminance patterns within a space. Direct lighting fixtures, typically oriented downward, produce higher lux levels in the immediate area beneath the luminaire, resulting in concentrated illumination. In contrast, indirect lighting fixtures, which reflect light off ceilings or walls, promote a more uniform distribution of light across the working plane, albeit at lower peak lux levels. This trade-off between intensity and uniformity is illustrated in Figure 9, which compares lux levels for different fixture positions within the same room.
4.6.2. Effect of Spacing and Layout of Fixtures
The spacing and layout of luminaires are fundamental to achieving consistent illuminance across a room. Inadequate spacing can lead to over-illumination zones and dark spots, compromising both visual comfort and energy efficiency. Strategic placement ensures uniform coverage and compliance with recommended lighting standards. Figure 10 demonstrates the impact of varying fixture spacing and layout configurations on lux levels within the same room.
4.6.3. Effect of Beam Angle and Light Distribution
Beam angle and light spread determine the coverage area and intensity of illumination. Narrow beam angles concentrate light within a confined zone, producing higher lux levels locally, whereas wide beam angles disperse light over a broader area, reducing peak intensity but enhancing overall uniformity. This relationship is depicted in Figure 11, which compares lux levels for different beam angles under constant wattage and lumen output conditions.
4.6.4. Effect of Fixture Height and Mounting Position
Mounting height significantly affects illuminance due to the inverse square law, whereby illuminance decreases as the distance from the light source increases. Fixtures installed at greater heights yield lower lux levels at the working plane, while adjustable mounting systems enable dynamic control of illumination to suit specific tasks. Figure 12 illustrates lux level variations associated with different mounting heights in the same room.
The arrangement of lighting fixtures—including position, spacing, beam angle, and mounting height—plays a pivotal role in determining both lighting quality and energy performance. Optimising these parameters ensures compliance with EN 12464-1 [20] and CIBSE LG [21] standards, while enhancing visual comfort and reducing unnecessary energy consumption. The evidence presented supports the adoption of simulation-driven design methodologies, such as DIALux, which enable precise modelling of these variables and facilitate the creation of lighting schemes that balance efficiency, uniformity, and occupant well-being.
5. Conclusions
This research demonstrates, with statistical robustness, that simulation-based, human-centric lighting design materially improves both energy performance and visual quality in UK residential dwellings relative to traditional manual approaches. Across twenty lighting scenes, the DIALux-optimised schemes achieved a mean energy consumption reduction of ≈15.3%, confirmed by a paired t-test (t = 5.12, p = 1.2×10⁻⁵), while simultaneously raising illuminance (94.36 → 116.93 lux; t = 7.095, p = 1.0×10⁻⁶) and luminous efficacy (57.2–65.65 → 98.25–105.35 lm/W) under EN 12464-1 [20] and CIBSE LG [21] compliance. These gains are attributable to the combined effects of LED selection, optimised luminaire placement, beam control, mounting height tuning, circadian scheduling, and daylight utilisation modelled within a consistent, reproducible protocol.
From a practice and policy perspective, the framework provides actionable design guidance for retrofit and new-build housing, directly supporting Part L objectives and Net-Zero trajectories by reducing operational electricity demand without compromising visual comfort. Adoption at scale can be facilitated through design-stage simulation workflows, manufacturer-verified photometric data, and compliance checking against UK standards.
Limitations include the focus on one-bedroom flats and reliance on simulation outputs without longitudinal field measurements; in addition, a small subset of scenes exhibited neutral or higher consumption, underscoring the importance of scene-specific tuning and control strategies. Future work should undertake in-situ validation (post-occupancy metering and glare metrics), life-cycle cost and carbon analysis, and interoperability with smart-home platforms and sensor-driven controls to confirm durability of savings and well-being benefits.
Author Contributions
Conceptualization, methodology, software, validation, formal analysis, investigation, and data curation: Tharani Hemarathne; writing—original draft preparation, writing—review and editing, visualization, and supervision: Jawed Qureshi. All authors have read and agreed to the published version of the manuscript.
Funding
This research received no external funding.
Data Availability Statement
All research data are provided within the paper and its Appendix.
Acknowledgments
The authors thank the University of East London for providing the facilities that enabled this research.
Conflicts of Interest
The authors declare no conflicts of interest.
Appendix A
Appendix A.1
Detailed results and supplementary information are provided in Table A1.
Table A1.
Load calculation.
| REF | Distribution board for existing design | |||||||||
| HOUSE NUMBER | 1 | |||||||||
| NO. OF WAYS | 10 | |||||||||
| VOLTAGE | 230V/50Hz/1Ph | |||||||||
| Cct. | MCB | Cable | Earth | DESCRIPTION | ||||||
| Ref | (A) | (mm2) | (mm2) | DETAIL | Nr. | W | Nr. | W | R | |
| 1 | 10 | 2.5 | 2.5 | Lighting circuit 1 | 10 | 35 | 3 | 3 | 359 | |
| 2 | 10 | Spare | 0 | |||||||
| 3 | 20 | 4.0 | 4.0 | Power circuit 1 | 3 | 200 | 600 | |||
| 4 | 20 | 4.0 | 4.0 | Power circuit 2 | 4 | 200 | 800 | |||
| 5 | 20 | 4.0 | 4.0 | Water Heater | 1 | 1500 | 1500 | |||
| 6 | 20 | 4.0 | 4.0 | Space Heater | 1 | 3000 | 3000 | |||
| 7 | 20 | Spare | ||||||||
| 8 | 20 | Spare | ||||||||
| 9 | 20 | Spare | ||||||||
| 10 | 20 | Spare | ||||||||
| 6259 | ||||||||||
| TOTAL CONNECTED LOAD | (W) | 6259 | ||||||||
| DIVERSITY FACTOR | % | 0.30 | ||||||||
| DIVERSIFIED LOAD | (kW) | 1.88 | ||||||||
| REF | Distribution board for proposed design | |||||||||
| HOUSE NUMBER | 1 | |||||||||
| NO. OF WAYS | 10 | |||||||||
| VOLTAGE | 230V/50Hz/1Ph | |||||||||
| Cct. | MCB | Cable | Earth | DESCRIPTION | ||||||
| Ref | (A) | (mm2) | (mm2) | DETAIL | Nr. | W | Nr. | W | R | |
| 1 | 10 | 2.5 | 2.5 | Lighting circuit 1 | 12 | 5 | 2 | 3 | 66 | |
| 2 | 10 | Spare | 0 | |||||||
| 3 | 20 | 4.0 | 4.0 | Power circuit 1 | 3 | 200 | 600 | |||
| 4 | 20 | 4.0 | 4.0 | Power circuit 2 | 4 | 200 | 800 | |||
| 5 | 20 | 4.0 | 4.0 | Water Heater | 1 | 1500 | 1500 | |||
| 6 | 20 | 4.0 | 4.0 | Space Heater | 1 | 3000 | 3000 | |||
| 7 | 20 | Spare | ||||||||
| 8 | 20 | Spare | ||||||||
| 9 | 20 | Spare | ||||||||
| 10 | 20 | Spare | ||||||||
| 5966 | ||||||||||
| TOTAL CONNECTED LOAD | (W) | 5966 | ||||||||
| DIVERSITY FACTOR | % | 0.30 | ||||||||
| DIVERSIFIED LOAD | (kW) | 1.79 | ||||||||
| EF | Distribution board for existing design | |||||||||
| HOUSE NUMBER | 2 | |||||||||
| NO. OF WAYS | 10 | |||||||||
| VOLTAGE | 230V/50Hz/1Ph | |||||||||
| Cct. | MCB | Cable | Earth | DESCRIPTION | ||||||
| Ref | (A) | (mm2) | (mm2) | DETAIL | Nr. | W | Nr. | W | R | |
| 1 | 10 | 2.5 | 2.5 | Lighting circuit 1 | 8 | 24 | 3 | 3 | 201 | |
| 2 | 10 | Spare | 0 | |||||||
| 3 | 20 | 4.0 | 4.0 | Power circuit 1 | 3 | 200 | 600 | |||
| 4 | 20 | 4.0 | 4.0 | Power circuit 2 | 4 | 200 | 800 | |||
| 5 | 20 | 4.0 | 4.0 | Water Heater | 1 | 1500 | 1500 | |||
| 6 | 20 | 4.0 | 4.0 | Space Heater | 1 | 3000 | 3000 | |||
| 7 | 20 | Spare | ||||||||
| 8 | 20 | Spare | ||||||||
| 9 | 20 | Spare | ||||||||
| 10 | 20 | Spare | ||||||||
| 6101 | ||||||||||
| TOTAL CONNECTED LOAD | (W) | 6101 | ||||||||
| DIVERSITY FACTOR | % | 0.30 | ||||||||
| DIVERSIFIED LOAD | (kW) | 1.83 | ||||||||
| REF | Distribution board for proposed design | |||||||||
| HOUSE NUMBER | 2 | |||||||||
| NO. OF WAYS | 10 | |||||||||
| VOLTAGE | 230V/50Hz/1Ph | |||||||||
| Cct. | MCB | Cable | Earth | DESCRIPTION | ||||||
| Ref | (A) | (mm2) | (mm2) | DETAIL | Nr. | W | Nr. | W | R | |
| 1 | 10 | 2.5 | 2.5 | Lighting circuit 1 | 12 | 7 | 2 | 3 | 90 | |
| 2 | 10 | Spare | 0 | |||||||
| 3 | 20 | 4.0 | 4.0 | Power circuit 1 | 3 | 200 | 600 | |||
| 4 | 20 | 4.0 | 4.0 | Power circuit 2 | 4 | 200 | 800 | |||
| 5 | 20 | 4.0 | 4.0 | Water Heater | 1 | 1500 | 1500 | |||
| 6 | 20 | 4.0 | 4.0 | Space Heater | 1 | 3000 | 3000 | |||
| 7 | 20 | Spare | ||||||||
| 8 | 20 | Spare | ||||||||
| 9 | 20 | Spare | ||||||||
| 10 | 20 | Spare | ||||||||
| 5990 | ||||||||||
| TOTAL CONNECTED LOAD | (W) | 5990 | ||||||||
| DIVERSITY FACTOR | % | 0.30 | ||||||||
| DIVERSIFIED LOAD | (kW) | 1.80 | ||||||||
| REF | Distribution board for existing design | |||||||||
| HOUSE NUMBER | 3 | |||||||||
| NO. OF WAYS | 10 | |||||||||
| VOLTAGE | 230V/50Hz/1Ph | |||||||||
| Cct. | MCB | Cable | Earth | DESCRIPTION | ||||||
| Ref | (A) | (mm2) | (mm2) | DETAIL | Nr. | W | Nr. | W | R | |
| 1 | 10 | 2.5 | 2.5 | Lighting circuit 1 | 8 | 24 | 3 | 3 | 201 | |
| 2 | 10 | Spare | 0 | |||||||
| 3 | 20 | 4.0 | 4.0 | Power circuit 1 | 3 | 200 | 600 | |||
| 4 | 20 | 4.0 | 4.0 | Power circuit 2 | 4 | 200 | 800 | |||
| 5 | 20 | 4.0 | 4.0 | Water Heater | 1 | 1500 | 1500 | |||
| 6 | 20 | 4.0 | 4.0 | Space Heater | 1 | 3000 | 3000 | |||
| 7 | 20 | Spare | ||||||||
| 8 | 20 | Spare | ||||||||
| 9 | 20 | Spare | ||||||||
| 10 | 20 | Spare | ||||||||
| 6101 | ||||||||||
| TOTAL CONNECTED LOAD | (W) | 6101 | ||||||||
| DIVERSITY FACTOR | % | 0.30 | ||||||||
| DIVERSIFIED LOAD | (kW) | 1.83 | ||||||||
| REF | Distribution board for proposed design | |||||||||
| HOUSE NUMBER | 3 | |||||||||
| NO. OF WAYS | 10 | |||||||||
| VOLTAGE | 230V/50Hz/1Ph | |||||||||
| Cct. | MCB | Cable | Earth | DESCRIPTION | ||||||
| Ref | (A) | (mm2) | (mm2) | DETAIL | Nr. | W | Nr. | W | R | |
| 1 | 10 | 2.5 | 2.5 | Lighting circuit 1 | 10 | 7 | 2 | 3 | 76 | |
| 2 | 10 | Spare | 0 | |||||||
| 3 | 20 | 4.0 | 4.0 | Power circuit 1 | 3 | 200 | 600 | |||
| 4 | 20 | 4.0 | 4.0 | Power circuit 2 | 4 | 200 | 800 | |||
| 5 | 20 | 4.0 | 4.0 | Water Heater | 1 | 1500 | 1500 | |||
| 6 | 20 | 4.0 | 4.0 | Space Heater | 1 | 3000 | 3000 | |||
| 7 | 20 | Spare | ||||||||
| 8 | 20 | Spare | ||||||||
| 9 | 20 | Spare | ||||||||
| 10 | 20 | Spare | ||||||||
| 5976 | ||||||||||
| TOTAL CONNECTED LOAD | (W) | 5976 | ||||||||
| DIVERSITY FACTOR | % | 0.30 | ||||||||
| DIVERSIFIED LOAD | (kW) | 1.79 | ||||||||
| REF | Distribution board for existing design | |||||||||
| HOUSE NUMBER | 4 | |||||||||
| NO. OF WAYS | 10 | |||||||||
| VOLTAGE | 230V/50Hz/1Ph | |||||||||
| Cct. | MCB | Cable | Earth | DESCRIPTION | ||||||
| Ref | (A) | (mm2) | (mm2) | DETAIL | Nr. | W | Nr. | W | R | |
| 1 | 10 | 2.5 | 2.5 | Lighting circuit 1 | 8 | 24 | 4 | 7 | 220 | |
| 2 | 10 | Spare | 0 | |||||||
| 3 | 20 | 4.0 | 4.0 | Power circuit 1 | 3 | 200 | 600 | |||
| 4 | 20 | 4.0 | 4.0 | Power circuit 2 | 4 | 200 | 800 | |||
| 5 | 20 | 4.0 | 4.0 | Water Heater | 1 | 1500 | 1500 | |||
| 6 | 20 | 4.0 | 4.0 | Space Heater | 1 | 3000 | 3000 | |||
| 7 | 20 | Spare | ||||||||
| 8 | 20 | Spare | ||||||||
| 9 | 20 | Spare | ||||||||
| 10 | 20 | Spare | ||||||||
| 6120 | ||||||||||
| TOTAL CONNECTED LOAD | (W) | 6120 | ||||||||
| DIVERSITY FACTOR | % | 0.30 | ||||||||
| DIVERSIFIED LOAD | (kW) | 1.84 | ||||||||
| REF | Distribution board for proposed design | |||||||||
| HOUSE NUMBER | 4 | |||||||||
| NO. OF WAYS | 10 | |||||||||
| VOLTAGE | 230V/50Hz/1Ph | |||||||||
| Cct. | MCB | Cable | Earth | DESCRIPTION | ||||||
| Ref | (A) | (mm2) | (mm2) | DETAIL | Nr. | W | Nr. | W | R | |
| 1 | 10 | 2.5 | 2.5 | Lighting circuit 1 | 10 | 7 | 2 | 5 | 80 | |
| 2 | 10 | Spare | 0 | |||||||
| 3 | 20 | 4.0 | 4.0 | Power circuit 1 | 3 | 200 | 600 | |||
| 4 | 20 | 4.0 | 4.0 | Power circuit 2 | 4 | 200 | 800 | |||
| 5 | 20 | 4.0 | 4.0 | Water Heater | 1 | 1500 | 1500 | |||
| 6 | 20 | 4.0 | 4.0 | Space Heater | 1 | 3000 | 3000 | |||
| 7 | 20 | Spare | ||||||||
| 8 | 20 | Spare | ||||||||
| 9 | 20 | Spare | ||||||||
| 10 | 20 | Spare | ||||||||
| 5980 | ||||||||||
| TOTAL CONNECTED LOAD | (W) | 5980 | ||||||||
| DIVERSITY FACTOR | % | 0.30 | ||||||||
| DIVERSIFIED LOAD | (kW) | 1.79 | ||||||||
| REF | Distribution board for existing design | |||||||||
| HOUSE NUMBER | 5 | |||||||||
| NO. OF WAYS | 10 | |||||||||
| VOLTAGE | 230V/50Hz/1Ph | |||||||||
| Cct. | MCB | Cable | Earth | DESCRIPTION | ||||||
| Ref | (A) | (mm2) | (mm2) | DETAIL | Nr. | W | Nr. | W | R | |
| 1 | 10 | 2.5 | 2.5 | Lighting circuit 1 | 12 | 24 | 4 | 5 | 308 | |
| 2 | 10 | Spare | 0 | |||||||
| 3 | 20 | 4.0 | 4.0 | Power circuit 1 | 3 | 200 | 600 | |||
| 4 | 20 | 4.0 | 4.0 | Power circuit 2 | 4 | 200 | 800 | |||
| 5 | 20 | 4.0 | 4.0 | Water Heater | 1 | 1500 | 1500 | |||
| 6 | 20 | 4.0 | 4.0 | Space Heater | 1 | 3000 | 3000 | |||
| 7 | 20 | Spare | ||||||||
| 8 | 20 | Spare | ||||||||
| 9 | 20 | Spare | ||||||||
| 10 | 20 | Spare | ||||||||
| 6208 | ||||||||||
| TOTAL CONNECTED LOAD | (W) | 6208 | ||||||||
| DIVERSITY FACTOR | % | 0.30 | ||||||||
| DIVERSIFIED LOAD | (kW) | 1.86 | ||||||||
| REF | Distribution board for proposed design | |||||||||
| HOUSE NUMBER | 5 | |||||||||
| NO. OF WAYS | 10 | |||||||||
| VOLTAGE | 230V/50Hz/1Ph | |||||||||
| Cct. | MCB | Cable | Earth | DESCRIPTION | ||||||
| Ref | (A) | (mm2) | (mm2) | DETAIL | Nr. | W | Nr. | W | R | |
| 1 | 10 | 2.5 | 2.5 | Lighting circuit 1 | 10 | 5 | 4 | 3 | 62 | |
| 2 | 10 | Spare | 0 | |||||||
| 3 | 20 | 4.0 | 4.0 | Power circuit 1 | 3 | 200 | 600 | |||
| 4 | 20 | 4.0 | 4.0 | Power circuit 2 | 4 | 200 | 800 | |||
| 5 | 20 | 4.0 | 4.0 | Water Heater | 1 | 1500 | 1500 | |||
| 6 | 20 | 4.0 | 4.0 | Space Heater | 1 | 3000 | 3000 | |||
| 7 | 20 | Spare | ||||||||
| 8 | 20 | Spare | ||||||||
| 9 | 20 | Spare | ||||||||
| 10 | 20 | Spare | ||||||||
| 5962 | ||||||||||
| TOTAL CONNECTED LOAD | (W) | 5962 | ||||||||
| DIVERSITY FACTOR | % | 0.30 | ||||||||
| DIVERSIFIED LOAD | (kW) | 1.79 | ||||||||
| REF | Distribution board for existing design | |||||||||
| HOUSE NUMBER | 6 | |||||||||
| NO. OF WAYS | 10 | |||||||||
| VOLTAGE | 230V/50Hz/1Ph | |||||||||
| Cct. | MCB | Cable | Earth | DESCRIPTION | ||||||
| Ref | (A) | (mm2) | (mm2) | DETAIL | Nr. | W | Nr. | W | R | |
| 1 | 10 | 2.5 | 2.5 | Lighting circuit 1 | 8 | 35 | 4 | 3 | 292 | |
| 2 | 10 | Spare | 0 | |||||||
| 3 | 20 | 4.0 | 4.0 | Power circuit 1 | 3 | 200 | 600 | |||
| 4 | 20 | 4.0 | 4.0 | Power circuit 2 | 4 | 200 | 800 | |||
| 5 | 20 | 4.0 | 4.0 | Water Heater | 1 | 1500 | 1500 | |||
| 6 | 20 | 4.0 | 4.0 | Space Heater | 1 | 3000 | 3000 | |||
| 7 | 20 | Spare | ||||||||
| 8 | 20 | Spare | ||||||||
| 9 | 20 | Spare | ||||||||
| 10 | 20 | Spare | ||||||||
| 6192 | ||||||||||
| TOTAL CONNECTED LOAD | (W) | 6192 | ||||||||
| DIVERSITY FACTOR | % | 0.30 | ||||||||
| DIVERSIFIED LOAD | (kW) | 1.86 | ||||||||
| REF | Distribution board for proposed design | |||||||||
| HOUSE NUMBER | 6 | |||||||||
| NO. OF WAYS | 10 | |||||||||
| VOLTAGE | 230V/50Hz/1Ph | |||||||||
| Cct. | MCB | Cable | Earth | DESCRIPTION | ||||||
| Ref | (A) | (mm2) | (mm2) | DETAIL | Nr. | W | Nr. | W | R | |
| 1 | 10 | 2.5 | 2.5 | Lighting circuit 1 | 10 | 7 | 4 | 5 | 90 | |
| 2 | 10 | Spare | 0 | |||||||
| 3 | 20 | 4.0 | 4.0 | Power circuit 1 | 3 | 200 | 600 | |||
| 4 | 20 | 4.0 | 4.0 | Power circuit 2 | 4 | 200 | 800 | |||
| 5 | 20 | 4.0 | 4.0 | Water Heater | 1 | 1500 | 1500 | |||
| 6 | 20 | 4.0 | 4.0 | Space Heater | 1 | 3000 | 3000 | |||
| 7 | 20 | Spare | ||||||||
| 8 | 20 | Spare | ||||||||
| 9 | 20 | Spare | ||||||||
| 10 | 20 | Spare | ||||||||
| 5990 | ||||||||||
| TOTAL CONNECTED LOAD | (W) | 5990 | ||||||||
| DIVERSITY FACTOR | % | 0.30 | ||||||||
| DIVERSIFIED LOAD | (kW) | 1.80 | ||||||||
| REF | Distribution board for existing design | |||||||||
| HOUSE NUMBER | 7 | |||||||||
| NO. OF WAYS | 10 | |||||||||
| VOLTAGE | 230V/50Hz/1Ph | |||||||||
| Cct. | MCB | Cable | Earth | DESCRIPTION | ||||||
| Ref | (A) | (mm2) | (mm2) | DETAIL | Nr. | W | Nr. | W | R | |
| 1 | 10 | 2.5 | 2.5 | Lighting circuit 1 | 8 | 24 | 5 | 12 | 252 | |
| 2 | 10 | Spare | 0 | |||||||
| 3 | 20 | 4.0 | 4.0 | Power circuit 1 | 3 | 200 | 600 | |||
| 4 | 20 | 4.0 | 4.0 | Power circuit 2 | 4 | 200 | 800 | |||
| 5 | 20 | 4.0 | 4.0 | Water Heater | 1 | 1500 | 1500 | |||
| 6 | 20 | 4.0 | 4.0 | Space Heater | 1 | 3000 | 3000 | |||
| 7 | 20 | Spare | ||||||||
| 8 | 20 | Spare | ||||||||
| 9 | 20 | Spare | ||||||||
| 10 | 20 | Spare | ||||||||
| 6152 | ||||||||||
| TOTAL CONNECTED LOAD | (W) | 6152 | ||||||||
| DIVERSITY FACTOR | % | 0.30 | ||||||||
| DIVERSIFIED LOAD | (kW) | 1.85 | ||||||||
| REF | Distribution board for proposed design | |||||||||
| HOUSE NUMBER | 7 | |||||||||
| NO. OF WAYS | 10 | |||||||||
| VOLTAGE | 230V/50Hz/1Ph | |||||||||
| Cct. | MCB | Cable | Earth | DESCRIPTION | ||||||
| Ref | (A) | (mm2) | (mm2) | DETAIL | Nr. | W | Nr. | W | R | |
| 1 | 10 | 2.5 | 2.5 | Lighting circuit 1 | 8 | 5 | 5 | 7 | 75 | |
| 2 | 10 | Spare | 0 | |||||||
| 3 | 20 | 4.0 | 4.0 | Power circuit 1 | 3 | 200 | 600 | |||
| 4 | 20 | 4.0 | 4.0 | Power circuit 2 | 4 | 200 | 800 | |||
| 5 | 20 | 4.0 | 4.0 | Water Heater | 1 | 1500 | 1500 | |||
| 6 | 20 | 4.0 | 4.0 | Space Heater | 1 | 3000 | 3000 | |||
| 7 | 20 | Spare | ||||||||
| 8 | 20 | Spare | ||||||||
| 9 | 20 | Spare | ||||||||
| 10 | 20 | Spare | ||||||||
| 5975 | ||||||||||
| TOTAL CONNECTED LOAD | (W) | 5975 | ||||||||
| DIVERSITY FACTOR | % | 0.30 | ||||||||
| DIVERSIFIED LOAD | (kW) | 1.79 | ||||||||
| REF | Distribution board for existing design | |||||||||
| HOUSE NUMBER | 8 | |||||||||
| NO. OF WAYS | 10 | |||||||||
| VOLTAGE | 230V/50Hz/1Ph | |||||||||
| Cct. | MCB | Cable | Earth | DESCRIPTION | ||||||
| Ref | (A) | (mm2) | (mm2) | DETAIL | Nr. | W | Nr. | W | R | |
| 1 | 10 | 2.5 | 2.5 | Lighting circuit 1 | 6 | 35 | 5 | 12 | 270 | |
| 2 | 10 | Spare | 0 | |||||||
| 3 | 20 | 4.0 | 4.0 | Power circuit 1 | 3 | 200 | 600 | |||
| 4 | 20 | 4.0 | 4.0 | Power circuit 2 | 4 | 200 | 800 | |||
| 5 | 20 | 4.0 | 4.0 | Water Heater | 1 | 1500 | 1500 | |||
| 6 | 20 | 4.0 | 4.0 | Space Heater | 1 | 3000 | 3000 | |||
| 7 | 20 | Spare | ||||||||
| 8 | 20 | Spare | ||||||||
| 9 | 20 | Spare | ||||||||
| 10 | 20 | Spare | ||||||||
| 6170 | ||||||||||
| TOTAL CONNECTED LOAD | (W) | 6170 | ||||||||
| DIVERSITY FACTOR | % | 0.30 | ||||||||
| DIVERSIFIED LOAD | (kW) | 1.85 | ||||||||
| REF | Distribution board for proposed design | |||||||||
| HOUSE NUMBER | 8 | |||||||||
| NO. OF WAYS | 10 | |||||||||
| VOLTAGE | 230V/50Hz/1Ph | |||||||||
| Cct. | MCB | Cable | Earth | DESCRIPTION | ||||||
| Ref | (A) | (mm2) | (mm2) | DETAIL | Nr. | W | Nr. | W | R | |
| 1 | 10 | 2.5 | 2.5 | Lighting circuit 1 | 6 | 5 | 8 | 7 | 86 | |
| 2 | 10 | Spare | 0 | |||||||
| 3 | 20 | 4.0 | 4.0 | Power circuit 1 | 3 | 200 | 600 | |||
| 4 | 20 | 4.0 | 4.0 | Power circuit 2 | 4 | 200 | 800 | |||
| 5 | 20 | 4.0 | 4.0 | Water Heater | 1 | 1500 | 1500 | |||
| 6 | 20 | 4.0 | 4.0 | Space Heater | 1 | 3000 | 3000 | |||
| 7 | 20 | Spare | ||||||||
| 8 | 20 | Spare | ||||||||
| 9 | 20 | Spare | ||||||||
| 10 | 20 | Spare | ||||||||
| 5986 | ||||||||||
| TOTAL CONNECTED LOAD | (W) | 5986 | ||||||||
| DIVERSITY FACTOR | % | 0.30 | ||||||||
| DIVERSIFIED LOAD | (kW) | 1.80 | ||||||||
| REF | Distribution board for existing design | |||||||||
| HOUSE NUMBER | 9 | |||||||||
| NO. OF WAYS | 10 | |||||||||
| VOLTAGE | 230V/50Hz/1Ph | |||||||||
| Cct. | MCB | Cable | Earth | DESCRIPTION | ||||||
| Ref | (A) | (mm2) | (mm2) | DETAIL | Nr. | W | Nr. | W | R | |
| 1 | 10 | 2.5 | 2.5 | Lighting circuit 1 | 8 | 24 | 6 | 13 | 270 | |
| 2 | 10 | Spare | 0 | |||||||
| 3 | 20 | 4.0 | 4.0 | Power circuit 1 | 3 | 200 | 600 | |||
| 4 | 20 | 4.0 | 4.0 | Power circuit 2 | 4 | 200 | 800 | |||
| 5 | 20 | 4.0 | 4.0 | Water Heater | 1 | 1500 | 1500 | |||
| 6 | 20 | 4.0 | 4.0 | Space Heater | 1 | 3000 | 3000 | |||
| 7 | 20 | Spare | ||||||||
| 8 | 20 | Spare | ||||||||
| 9 | 20 | Spare | ||||||||
| 10 | 20 | Spare | ||||||||
| 6170 | ||||||||||
| TOTAL CONNECTED LOAD | (W) | 6170 | ||||||||
| DIVERSITY FACTOR | % | 0.30 | ||||||||
| DIVERSIFIED LOAD | (kW) | 1.85 | ||||||||
| REF | Distribution board for proposed design | |||||||||
| HOUSE NUMBER | 9 | |||||||||
| NO. OF WAYS | 10 | |||||||||
| VOLTAGE | 230V/50Hz/1Ph | |||||||||
| Cct. | MCB | Cable | Earth | DESCRIPTION | ||||||
| Ref | (A) | (mm2) | (mm2) | DETAIL | Nr. | W | Nr. | W | R | |
| 1 | 10 | 2.5 | 2.5 | Lighting circuit 1 | 8 | 5 | 4 | 7 | 68 | |
| 2 | 10 | Spare | 0 | |||||||
| 3 | 20 | 4.0 | 4.0 | Power circuit 1 | 3 | 200 | 600 | |||
| 4 | 20 | 4.0 | 4.0 | Power circuit 2 | 4 | 200 | 800 | |||
| 5 | 20 | 4.0 | 4.0 | Water Heater | 1 | 1500 | 1500 | |||
| 6 | 20 | 4.0 | 4.0 | Space Heater | 1 | 3000 | 3000 | |||
| 7 | 20 | Spare | ||||||||
| 8 | 20 | Spare | ||||||||
| 9 | 20 | Spare | ||||||||
| 10 | 20 | Spare | ||||||||
| 5968 | ||||||||||
| TOTAL CONNECTED LOAD | (W) | 5968 | ||||||||
| DIVERSITY FACTOR | % | 0.30 | ||||||||
| DIVERSIFIED LOAD | (kW) | 1.79 | ||||||||
| REF | Distribution board for existing design | |||||||||
| HOUSE NUMBER | 10 | |||||||||
| NO. OF WAYS | 10 | |||||||||
| VOLTAGE | 230V/50Hz/1Ph | |||||||||
| Cct. | MCB | Cable | Earth | DESCRIPTION | ||||||
| Ref | (A) | (mm2) | (mm2) | DETAIL | Nr. | W | Nr. | W | R | |
| 1 | 10 | 2.5 | 2.5 | Lighting circuit 1 | 10 | 35 | 4 | 3 | 362 | |
| 2 | 10 | Spare | 0 | |||||||
| 3 | 20 | 4.0 | 4.0 | Power circuit 1 | 3 | 200 | 600 | |||
| 4 | 20 | 4.0 | 4.0 | Power circuit 2 | 4 | 200 | 800 | |||
| 5 | 20 | 4.0 | 4.0 | Water Heater | 1 | 1500 | 1500 | |||
| 6 | 20 | 4.0 | 4.0 | Space Heater | 1 | 3000 | 3000 | |||
| 7 | 20 | Spare | ||||||||
| 8 | 20 | Spare | ||||||||
| 9 | 20 | Spare | ||||||||
| 10 | 20 | Spare | ||||||||
| 6262 | ||||||||||
| TOTAL CONNECTED LOAD | (W) | 6262 | ||||||||
| DIVERSITY FACTOR | % | 0.30 | ||||||||
| DIVERSIFIED LOAD | (kW) | 1.88 | ||||||||
| REF | Distribution board for proposed design | |||||||||
| HOUSE NUMBER | 10 | |||||||||
| NO. OF WAYS | 10 | |||||||||
| VOLTAGE | 230V/50Hz/1Ph | |||||||||
| Cct. | MCB | Cable | Earth | DESCRIPTION | ||||||
| Ref | (A) | (mm2) | (mm2) | DETAIL | Nr. | W | Nr. | W | R | |
| 1 | 10 | 2.5 | 2.5 | Lighting circuit 1 | 12 | 5 | 5 | 3 | 75 | |
| 2 | 10 | Spare | 0 | |||||||
| 3 | 20 | 4.0 | 4.0 | Power circuit 1 | 3 | 200 | 600 | |||
| 4 | 20 | 4.0 | 4.0 | Power circuit 2 | 4 | 200 | 800 | |||
| 5 | 20 | 4.0 | 4.0 | Water Heater | 1 | 1500 | 1500 | |||
| 6 | 20 | 4.0 | 4.0 | Space Heater | 1 | 3000 | 3000 | |||
| 7 | 20 | Spare | ||||||||
| 8 | 20 | Spare | ||||||||
| 9 | 20 | Spare | ||||||||
| 10 | 20 | Spare | ||||||||
| 5975 | ||||||||||
| TOTAL CONNECTED LOAD | (W) | 5975 | ||||||||
| DIVERSITY FACTOR | % | 0.30 | ||||||||
| DIVERSIFIED LOAD | (kW) | 1.79 | ||||||||
References
- Carbon Trust Residential Lighting Challenges and Solutions. Carbon Trust Publ. 2019.
- Ciardiello Energy Inefficiency in UK Homes. Build. Serv. J. 2020.
- Sonta, A. Restoring Older Structures for Energy Efficiency. Energy Build. 2017. [Google Scholar] [CrossRef]
- Ali, S.& B. Renovation Strategies for Energy Reduction. J. Sustain. Archit. 2020.
- Chartered Institution of Building Services Engineers. Lighting Control and Flexibility in Residential Design; 2022. [Google Scholar]
- National Library of Medicine Circadian Rhythm and Lighting Health Impacts. Med. Light. Rev. 2021.
- Jalali, M.S.; Jones, J.R.; Tural, E.; Gibbons, R.B. Human-Centric Lighting Design: A Framework for Supporting Healthy Circadian Rhythm Grounded in Established Knowledge in Interior Spaces. Buildings 2024, 14, 1125. [Google Scholar] [CrossRef]
- Bergesen Gibon & Suh, T. Environmental Impact of Inefficient Lighting. J. Clean. Prod. 2022. [Google Scholar] [CrossRef]
- Hunter, B.& Lighting Design and Health Impacts. Light. Res. Technol. 2023. [CrossRef]
- Chiradeja, P.; Yoomak, S. Development of Public Lighting System with Smart Lighting Control Systems and Internet of Thing (IoT) Technologies for Smart City. Energy Reports 2023, 10, 3355–3372. [Google Scholar] [CrossRef]
- HM Government Conservation of Fuel and Power - Approved Document L. Build. Regul. 2010 2023, 1. Government UK Net Zero and Part L Compliance. B.
- Reinhart, C. Manual vs Simulation-Based Lighting Design. Build. Environ. 2019. [Google Scholar] [CrossRef]
- Lighting, P. DIALux and CAD Tools for Lighting Design. Light. Des. Rev. 2021. [Google Scholar]
- Mukherjee, B.; Boubekri, M. Sustainable Architecture and Human Health: A Case for Effective Circadian Daylighting Metrics. Buildings 2025, 15, 315. [Google Scholar] [CrossRef]
- Cooban, A. UK Energy Crisis Is ‘Bigger than the Pandemic’. Available online: https://edition.cnn.com/2022/08/24/energy/energy-crisis-uk-cost-pandemic/index.html (accessed on 27 November 2025).
- Steffy, G. Architectural Lighting Design, 3rd ed.; Wiley & Sons, Inc., 2008; ISBN 978-0-470-11249-6. [Google Scholar]
- Cho, Y.; et al. Effects of Blue Light on Melatonin Suppression. J. Biol. Rhythms 2015. [Google Scholar] [CrossRef]
- Sánchez, S.; et al. Impact of Residential Lighting Design on Sleep Quality. Light. Res. Technol. 2019. [Google Scholar] [CrossRef]
- Crespo, M.T.; Trebucq, L.L.; Senna, C.A.; Hokama, G.; Paladino, N.; Agostino, P.V.; Chiesa, J.J. Circadian Disruption of Feeding-Fasting Rhythm and Its Consequences for Metabolic, Immune, Cancer, and Cognitive Processes. Biomed. J. 2025, 48, 100827. [Google Scholar] [CrossRef] [PubMed]
- (CEN) European Committee for Standardization Light and Lighting—Lighting of Workplaces—Indoor Workplaces. EN 12464-12011, 2011.
- (CIBSE) Chartered Institution of Building Services Engineers Lighting Guide LG7: Office Lighting. CIBSE LG7, 2015.
- Aliparast, S.; Onaygil, S. A Field Study of Individual, Energy-Efficient, and Human-Centered Indoor Electric Lighting: Its Impact on Comfort and Visual Performance in an Open-Plan Office. Buildings 2024, 14, 936. [Google Scholar] [CrossRef]
- Trząski, A.; Rucińska, J. Integration of Daylight in Building Design as a Way to Improve the Energy Efficiency of Buildings. Energies 2025, 18, 4113. [Google Scholar] [CrossRef]
- Zocchi, G.; Hosseini, M.; Triantafyllidis, G. Exploring the Synergy of Advanced Lighting Controls, Building Information Modelling and Internet of Things for Sustainable and Energy-Efficient Buildings: A Systematic Literature Review. Sustainability 2024, 16, 10937. [Google Scholar] [CrossRef]
Figure 1.
Human circadian rhythm (Source – Author created).
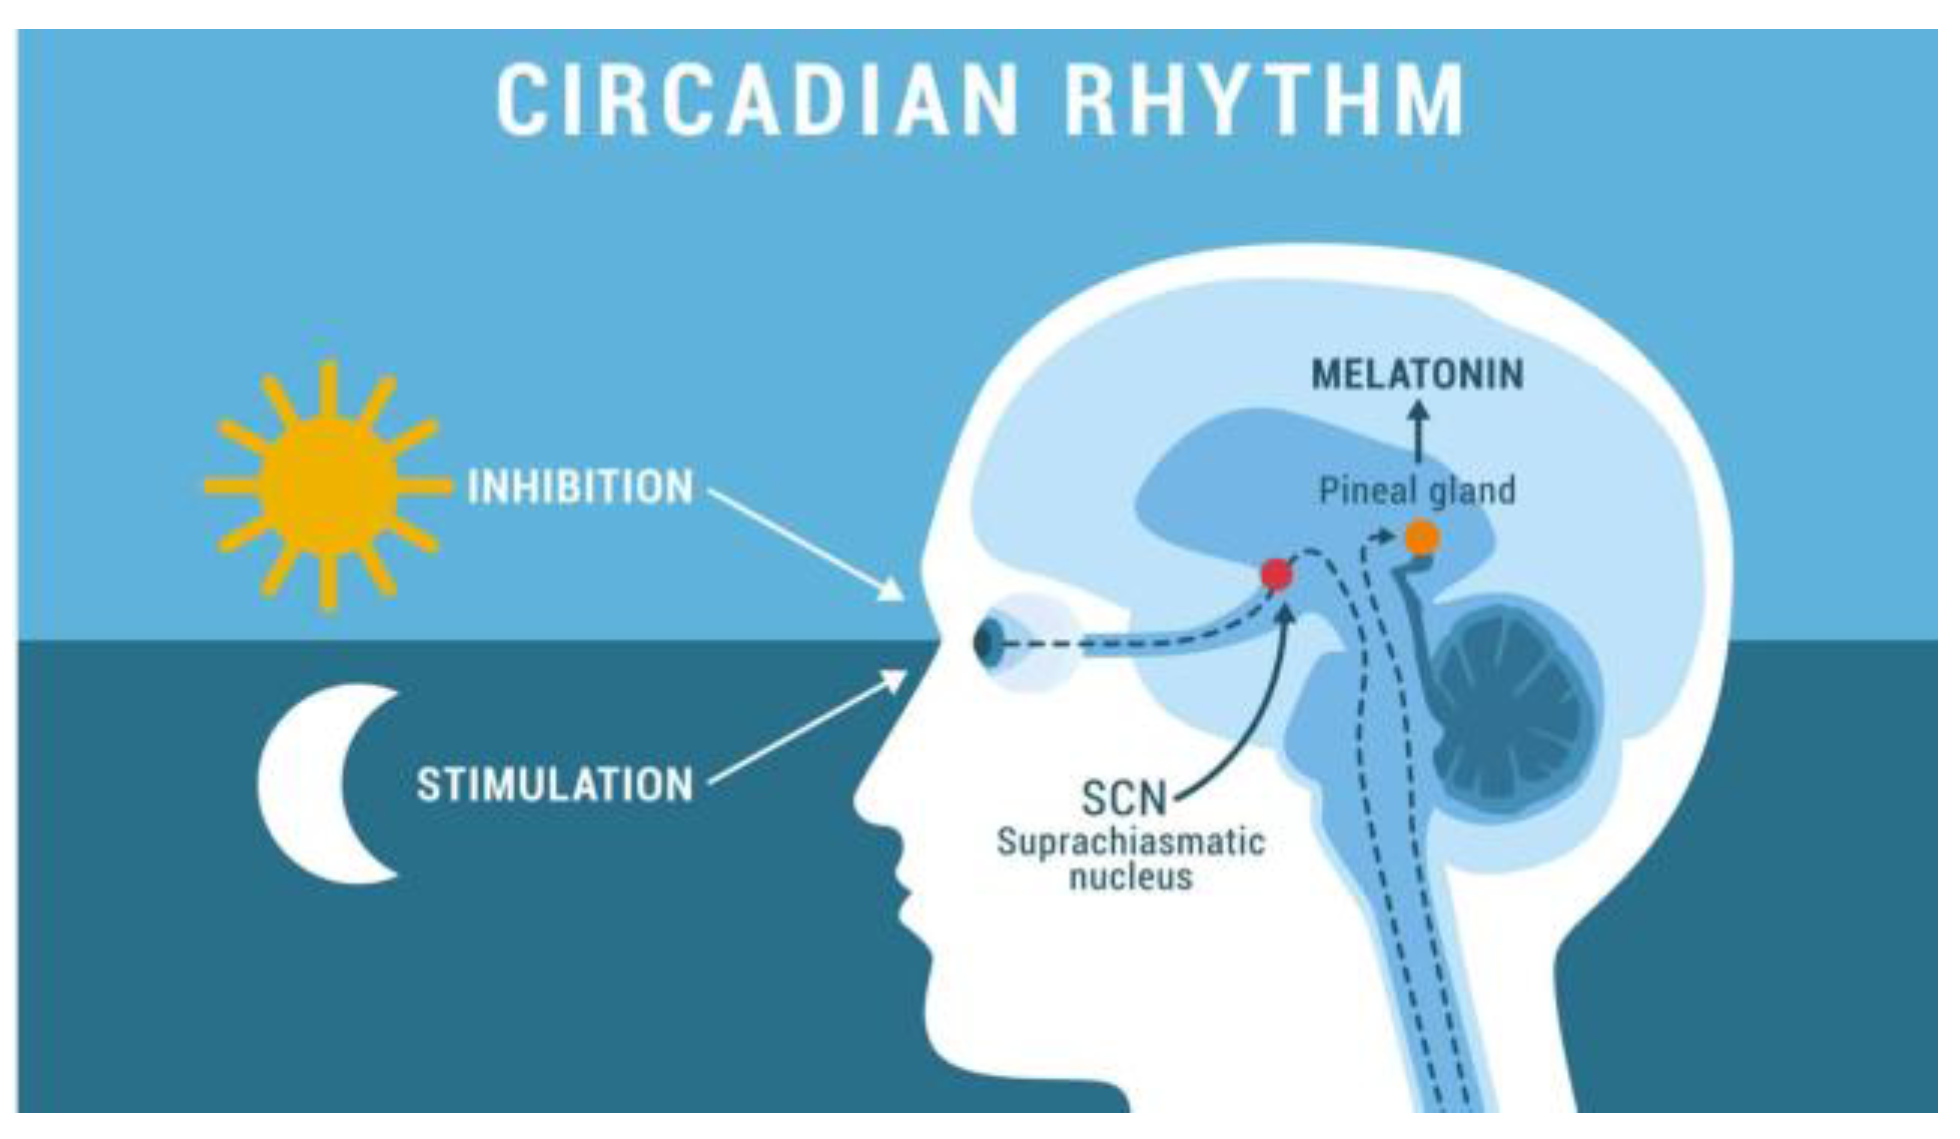
Figure 3.
Colour Rendering Index (CRI) on scale of 1-100 (Source – author created).

Figure 5.
Comparison of energy consumption.
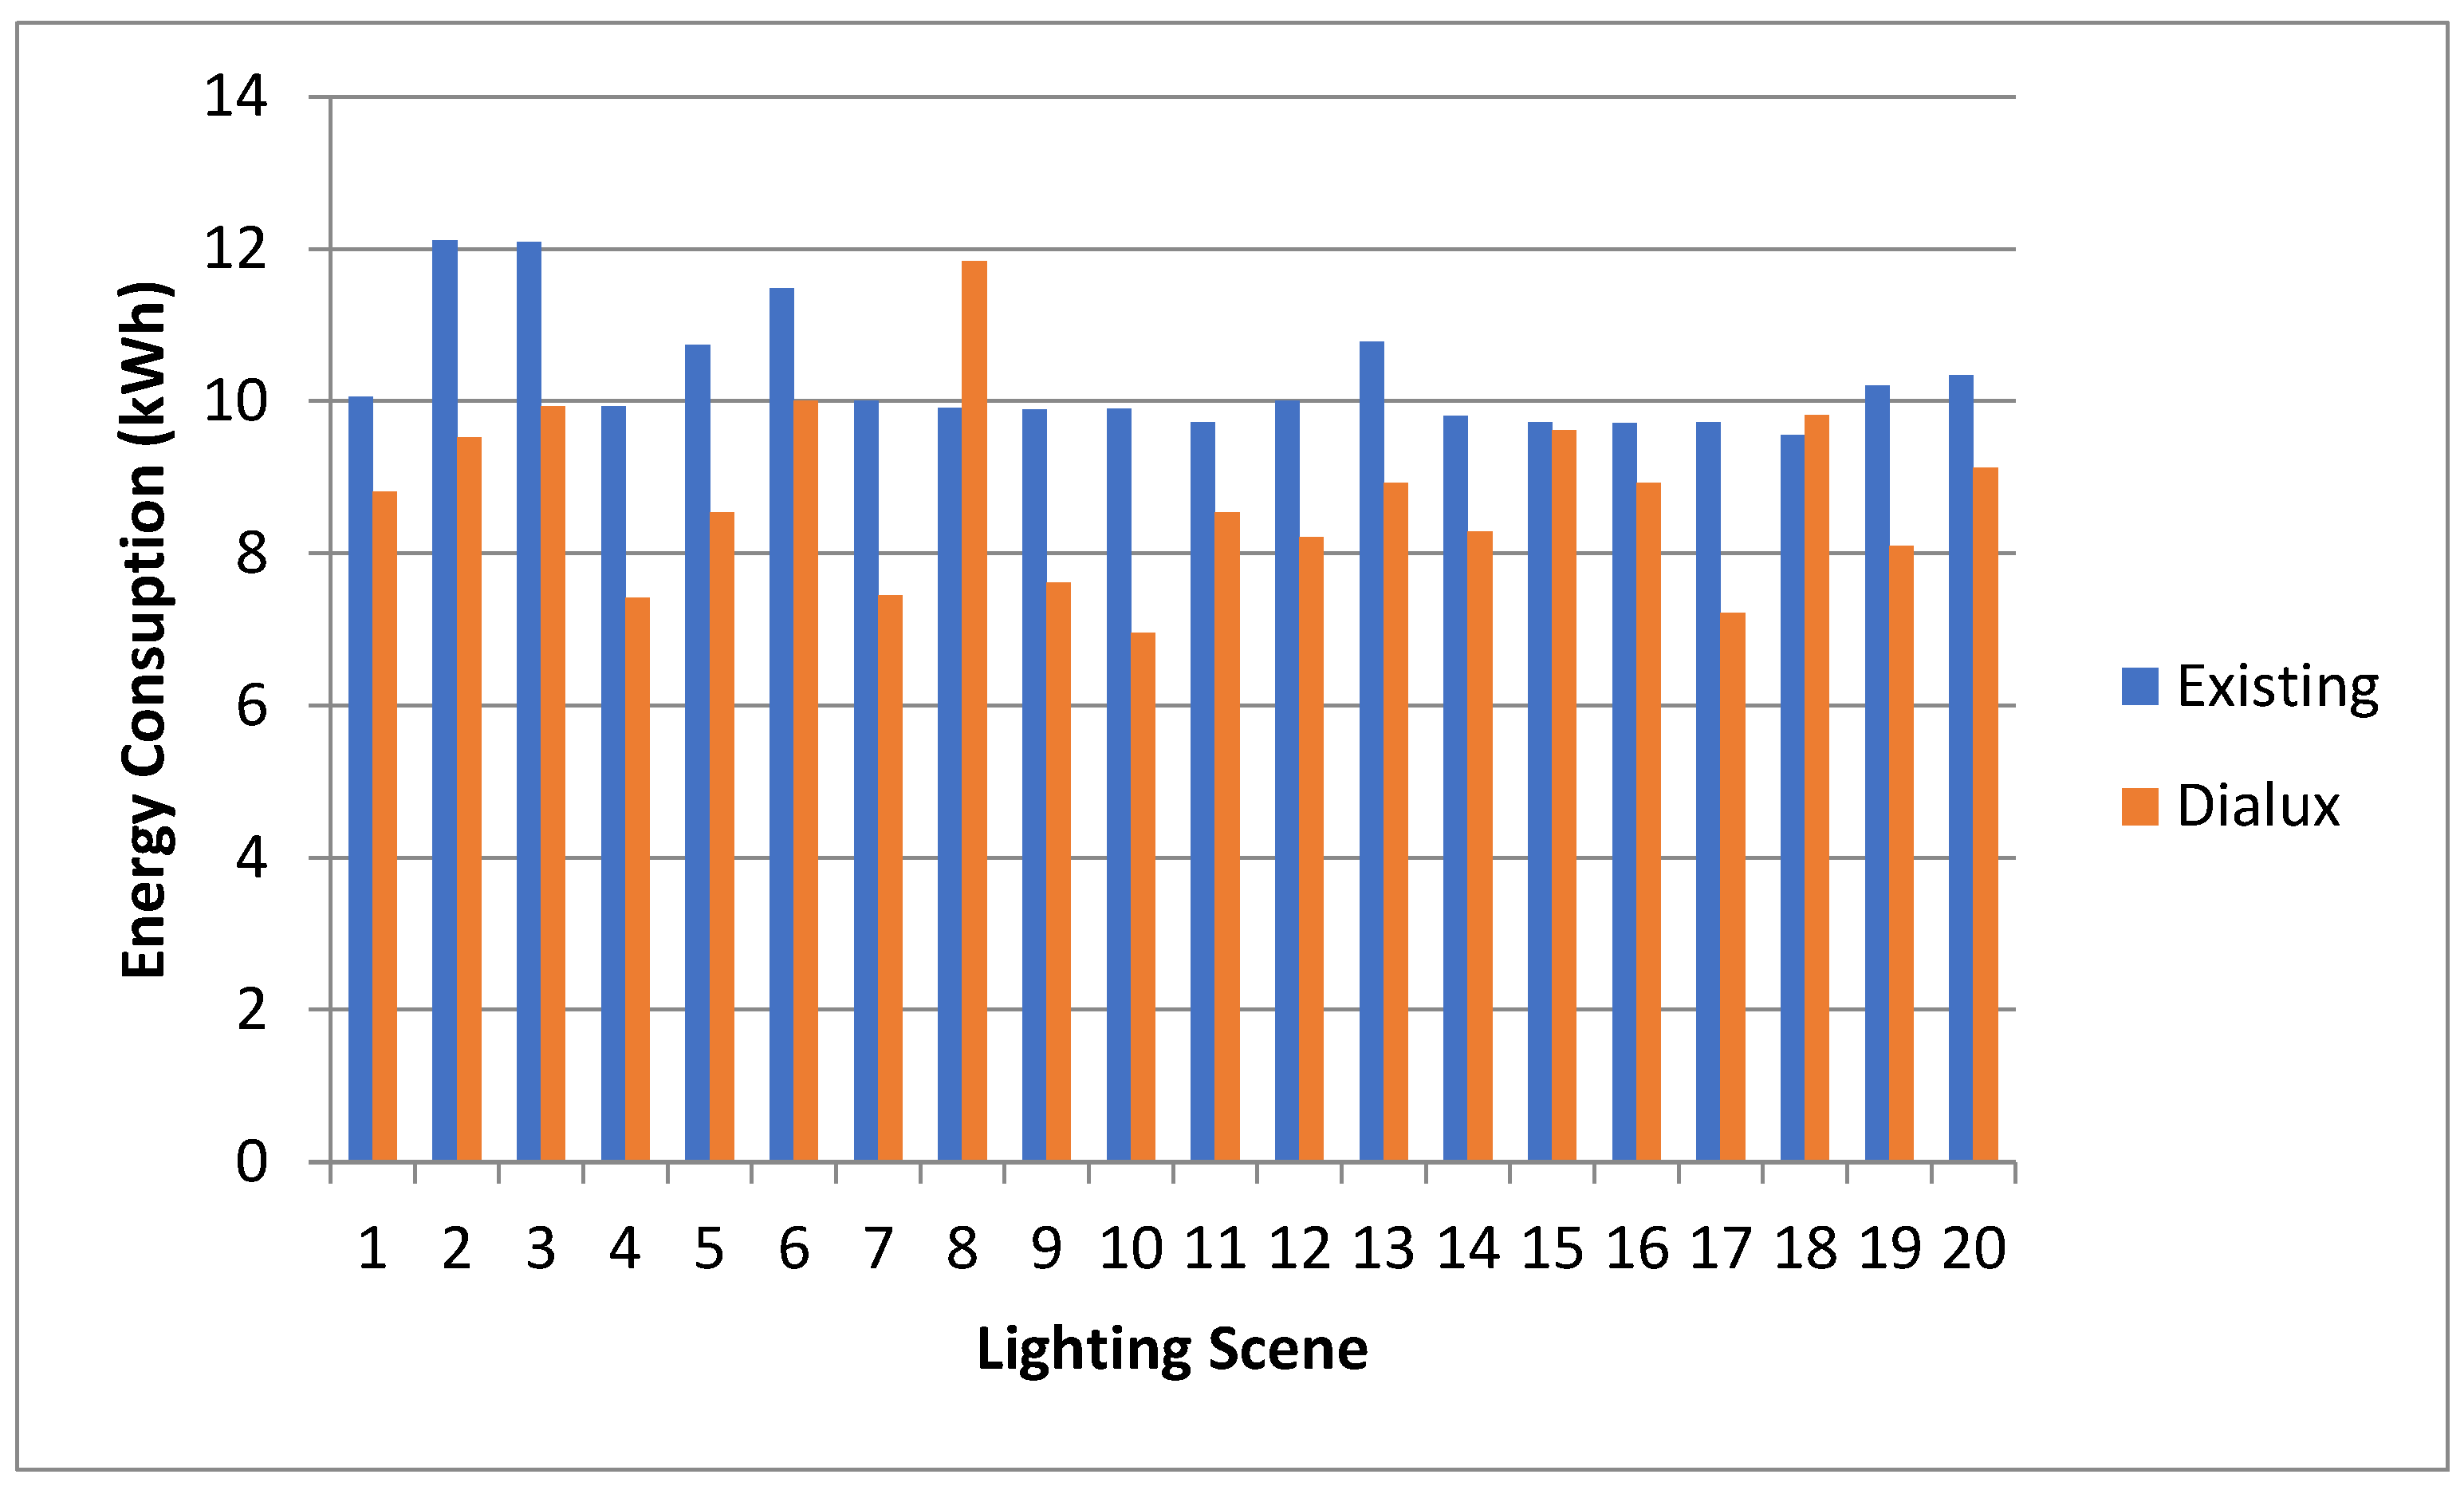
Figure 6.
Comparison of lux levels between existing and proposed lighting design for living room.
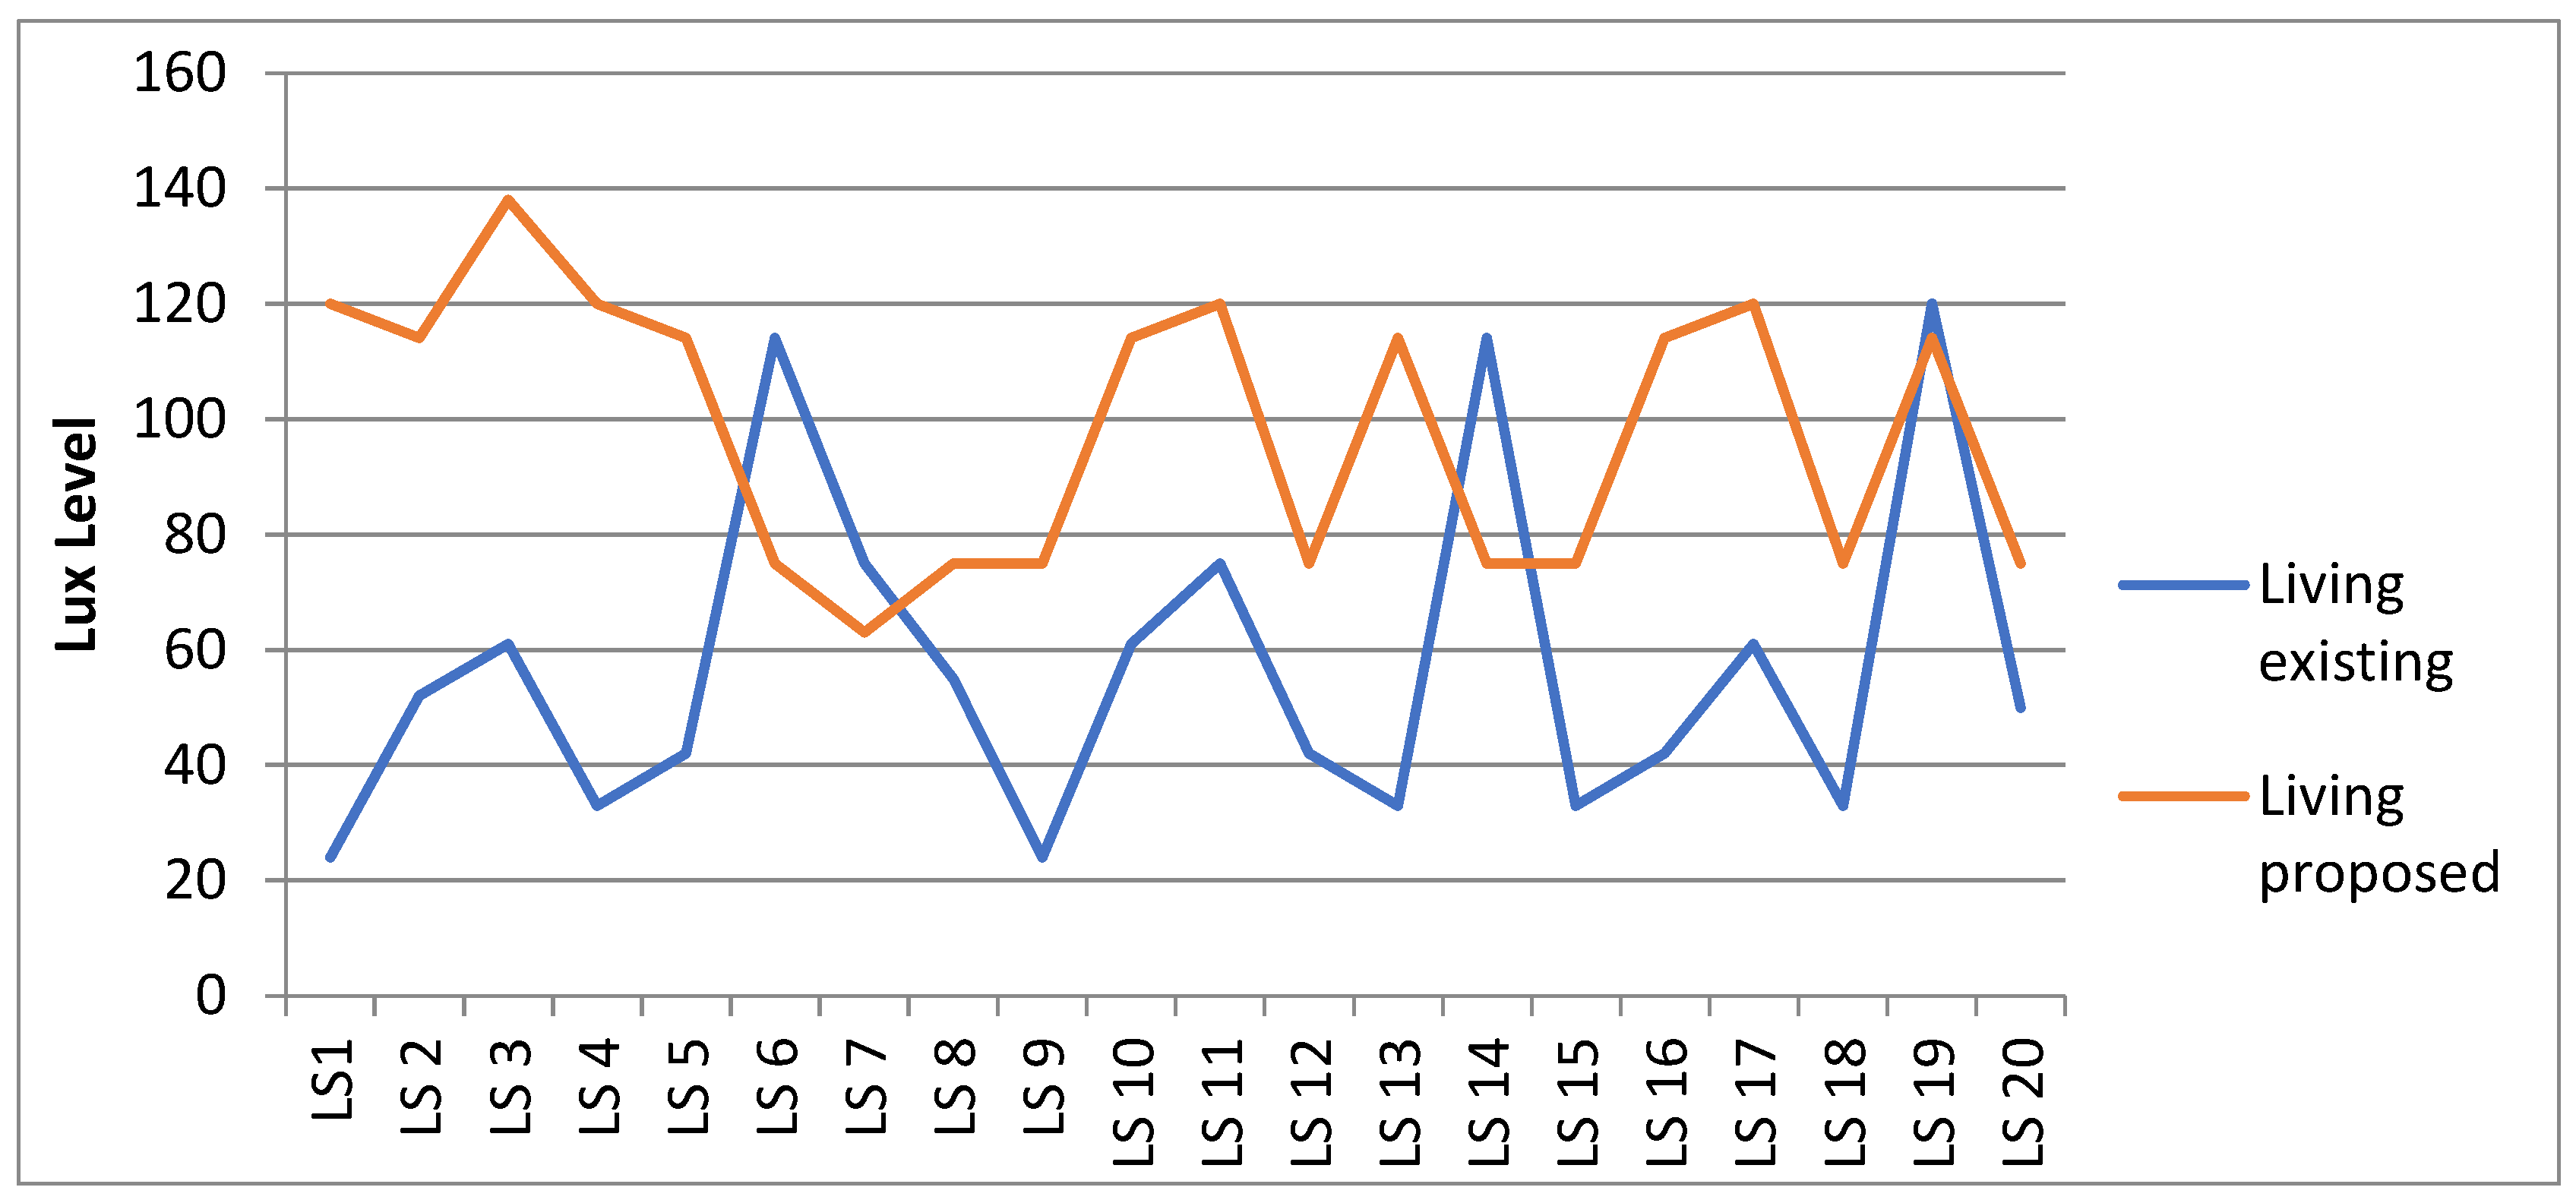
Figure 7.
Comparison of lux levels between existing and proposed lighting design for kitchen.
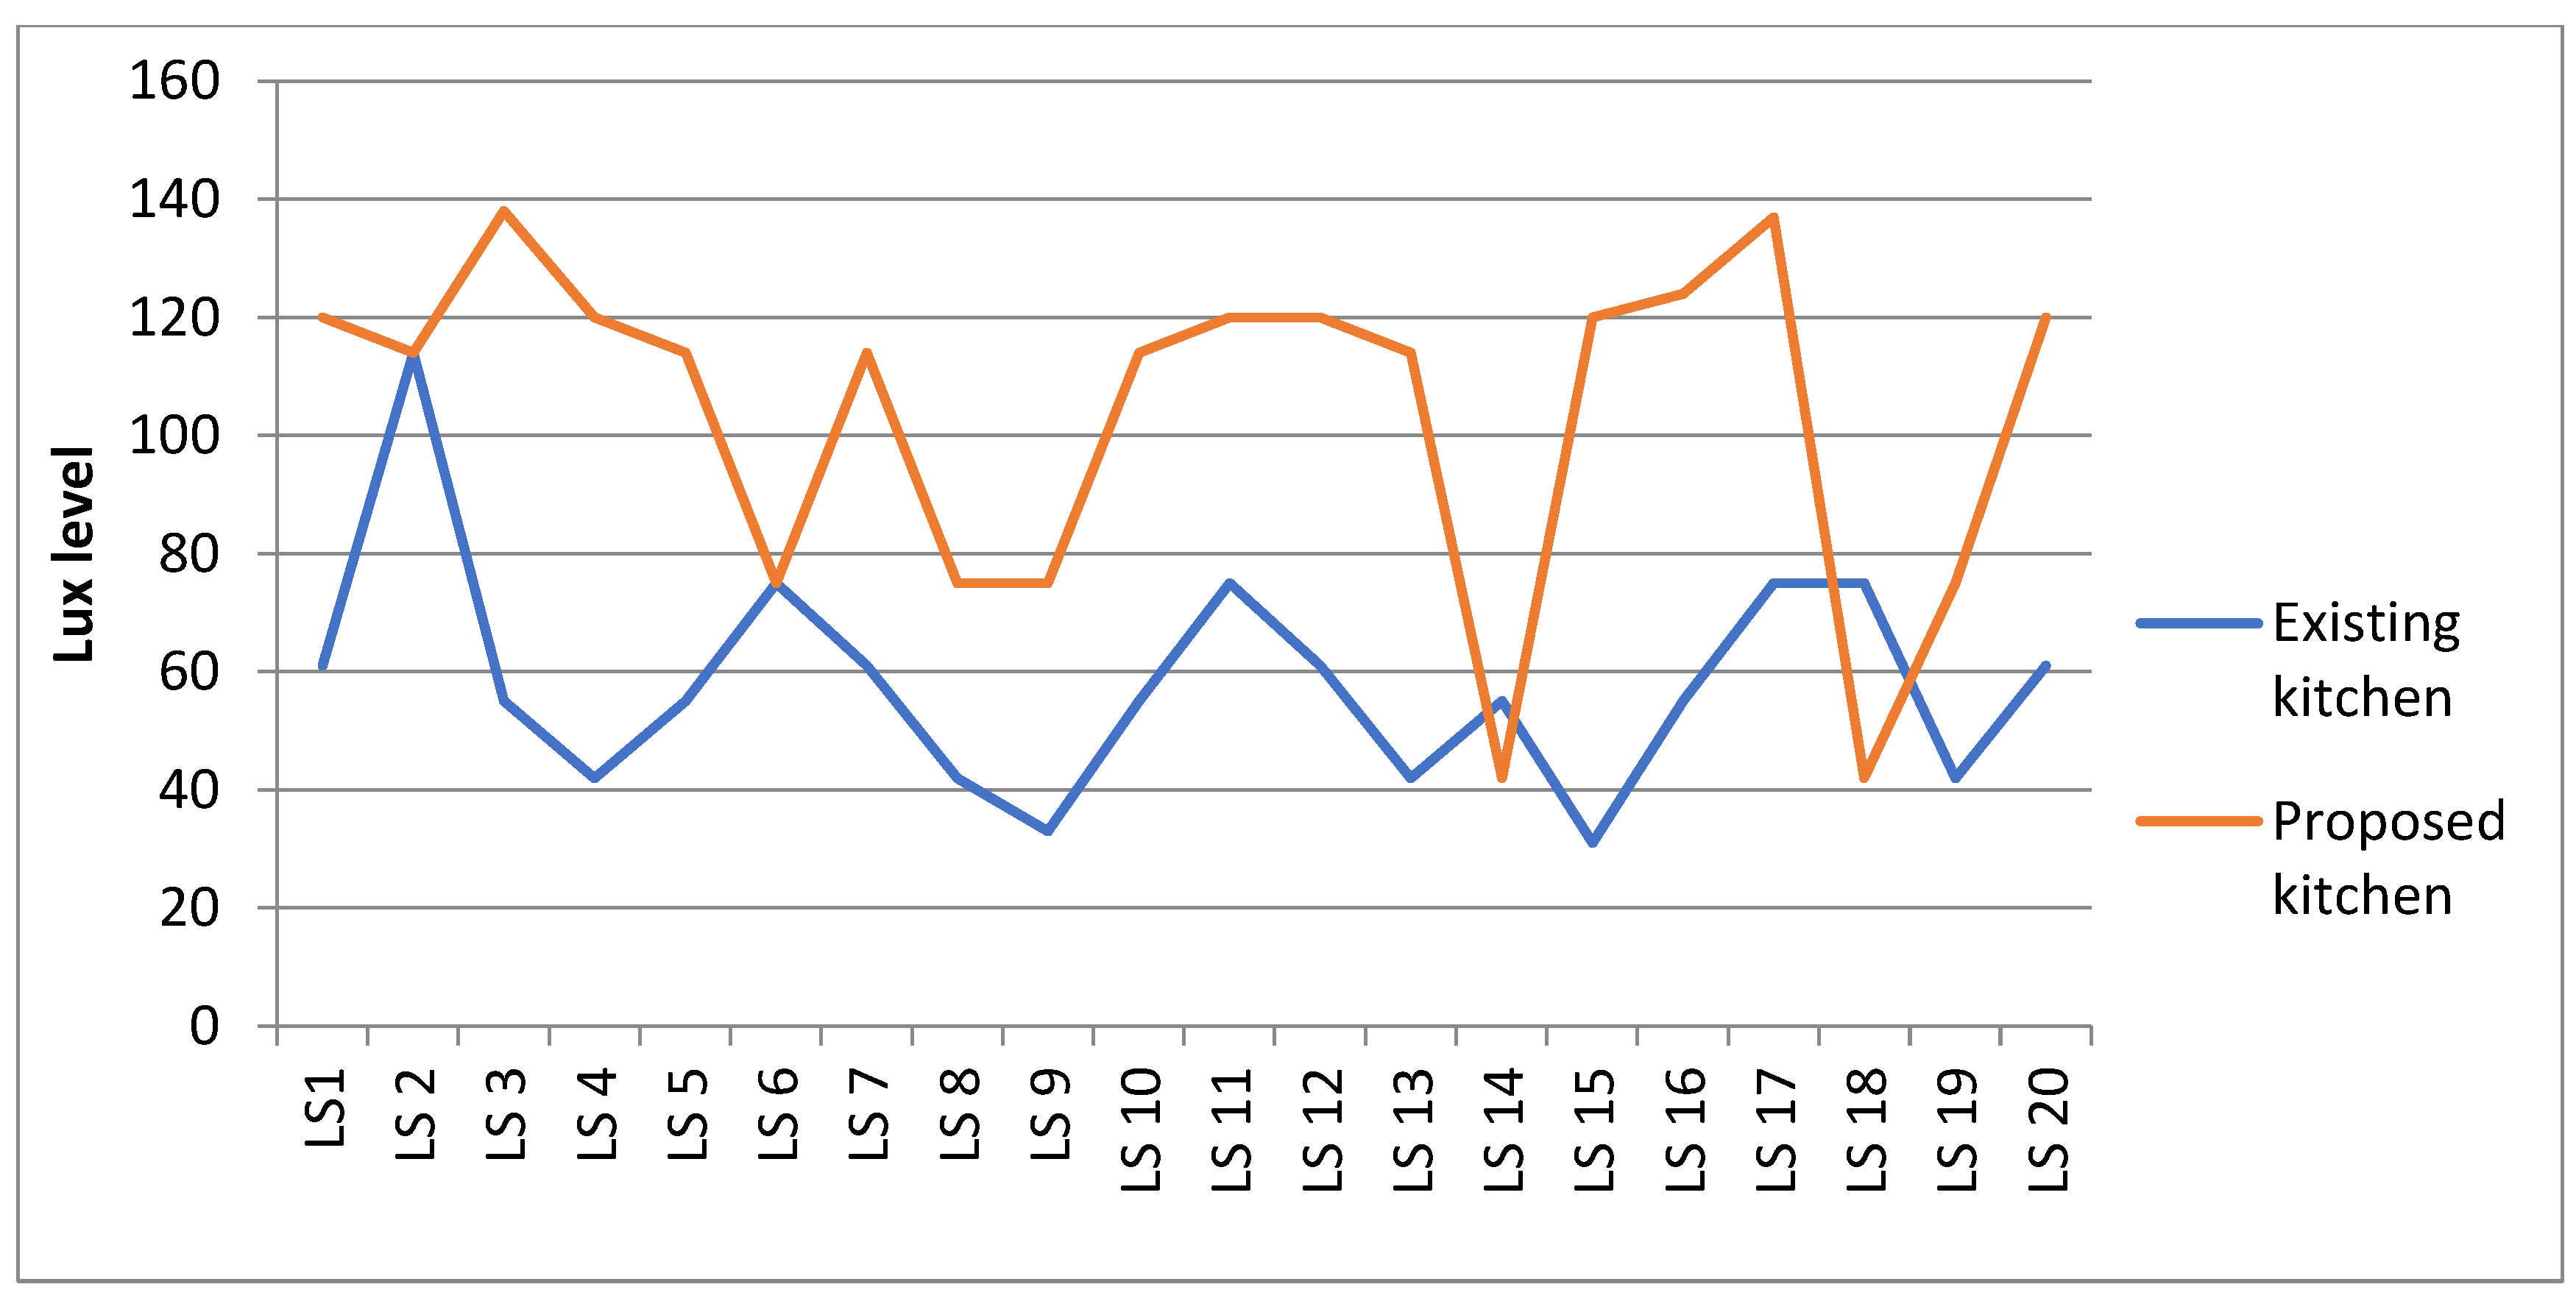
Figure 8.
Comparison of lux levels between existing and proposed lighting design for bedrooms.
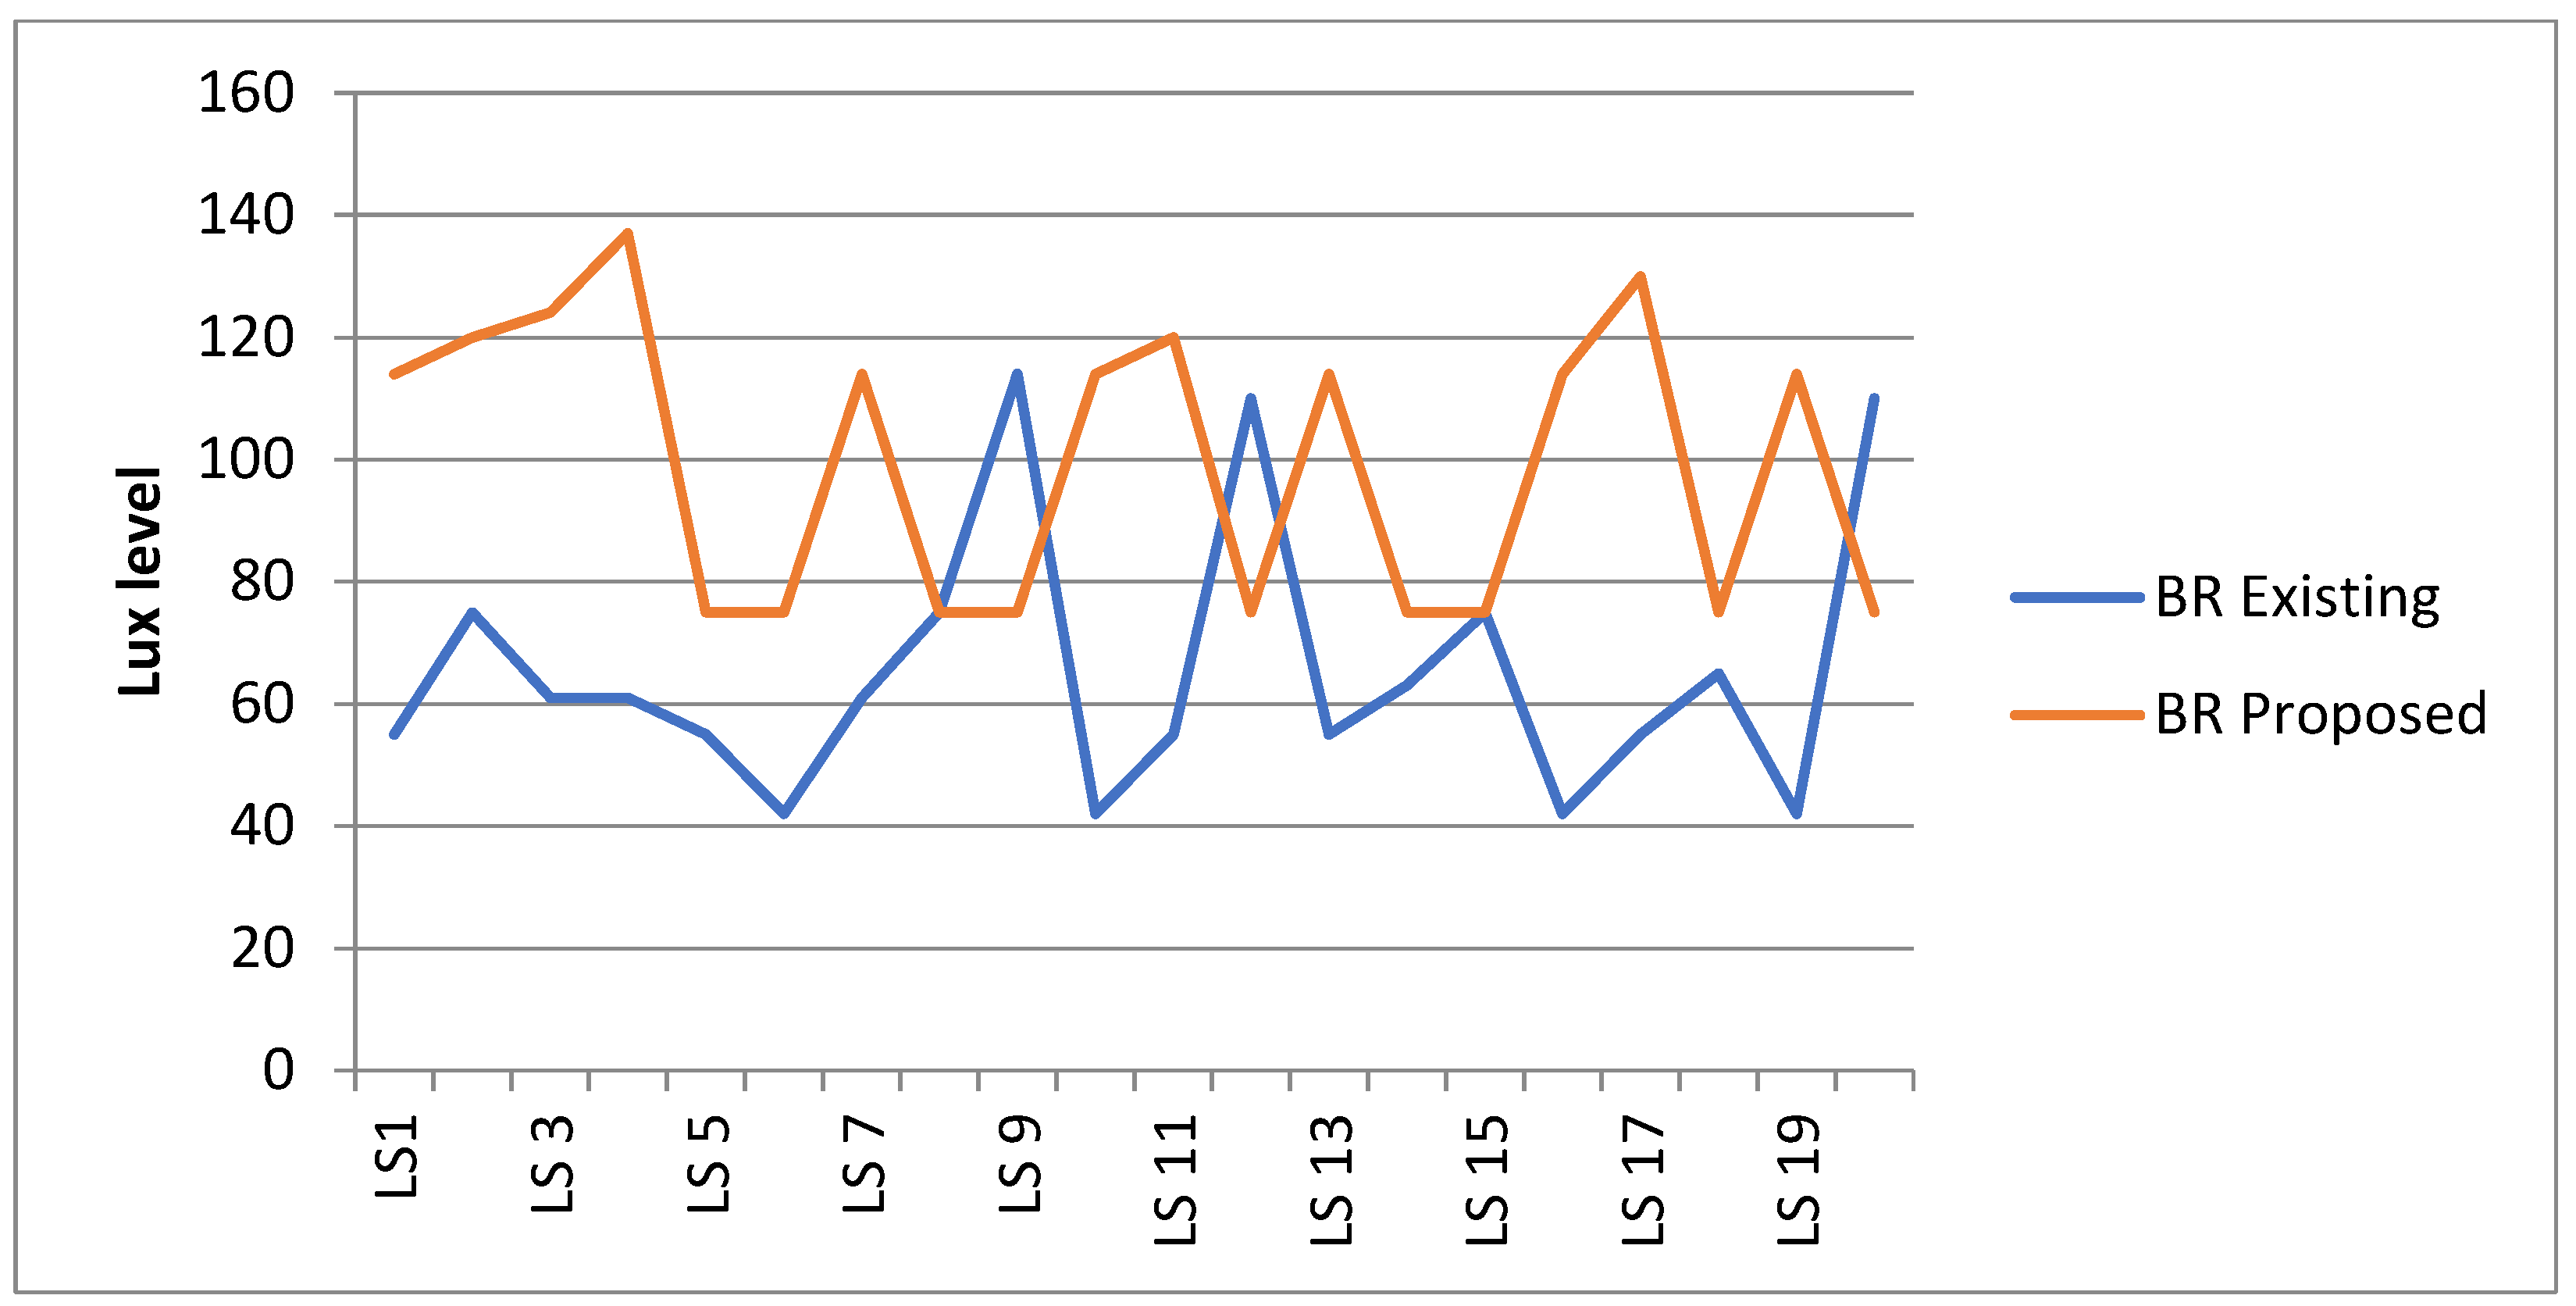
Figure 9.
Comparative illuminance distribution for varying fixture positions in a single room.
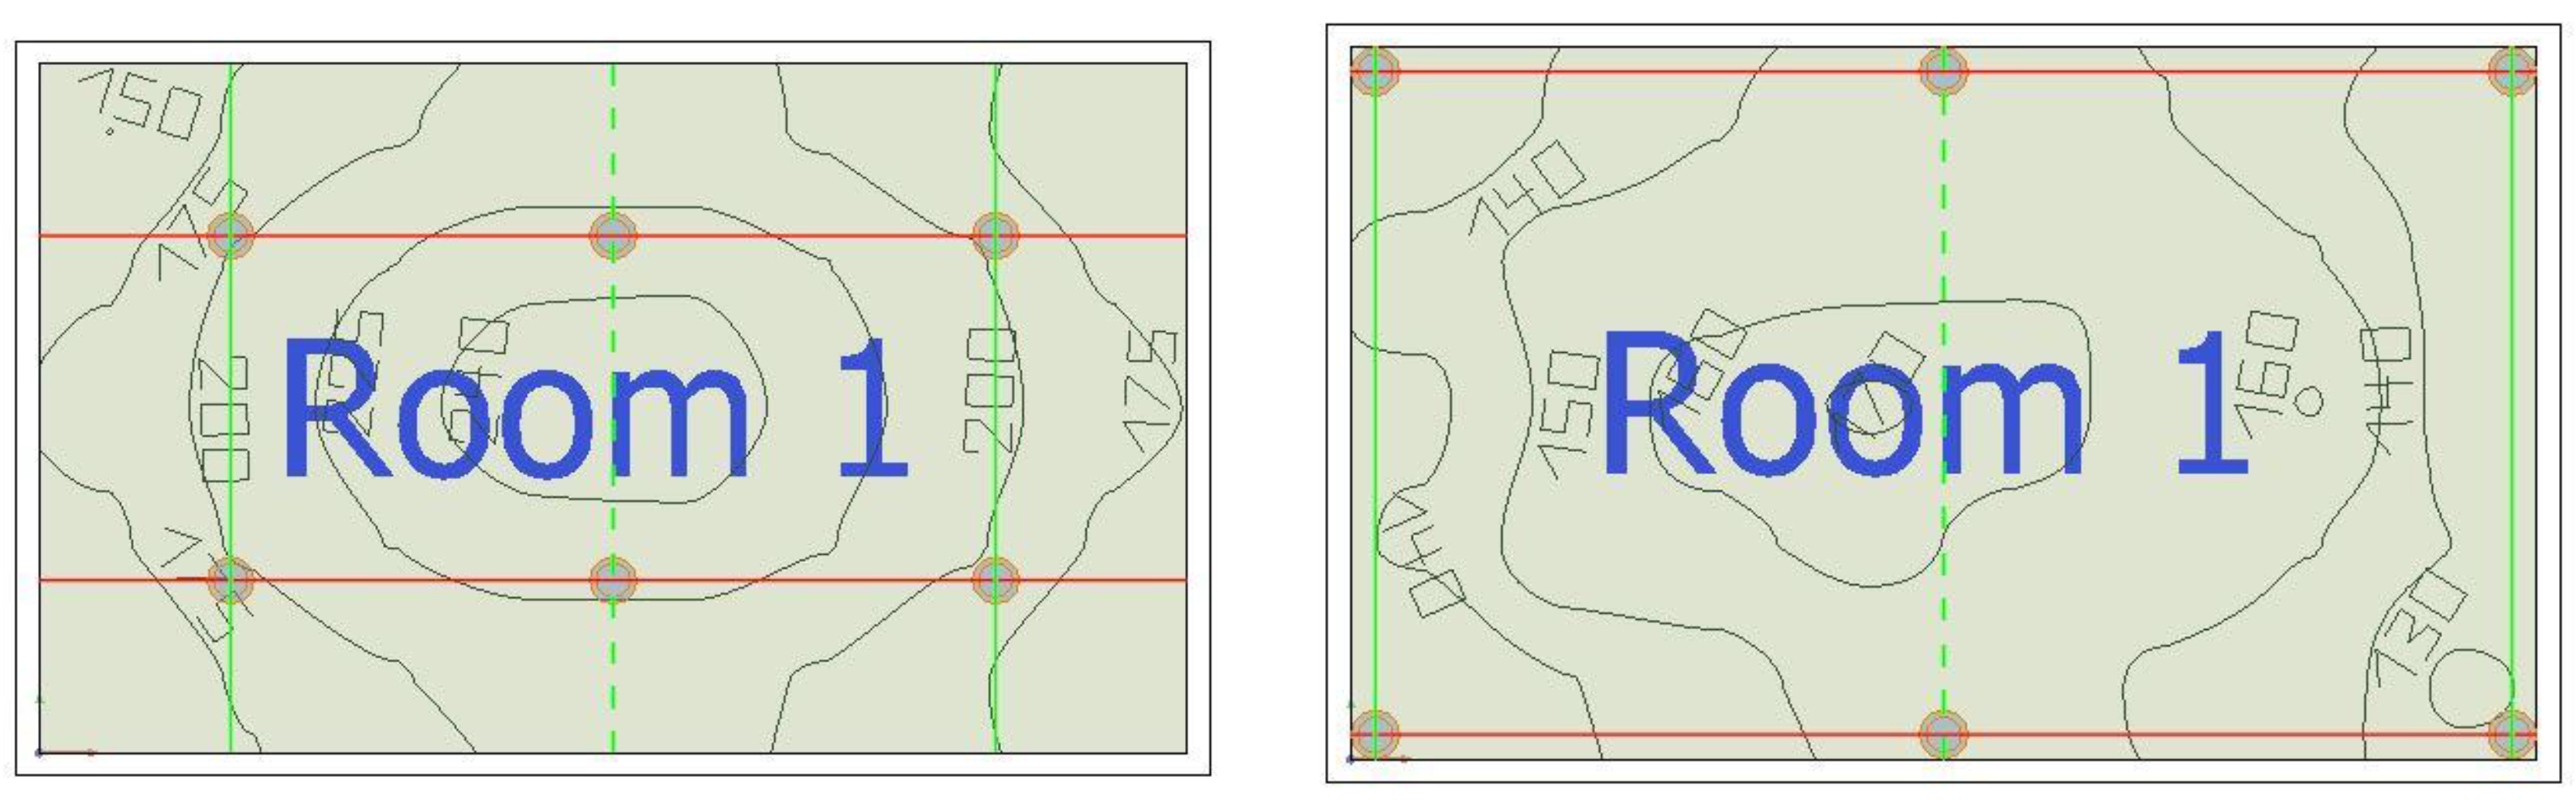
Figure 10.
Illuminance comparison for different fixture spacing and layout configurations.
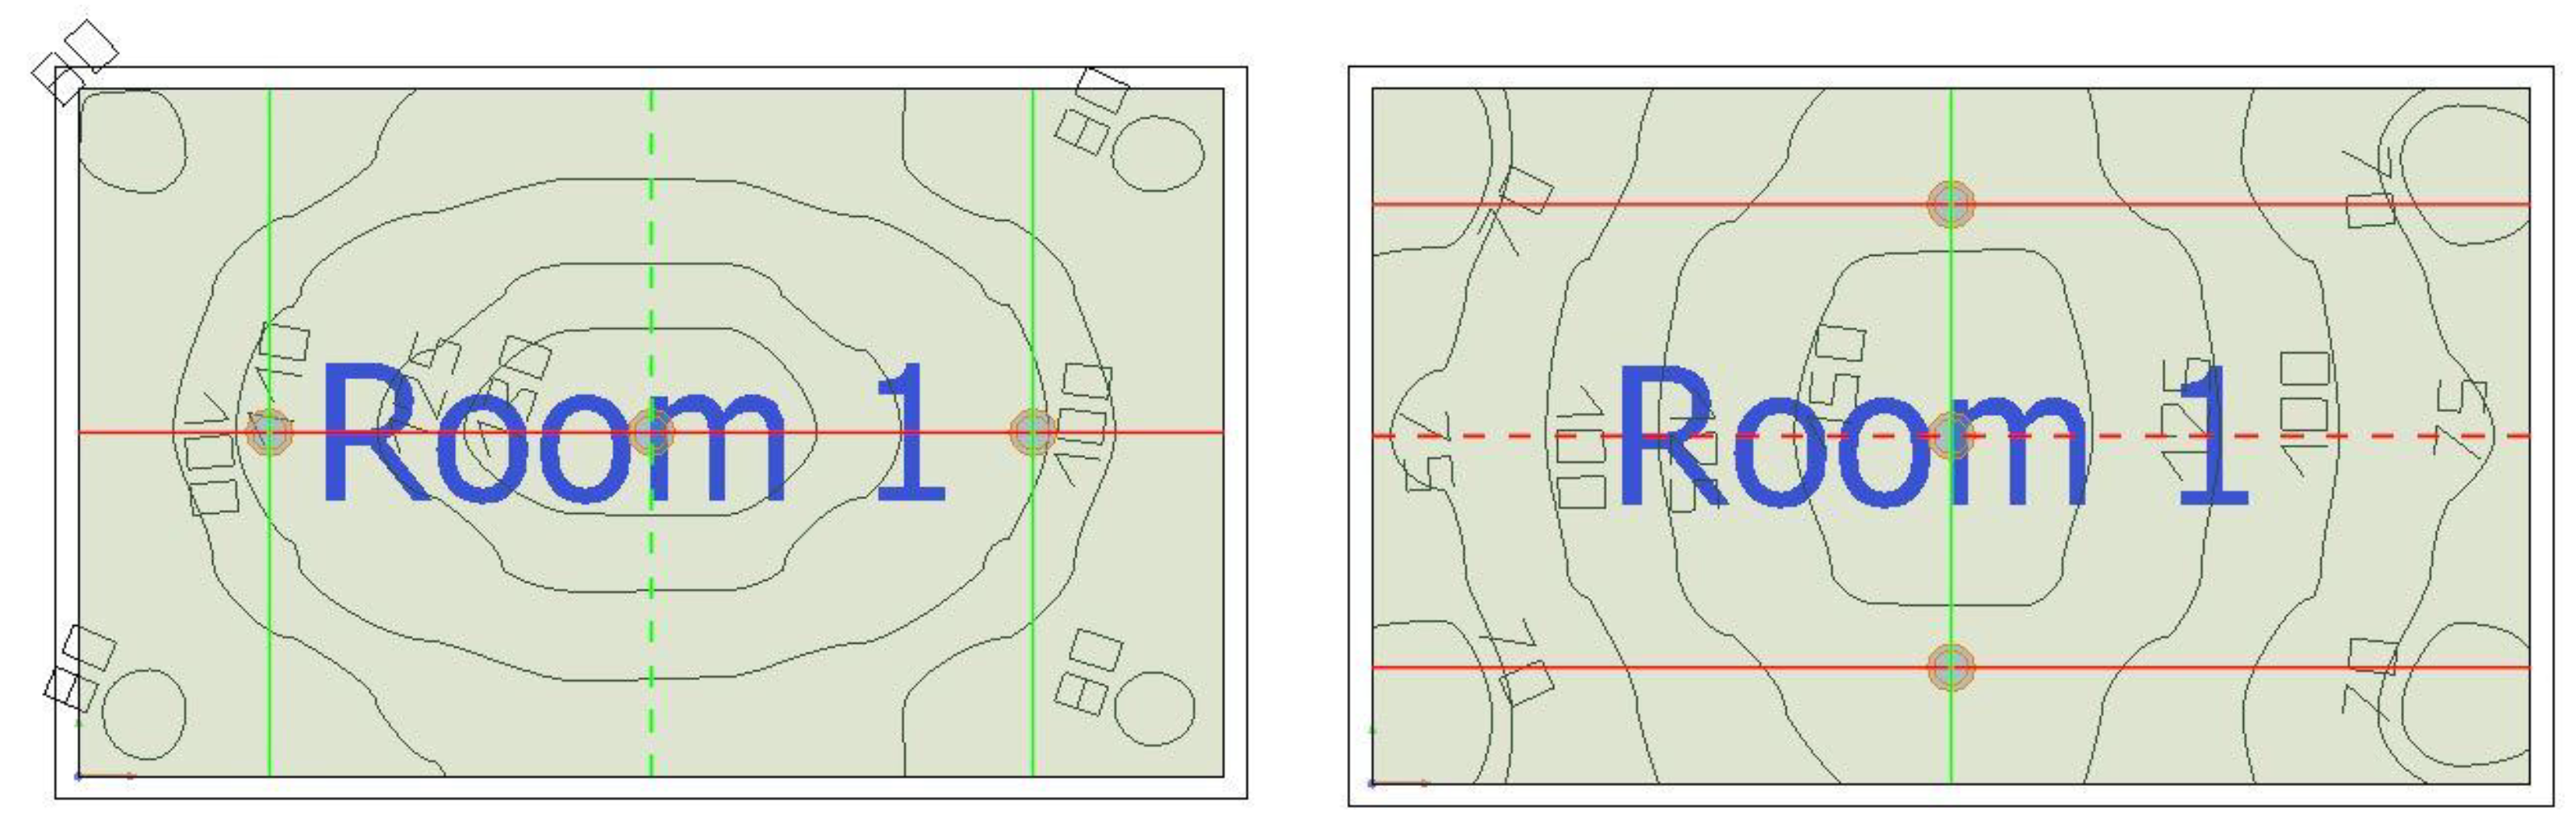
Figure 11.
Illuminance comparison for varying beam angles at constant wattage and lumen output.
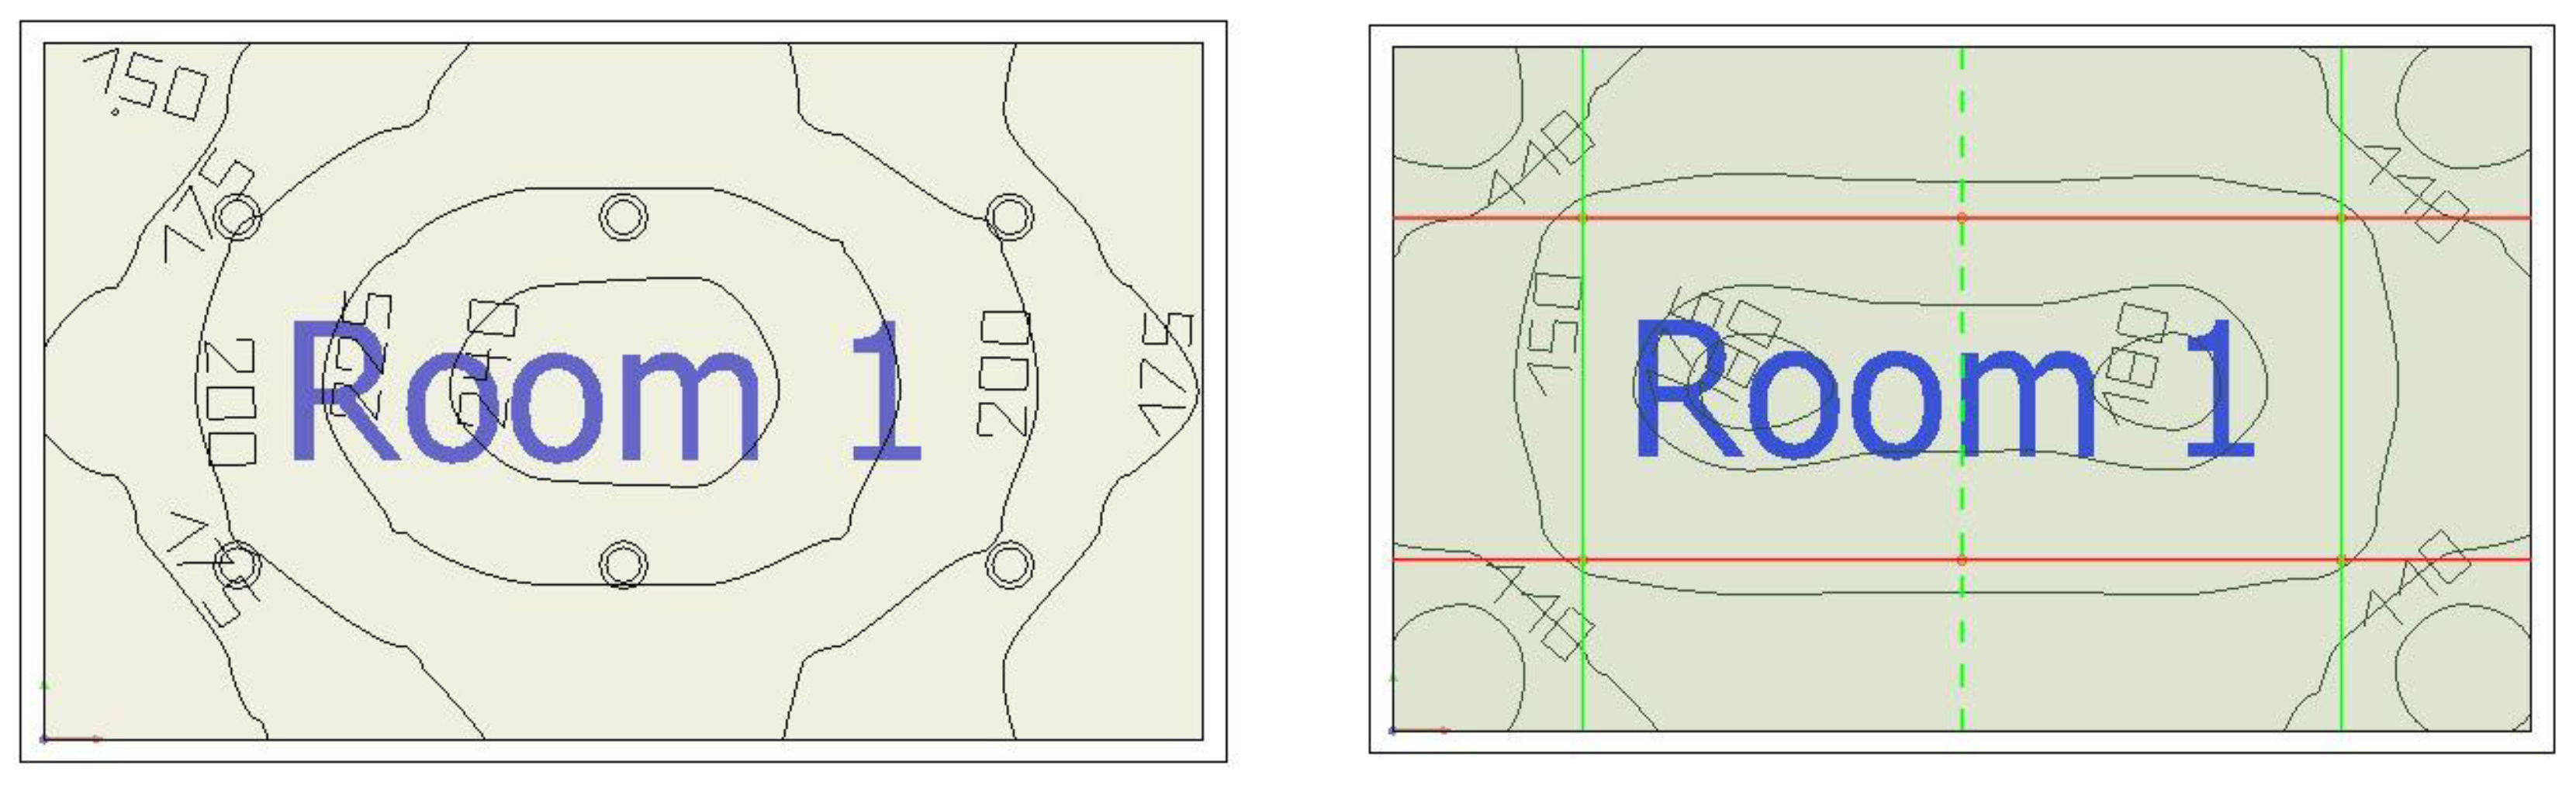
Figure 12.
Illuminance comparison for varying fixture mounting heights.
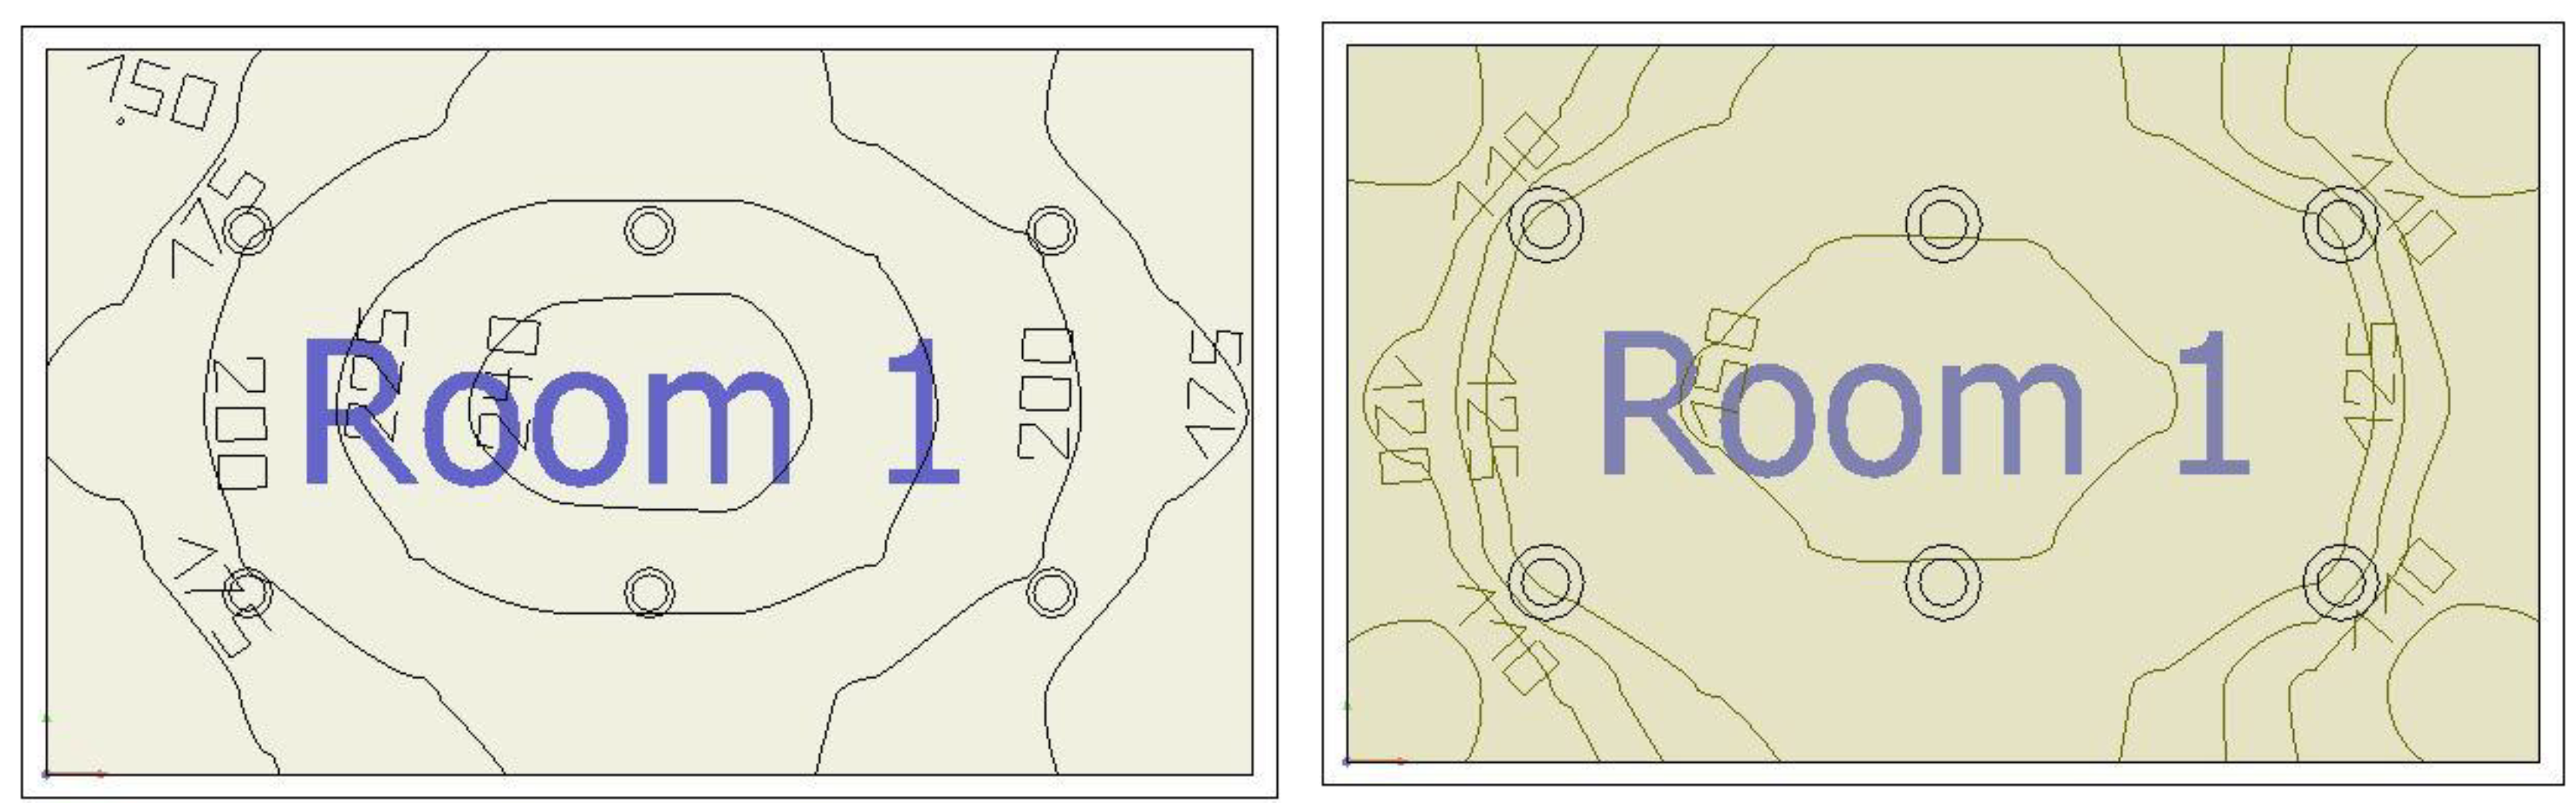
Table 1.
Comparative specifications of existing manual and DIALux-based lighting designs across 20 scenes.
Table 1.
Comparative specifications of existing manual and DIALux-based lighting designs across 20 scenes.
| Lighting Scene | Recreated existing lighting design for manual calculation & details of the lights using | Proposed lighting design using DIALux calculations & details of the lights using |
|
LS1 |
 Living – 20W CFL Bed room – 15W CFL Bath room – 12W CFL |
 Living – 10W LED Bed room – 10W LED Bath room – 8W LED |
| LS2 |
 Living, Kitchen, bed room – 12W CFL Bath room – 10W CFL |
 Living, kitchen – 10W LED Bed room -8W LED Bath room – 3W LED |
|
LS3 |
 Living & bed room – 10W LED Bath room – 8W LED |
 Living & bed room- 8W LED Bath room – 3W LED |
|
LS4 |
 Living & bed room – 10W LED Bath room – 8W LED |
 Living & bed room – 12W LED Bath room – 3W LED |
|
LS5 |
 Living & kitchen – 10W LED Bed room – 10W LED Bath room – 8W LED |
 Living & kitchen -8W LED Bed room – 5W LED Bath room – 3W LED |
|
LS6 |
 Living – 10W LED Entrance – 8W LED Bed room – 10W LED Bath room – 8W LED |
 Living & entrance – 8W LED Bed room – 10W LED Bath room – 3W LED |
| LS7 |
 Living, entrance & kitchen-20W CFL Bed & bath room-10W CFL |
 Living, entrance, kitchen & bed room -10W LED Bath room -3W LED |
| LS8 |
 Living & bed room – 10W LED Bath room – 8W LED |
 Living & bed room – 5W LED Bath room-3W LED |
|
LS9 |
 Living – 13W CFL Bed room & bath room-10W CFL |
 Living – 8W LED Bed room & bath room-10W LED |
|
LS10 |
 Living & bed room – 18W CFL Bath room – 10W CFL |
 Living & bed room – 8W LED Bath room – 5W LED |
| LS 11 |
 Living -15W CFL Bed room – 8W CFL Bath room – 10W CFL |
 Living-3W LED Bed rom & bath room-8W LED |
| LS12 |
 Living – 10W LED Bed room-13W LED Kitchen-5W LED |
 Living & kitchen – 5W LED Bed room-3W LED |
| LS13 |
 Living & kitchen-12W CFL Bed room-10W CFL Bath room-12W CFL |
 Living -3W LED Bed room-8W LED Bath room-3W LED |
| LS14 |
 Living & bed room-20W CFL Bath room-12W CFL |
 Living-3W LED Bed room -8W LED Bath room-5W LED |
| LS 15 |
 Living, bed room & kitchen -20W CFL Bath room -8W CFL |
 Living & kitchen -5W LED Bed room & bath room-10W LED |
| LS 16 |
 Living & bed room -13W CFL Kitchen -20W CFL Bath room-10W CFL |
 Living -5W LED Bed room -8W LED Kitchen -10W CFL Bath room-3W LED |
| LS17 |
 Living & kitchen -15W LED Bed -20W LED Bath room-10W LED |
 Living, 5. W LED Bath room – 8W LED |
| LS 18 |
 Livning-20W CFL Bed – 15W CFL Bath room – 8W CFL |
 Living, bed room – 5W LED Bath room – 8W LED |
|
LS 19 |
 Living & Bed room – 13W LED Bath room- 10 LED |
 Living & bed room- 5W LED Bath room -8W LED |
| LS20 |
 Living & Kitchen – 10W CFL Bed room -12W CFL Bath room – 13 W CFL |
 Living & kitchen – 8W LED Bed room – 7.5W LED |
Table 2.
Energy consumption comparison.
| Existing energy Consumption (kWh) | Energy Consumption after applying DIALux (kWh) | |
| Lighting Scene 1 | 10.06 | 8.81 |
| Lighting Scene 2 | 12.11 | 9.52 |
| Lighting Scene 3 | 12.09 | 9.93 |
| Lighting Scene 4 | 9.93 | 7.41 |
| Lighting Scene 5 | 10.74 | 8.54 |
| Lighting Scene 6 | 11.48 | 10 |
| Lighting Scene 7 | 10 | 7.45 |
| Lighting Scene 8 | 9.91 | 11.84 |
| Lighting Scene 9 | 9.89 | 7.61 |
| Lighting Scene 10 | 9.9 | 6.95 |
| Lighting Scene 11 | 9.72 | 8.54 |
| Lighting Scene 12 | 10 | 8.21 |
| Lighting Scene 13 | 10.776 | 8.92 |
| Lighting Scene 14 | 9.81 | 8.28 |
| Lighting Scene 15 | 9.72 | 9.62 |
| Lighting Scene 16 | 9.71 | 8.92 |
| Lighting Scene 17 | 9.72 | 7.21 |
| Lighting Scene 18 | 9.55 | 9.82 |
| Lighting Scene 19 | 10.2 | 8.1 |
| Lighting Scene 20 | 10.34 | 9.12 |
Table 3.
Statistical analysis of energy consumption for manual and DIALux-based designs.
| Data Sample | Mean | Variance | Standard deviation |
| Calculated existing energy consumption | 10.25428 | 0.55338 | 0.743867 |
| Calculated DIALux simulated consumption | 8.68047 | 1.33819 | 1.1568037 |
Table 6.
Statistical summary of illuminance levels.
| Sample | Mean | Variance | Standard Deviation |
| Existing design | 94.357 | 367.726 | 19.176 |
| Proposed design | 116.930 | 509.21 | 22.566 |
Table 7.
Statistical summary of luminous efficiency.
| Sample | Living | Kitchen | Bed room | Bathroom | ||||
| Manual | DIALux | Manual | DIALux | Manual | DIALux | Manual | DIALux | |
| Mean | 57.2 | 98.25 | 58.25 | 98.25 | 65.65 | 99.5 | 64.55 | 105.35 |
| Variance | 863.010 | 554.09 | 355.25 | 1225.25 | 495.292 | 549.527 | 436.365 | 465.187 |
| Std Dev. | 29.377 | 23.539 | 18.848 | 35.004 | 22.255 | 23.445 | 20.889 | 21.568 |
Table 8.
Statistical summary of luminous efficiency.
| Area | t-test | p-value |
| Living | 4.8767 | 0.000010 |
| Kitchen | 4.4996 | 0.000031 |
| Bed room | 4.6835 | 0.000018 |
| Bathroom | 6.0769 | 0.000001 |
Disclaimer/Publisher’s Note: The statements, opinions and data contained in all publications are solely those of the individual author(s) and contributor(s) and not of MDPI and/or the editor(s). MDPI and/or the editor(s) disclaim responsibility for any injury to people or property resulting from any ideas, methods, instructions or products referred to in the content. |
© 2025 by the authors. Licensee MDPI, Basel, Switzerland. This article is an open access article distributed under the terms and conditions of the Creative Commons Attribution (CC BY) license (http://creativecommons.org/licenses/by/4.0/).
Copyright: This open access article is published under a Creative Commons CC BY 4.0 license, which permit the free download, distribution, and reuse, provided that the author and preprint are cited in any reuse.


