
Submitted:
02 December 2025
Posted:
05 December 2025
You are already at the latest version
Abstract
This study investigates the influence of array height, irradiance, and wind speed on temperature difference and thermal gradients in photovoltaic (PV) arrays operating in hot, arid conditions. A field experiment was conducted in Mesa, Arizona (latitude 33° N), using two fixed-tilt PV module arrays installed at different elevations—one at 1 m and the other at 2 m above ground level. Each array comprised seven monocrystalline PV modules arranged in a single row with an 18° tilt angle optimized for summer performance. Data were collected between June and September 2025 and the analysis was restricted to 10:00–13:00 h to avoid shading and ensure uniform irradiance exposure on both arrays. Measurements included module backsheet temperatures at the center and edge modules, ambient temperature, plane-of-array (POA) irradiance, and wind speed. By maintaining identical orientation, tilt, and exposure conditions, the evaluation isolated the effect of height on module operating temperature and intra-array thermal gradients. Results indicate that the 2 m array consistently operated 1–3°C cooler than the 1 m array, confirming the positive impact of elevation on convective cooling. This reduction corresponds to a 0.4–0.9 % improvement in module efficiency or power based on standard temperature coefficients of crystalline silicon modules. The 1 m array exhibited a mean edge–center temperature gradience of −1.54°C, while the 2 m array showed −2.47°C, indicating stronger edge cooling in the elevated configuration. The 1 m array displayed a broader temperature range (−7 °C to +3°C) compared to the 2 m array (−5°C to +2°C), reflecting greater variability and weaker convective uniformity near ground level. The temperature gradience became more negative as irradiance increased, signifying intensified edge cooling under higher solar loading. Conversely, wind speed inversely affected ΔT, mitigating thermal gradients at higher airflow velocities. Overall, elevating PV arrays enhances convective heat transfer, reduces module temperature, and improves reliability and power output. These findings highlight the importance of array height, array length, irradiance, and wind conditions in optimizing PV system thermal and electrical performance.
Keywords:
photovoltaic (PV) systems
; module temperature
; array height
; thermal gradients
; convective cooling
; heat transfer
; arid climate
1. Introduction
The operating temperature of photovoltaic (PV) modules is one of the most influential factors affecting system efficiency, energy yield, and long-term reliability. While the electrical design of a PV system determines its output potential, the thermal environment defines how closely that potential can be achieved in the field. Among the many site-specific parameters governing PV module temperature, array height and array length play particularly critical roles, as they directly influence convective heat exchange between the modules and surrounding air. Understanding the thermal impact of array geometry is therefore essential for modern PV array and plant design, especially in hot and low-wind climates where cooling is predominantly governed by natural convection. Array height determines the extent of air circulation beneath and around modules; higher elevations promote stronger airflow and turbulence, which enhance convective heat removal, reduce operating temperature, and improve conversion efficiency. Conversely, low-mounted systems—such as those installed close to the ground on short supports—experience reduced ventilation, higher heat retention, and larger thermal gradients. These differences not only affect instantaneous efficiency but also contribute to accelerated material aging, potential-induced degradation (PID), and other temperature-related performance losses. A clear understanding of array height- and spacing-dependent cooling mechanisms enables system designers to optimize racking structures, ground clearance, and row spacing for improved power performance and long-term durability [1-5].
In parallel, the influence of array length has become increasingly relevant as PV system voltages continue to rise. As photovoltaic architectures evolve from traditional 600 V legacy strings to today’s 1,500 V commercial standards—and toward 2,000 V future configurations—the number of modules per string has increased substantially [6-8]. These extended strings form longer continuous arrays, which inherently restrict airflow through central sections and elevate internal thermal coupling between adjacent modules. The result is a higher effective thermal mass and reduced convective exchange, especially in glass/glass PV modules that already possess lower heat dissipation rates. Under low-wind or stagnant air conditions, these factors cause persistent temperature gradients between the center and edge modules, where edge regions benefit from lateral cooling while the inner modules retain heat for longer durations. Such non-uniform thermal profiles can exacerbate mismatch losses, accelerate thermomechanical stress, and amplify degradation rates over time. As system voltages and array lengths continue to grow, quantifying and mitigating these intra-array temperature gradients has become an important step toward thermally robust PV plant design.
In our previous work, long-term thermal mapping of PV modules and plants revealed significant temperature non-uniformities both within modules and across arrays. Center cells within a module typically operated at higher temperatures than edge cells, while centrally located arrays within a PV plant tended to run hotter than edge or corner arrays [9]. Building on these findings, the present study examines temperature variations between arrays of different mounting heights and evaluates the temperature gradients between center and edge modules within each array. The study focuses on how irradiance, wind speed, array height, and array length jointly influence module temperature distributions and their resulting impact on performance. The field experiment was conducted under actual desert conditions in Mesa, Arizona, providing high-fidelity data for hot-climate PV operation. This work isolates the geometric and aerodynamic effects of array configuration using identical modules, orientation, and operating conditions by systematically quantifying height- and length-induced temperature differences.
2. Methodology
2.1. Experimental Setup
The field experiment was conducted in Mesa, Arizona (latitude 33° N), where two fixed-tilt photovoltaic (PV) module arrays were installed at different heights — one at 1 m and the other at 2 m above ground level (Figure 1). Each array consisted of seven monocrystalline PV modules arranged in a single row, with an 18° tilt angle optimized for summer production and thermal evaluation. The longitudinal (north–south) separation between the two arrays was maintained at 0.2 m to ensure identical irradiance exposure while minimizing mutual shading. The site was selected to ensure unobstructed sunlight throughout the day during the four-month test period.
The experiments were conducted from June 2025 through September 2025, capturing the summer operating conditions most representative of high-temperature PV performance in hot, arid climates. To measure the thermal distribution on the back surface of the PV modules, type-K thermocouples were securely attached to the center of the middle module and the center of an edge module in each array (Figure 1). This configuration allowed for simultaneous monitoring of both inter-array (1 m vs 2 m) temperature differences and intra-array (edge–center) temperature gradients under identical environmental conditions.
2.2. Instrumentation and Data Acquisition
Incident solar irradiance on the array plane was measured using a plane-of-array (POA) irradiance sensor. Wind speed and ambient temperature were recorded using meteorological sensors positioned near the arrays. All instruments were connected to a data acquisition (DAQ) system programmed to record data at 1- or 2-minute intervals, depending on the parameter. The following parameters were continuously monitored and stored with time stamps: backsheet temperature, ambient temperature, wind speed, POA irradiance.
The performance and thermal characteristics of the modules used in this study are provided in Table 1.
Nominal Operating Cell Temperature (NOCT) is defined in IEC 61215:2005 as the equilibrium temperature reached by a photovoltaic (PV) module operating under open-circuit conditions when exposed to a total irradiance of 800 W/m², an ambient air temperature of 20 °C, and a wind speed of 1 m/s, with the rear surface freely ventilated [10]. The experimental setup specified in the standard requires that the test modules be surrounded by non-operating (dummy) modules to replicate the thermal environment of a real PV array and minimize edge-cooling effects. Temperature sensors are affixed to the back of representative cells, and measurements taken over several weeks are extensively processed to obtain the eventual NOCT value. The NOCT test characterizes the module’s thermal behavior under standardized, yet realistic, field conditions and provides a reference for estimating operating temperatures in system performance models. The manufacturer-reported NOCT value of 46 °C aligns closely with the average NOCT of approximately 46 °C reported for glass/backsheet photovoltaic modules in the California Energy Commission (CEC) equipment open-source database listing about 20,000 modules [11]. This consistency indicates that the tested modules exhibit typical thermal behavior for conventional crystalline silicon glass/backsheet constructions, supporting the representativeness of this module for use in thermal analyses of the industry.
2.3. Data Filtering and Analysis
To ensure data quality and avoid shading effects from nearby structures or between the two arrays, only the data collected between 10:00 h and 13:00 h were used for analysis. This time window corresponds to near-solar-noon conditions when the sun’s position minimizes the risk of shading on the 1 m array caused by the adjacent 2 m array’s edge. Raw data were screened to remove outliers resulting from sensor noise, cloud transients, or data gaps. The processed dataset was analyzed to evaluate both inter-array and intra-array thermal behavior, focusing on three main aspects:
- Temperature difference between arrays with different heights (see Section 3.1): The difference in module backsheet temperature between the 1 m and 2 m arrays was statistically evaluated as a function of irradiance, wind speed, month, and time of day.
- Temperature gradience within each array (see Section 3.2: The edge–center temperature gradient (ΔTedge-center) was computed and statistically analyzed for both arrays to assess spatial temperature variation and compare gradient magnitudes.
- Combined effects of weather parameters (see Section 3.3): A summary on the combined effects of irradiance, wind speed, and ambient temperature on the inter-array and intra-array ΔT values is provided.
3. Results and Discussion
3.1. Temperature Difference Between 1 m and 2 m PV Arrays
3.1.1. Results
This section examines the thermal behavior of photovoltaic (PV) arrays installed at two different heights—1 m and 2 m above ground level, based on time-series and statistical analyses of module temperature differences. The two plots presented below—a smoothed ΔT time series (Figure 2) and a histogram of temperature differences (Figure 3), provide complementary insights into the cooling effects of array elevation on module performance and temperature uniformity. The temperature difference (ΔT) is defined as the mean module temperature at 2 m minus that at 1 m; thus, negative values indicate that the 2 m array operates at lower temperatures. Both datasets cover the summer season (June–October), when solar irradiance and ambient temperatures are highest, and convective cooling plays a significant role in module thermal behavior.
Temporal Evolution and Seasonal Behavior: The smoothed ΔT versus time plot shown in Figure 2 includes a ±1σ confidence band to represent short-term variability. This time-series plot illustrates the seasonal variation in ΔT. Throughout most of the period, ΔT remains negative, confirming that the 2 m array consistently operates cooler than the 1 m array. The fluctuations reflect changes in irradiance, wind speed, and ambient temperature. Peaks in ΔT magnitude occur during high irradiance periods (late June, mid-August, late September), when the difference in convective heat transfer between the two configurations becomes most evident.
Statistical Characteristics and Distribution of ΔT: The histogram of ΔT shown in Figure 3 provides a quantitative trend on the ΔT distribution. The mean ΔT is −1.71 °C and the mode is −2.10 °C, indicating that most temperature differences cluster between −3 °C and −1 °C. This distribution is slightly right-skewed, suggesting that occasional low-wind or cloudy periods produce smaller temperature differences. Nevertheless, the consistent negative mean demonstrates that the 2 m configuration maintains a cooler operating condition across all environmental variations.
3.1.2. Discussion
The cooler operation of the 2 m array is primarily attributed to enhanced natural convection and air turbulence. At 2 m height, air circulation beneath and around the modules is more effective, reducing the boundary layer thickness and increasing the convective heat transfer coefficient. In contrast, the 1 m array experiences limited airflow and partial stagnation within the ground boundary layer, leading to reduced heat dissipation and higher overall module temperatures. This aligns with theoretical expectations from convective heat-transfer models, where the Nusselt number increases with both wind speed and free-air exposure. From a performance standpoint, cooler operation at 2 m translates into improved electrical efficiency. For crystalline silicon PV modules, every 1 °C decrease in operating temperature typically increases conversion efficiency by about 0.36–0.45 %. Thus, a consistent 1–2 °C reduction in temperature yields roughly a 0.4–0.9 % gain in power output. Lower operating temperatures also reduce thermomechanical stress and material degradation over time, especially solder bond degradation and encapsulant browning [12-15]. The 1 m configuration, while more compact and cost-efficient structurally, sacrifices some performance and thermal efficiency due to constrained airflow.
3.2. Temperature Gradience Between Edge and Center Modules
3.2.1. Results
The following discussion analyzes the (Edge–Center) ΔT distributions for the 1 m and 2 m height photovoltaic (PV) arrays. Each histogram shown in Figure 4 and Figure 5 represents the temperature difference between the module edge and its center, with negative values indicating that the edges are cooler due to convective air movement. The plots include overlaid kernel density estimate (KDE) curves, mean (black dashed line), and mode (red dotted line) indicators to illustrate key trends in the thermal distribution.
The 1 m array shown in Figure 4 exhibits a mean ΔT of −1.54 °C and a mode of −0.26 °C, while the 2 m array shown in Figure 5 indicates a mean of −2.47 °C and a mode of −3.22 °C. These differences reveal that modules elevated to 2 m experience stronger convective cooling at the edges due to enhanced airflow. In contrast, the 1 m array, being closer to the ground, encounters restricted airflow, resulting in reduced edge cooling and warmer overall module temperatures. The 1 m array’s distribution spans approximately −7 °C to +3 °C, indicating greater variability and a broader spread. This suggests less stable thermal behavior influenced by fluctuating ground-level airflow and boundary-layer effects. The 2 m array’s narrower range, centered between −5 °C and +2 °C, implies more consistent convective cooling. The mean–mode differences (−1.27 °C for 1 m and +0.75 °C for 2 m) indicate skewness: the 1 m array leans toward smaller gradients, while the 2 m array exhibits more strongly negative ΔT values, confirming improved cooling efficiency. Since the degradation rates of most PV module failure mechanisms increase exponentially with temperature, the center modules in a series-connected string—being the hottest—are expected to determine the end-of-life of the entire string.
3.2.2. Discussion
Figure 6 and Figure 7 show that the (Edge–Center) ΔT generally becomes more negative with increasing irradiance, indicating that the panel edges tend to cool more effectively than the center under higher thermal loading. Across most irradiance bins, ΔT remains slightly below zero, reflecting preferential convective heat removal at the boundaries where airflow is less restricted. The variability in ΔT widens at higher irradiance levels, suggesting that localized cooling effectiveness becomes increasingly sensitive to moment-to-moment wind conditions as the modules heat up. The accompanying wind-speed trends highlight that sharper decreases in ΔT often coincide with periods of enhanced air movement, reinforcing that (Edge–Center) temperature differences are strongly governed by the interplay between irradiance-driven heating and wind-driven convective cooling.
3.3. Combined Parameter Influence - Summary
Temperature difference between two array heights: The 2 m array consistently exhibits more negative mean ΔT values than the 1 m array, confirming stronger convective cooling at greater elevation. At 2 m, air circulation beneath and around the modules is less obstructed by ground interference, promoting higher convective heat transfer. Conversely, the 1 m array operates closer to the ground boundary layer, where airflow stagnation reduces convective efficiency. At high irradiance levels (900–1100 W/m²), the mean ΔT of the 2 m array is approximately 1 °C more negative than that of the 1 m configuration, underscoring the benefit of increased elevation for thermal management.
Temperature gradience between modules within an array: Both 1 m and 2 m arrays with identical array length display increasingly negative ΔT values with rising irradiance, particularly beyond 500 W/m². This trend reflects the greater edge–center thermal contrast as solar heating intensifies. Under higher irradiance, module centers retain heat more efficiently due to limited exposure to airflow, while the edges, being more exposed, dissipate heat faster through convection. At irradiance levels above 800 W/m², broader ΔT distributions emerge, indicating increased variability caused by increased array length, fluctuations in ambient airflow and wind turbulence.
Combined influence of weather parameters: Wind speed serves as a crucial moderating factor. At low irradiance (< 400 W/m²), higher wind speeds coincide with smaller ΔT magnitudes, as stronger convection minimizes temperature gradients across the module surface. As wind speed increases, the ΔT magnitude tends to decrease. This inverse relationship shows that wind promotes thermal uniformity and counteracts radiative heating. In both arrays, when wind speeds drop below approximately 2 m/s, the ΔT magnitude increases sharply—most notably within the 800–900 W/m² range, where radiative effects dominate. The combined effects of irradiance and wind speed can be interpreted through convective and radiative heat transfer mechanisms. Higher irradiance increases absorbed solar energy, raising module temperature and enhancing buoyancy-driven flow. The 2 m array benefits from higher Reynolds number (higher turbulent flow) and Nusselt number (higher convective heat transfer) due to stronger air motion, yielding greater convective efficiency. By contrast, the 1 m array resides within the near-ground boundary layer, where reduced turbulence limits heat exchange. These physical mechanisms collectively explain the observed differences in ΔT and reinforce the importance of module height in promoting convective cooling.
4. Conclusions
The results presented in this study show that the 2 m array consistently operated 1–3 °C cooler than the 1 m array, confirming the beneficial influence of elevation on convective heat dissipation. The increased mounting height allowed for greater air circulation and turbulence beneath and around the modules, enhancing convective heat removal. This cooling effect translates into measurable gains in performance and long-term reliability for photovoltaic (PV) systems.
Intra-array temperature analysis revealed distinct temperature gradients between the edge and center modules, demonstrating the role of localized convection in shaping module temperature profiles. The 1 m array exhibited a mean edge–center temperature gradient of −1.54 °C, while the 2 m array showed −2.47 °C, indicating stronger edge cooling in the elevated configuration due to improved airflow exposure. Because the center modules in a series-connected string typically operate at higher temperatures, they are more susceptible to accelerated degradation and are therefore expected to dictate the end-of-life of the entire string.
The study also examined the combined effects of irradiance and wind speed on temperature gradients. The gradient became increasingly negative with higher irradiance, suggesting intensified edge cooling under stronger solar loading. Conversely, wind speed exhibited an inverse relationship with ΔT, as higher airflow velocities reduced temperature differentials by promoting convective uniformity across the module surface.
Overall, the findings highlight the importance of array height and array length as key design parameters for optimizing module cooling, improving thermal uniformity, and enhancing both energy yield and reliability in PV installations, particularly in hot and arid climates.
Author Contributions
Conceptualization, G.T.; Methodology, A.K. and G.T.; Software, S.T.; Formal analysis, G.T.; Investigation, A.K., N.K., S.T., S.B. and G.T.; Resources, G.T.; Data curation, A.K. and G.T.; Writing – original draft, A.K. and G.T.; Writing – review & editing, A.K., N.K., S.T., S.B. and G.T.; Visualization, G.T.; Supervision, G.T.; Project administration, G.T.; Funding acquisition, G.T.. All authors have read and agreed to the published version of the manuscript.
Funding
This research was funded by the Salt River Project (SRP). The funder was not involved in the study design, collection, analysis, interpretation of data, the writing of this article or the decision to submit it for publication.
Data Availability Statement
The original contributions presented in this study are included in the article. Further inquiries can be directed to the corresponding author.
Acknowledgments
The technical contributions and support provided by our ASU-PRL colleagues, including Arjun Aaraamudhan Seshathri, Anand Anil Kumar and Rishi Ravindra Dhavale, are sincerely appreciated.
Conflicts of Interest
The authors declare no conflict of interest.
References
- S.E. Smith, B. Viggiano, N. Ali, T.J. Silverman, M. Obligado, M. Calaf and R. B. Cal. Increased panel height enhances cooling for photovoltaic solar farms. Applied Energy, 323, 119819, 2022. [CrossRef]
- M. Prilliman, S. E. Smith, B. J. Stanislawski, J.M.F. Keith, T.J. Silverman, M. Calaf and R.B. Cal. Technoeconomic analysis of changing PV array convective cooling through changing array spacing. IEEE Journal of Photovoltaics, Vol 12, No.6, 2022. [CrossRef]
- B. Stanislawski, F. Margairaz, R.B. Cal and M. Calaf. Potential of module arrangements to enhance convective cooling in solar photovoltaic arrays. Renewable Energy, Volume 157, 2020. [CrossRef]
- W. Zhang, T. Gong, S. Ma, J. Zhou and Y. Zhao (2021), Study on the influence of mounting dimensions of PV array on module temperature in open-joint photovoltaic ventilated double-skin façades. Sustainability, 13(9), 5027. [CrossRef]
- Y. Wen, X. Li, W. Hu, F. Yang, K. Yang and J. Wang. Experimental research on the temperature distribution characteristics of photovoltaic array. Applied Thermal Engineering, 265, 125507, 2025. [CrossRef]
- IHS Markit, Higher Voltage Standards Help Reduce LCOE for PV Systems, IHS Markit White Paper, 2021 (https://cdn.ihsmarkit.com).
- PV Tech, “Breaking the 2,000 V PV System Threshold,” PV Tech, March 2025 (https://www.pv-tech.org/breaking-the-2000v-pv-system-threshold).
- B. Nelson, Driving Innovation Together: The Path to 2000 V Systems in Utility-Scale Renewable Energy Projects, ABB Technical Report, February 2025 (https://electrification.us.abb.com).
- A. Pavgi, J. Oh, J. Kuitche, S. Tatapudi and G. TamizhMani, “Thermal Uniformity Mapping of PV Modules and Plants,”, IEEE Photovoltaic Specialists Conference, 2017.
- IEC 61215:2005 — Crystalline silicon terrestrial photovoltaic (PV) modules – Design qualification and type approval, International Electrotechnical Commission, 2005.
- CEC, PV Module List - Full Data, California Energy Commission, (2025). https://www.energy.ca.gov/.
- A. Tummala, J. Oh, S. Tatapudi, and G. TamizhMani, “Degradation of solder bonds in field aged PV modules: correlation with series resistance increase,” Proc. 44th IEEE Photovoltaic Specialists Conference (PVSC), pp. 2912–2917, 2017.
- A. Sinha, V. S. P. Buddha, E. J. Schneller, K. O. Davis, and G. TamizhMani, “Solder bond degradation of fielded PV modules: climate dependence of intermetallic compound growth,” in Proc. 46th IEEE Photovoltaic Specialists Conference (PVSC), pp. 1393–1397, 2019.
- H. Gopalakrishna, A. Sinha, J. Carpenter, S. Niverty, N. Chawla, D. Jordan, G. Tamizhmani, “Activation Energy for End-of-Life Solder Bond Degradation: Thermal Cycling of Field-Aged PV Modules,” IEEE Journal of Photovoltaics, Vol. 10, 1762-1771, November 2020. [CrossRef]
- A. Sinha, H. Gopalakrishna, A.B. Subramaniyan, D. Jain, J. Oh, D. Jordan “Prediction of Climate-Specific Degradation Rate for Photovoltaic Encapsulant Discoloration,” IEEE Journal of Photovoltaics, Vol. 10, 1093 - 1101, July 2020. [CrossRef]
Figure 1.
PV array setup showing 1 m and 2 m module heights and geometric parameters.
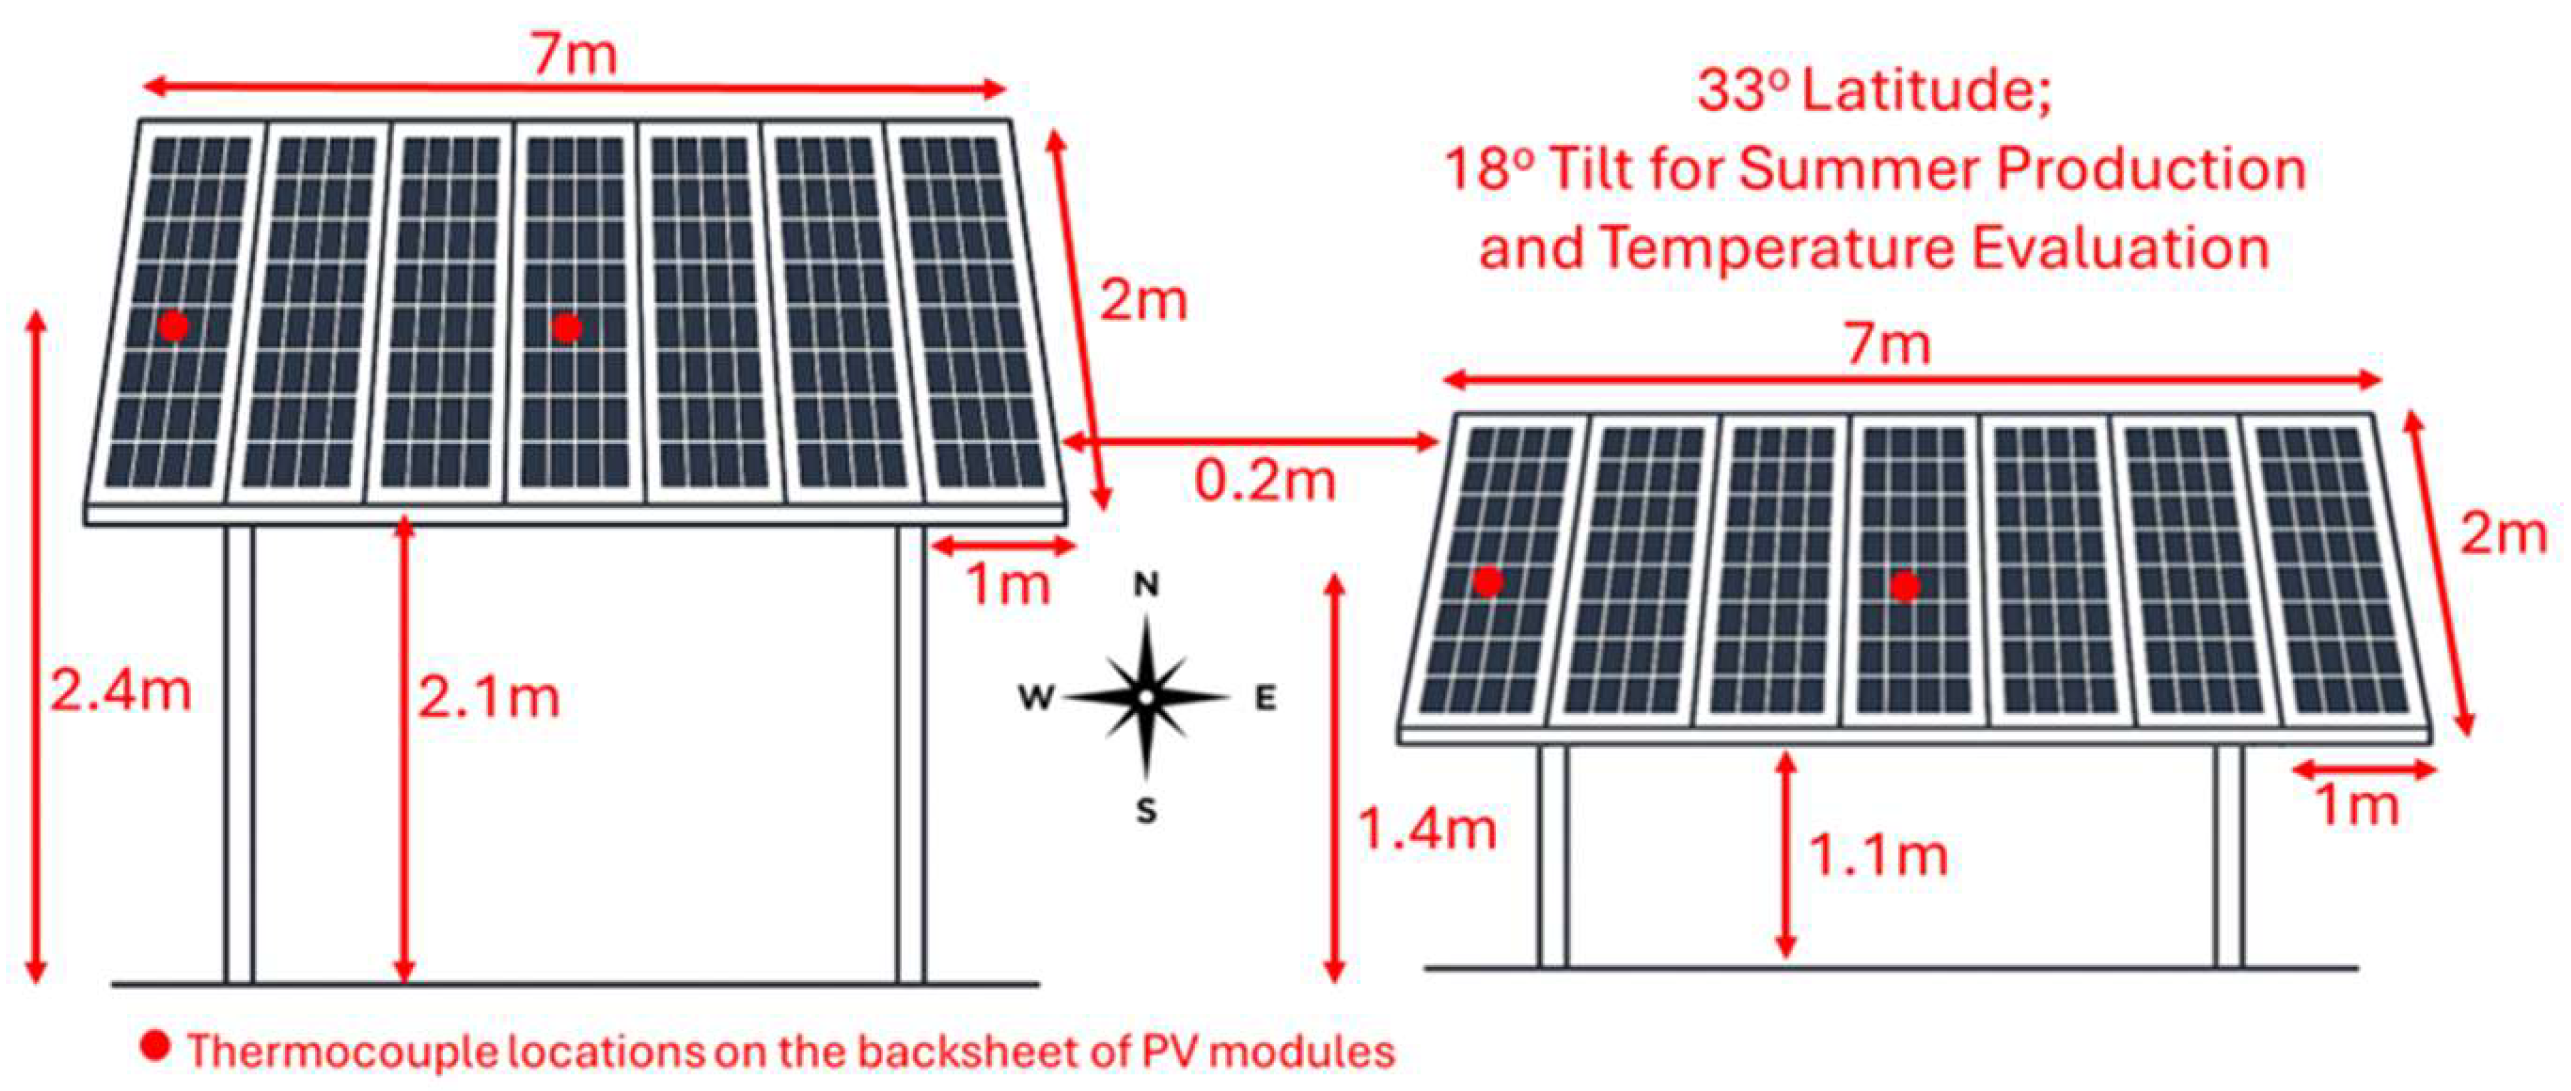
Figure 2.
Smoothed Temperature Difference (ΔT) with ±1σ Confidence Band. Negative values indicate cooler 2 m array operation.
Figure 2.
Smoothed Temperature Difference (ΔT) with ±1σ Confidence Band. Negative values indicate cooler 2 m array operation.
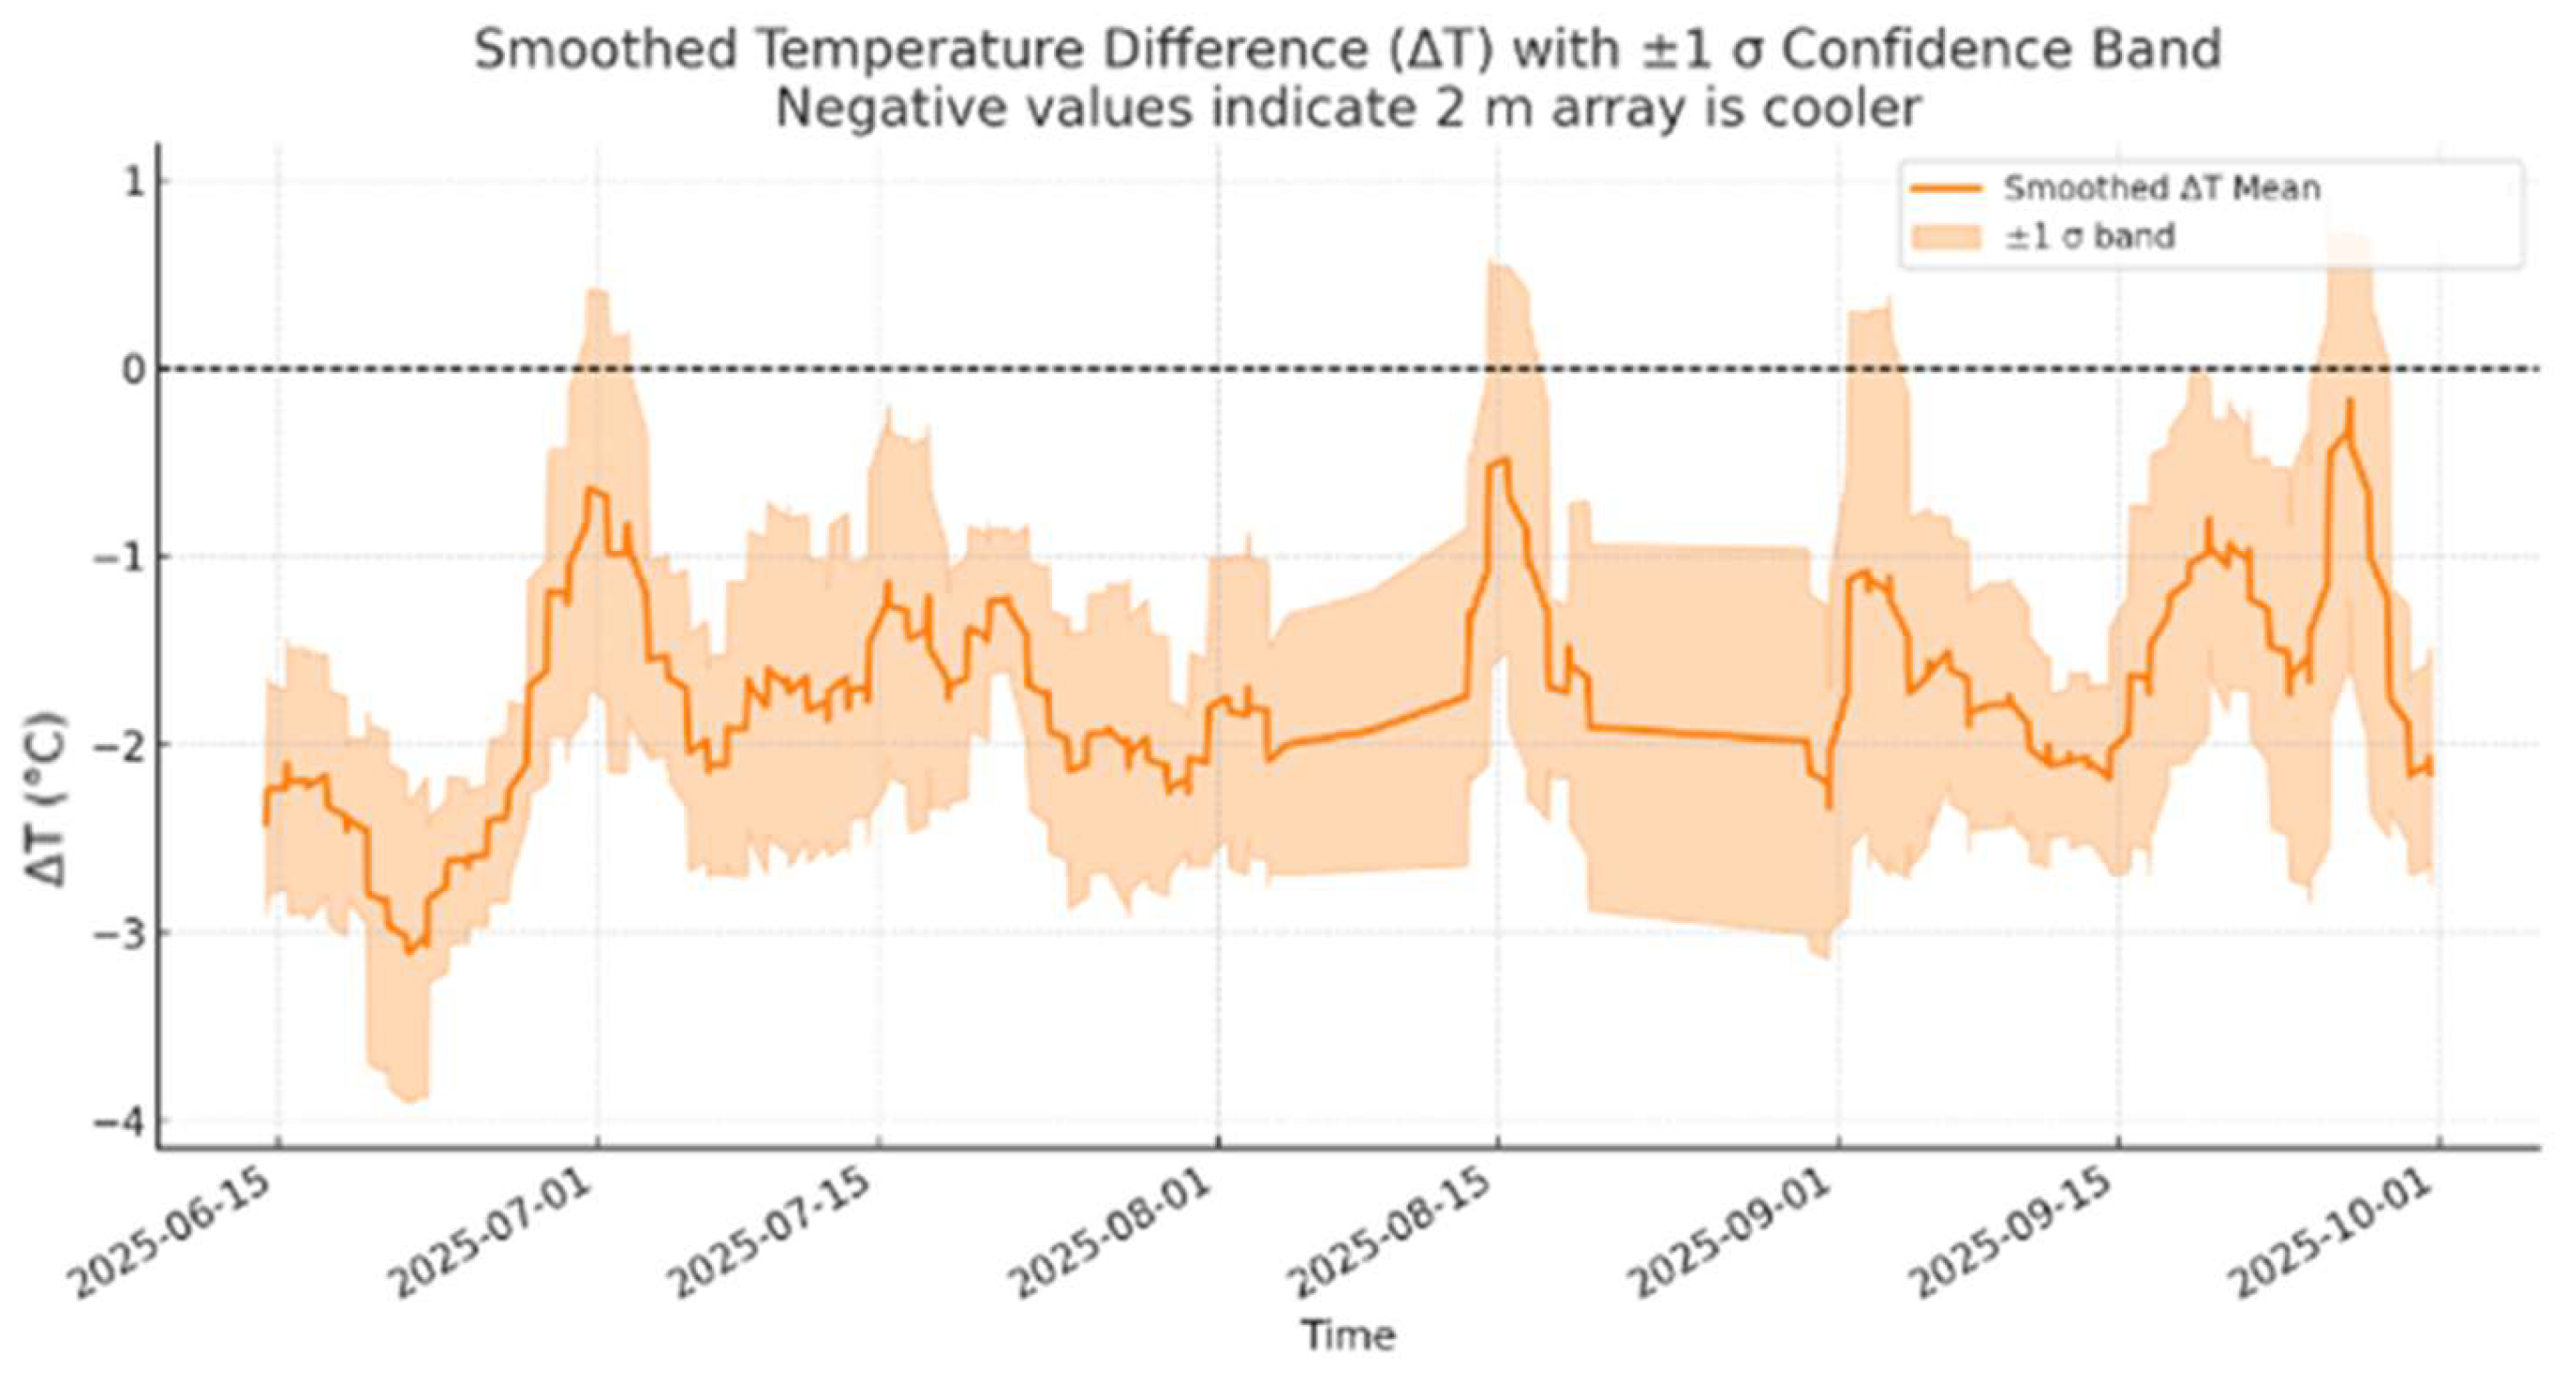
Figure 3.
Histogram of Temperature Difference (1 m − 2 m) with Mean and Mode Marked.
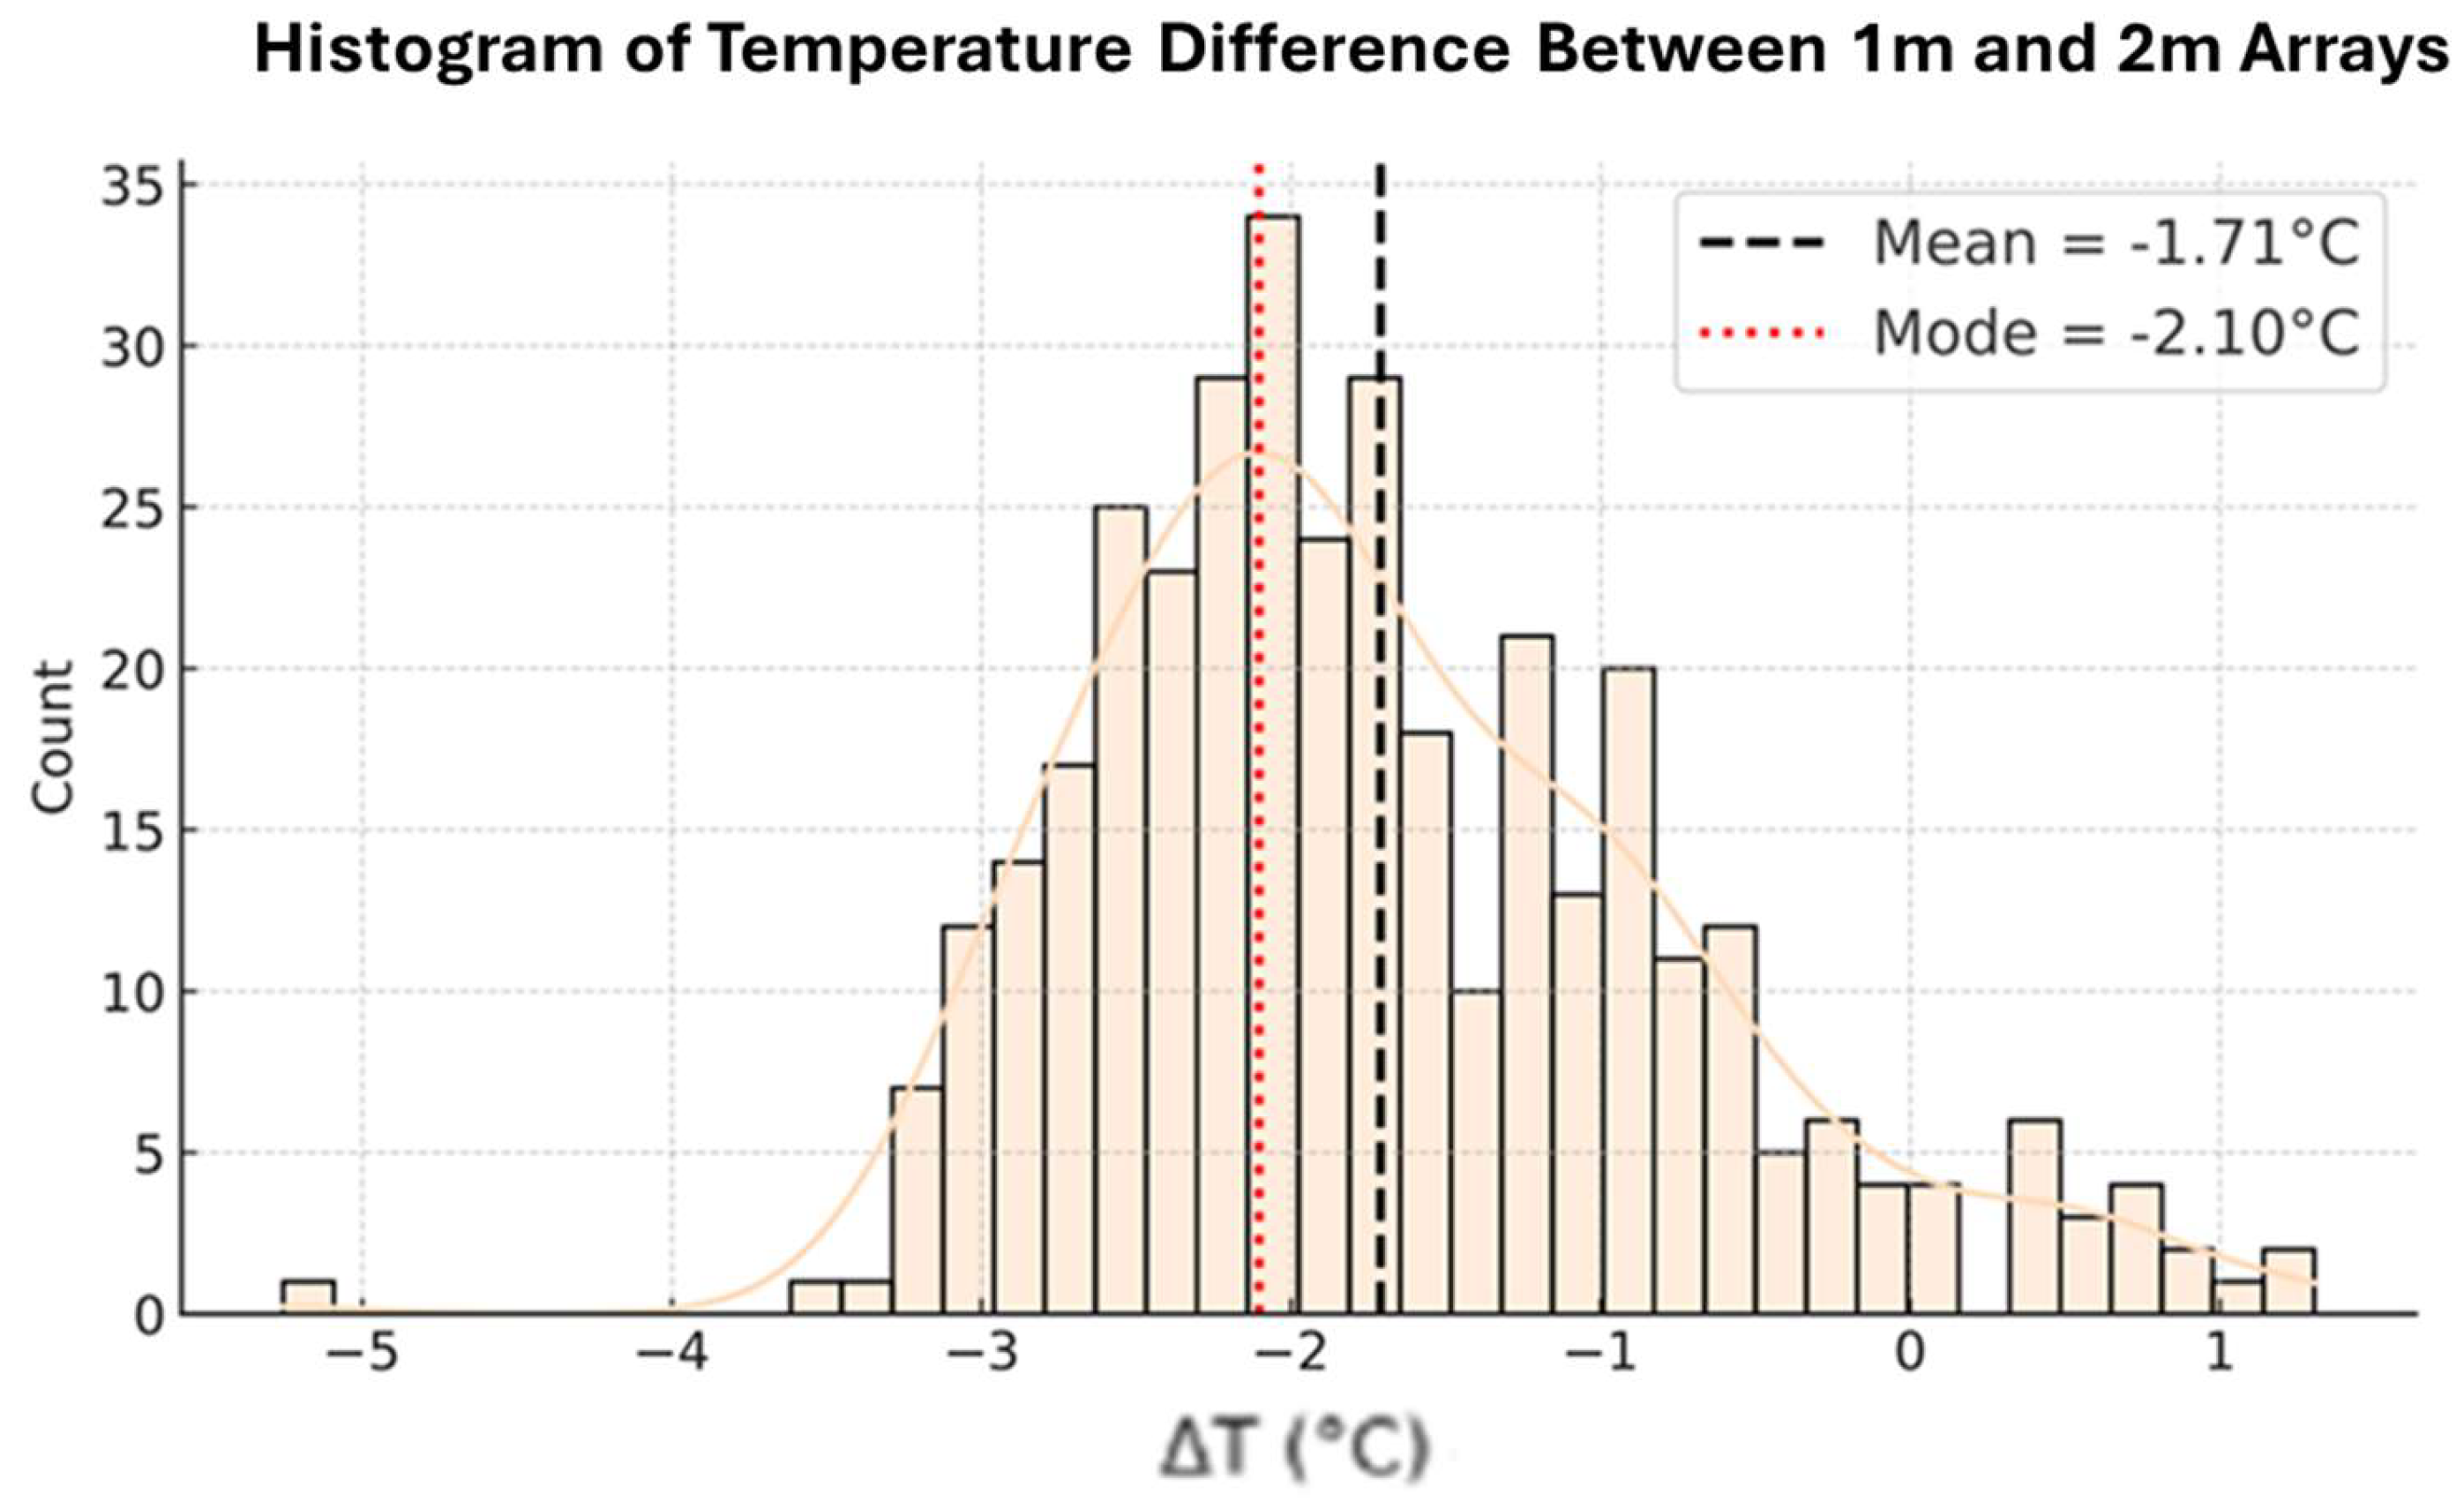
Figure 4.
Histogram of (Edge–Center) ΔT — 1 m Height Array.
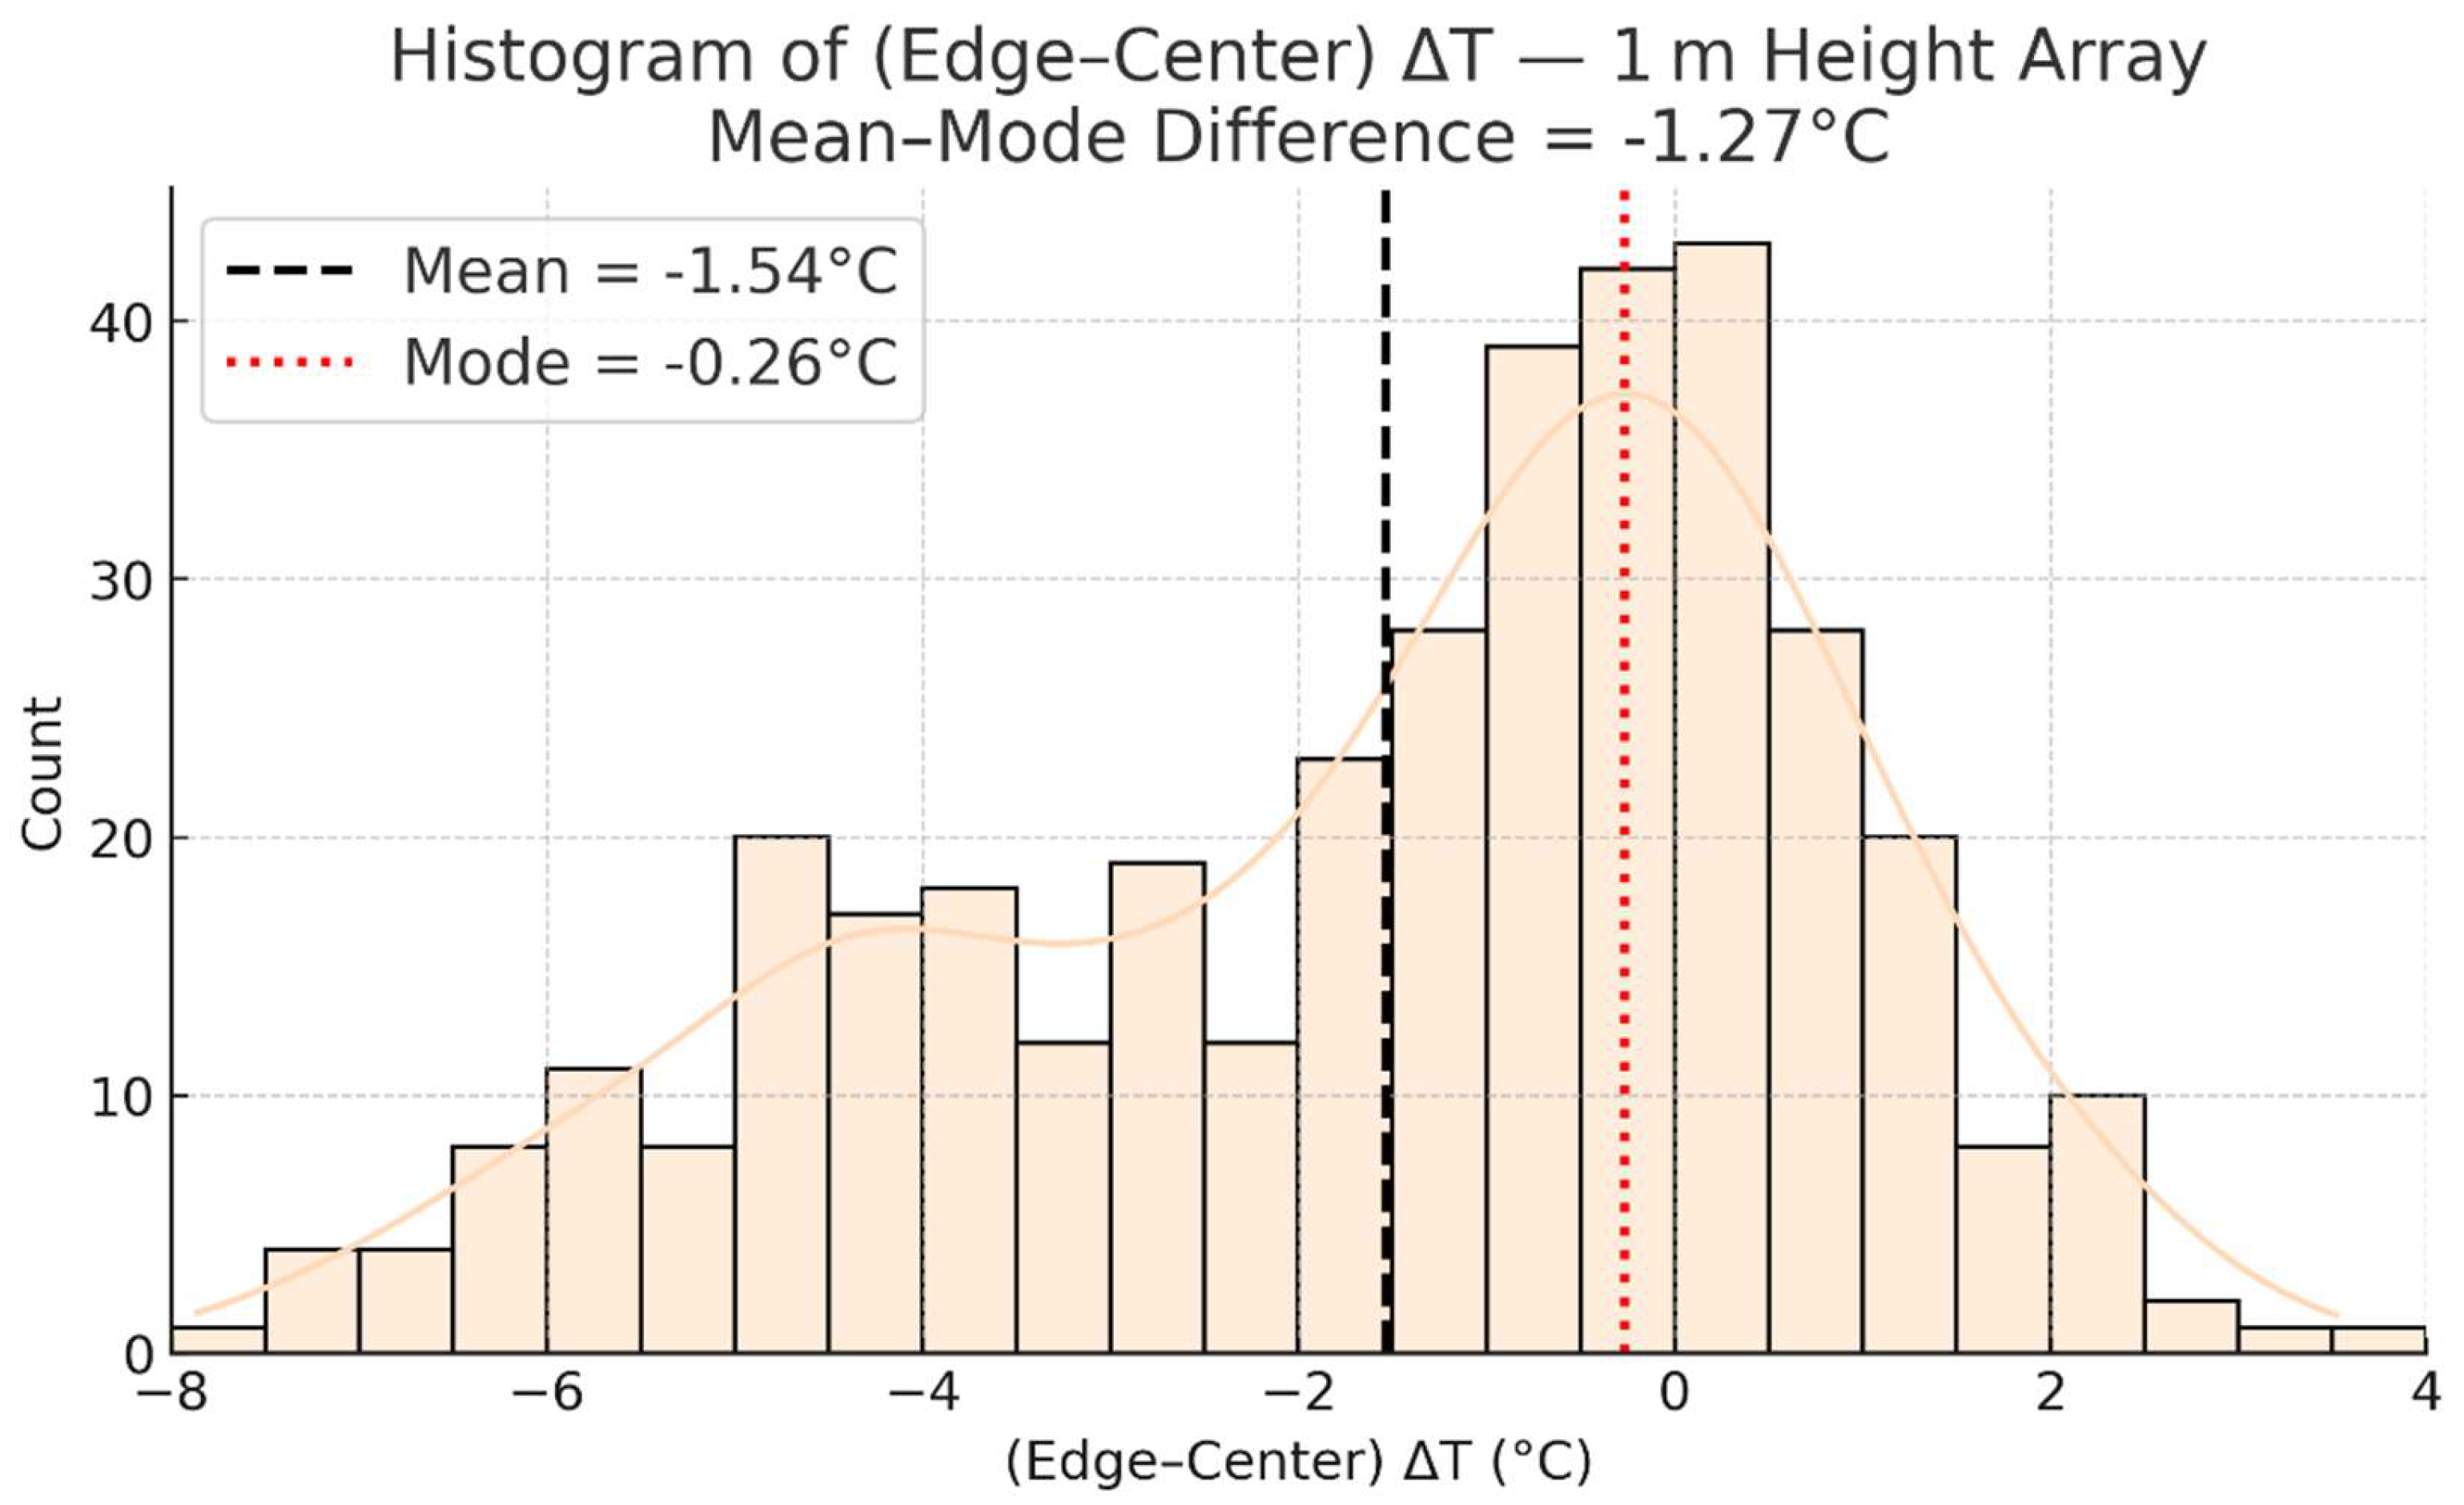
Figure 5.
Histogram of (Edge–Center) ΔT — 2 m Height Array.
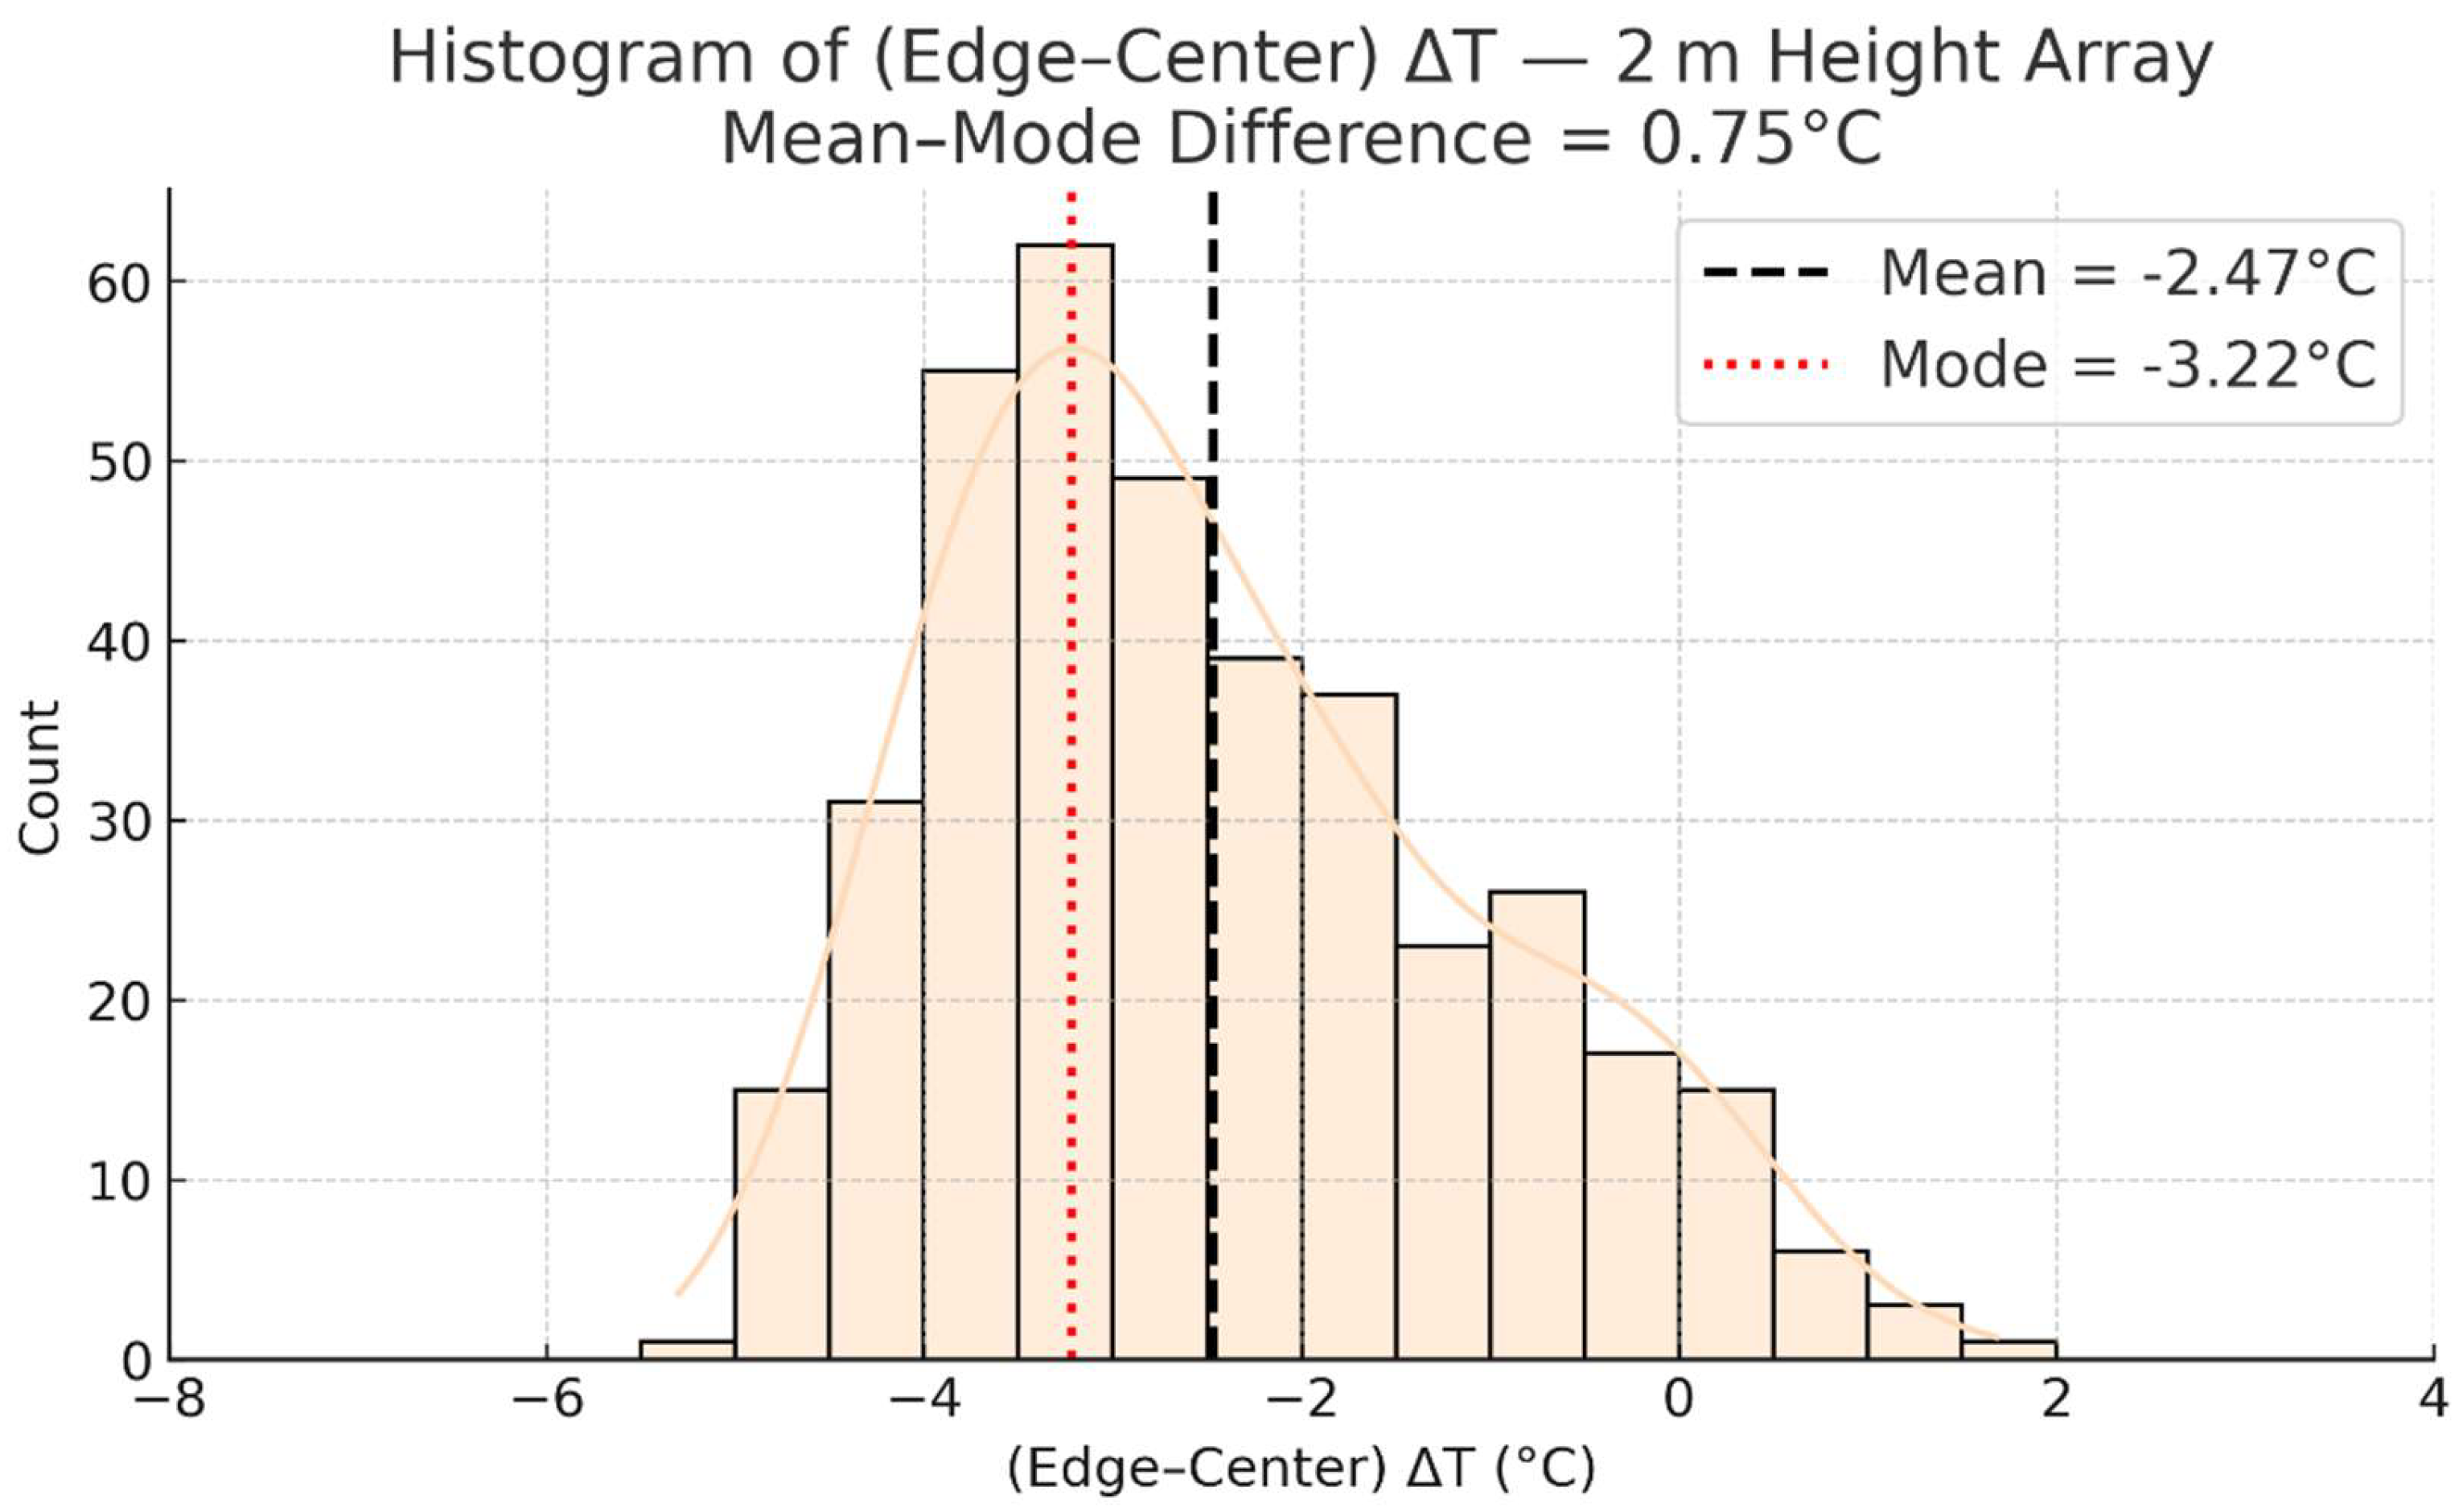
Figure 6.
(Edge–Center) ΔT vs Irradiance for 1 m Height Array. This plot includes irradiance bins of 100 W/m², mean ΔT (black dashed line), and mean wind speed (orange line).
Figure 6.
(Edge–Center) ΔT vs Irradiance for 1 m Height Array. This plot includes irradiance bins of 100 W/m², mean ΔT (black dashed line), and mean wind speed (orange line).
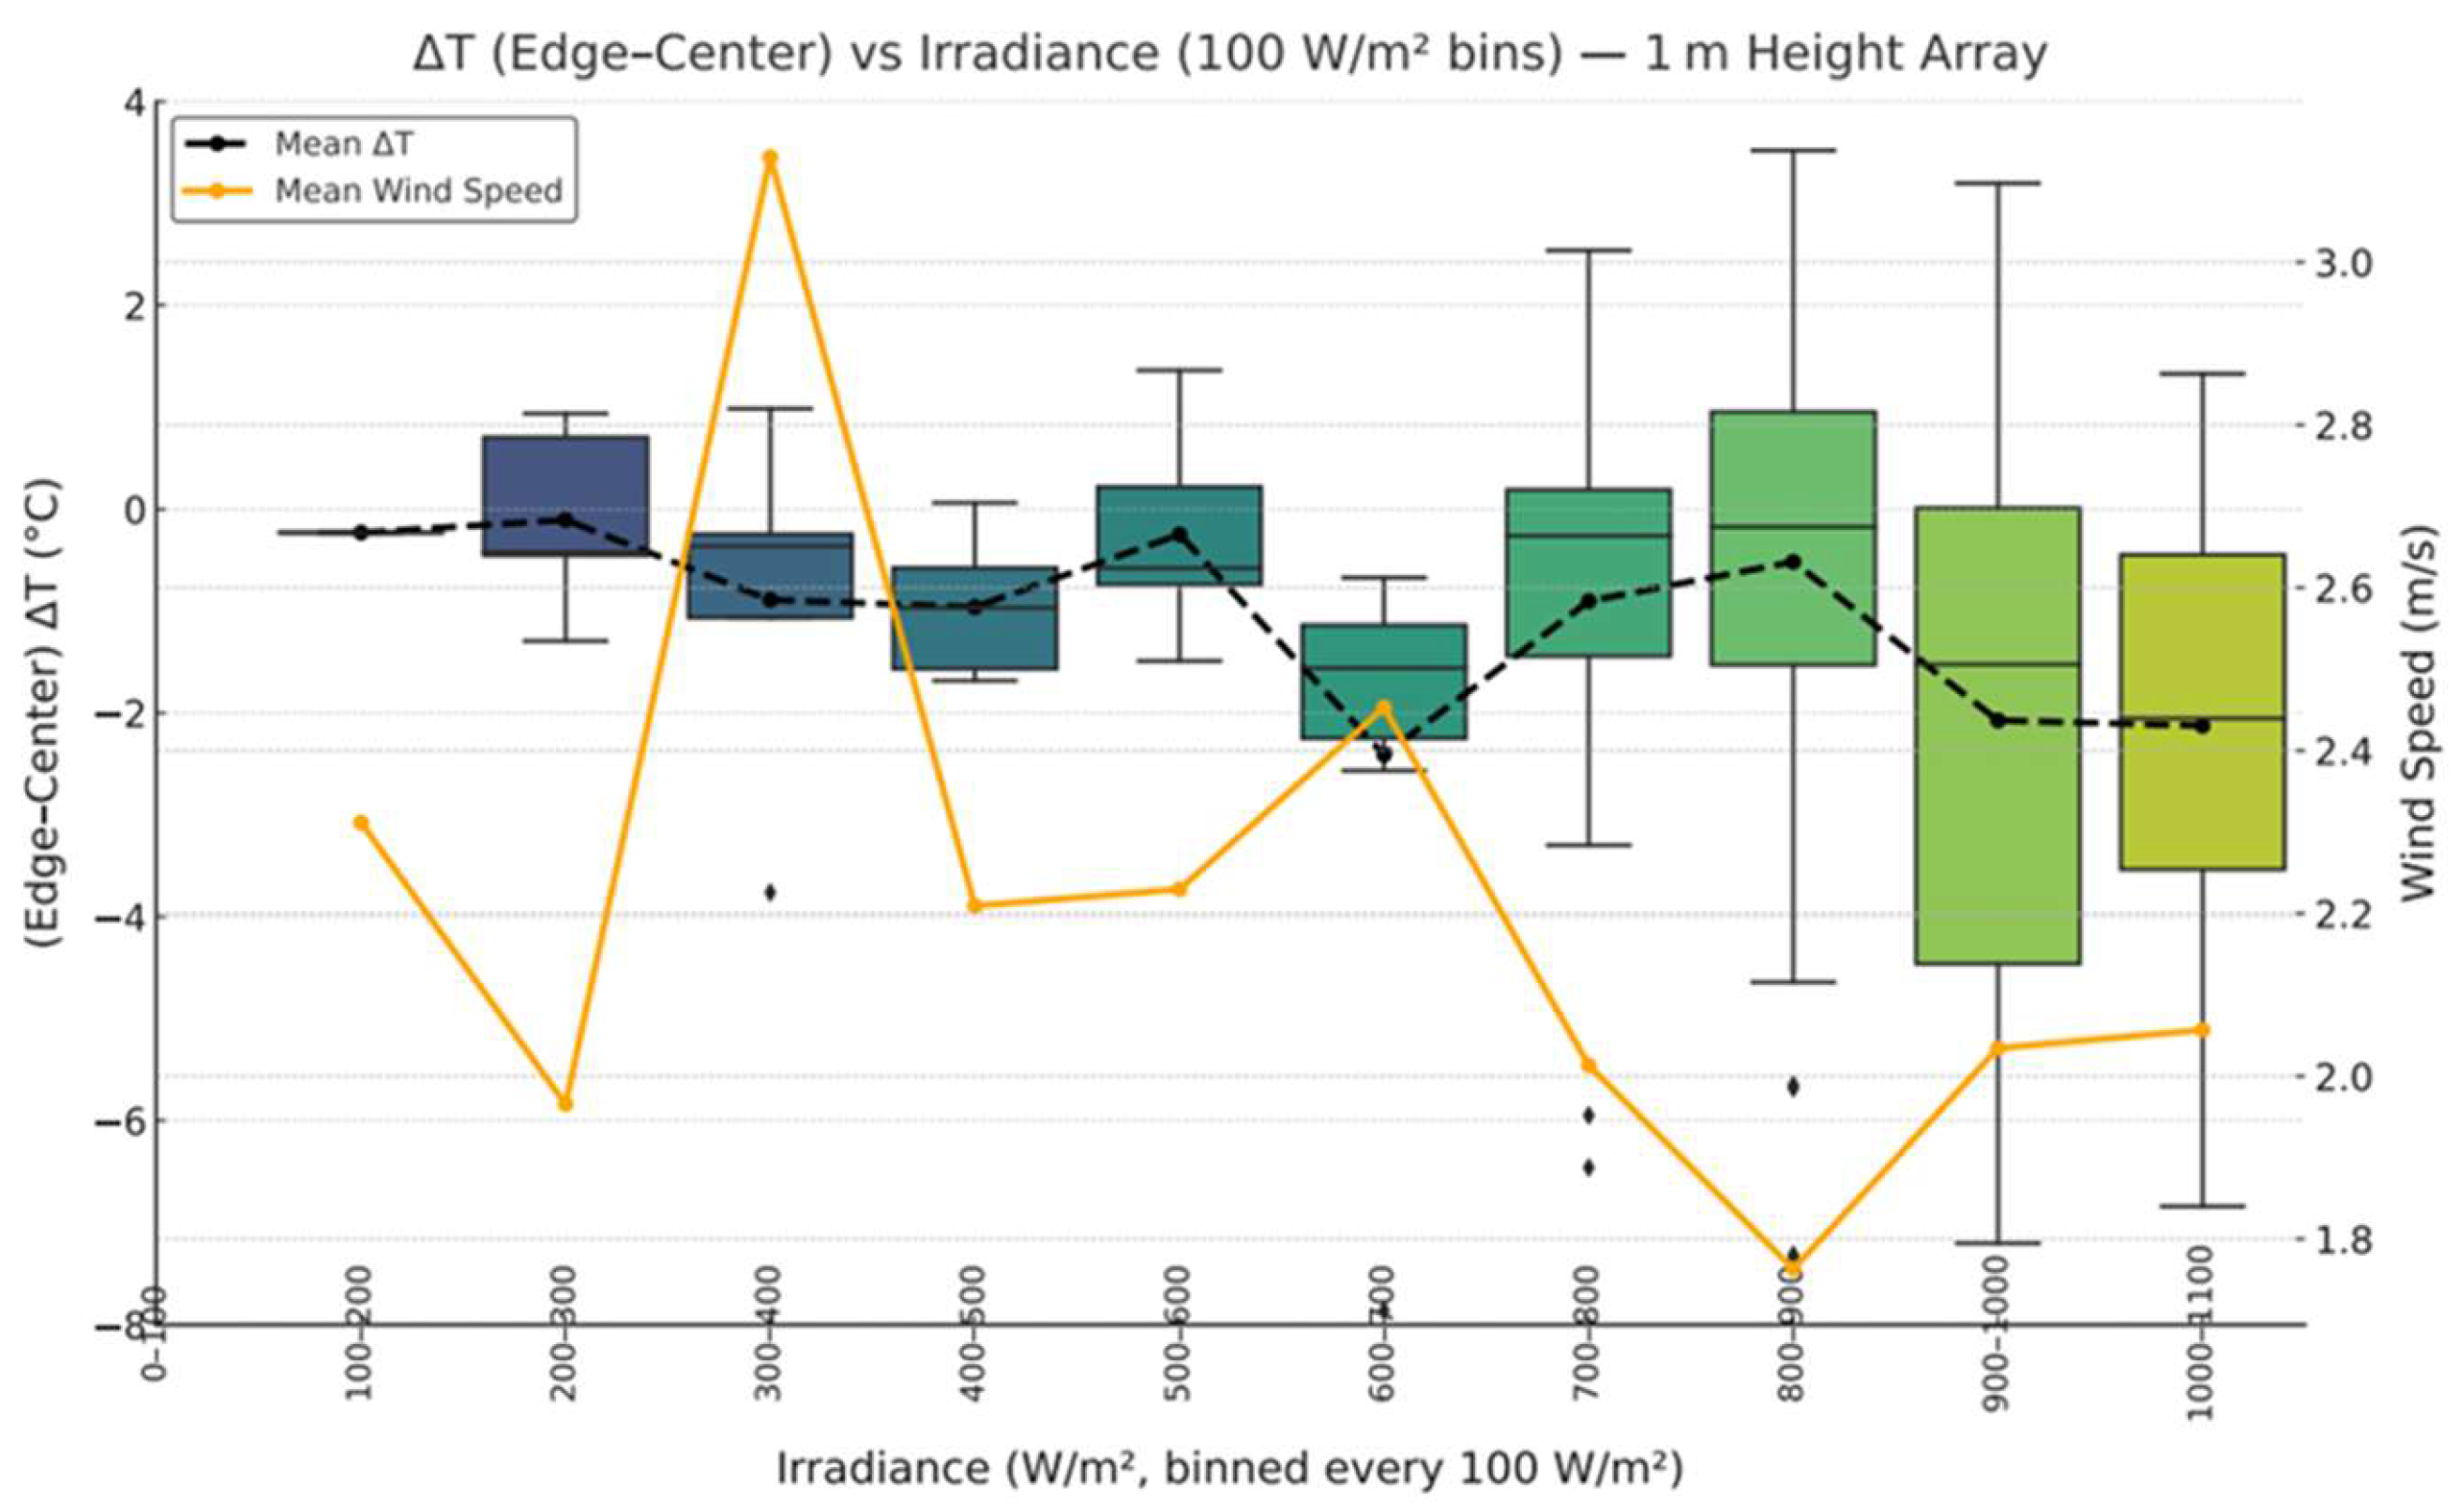
Figure 7.
(Edge–Center) ΔT vs Irradiance for 2 m Height Array. This plot includes irradiance bins of 100 W/m², mean ΔT (black dashed line), and mean wind speed (orange line).
Figure 7.
(Edge–Center) ΔT vs Irradiance for 2 m Height Array. This plot includes irradiance bins of 100 W/m², mean ΔT (black dashed line), and mean wind speed (orange line).
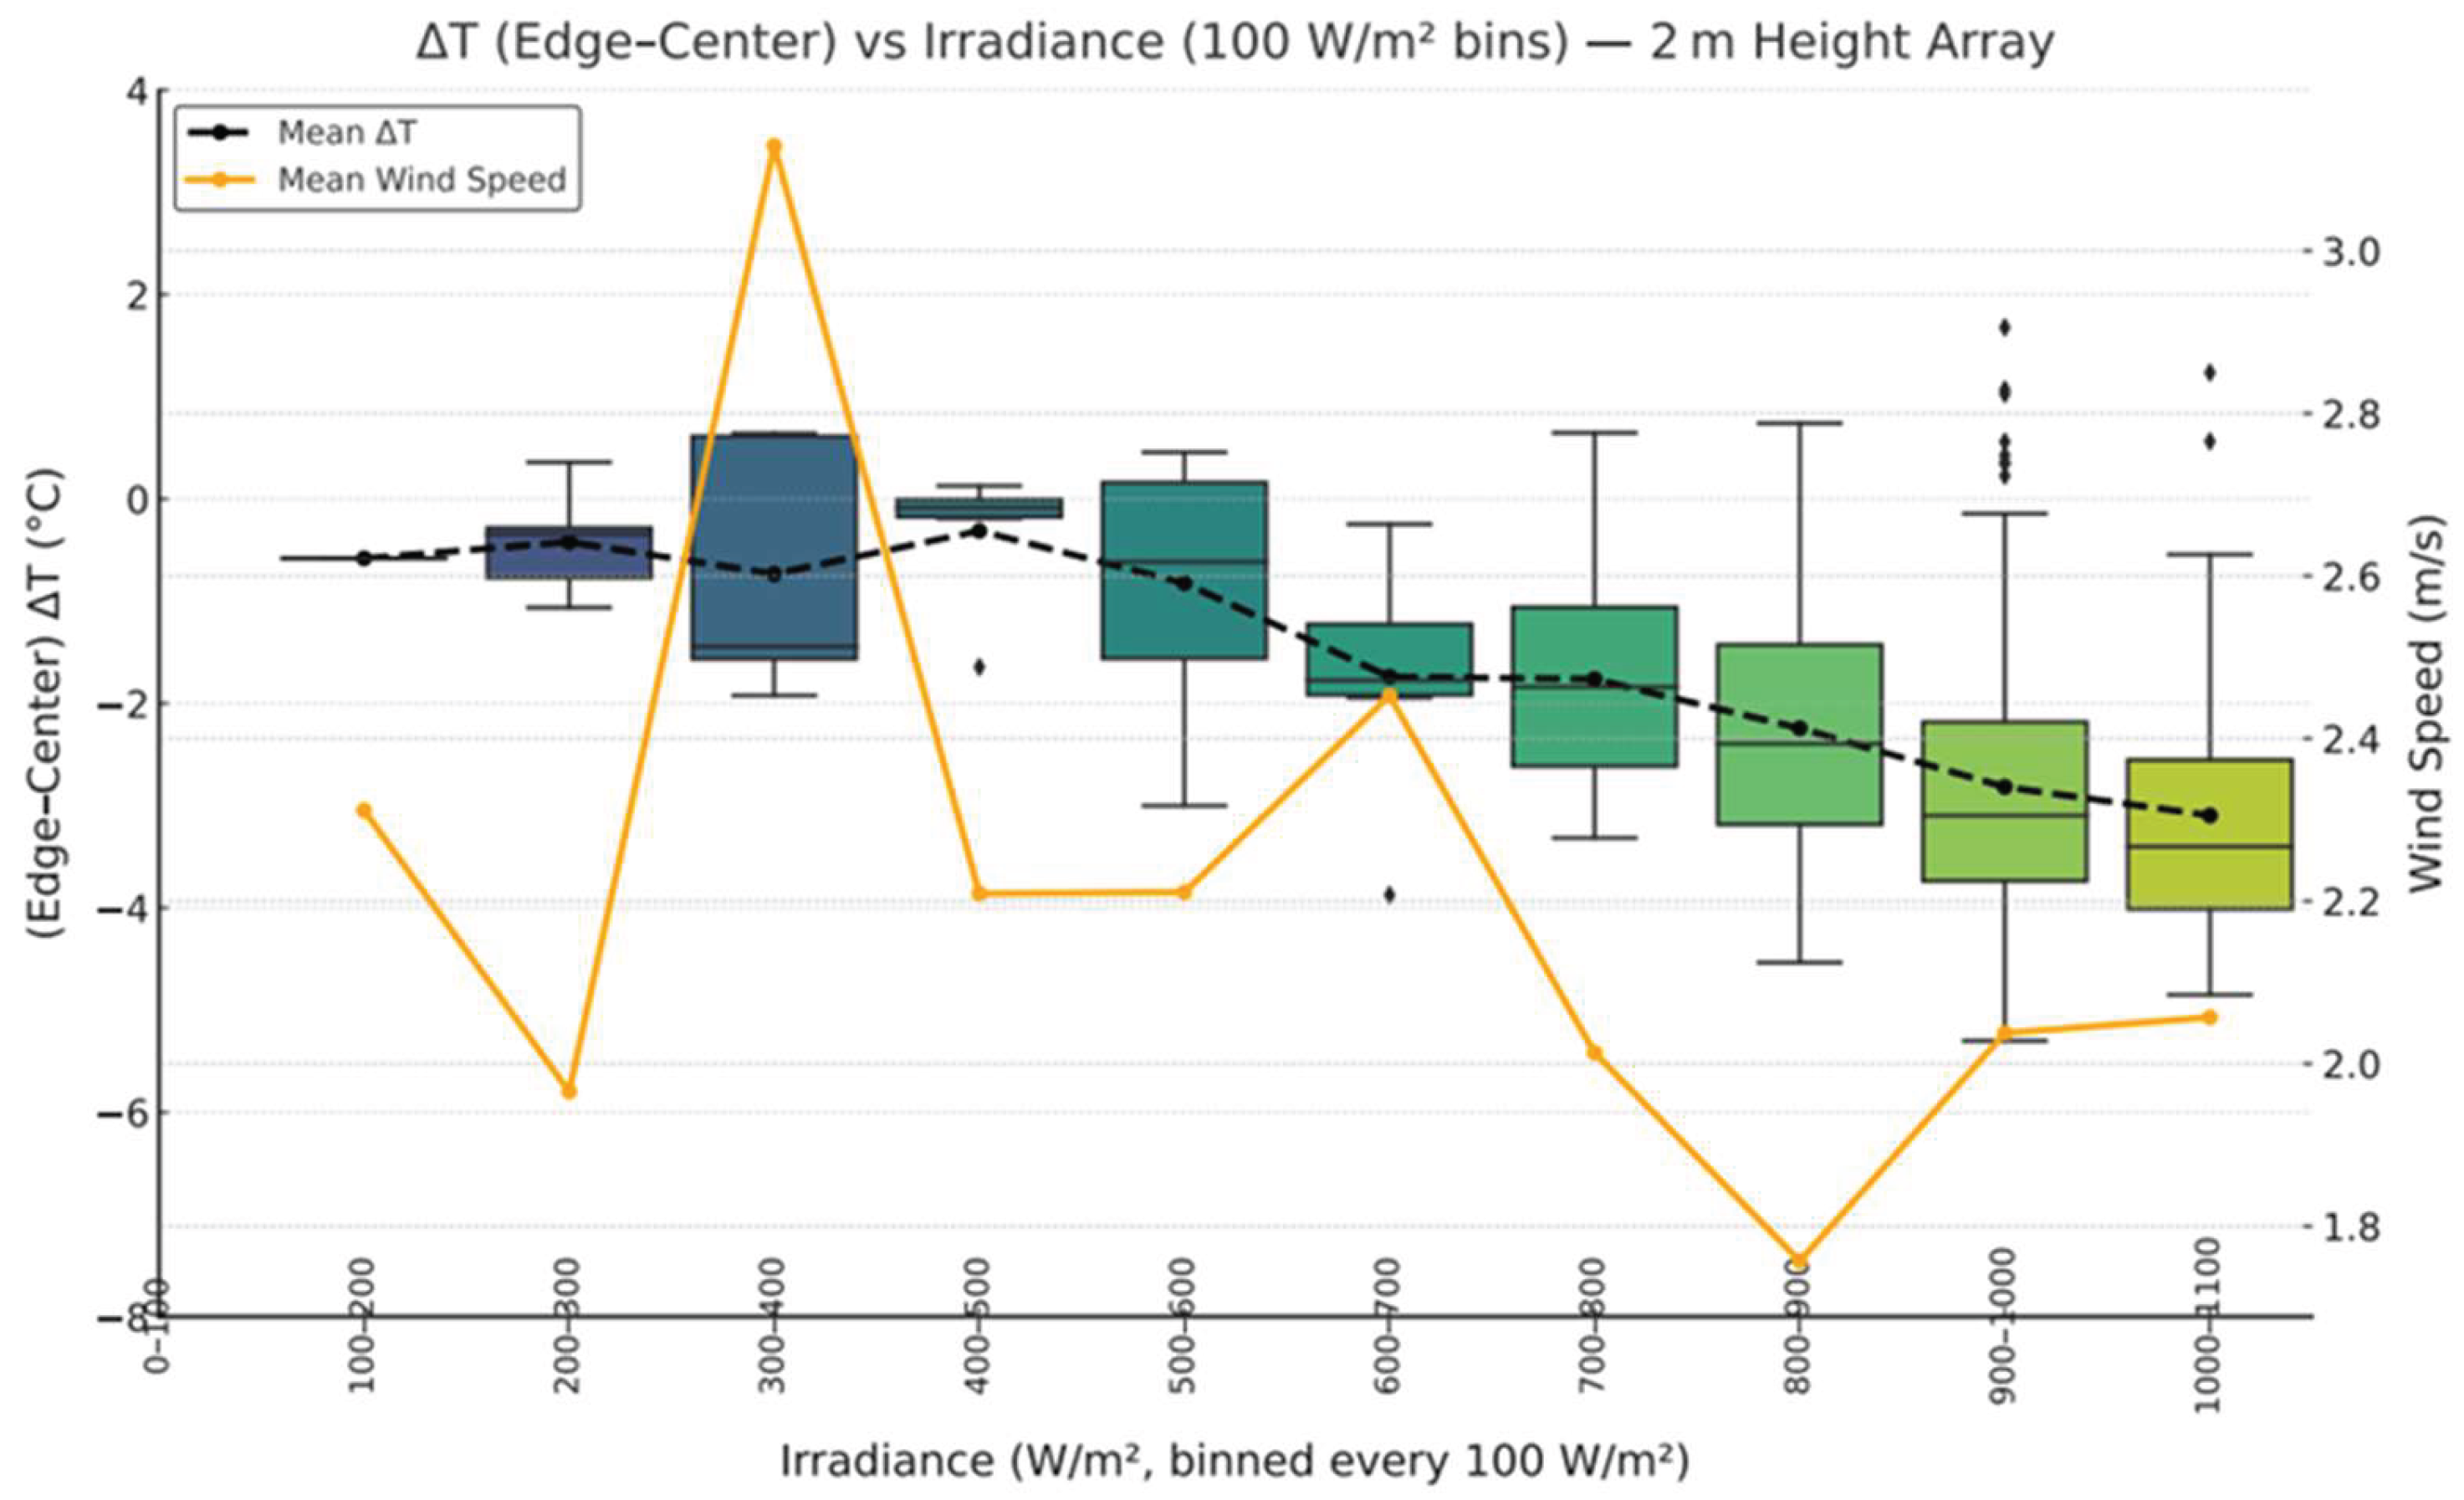

Table 1.
Performance and Thermal Characteristics of the Test Modules.
| Parameter | Symbol | Value |
|---|---|---|
| Maximum power at STC | Pmax | 320 Wp |
| Open circuit voltage at STC | Voc | 45.9 V |
| Short circuit current at STC | Isc | 9.41 A |
| Nominal Operating Cell Temperature | NOCT | 46 °C |
| Temperature coefficient of Isc | TCIsc | 0.042 %/C |
| Temperature coefficient of Voc | TCVoc | -0.304 %/C |
| Temperature coefficient of Pmpp | TCPmax | -0.43 %/C |
Disclaimer/Publisher’s Note: The statements, opinions and data contained in all publications are solely those of the individual author(s) and contributor(s) and not of MDPI and/or the editor(s). MDPI and/or the editor(s) disclaim responsibility for any injury to people or property resulting from any ideas, methods, instructions or products referred to in the content. |
© 2025 by the authors. Licensee MDPI, Basel, Switzerland. This article is an open access article distributed under the terms and conditions of the Creative Commons Attribution (CC BY) license (http://creativecommons.org/licenses/by/4.0/).
Copyright: This open access article is published under a Creative Commons CC BY 4.0 license, which permit the free download, distribution, and reuse, provided that the author and preprint are cited in any reuse.


