
Submitted:
03 December 2025
Posted:
04 December 2025
You are already at the latest version
Abstract
The rapid mobilization of sediment stored behind dams, in amounts that are large relative to mean annual sediment loads can jump start river restoration but can also adversely impact habitat, infrastructure, land, and water use upstream of, within, and downstream of the former impoundment. A wide range of geomorphic and engineering assessment tools were applied to help manage sediment-related risks associated with the removal of two dams from the Elwha River in Washington State and the release of roughly 21 million m3 of sediment. Each of these tools had their strengths and weaknesses, which are explored here. The processes of sediment erosion, transport and deposition were complex. No one model was able to fully simulate all these with the accuracy necessary for predicting the magnitude and timing of coarse and fine sediment release from the reservoir. Collectively, however, the model outputs provided enough information to guide the adaptive sediment management process during dam removal. When the complexity of the morphodynamic responses to dam removal and the associated risks exceeded the capacity of any one tool to adequately assess, synoptic forecasting proved useful. The lessons learned on the Elwha have provided insights into how to use a variety of modeling techniques to address sediment management issues such as dam removal scale, complexity and risk increase.

Keywords:
dam removal
; sediment management
; conceptual modeling
; mathematical modeling
; physical modeling
; synoptic modeling
1. Introduction
In the US and Europe, the rate of dam and weir removal has increased rapidly since the 1990s and is likely to continue increasing (Bellmore et al. 2016), offering opportunities to reverse anthropogenic fragmentation of river systems, increase ecosystem resilience and help address the global biodiversity emergency by providing access to more, and better quality, physical habitat for aquatic organisms (Barbarossa et al., 2020; Birnie-Gauvan et al., 2020; Duda et al., 2021; Dynesius & Nilsson, 1994; Heinz Centre, 2002; Hess, et al., 2020; Magilligan, et al., 2016; McAllister et al., 2001; Pejchar & Warner, 2001; Pohl, 2002; Reid et al., 2018).
Multiple benefits arise from dam removal (e.g. East et al., 2015; Petts, 1984; Poff et al., 1997; Wik, 1995), but the mobilization of potentially large volumes of impounded sediment risks creating unstable landscapes within former reservoir areas, channel incision along and upstream of reservoir deltas, and aggradation and increases in suspended sediment loads in the downstream river channels (e.g. Bergstedt and Bergersen, 1997; National Research Council, 1996; Packman and MacKay, 2003; Randle and Bountry, 2017; Servizi and Martens, 1992).
These changes can result in a range of adverse ecological and socio-economic impacts. For example, the removal of the Glines Canyon Dam from the Elwha River was halted for a year because the downstream water treatment plant had been overwhelmed by fine sediment (Bountry et al., 2018), while planning for the removal of Matilija Dam has taken three decades because of concerns around fine sediment impacts to aquatic biota, the operation of the Robles Diversion Dam and water quality problems in Lake Casitas, which is fed by the Robles Diversion (URS and Stillwater Sciences, 2014). Similarly, the four hydroelectric dams removed from the Klamath River in 2024 contained approximately 11.9 million m3 of sediment (84% silt and clay, 16% sand and gravel), of which approximately 36-57% was predicted to be transported downstream, creating suspended sediment concentrations of 7,000 to 14,000 mg/L for several months during dam removal (FERC, 2022). Predicted adverse impacts included flood-related risks to infrastructure, which necessitated the planning of mitigation measures.
To date, most dam removals have involved small to moderately sized structures and the morphodynamic and ecological responses to removal have been studied at only a small proportion (e.g. Bellmore et al., 2016; 2019; Cheng and Granata, 2007; Collins, et al., 2017; Cui et al, 2018; Doyle et al., 2003; Major et al., 2012; Major, et al., 2017; O’Connor, et al., 2015; Simons and Li, 1982; Stanley et al., 2002;Tang et al., 2021). Few large dams have been removed (American Rivers, 2021; Dam Removal Europe, 2021; Duda et al., 2018) and only a subset of these have publicly available studies (e.g. Cui et al., 2014; Duda et al., 2021; East, et al., 2023; Hess, et al., 2020; Ibisate et al., 2016; Randle et al., 2015; Ritchie et al., 2018; Wang and Kuo, 2016; Warrick et al., 2015, Wilcox et al., 2014).
Forecasting the nature, timing and extent of sediment erosion, transport and deposition during and following dam removal is thus a fundamental requirement in assessing the associated risks to people, property, infrastructure, species, and institutional reputations. A range of engineering and geomorphic forecasting tools exist, not all of which have been thoroughly tested in the more unusual or demanding conditions associated with large dam removals.
With reference to post-removal field data, studies undertaken over a 28-year period before, during and after the concurrent removals of the Glines Canyon and Elwha Dams from the Elwha River, WA provide a rare opportunity to review the relative strengths and weaknesses of a suite of riverine conceptual, numerical and physical sediment modeling tools in simulating different aspects of the morphodynamics of sediment movement through and out of two large impoundments and through downstream river reaches..
2. Study Site
The Elwha River originates in the Olympic Mountains and flows north for 70 km before entering the Strait of Juan de Fuca at Angeles Point, about 10 km west of Port Angeles, WA (Figure 1). A large portion of the 833 km2 watershed (83%) is within the Olympic National Park and the Daniel J. Evans Wilderness Area boundaries. The average annual precipitation of the Elwha River watershed ranges from 1 m at the river mouth to 6 m on Mount Olympus (Duda et al., 2011). The average annual discharge is 42 m3/s and the 2-year flood peak is 400 m3/s (Randle et al., 2015, Duda et al., 2011). Floods tend to be of short duration (one or two days) and typically occur during the fall–winter storm season. Discharges during spring snowmelt are typically less than during winter floods, but longer in duration.
Past and present glacial activity in the steep mountainous watershed, combined with high precipitation, produce average annual sediment loads of 230,000 m3/yr (Randle et al., 2015). The natural riverbed is composed of gravel, cobbles, boulders, and sand, with some exposed bedrock. The river reaches alternate between narrow bedrock canyons and wider alluvial reaches for much of its length (Beechie et al., 2006; Warrick et al., 2011). Before construction of Elwha Dam and Glines Canyon Dam, the Elwha River supported anadromous fish, including all five species of Pacific salmon and four species of trout (USDOI, 1994; USDOI, 1995). The dams blocked fish passage and trapped natural sediment loads, leading to the loss of salmon runs and inundating cultural sites of the Lower Elwha Klallam Tribe (DOI, 1994).
Impounding Lake Aldwell, Elwha Dam was completed in 1913 as a 32-m-high concrete gravity dam 7.8 km from the river mouth. Glines Canyon Dam was completed in 1927 as a 64-m thin-arch concrete dam 21 km from the river mouth and formed Lake Mills. Lake Mills trapped 16.1 ± 2.4 million m3 of sediment and Lake Aldwell trapped 4.9 ± 1.4 million m3 (Randle et al., 2015, Bountry et al., 2018). The incremental cutting down of both dams occurred concurrently, beginning in September 2011. Elwha Dam was completely removed by April 2012 and Glines Canyon Dam by August 2014.
With 84 years of coarse sediment supply trapped within Lake Mills, the level of sediment-related risk to downstream infrastructure and property was especially high, because located downstream of one or both dams are the Altair Campground, park roads, private property, the Elwha Surface Water Intake (ESWI), the Elwha Water Treatment Plant (EWTP), the tribal fish hatchery, and tribal lands, private property, and homes (Figure 1).
3. Review of Sediment Modeling Tools Used for Dam Removal
3.1. Conceptual Modeling and Geomorphic Analysis
Grant et al. (2013) define a conceptual model as ‘a persistent set of ideas that usefully organizes thinking…by providing representations or abstractions of complex systems that make them easier to understand’. They can help you to understand why a river looks the way it does and what it will look like in future (Grant et al., 2013). Developing a conceptual model thus forces one to think through the fundamental process-form-response interactions that are likely to occur, which serves to identify potential risks and processes that may need to be assessed in more detail in order to determine appropriate mitigation. Drawing on knowledge held by multiple individuals and organizations, and incrementally updating it as knowledge was derived from other studies, the Elwha conceptual model synthesized existing conditions and provided a qualitative understanding of the sediment erosion and redeposition processes expected in the reservoirs and downstream channel during dam removal (USDOI, 1996a,b).
The model initially hypothesized that the rate of reservoir sediment erosion would primarily be a function of discharge and the rate of reservoir drawdown. Lake Mills contained a 20 m- to 30-m thick coarse sediment delta at its upstream end and 4 m to 16 m thick fine sediment deposits along the reservoir bed (bottomset deposits) between the delta and the dam. The eroded coarse sediment was expected to redeposit on top of the bottomsets across the full width of the receding reservoir.
An important element of ecosystem restoration involved recreating a fully-connected channel-floodplain system (USDOI, 1996a,b) that was in a state of dynamic equilibrium (Table 1). Within the reservoirs, this required the majority of the coarse delta sediment to be eroded and redistributed throughout the basin during dam removal and the first few post-removal floods. A conceptual understanding of how this might be achieved was boosted by outputs from the reservoir drawdown experiments (section 3.2) and physical models built at the University of Nottingham (UoN) and the St. Anthony Falls Laboratory (SAFL) (section 3.4). Due to base level lowering during drawdown, channels on the delta surface in Lake Mills were expected to incise through their armor layer during flows as small as 28 m3/s, which is only 7% of the 2-year flood. Bank erosion driven by this incision was then expected to drive channel widening and lateral movement across the delta surface (Childers, et al, 2000). The SAFL model showed that excavating a pilot channel along the centerline of the delta prior to dam removal would substantially increase rates and magnitudes of lateral erosion compared with allowing channel erosion along the erosion-resistant margins of the reservoir.
During dam removal, the rate of sediment release into the river downstream was expected to vary with discharge and the rate and timing of dam lowering. Following dam removal, sediment discharge downstream was expected to vary with the timing and magnitude of floods, with progressively higher flood stages causing some degree of channel and floodplain widening within the remaining reservoir sediment (USDOI, 1996a,b).
The middle river reach between the two reservoirs features narrow bedrock canyons interspersed with wider, alluvial floodplain reaches (East et al., 2015). Following dam closure, the alluvial reaches incised and armored, reducing lateral migration and allowing vegetation to colonize and stabilize the channel banks and bars. With a slope of roughly 0.7% - 0.8% (East et al., 2015), stream powers were expected to be sufficiently high that sediment would be predominantly transported through it after dam removal. Restoration of coarse sediment supply to the lower reach downstream of Elwha Dam, which had a slope of roughly 0.4% (East et al., 2015), was expected to fill pools and increase river water surface elevations (Randle et al., 1996; USDOI, 1996a), restore the full range of bed material sizes (sand, gravel, cobble, and boulder), increase the active channel width, and rebuild the coastal delta. In addition, the wood load trapped within the reservoir sediment and the natural supply from upstream was expected to increase the presence of log jams. Lateral channel dynamism was expected to increase within the ~1 km wide corridor constrained between flood levees. Because of an increase in flood risk associated with these changes, cash payments were made to landowners between the National Park boundary and the upstream end of Lake Aldwell to pay for flood mitigation measures to be installed and for any future flood damage that might occur. Although sediment deposition was twice as much in the lower reach as in the middle reach, deposition along the middle reach was greater than predicted and triggered sufficient lateral channel movement to wash out roads and recruit trees to the channel.
Initially, fine sediment concentrations released downstream were expected to be small, as the small amounts eroded from the delta mixed with the receding reservoir pool and settled on the bed. As the incising delta surface channel cut into the original bottomset deposits, however, more fine sediment was expected to be recruited into an ever-shrinking reservoir pool, thus increasing the concentrations released downstream for a given reservoir inflow. Concentrations were expected to peak once the reservoir had completely disappeared and eroded bottomset sediments were released directly to the downstream river. Together with natural concentrations after dam removal, this was expected to increase water treatment needs for municipal and industrial water users (Randle et al., 1996; USDOI, 1996a), so the following water quality mitigation measures were implemented prior to dam removal:
- Construction of the ESWI and EWTP to respectively divert and pre-treat river water for municipal and industrial users. (Numerical modeling was used to predict the concentrations to be dealt with).
- Construction of a new Water Treatment Plant for the City of Port Angeles.
- Upgrades to the existing industrial water treatment plant.
- New and deeper municipal wells were drilled for the Dry Creek Water Association and the Elwha Place Homeowners Association.
Turbidity and abrasion due to the high sediment concentrations were also expected to affect fish and macroinvertebrates, primarily during the years of dam removal. A new fish hatchery was thus constructed for the Lower Elwha Klallam Tribe to help native fish recover following dam removal.
The conceptual model concluded that phased dam removal could efficiently allow the river’s natural energy to erode and transport the reservoir sediments to the sea. When coupled with mitigation to improved flood protection and water quality treatment, the phased approach would provide the most cost-efficient approach to ecosystem restoration. The conceptual model also led to the conclusion that most of the related Lake Aldwell sediment transport would be over before the larger sediment volume in Lake Mills entered the river, and that the former Lake Aldwell reach would then experience sediment impacts just like other downstream alluvial river reaches.
Geomorphic analyses were undertaken to help quantify inferences based on the conceptual model and chart recovery towards dynamic equilibrium in both the reservoir and river channel downstream (Table 1). A state of dynamic equilibrium was expected to exist when rates of sediment input and output became balanced over time, even though sediment was continually being eroded, transported, and deposited and channel form was adjusting in response (Wolman and Leopold, 1957).
3.2. Reservoir Drawdown Experiments
Reservoir drawdown experiments provided opportunities to collect sediment samples from the exposed delta and to observe and document the delta erosion processes prompted by base level lowering. Observations and measurements made during the experiments greatly improved the accuracy of the conceptual model and dispelled a prior conceptual expectation that the river’s capacity to erode deltaic sediments would be limited by armoring and large wood.
In 1989, Lake Mills was lowered 6 m to allow sediment coring of the exposed delta, which included six auger holes, 13 piston core samples, and 32 thickness probe measurements (Hosey and Associates, 1990). Size gradations and stratigraphic data from the cores served as inputs to the mass balance (MB) models. Combined with 1994 field measurements, roughly equal proportions of fine (<=0.075 mm) and coarse sediment were found in the reservoir, with downstream fining and upwards coarsening of the deltaic sediments (Gilbert and Link, 1995). Daily channel evolution and sediment erosion of the exposed delta were not documented.
In 1994, Lake Mills was lowered 6 m over a one-week period, held at a constant level for a week then allowed to refill. Delta surface cross-sections were surveyed daily (Childers, et al., 2000). Discharge, suspended sediment concentration and bedload were measured daily, upstream, on, and downstream of the delta, to provide insights into the delta’s mechanisms of morphodynamic adjustment. As the reservoir was lowered, a tree-covered island at the head of the delta created two main channels. Channel incision dominated during reservoir drawdown and was greatest at the delta front, declining with distance upstream as the knickzone graded into the existing channel slope. Driven by incision and lack of sediment cohesion, braiding and topographic steering of the flow by terraces and the valley walls created extensive channel widening during the week with constant water level. Throughout the experiment, the right-hand channel remained attached to the bedrock valley wall in the upstream half of the delta. Large wood pieces were undermined by incision and did not inhibit either vertical or lateral erosion, though they did locally accelerate rates of lateral erosion, split flow, and generate braiding (Childers et al., 2000). Eroded material was deposited as lobes at the downstream end of each channel, prograding first longitudinally, then laterally until a delta sweep (sediment deposited across the full reservoir width) was completed. This highlighted the importance of making hold periods during dam removal sufficiently long to meet the sediment management objective of maximizing lateral sediment erosion and redistribution within the reservoir. These findings informed design of the mass balance models and guided the development of research hypotheses investigated using the physical model. At this stage, the optimum increments of reservoir drawdown and hold period lengths for maximizing sediment redistribution remained unclear.
3.3. Mass Balance Modeling Phase 1
The drawdown experiments demonstrated that delta erosion involved interactive processes of incision, widening, lateral channel movement, and the release and mixing of fine sediment that the numerical models then available (circa.1996) were incapable of simulating. To fill this gap, cross-section-based mass balance models (MB1) were developed for Lakes Mills and Aldwell to simulate delta erosion driven by incremental lowering of the dam and to support production of Environmental Impact Statements (USDOI, 1996a, b). MB1 used field data, empirical rules, regime equations and fine sediment settling equations to simulate vertical and lateral delta erosion, delta sweeping, sediment redeposition within the remaining reservoir pool and evacuation through the dam site, while conserving the mass of the incoming sediment load (Randle et al., 1996). The model relied on assumptions derived from the conceptual model and drawdown experiments that varied depending on if a reservoir pool remained or had been completely drained. For example, while a reservoir pool remained, it was assumed that all the eroded coarse sediment and a portion of the fine sediment would deposit therein, that the width of the channel eroding the delta was a function of the discharge, and that channel width increased with distance downstream, reaching a maximum where it was sweeping across the receding reservoir pool.
These models proved useful in estimating the quantities of coarse and fine sediment eroded and redistributed during dam removal and by post-dam floods. Results also indicated when the receding reservoir pools would fill with sediment, triggering the first release of coarse sediment downstream. The models predicted:
- that 15% to 35% of the coarse sediment and ~50% of the fine sediment would be eroded from the reservoirs;
- the date on which coarse sediment would first be released downstream;
- that maximum downstream fines concentrations would be in the range 10,000-50,000 ppm;
- that bed elevations in the lower river would rise appreciably;
- that reservoir sediment erosion rates would decrease exponentially once dam removal was completed and a few floods had occurred.
Although MB1 predictions underestimated the percentages of coarse and fine sediment eroded from the reservoirs and overestimated peak concentrations of fine sediment relative to actual dam removal values, they helped guide the adaptive management monitoring design used to determine the rate of dam removal and set benchmarks against which to compare monitoring results.
Predictions concerning downstream sediment concentrations and aggradation helped guide decision making on securing the supply of drinking water for Port Angeles, hatchery and industrial water supply, raising flood levees to maintain authorized levels of protection, and informed the pace of dam removal to achieve the desired ecosystem restoration outcomes and minimize impacts to fish during migration periods. Downstream results also informed environmental permitting on the expected duration and frequency of background sediment loads exceeding threshold values.
3.4. Physical Modeling
Physical modeling was performed to advance understanding of the sediment processes observed during the reservoir drawdown experiments at Lake Mills.
An un-scaled tabletop model built at the University of Nottingham (UoN) in 2000 simulated channel incision and widening by bank collapse following a drop in baselevel in two delta channels that qualitatively mimicked those that developed during the 1994 drawdown experiment (Figure 2a). Eroded material was deposited as two lobes, prograding first longitudinally and later increasingly laterally towards a delta sweep.
At SAFL, Bromley (2007) built and ran a vertically-distorted, scaled physical model of Glines Canyon Dam and Lake Mills delta sediment (bottomset deposits not represented) (Figure 2b-c). The SAFL model was able to simulate varying sized increments of dam removal and delta surface channel starting positions. This showed that lateral erosion and redistribution of delta sediment was more extensive when a pilot channel was excavated along the delta’s centerline (Figure 3a), eroding substantially more sediment than when the channel was allowed to align along either the left or right valley wall. These findings informed the decision to excavate a pilot channel in the real delta prior to dam removal (Figure 3b-c). The pilot channel allowed the incising channel to access virtually the entire delta surface through the operation of three interrelated mechanisms.
First, lateral erosion occurred most rapidly when one terrace topographically steered flow across the delta to impinge against the opposite terrace, so creating the space and sediment load necessary for braiding. Second, once sediment loads decreased sufficiently, any sub-channel in the braided planform could capture the bulk of the flow to recreate a single-thread channel capable of rapidly eroding a different part of the delta surface. Third, avulsion of the single-thread channel could efficiently redirect erosion to a different part of the delta. Without a pilot channel, the stream flow contacted the reservoir basin boundary at an early stage and remained there for a greater proportion of the model run, which muted the operation of these mechanisms and constrained them to either the left or right half of the delta.
The SAFL model also established that the capacity of post-dam removal floods to further erode the delta depended strongly on the eroded delta’s topography (Figure 5a,b). In runs with a pilot channel, floods eroded only about 5% more sediment because so much of the delta had already been eroded and redistributed. Post-dam removal delta erosion was also limited when the channel incised close to the left basin boundary, because the channel’s curvature directed the bulk of the floods’ erosive force away from the large terrace deposits to the right, causing the channel to incise quickly to the lowest point of the valley floor. In contrast, when the channel incised closer to the right basin boundary, the cross-valley slope from right to left drove flood flows against the left terrace, eroding large volumes of sediment before the channel could cut down to the valley floor.
Leung et al.’s (2019) tabletop model, run after the actual dam removal, demonstrated the role played by large wood in creating a more locally complex, braided planform on the delta topset (the gently sloping delta surface). Individual wood pieces or jams were able to divide flow and help braid bars to emerge over two cycles of falling baselevel and a hold period, when compared to a control run without wood (Leung et al. 2019). This concurred with observations made during the 1994 drawdown experiment and the actual dam removal. There was little difference in the rate of lateral channel migration and delta sweeping in the model runs with and without wood.
3.5. Mass Balance Modeling Phase 2
From the second drawdown experiment in 1994 to 2010, the actual volume of sediment stored in Lake Mills increased substantially from 10.6 million to 16.1 million m3 (52%) (Bountry et al., 2011). This prompted development of a second phase of mass balance modeling (MB2) (Randle, et al., 2021).
MB2 retained many of the concepts and assumptions of MB1 but was updated with observations from the SAFL model and new field measurements of delta topography. Rather than using cross sections, MB2 included a GIS module that reproduced the complex geometry of Lake Mills and allowed simulation of non-linear channel alignments, variable channel widths and variable erosion and deposition slopes, while supporting 2D and 3D visualization of the evolving delta. It partially corrected MB1’s under-predictions of future eroding channel width by using an additional function that increased erosion width as a function of the number of days above the average discharge during a given model time step (Randle, et al., 2021).
Upstream boundary conditions included daily discharge and mean daily sediment loads computed using an equation derived from measured sediment transport data. The downstream boundary conditions replicated the planned reservoir drawdown schedule, policy limits on the incremental drawdown rate and the required hold periods after each 3-5 m drawdown increment and during 2-month long, seasonally scheduled, fish migration windows, during which dam removal was halted. Digital elevation models derived from photogrammetry on a weekly to monthly basis during dam removal were also available, from which updated channel slopes and widths were extracted to provide additional boundary conditions (Ritchie et al., 2025). The model ran fast enough to produce multiple simulations during each increment of dam removal, allowing its boundary conditions to be updated with the monitoring data ahead of each subsequent increment of dam removal. This informed the alignment of future delta erosion channels, resulting in accurate simulations of the current period and reduced errors in simulations of the subsequent period, despite channel meandering and migration not being simulated. This allowed adaptive management decisions to be made, notably the one-year long hold period required to upgrade the EWTP and to allow downstream bed elevations to be reduced.
Depending on the incoming hydrographs used, 47% to 57% of the coarse sediment and 57% to 74% of the fine sediment were predicted to erode from Lake Mills, with maximum concentrations from 17,000 to 32,000 ppm predicted for the ESWI downstream of Lake Aldwell. Outputs from MB2 were used to inform sediment management decision making, including the rate of reservoir drawdown, throughout the removal of Glines Canyon Dam.
3.6. 1D Numerical Modeling
Konrad (2009) applied a 1D mobile-bed model as part of a larger effort to simulate historical sedimentation in Lake Mills and better understand how sediment would be eroded from the delta and transported and deposited along the Elwha River.
Konrad’s model simulated reservoir erosion solely through incision related to base level lowering. A trapezoidal channel cross-section was specified, meaning that 37% of the sediment in Lake Mills was unavailable for erosion. Different sequences of wet and dry years were simulated, with annual maximum daily flows ranging from 125 m3/s to 600 m3/s. The model provided estimates of how much aggradation might occur along the downstream alluvial reaches as a result of sediment erosion and evacuation from Lakes Mills and Aldwell.
After three years of dam removal and four years of post-removal flows, the model predicted that between 38% and 52% of the 1994 sediment volume (28% and 35% of the 2010 volume) would have been evacuated from Lake Mills. Monitoring results to the end of year 7 indicated that 50% of the depositional reaches downstream from the two dams had aggraded up to 1 m, while 10% had aggraded by more than 3.3 m (Bountry et al., 2018).
3.7. 2D Numerical Modeling
Lai (2014) used the SRH-2D model and bank erosion module to simulate the lateral channel erosion and sediment deposition observed in the SAFL model. Use of a moving mesh allowed accurate simulation of the spatial distributions of bank and bed erosion and deposition observed in the SAFL model. However, relative to the SAFL model, the 2D numerical model over-predicted bank erosion in the upstream half of the pre-dam removal delta and under-predicted it in the downstream third, which resulted in the size of the prograding delta being under-predicted. SRH-2D was able to reasonably simulate observed bank erosion and channel migration equal to about one-third of the channel width (~24 m) at a bend in the Rio Grande in New Mexico, over a five-year period (Lai, 2015). However, bank erosion of this magnitude and rate is modest compared to that observed at Lake Mills, where bank erosion and channel widening varied between 4.5 and 8 times the pre-dam channel width (~274 m to ~488 m) (Bountry et al., 2018). Lai (2014) discovered that the moving mesh became unstable when simulating more than about one channel-width’s worth of bank erosion and concluded that while simulation of lateral erosion using a moving mesh shows promise, in cases of extreme bank retreat a static mesh may be better suited.
3.8. Monitoring and Adaptive Management During Dam Removal
A program of monitoring and adaptive management was designed and implemented to verify and update model predictions and inform management decisions regarding when to proceed to the next phase of the staged dam removals. This was necessary due to irreducible uncertainties in (a) discharge hydrographs, (b) schedule of dam removal and reservoir drawdown, (c) rates and amounts of sediment erosion in the reservoirs, (d) how much of the eroded sediment would be retained within the shrinking pools and for how long, (e) the capacity of the river to transport sediment of different sizes downstream of the dams, and (f) rates and long-stream distributions of deposition between the dams and the river mouth.
Flow does not significantly increase with distance downstream due to few tributary inputs and flows were moderate during dam removal, with no floods exceeding the 2-year flood peak. Lake Mills was drawn down using the spillway and through dam removal in increments of 3-5 m, with ‘hold’ periods of constant baselevel lasting from two weeks to two months in between, to allow time for delta erosion and redeposition of coarse sediments in the remaining pool to sweep across the full reservoir width before the next increment of dam lowering was implemented. Hold periods were also specified during May and June, August through the first half of September, and November and December, to provide lower sediment concentrations during periods of fish migration (USDOI, 2004; 2005a,b). Dam removal was halted from October 2012 to September 2013 because sediment was overwhelming the EWTP, a significant sediment mitigation facility constructed for the project (Bountry, et al., 2018).
Monitoring initially focused on vertical and lateral erosion of sedimentation within the reservoir, together with turbidity in the river downstream of the dam. The U.S. Geological Survey (USGS) additionally collected discharge, turbidity, and suspended sediment samples and created a relationship between sediment concentrations and turbidity (Magirl et al., 2015). Reclamation measured bedload with traditional methods and impact plates in the lower river to contribute to the total sediment budget (Magirl et al., 2015). Monitoring of aggradation in the channel downstream began once coarse sediment was being transported past the dam (Bountry et al., 2018; Ritchie et al., 2018; East et al., 2015).
The monitoring results validated predictions of reservoir morphodynamics made using the 1994 drawdown experiment and SAFL physical model. The pilot channel kept the eroding channel away from the valley sides for most of the dam removal period. Incision dominated during incremental lowering of the dam and reservoir, while lateral erosion, channel widening, planform metamorphosis between meandering, wandering and braiding, and delta sweeps dominated during hold periods.
Aggradation occurred in unconfined reaches of river downstream from the dam sites (Bountry et al., 2018) and reinstated the gravel- and cobble-bed over the boulder armor/bedrock bed that developed with the dams in place. Large wood released from the reservoir sediment formed wood jams consistent with the dynamically-stable pre-dam channel (Bountry et al., 2018). Sediment deposition filled deep pools, temporarily raised riffle crests by ~0.6 m and raised flood stages by ~0.6 m, which allowed the channel to reconnect to the floodplain. In addition, restoration of the sediment supply and natural wood load resulted in the channel being wider and more laterally dynamic. This was unforeseen pre-dam removal since the steepness of the middle reach suggested sediment transport would dominate, but the rate of sediment arrival was so great that it aggraded the bed and induced substantial lateral channel movement and erosion that resulted in part of a road and two campsites within Olympic National Park being washed out. While gravel and cobble deposition dominated in the main channels, sand and fine sediment tended to dominate deposition within side channels. The exception to this aggradational behavior was through the eroding Lake Aldwell delta, where both bed elevations and flood stages decreased because the channel incision following dam removal was greater than the subsequent deposition from sediment supplied from Lake Mills.
Monitoring after each increment of reservoir lowering informed management decisions as to whether dam removal should proceed as planned, be slowed, or even paused to minimize sediment-related risks to downstream communities (Randle et al., 2012a,b).
Process-based projections of how delta sediments would erode and be transported downstream (Randle et al., 1996), which were validated through monitoring during the early stages of dam removal (Bountry et al., 2018), supported accurate interpretation of monitoring data used to update the MB2 model when necessary (Randle et al., 2021). That process facilitated adaptive management of the dam removal program. For example, dam removal was paused between October 2012 and September 2013 due to sediment-related concerns. As anticipated on the basis of modeling and monitoring performed up to October 2012, this slowed the rate of delta erosion and allowed sediment already in the river to be transported downstream past the ESWI, so that upgrades to ESWI could be completed prior to the resumption of dam removal (Bountry et al., 2018).
3.9. Synoptic Forecasting
Once dam removal was completed, a synoptic approach was adopted to forecast how much of the remaining delta and prograded deposits would be eroded during subsequent floods and how long it would take for downstream sediment loads to reach a new dynamic-equilibrium. This approach was selected to leverage the insights, experience and expertise gained by the engineers and scientists leading the adaptive management program.
The modern term ‘synoptic’ comes from the Latin synopticus, (literally, "seeing everything together"), but embodies the Greek philosophical argot that wisdom comes from ‘a coherent understanding of everything together’ (Sellars, 1962). Synoptic forecasting thus involves synthesizing information on system behavior from a wide range of viewpoints and disciplines. Synoptic forecasts rely on theory, precedence and experience, meaning they are, to a degree, subjective (Bundgaard, R. 1951).
In forecasting the post-dam terrace erosion and sediment transport, the first step was to build a fixed-bed, 2D hydraulic model (SRH-2D) with which to simulate velocity distributions for the 2-, 10- and 100-year recurrence interval floods. To forecast velocity vectors within the former reservoir during the water year (WY) 2015, model results were generated for two possible flood scenarios: first, a moderate winter with multiple floods featuring “one large peak” (Figure 4a) and second for a moderate winter with a single moderate peak (Figure 4b) (Bountry, et al., 2018).
Erosion locations and extents were then inferred based on velocity vectors predicted using SRH-2D considered in the contexts of results obtained earlier using the SAFL physical model for post-dam flood erosion simulations, monitoring observations, experience gained during dam removal, the sediment team’s collective professional judgement, and a number of simplifying assumptions (Bountry et al., 2018). Specific assumptions included:
- post-erosion, the dynamically-stable longitudinal channel slope would approximate the pre-dam channel slope;
- once the river incised to the pre-dam valley bottom, additional downcutting would be minimal;
- exposed bedrock, boulders and tributary fans would continue to constrain future channel alignments, such that the alignment observed at the end of dam removal would be maintained;
- erosion-resistant materials in the terraces (tree stumps, cohesive sediments) would continue to limit erosion locally;
- where velocity vectors were parallel to silt-clay terraces, there would be limited erosion;
- where velocity vectors were sub-parallel to silt-clay terraces, erosion would occur at a rate that increases with the angle of flow attack;
- all else being equal, low terraces would erode faster than high terraces;
- the width of the active floodplain would increase through time, with the rate of lateral erosion decreasing as width increased.
Using this synoptic approach, erosion volumes of 1,500,000 m3 and 30,600 m3 were forecast for WY 2015 under the large and moderate flood scenarios respectively. The actual erosion that occurred in 2015 totaled 1,150,000 m3, resulting from two floods with peak discharges that were, respectively, 11% and 2% greater than the 2-year flood.
In 2015, observed lateral erosion immediately upstream from Boulder Creek more closely matched the forecast for the scenario with multiple floods including one large peak, while downstream from Boulder Creek lateral erosion more closely matched the forecast for the moderate winter scenario including one moderate flood peak. The synoptic forecast focused on the lateral erosion of sediment terraces, rather than the vertical channel incision. However, vertical incision occurred along the upper Lake Mills delta channel and to elevations lower than expected based on extrapolation of the 1926 pre-dam topographic map, whose contours did not extend all the way to the mouth of Rica Canyon.
During dam removal, the channel erosion slope through the delta was flatter than the pre-dam channel slope because the delta sediments were finer and more erodible than those of the pre-dam channel. By the end of WY 2015, pre-dam tree stumps had been exposed indicating the channel had recovered to its pre-dam profile and with an equilibrium slope very similar to that of the pre-dam channel.
Recognizing that by the end of 2015 the channel had recovered its pre-dam longitudinal profile, the synoptic forecast was that there would not be significant incision in WY 2016. However, 610,000 m3 of lateral, terrace erosion was predicted for WY 2016 for a scenario featuring one 10-yr flood. This forecast was close to the observed volume of erosion, which was 650,000 m3, resulting from one 10-yr and three 2-year events. Both the spatial distribution and extent of lateral erosion was forecast quite accurately (Figure 4c), including the fact that erosion was less extensive than it had been in WY 2015, as was expected given that the fluvial system was evolving towards a condition of dynamic equilibrium (Bountry et al. 2018).
4. Strengths and Weaknesses of the Different Elwha Models
4.1. Comparison of Simulated and Observed Reservoir Sediment Erosion Volumes
Simulated and observed Lake Mills delta erosion volumes both show stepwise increases through time, with modest increases driven by incision during periods of drawdown interspersed with generally larger increases predominantly due to lateral erosion during hold periods (Figure 5a). Starting at 69% of the total observed reservoir drawdown, there was a one-year hold period during which upstream-migrating incision continued unchecked, because it was incising through reservoir sediments that were finer than those present in the pre-dam river bed. This resulted in substantially more incision and delta erosion than during the equivalent stage of all simulations (Figure 5 and Figure 6), none of which simulated a one-year hold. Other than at the very upstream end of the delta, the incising channel did not encounter the more heavily armored pre-dam channel bed until after 100% drawdown, although it did encounter armored floodplain and terrace surfaces that slowed erosion at times.
Despite the SAFL model’s vertical distortion of 3.7 and other scale effects, simulated erosion volumes across its three runs were within 10% of those observed in Lake Mills for zero to 40% of full drawdown and were still within 15% at 55% of full drawdown. Between 55% and full drawdown, and despite the scale effect described below, the SAFL model delta channel left and right runs suggest that much less delta sediment would have been eroded had the pilot channel not been dredged; only 50% and 58% respectively of the initial delta sediments were eroded during these runs as the incising channels became attached to the model basin boundary, compared to the 94% actually observed. In the pilot channel run the SAFL model eroded 75% of the delta, an underestimate of 19% that probably stems from a scale effect. To avoid cohesion effects, SAFL model sediments had to be coarser than required by the scaling calculations. In the pilot channel run, only 2% of the delta was eroded between 68% and full drawdown due to armor layer formation in the upper delta. Armoring resulted in the upper delta channel slope at 69% and 98% drawdown being noticeably steeper than the observed delta slope at equivalent percentage drawdowns (Figure 6a and Figure 6b).
MB2 better represents the actual sediment volume and drawdown schedule than MB1, so only its results are considered here. To provide an illustration of its predictive capabilities, only a subset of these is presented here; specifically, that obtained by simulating the first 40% of reservoir drawdown using field-monitored boundary conditions and the remaining 60% using boundary conditions calculated by the previous model time step. The latter significantly underestimated the extent of lateral erosion, so MB2 predicted that only 30% of the delta would be eroded at 100% drawdown, rising to 53% after the first post-removal, 2-year flood. This occurred because it was assumed that coarse sediment would offer more resistance than was actually the case, so lateral erosion coefficients and exponents were set too low (Randle et al., 2021).
Both simulated and observed results show that little sediment (<2%) was transported past the dam during the first two-thirds of drawdown, when flows did not exceed the 2-year flood and a reservoir pool remained, albeit with shrinking capacity (Figure 5b). From two-thirds to full dam removal, MB2 predicted that ~15% of reservoir sediment would be transported past the dam site, the SAFL model predicted from 1-27%, while the observed amount was actually 49%.
In the SAFL runs, simulated floods following dam removal flushed 11-31% of the sediment in Lake Mills past the dam. In MB2, simulated floods following dam removal flushed 35%, but monitoring showed that the true figure as a result of post-dam removal floods was 16%. The SAFL model’s vertical distortion and coarser bed material meant there was proportionately more sediment that was too large to entrain from the delta and re-entrain from the residual pool. This scale effect may explain both the under-simulation of initial delta erosion and transport past the dam (Figure 5). MB2 included fine-grained bottomsets, but the under-estimation of lateral erosion mentioned above also caused the model to underestimate sediment transport past the dam (Randle et al., 2021).
4.2. Comparison of Simulated and Observed Reservoir Sediment Erosion Volumes
Long-stream profiles generated using the SAFL model pilot channel run (Figure 6a), field observation (Figure 6b), and MB2 (Figure 6c) data all show delta erosion and deposition in the reservoir starting between 0% and ~30% of total reservoir drawdown. Sediment reached Glines Canyon Dam when Lake Mills was drawn down by ~70% and this was replicated in MB2. Sediment didn’t reach the SAFL model dam, however, until close to complete reservoir drawdown. This was because the absence of bottomset deposits meant there was a greater volume in the initial reservoir to fill with eroded sediment than under field conditions.
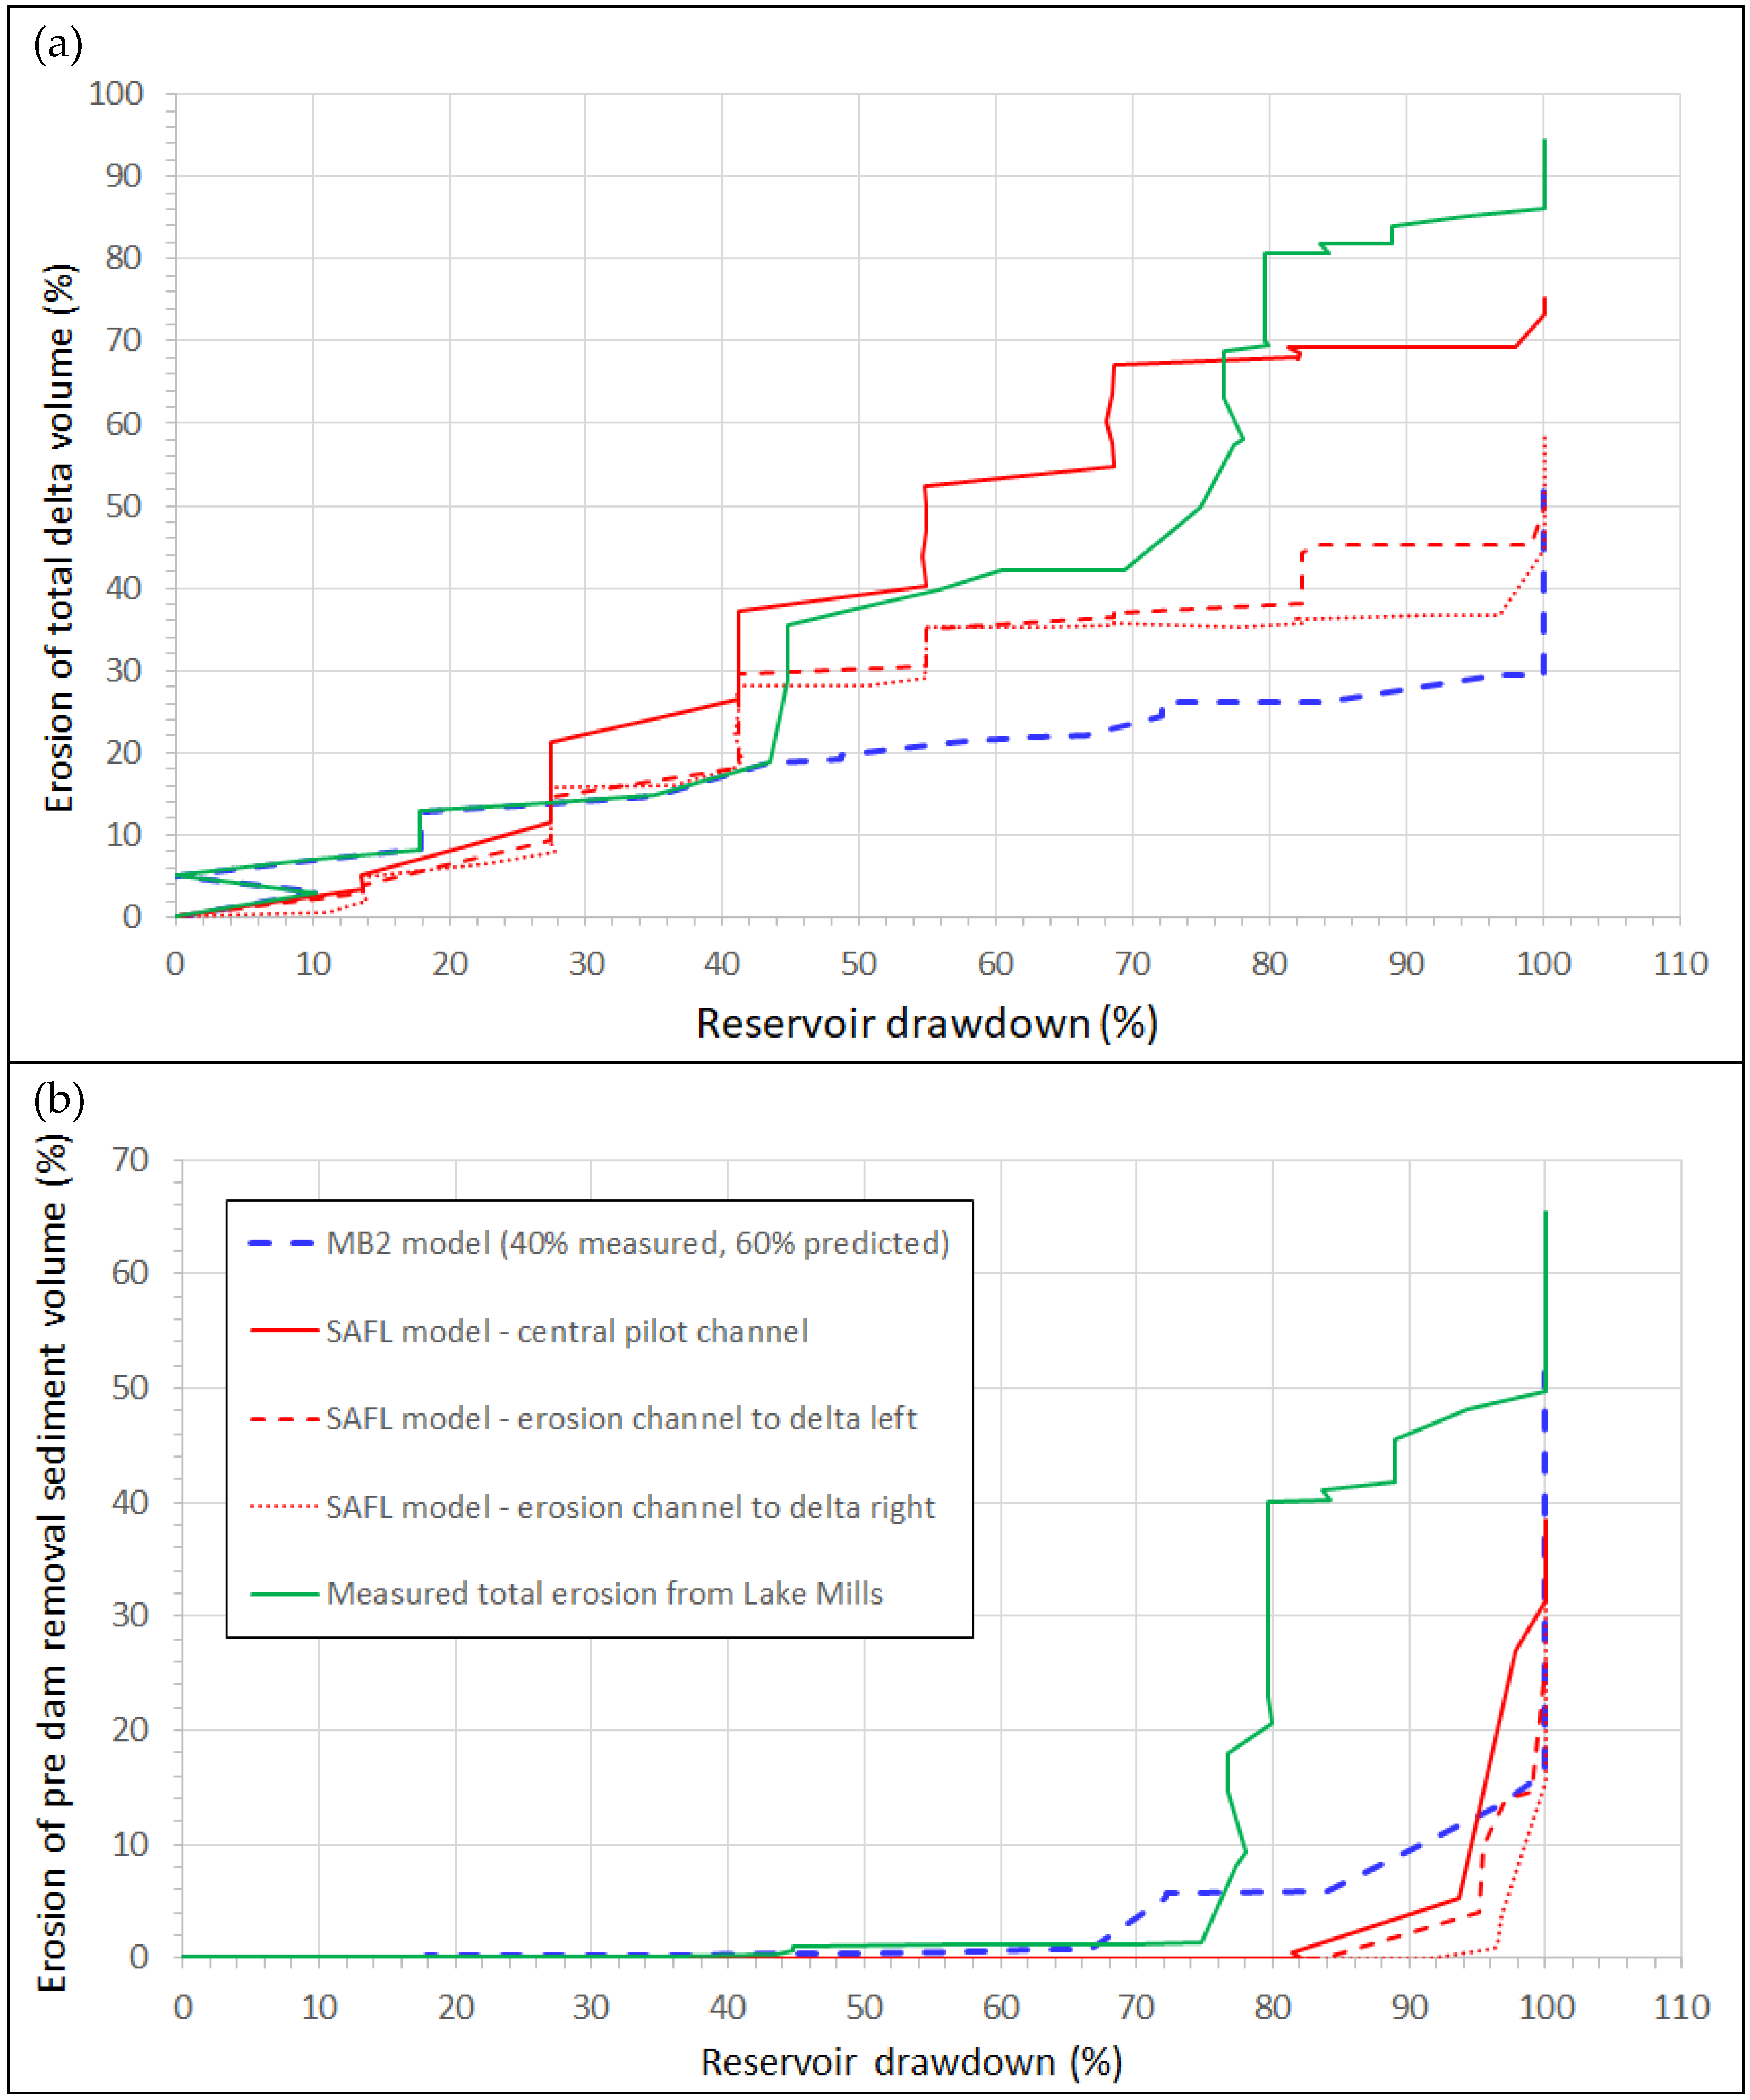
Figure 5.
Comparison of SAFL and MB2 model simulations with observed values of (a) Lake Mills delta erosion and (b) total erosion past the dam site. MB2 results for the first 40% of reservoir drawdown were set equal to the monitored delta erosion widths and longitudinal erosion slope (Bountry et al., 2018). Results for the next 60% are the predictions made during dam removal. The (near) vertical sections of plots are periods of constant water surface elevation. The (near) horizontal sections of plots are periods of falling water surface elevation.
At 94% of full drawdown, significant incision was observed throughout the reservoir due to the effect of the one-year hold period and the observed and MB2 long profiles were similar. By 98% drawdown, the SAFL model had incised close to the pre-dam long profile in the downstream half of the reservoir. In the upstream half, however, the long profile remained 7-9% higher than observed in the field, probably for two reasons. First, the armoring scale effect helped lock the long profile into a steeper configuration at an earlier stage of dam removal. Second, within the area occupied by the initial delta the incising channel encountered the model basin boundary at a different and higher elevation location than that of the pre-dam channel.
In MB2, the channel did not incise to the pre-dam profile until after complete dam removal and passage of a 2-year flood, as was observed in the field. At that time, the MB2 and observed profiles both closely matched the pre-dam profile, except for local differences that were probably related to differences between the pre- and post-dam planform positions of the channel. In contrast, the long profile in the SAFL model still did not match that of the pre-dam channel as closely as was observed in the field and simulated using MB2, probably for the two reasons stated above.
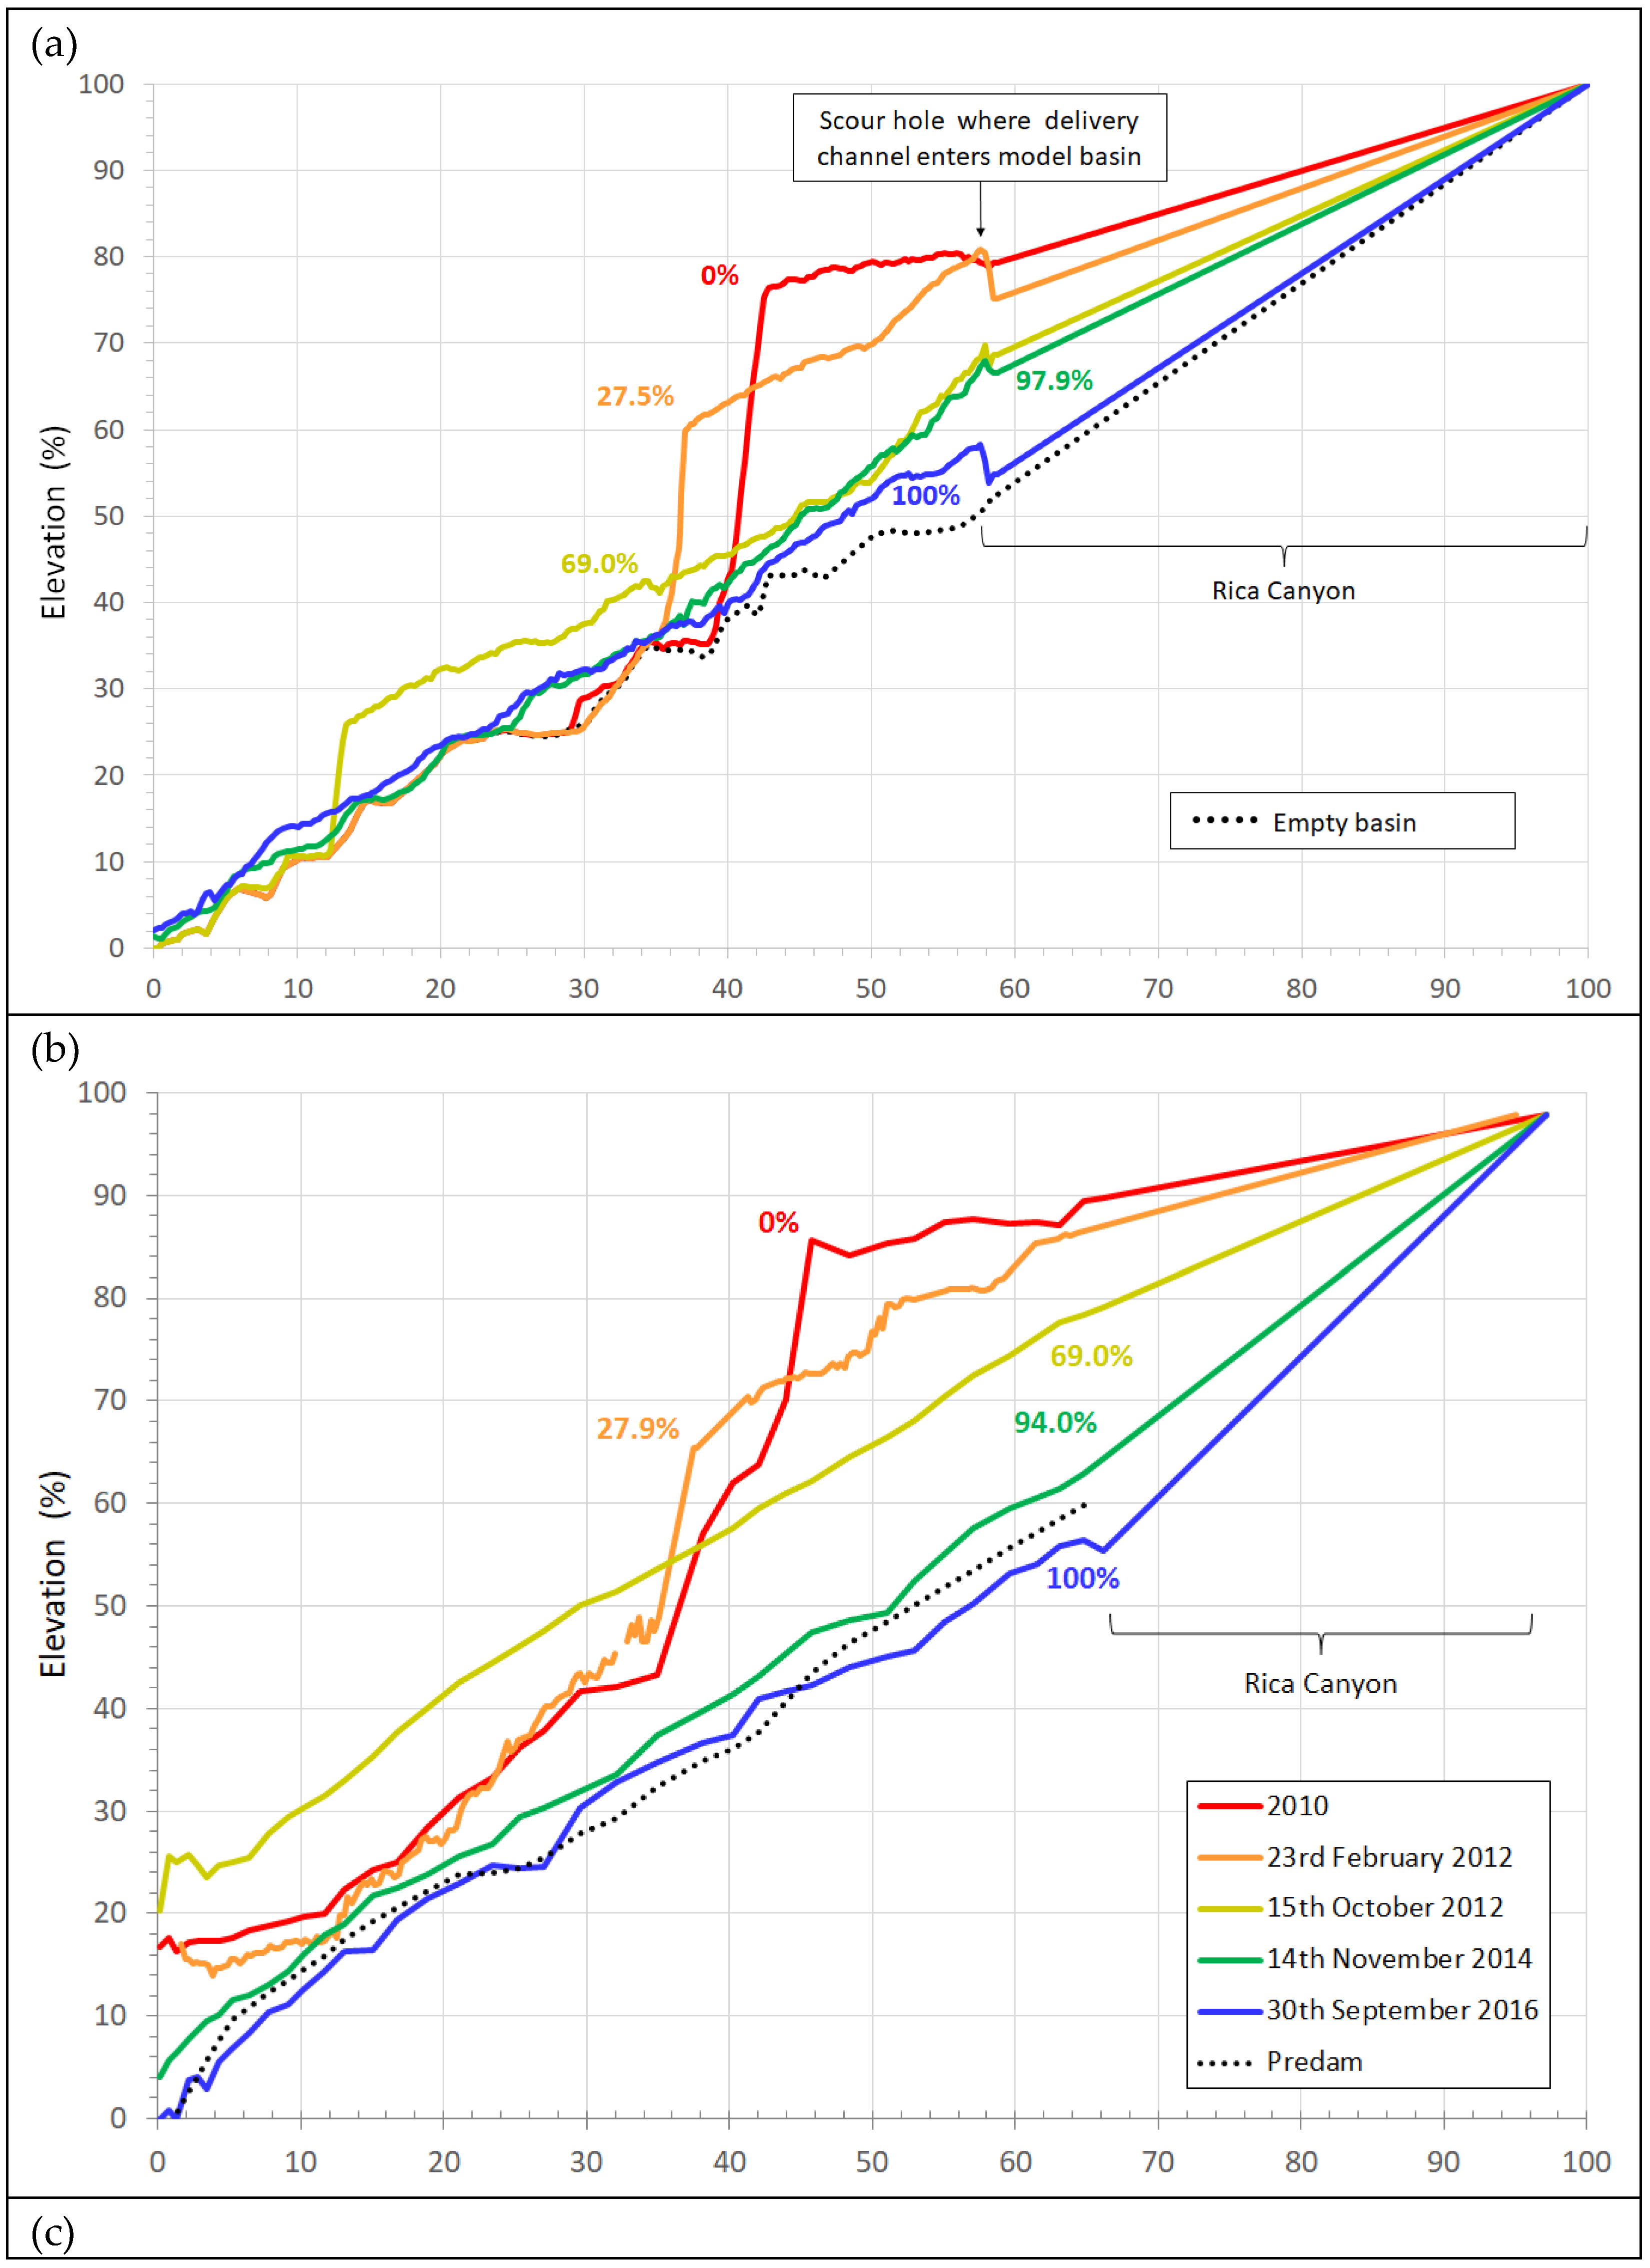
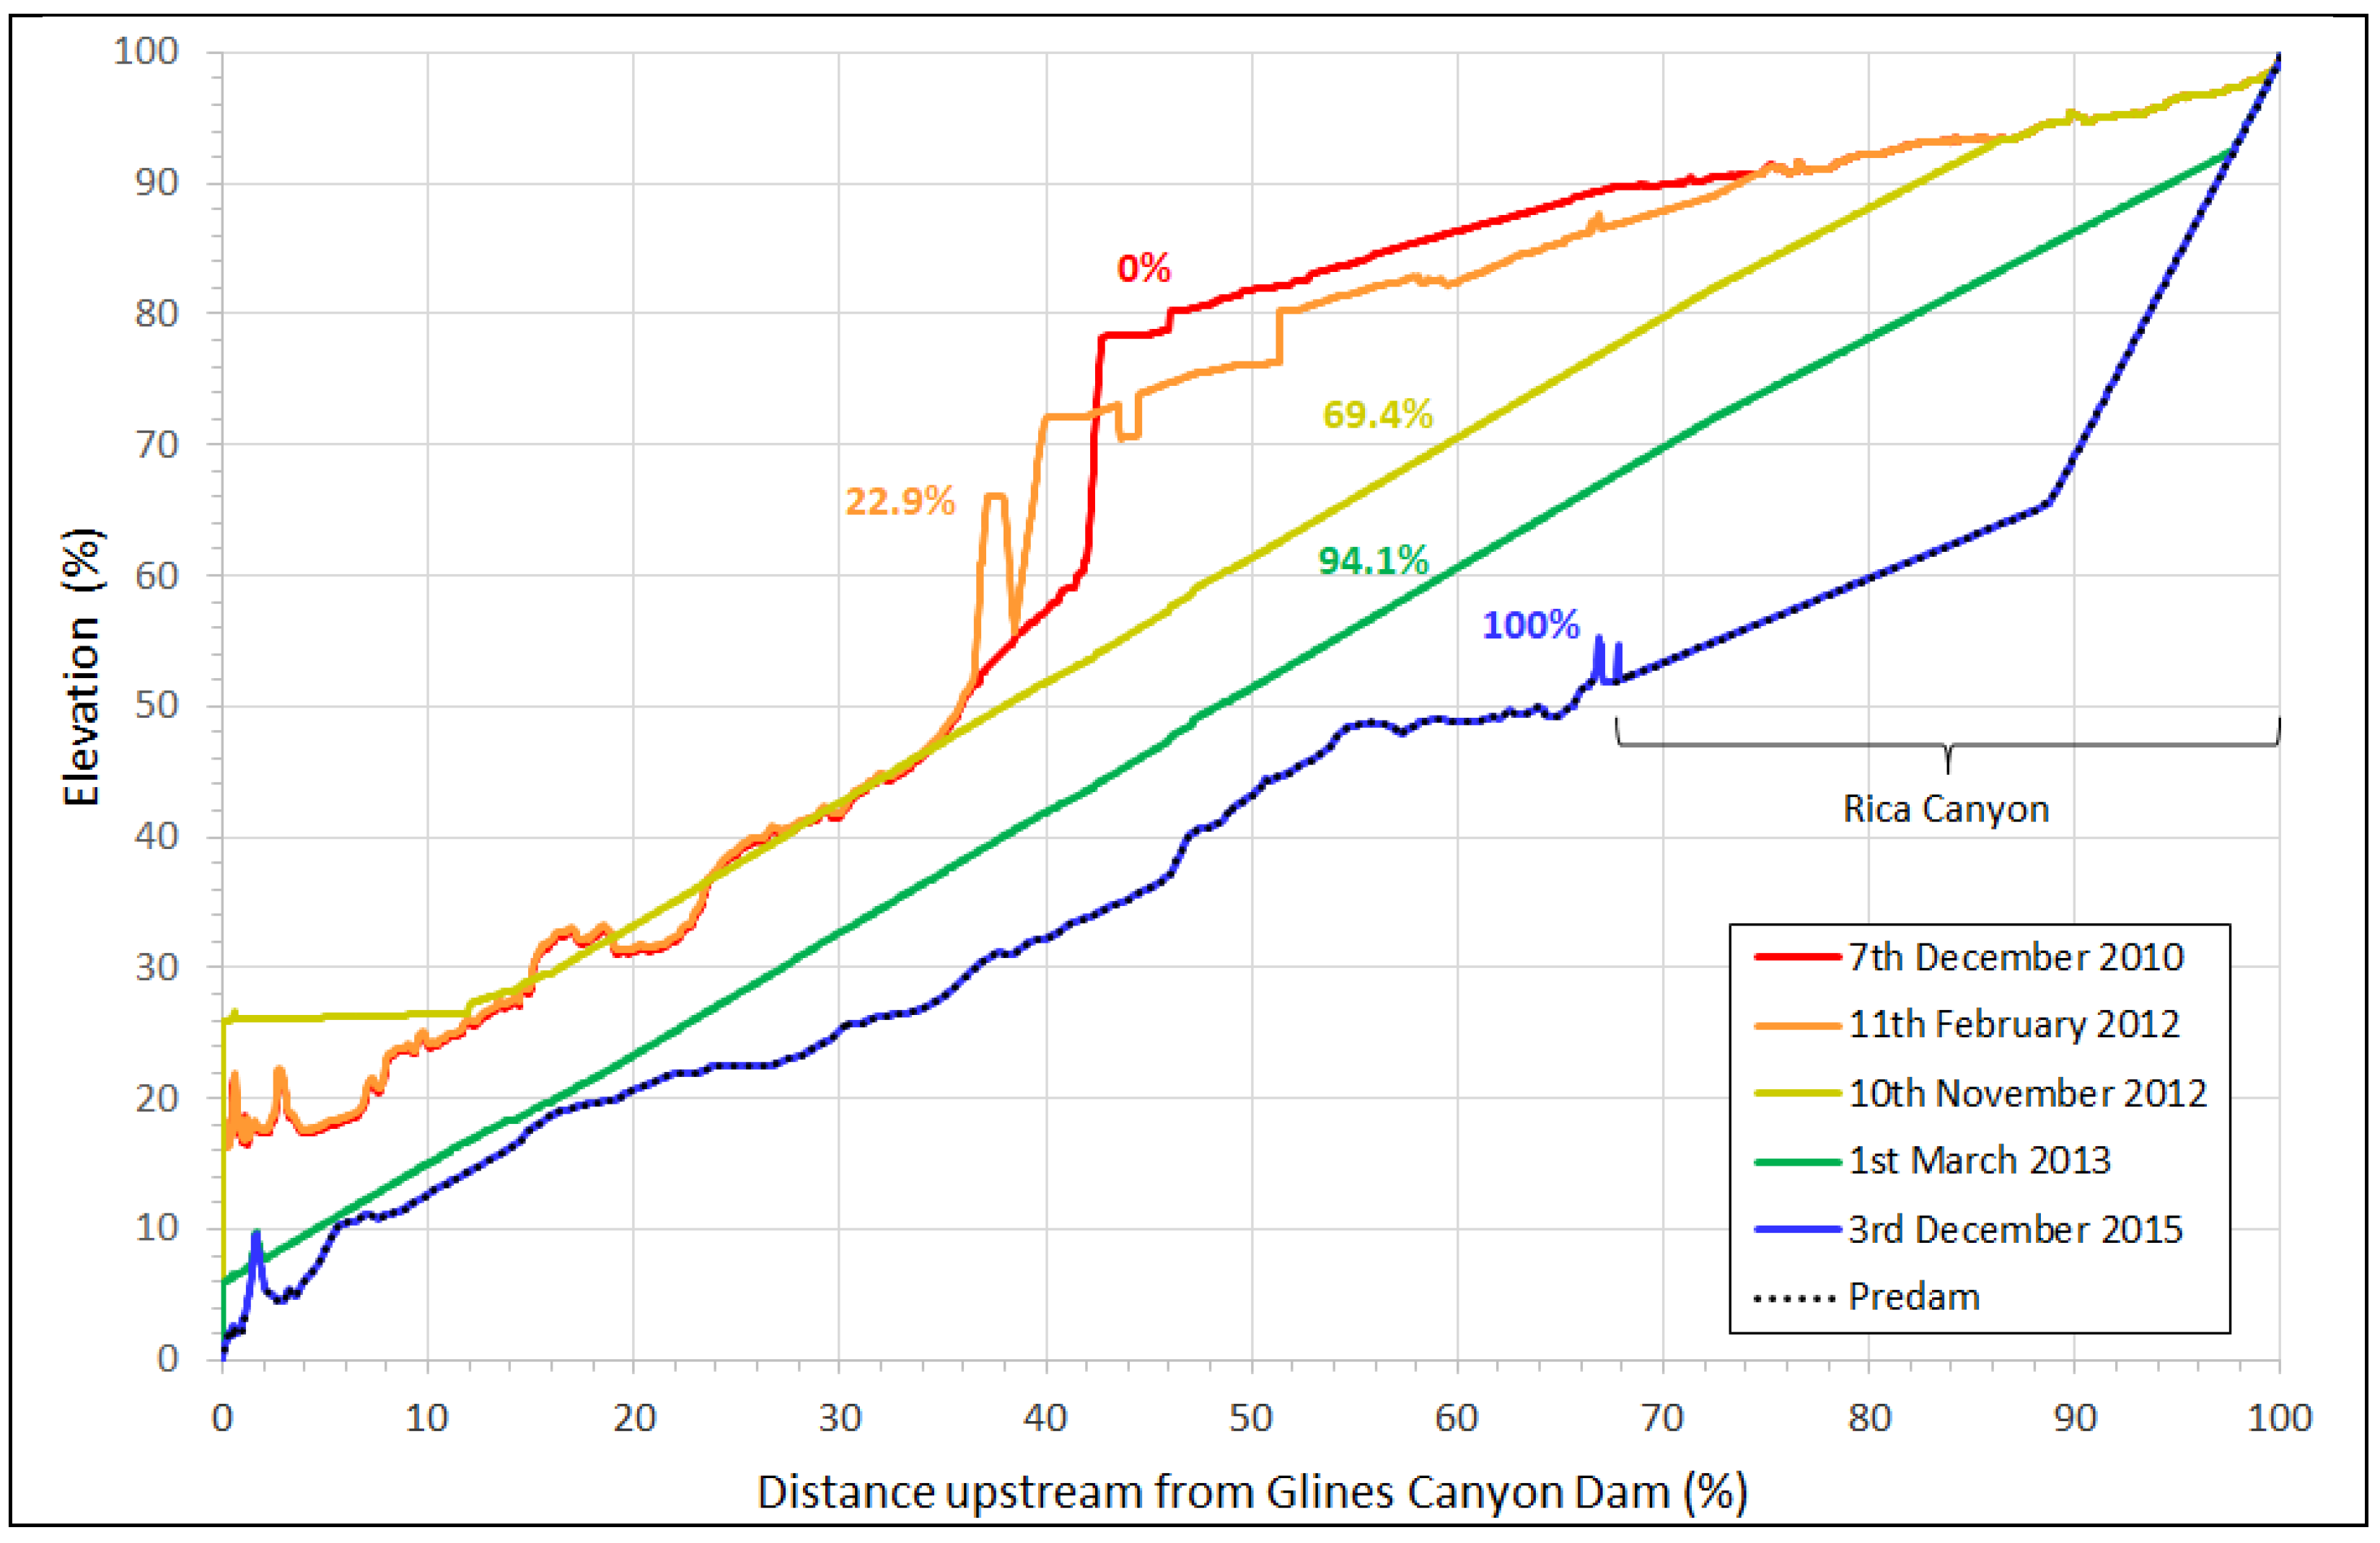
Figure 6.
Longitudinal delta erosion profiles for percentage reservoir drawdown simulated (a) by the SAFL model, (b) measured field observations during dam removal and (c) by the MB2 model. The percentages of reservoir drawdown are labeled for each graphed line.
Figure 6.
Longitudinal delta erosion profiles for percentage reservoir drawdown simulated (a) by the SAFL model, (b) measured field observations during dam removal and (c) by the MB2 model. The percentages of reservoir drawdown are labeled for each graphed line.
4.3. Comparison of Planform Evolution
Natural geologic controls from tributary deltas, exposed bedrock, and pre dam terraces were represented in the models, which improved the accuracy of simulated planform adjustments. In particular, the Boulder Creek delta (Figure 1) pushed flow towards the right half of the reservoir basin and protected the high left bank terrace downstream over a distance of two kilometers. Also represented in the SAFL model and MB2 was the process of prograding delta sediment forming high terraces (>10m) and slowing lateral planform erosion through basal endpoint control (the balance established between the erosion and removal of failed bank material from the base of the bank and the material being supplied from the bank and the upstream channel (Thorne and Osman, 1988) once the reservoir was gone.
The SAFL model pilot channel run, MB2, and observed conditions all showed complex planform evolution that involved switching between single-thread and multi-thread channels at different times and locations on the delta surface (Figure 7). Stream flows during August and September 2013 (80% drawdown) were low and the incising channel was observed to narrow in response. This behavior was replicated in MB2 (Figure 7h&l). The SAFL model did not reproduce channel narrowing, because it was run with a steady discharge. In the SAFL model, channel width varied considerably as the planform switched between being single thread during periods of rapid incision and wandering or braided when inputs of sediment from eroding terraces were high.
4.4. Fine Sediment Concentrations
For the removal of Glines Canyon Dam and Lake Mills, MB2 was calibrated by adjusting the representative grain size, and thus fall velocity, so that simulated suspended sediment concentration (converted to turbidity) patterns matched those measured downstream from Lake Aldwell reasonably well for the period during which Elwha Dam was removed (Figure 8). During that period, most of the eroded fine sediments were released from Lake Aldwell, which had been completely drained by March 2012.
In April 2012, Lake Mills had been drawn down 43% and the pool was still trapping a portion of the fine sediment. Daily predictions of turbidity made using the MB2 model assumed it was solely a function of fine sediment concentration although, in reality, suspended sand also contributed to turbidity (Bountry et al., 2018; Magirl et al., 2015).
In practice, MB2 predicted that turbidity would be less than 20 Formazine Nephelometric Units (FNU) and greater than 1,000 FNU on twice as many days as was observed in the field and underestimated the number of days that turbidity would exceed 20 and 100 FNU. MB2 assumed that knickzones would stop migrating upstream during hold periods, when in fact they took months to migrate the 3 km to Rica Canyon (Figure 1). This protracted head cutting continued to supply substantial amounts of fine sediment downstream during the hold periods. Because MB2 underestimated lateral erosion rates for coarse, non-cohesive sediments while over-estimating lateral erosion rates for fine, somewhat cohesive sediment, MB2 over-estimated fine sediment concentrations during floods. Prediction of suspended sediment levels was further complicated by the fact that dam removal and reservoir drawdown (base-level lowering) decoupled concentrations from flows, thus exhibiting a wide range of values for a given flow.
5. Discussion
Experience gained during the project identified two challenges associated with the numerical modeling of sediment entrainment, transport and deposition within the reservoir footprint during a phased dam removal with a large, complex sediment deposit. First, it proved challenging to accurately replicate the wide range of geomorphic processes that occurred in the field. Second, long run times and an inability to simulate the magnitude of lateral adjustment with a 2D model would have made it difficult to obtain accurate results quickly enough to be of use in guiding real-time, adaptive management decision making. These problems prompted the development of the mass balance model.
Accurate replication of geomorphic processes in these settings was challenging for several reasons. The range of fluvial processes encountered exceeds those observed during the ‘normal’ functioning of an alluvial river, particularly when large amounts of sediment are eroded quickly and when this erosion is decoupled from larger flows. In numerical models of river channels, degradation and the downstream transport of bed sediments may create an armor layer that limits bed material transport until it is breached, which usually only occurs during a major flood. Hence, once the armor layer forms, downstream sediment transport is governed by the competence of the discharge to mobilize a certain portion of the bed armor, with the bed only becoming fully mobile at about the 2-year flow (Thorne et al., 1987). In contrast, during dam removal, the rate of sediment transport can become decoupled from the discharge such that discharges substantially smaller than the 2-year flood are able to transport large volumes of sediment. This occurs because rapid base level lowering coupled with abrupt changes in channel pattern and pathway across the delta surface as the stream follows the shortest route to the deeper parts of the reservoir, introduce migratory knickzones that undermine the armor layer, causing it to erode and preventing it from reforming for sustained periods of time (Bromley, 2007). As a result, channels are able to incise more rapidly and more deeply than would be possible in a river not experiencing base level lowering. In turn, this drives lateral erosion through a wide array of processes including meandering, topographical steering of flow by one terrace into another, braiding, avulsion, mass wasting and basal endpoint clear-out.
Each increment of base-level lowering triggers a characteristic cycle of channel incision, widening and planform movement and metamorphosis. When the next increment of lowering starts before the previous cycle of channel adjustment is complete, further morphodynamic complexity ensues. The experiences of Konrad (2009) and Lai (2014) in attempting to simulate sediment transport and morphodynamic responses to dam removal on the Elwha River illustrate the difficulties of applying both 1D and 2D models in such environments.
These complexities are most likely to arise during the phased removal of larger dams, where the vertical fall in base level is proportionately large, the delta is much wider than the incising channel, and the great distance between the dam and the upstream boundary of the sediment delta means that eroded sediments will prograde into the shrinking reservoir pool. When the degree of vertical change is restricted and lateral adjustments are more muted, simulation using 2D or 3D process-based models may be more feasible (e.g. Lai, 2015). For example, once the incising channel has reached the pre-dam profile and a smaller number of fluvial processes are occurring, or in narrower sections of valley where lateral adjustments are more constrained.
The wide range of fluvial processes operating when a large dam is removed emphasizes the critical importance of developing a good conceptual model. Such a model not only helps to guide decision making early in dam removal design but also supports the selection and calibration of appropriate mass balance, physical and/or 1D/2D numerical models. Once the quantitative model(s) have been optimized, a good conceptual model also helps the sediment management team interpret quantitative model outputs. If a multi-dimensional model is selected, the conceptual model provides the basis for identifying which of the complex fluvial processes must be simulated, as it is unlikely the model could successfully be used ‘straight off-the-shelf.’
Even with a good conceptual understanding of the key morphodynamic processes, finessing a multi-dimensional numerical model to adequately simulate them remains challenging. Even if this can be achieved, model run times are likely to be on the order of weeks. This may be acceptable for pre-removal planning purposes, but it rules out the use of deterministic, process-based numerical modeling to inform real-time, adaptive management during dam removal, which may require a decision to be made within days, or at best a few weeks. Recourse must therefore be made to a reduced complexity approach, with a well-calibrated, mass balance model proving to be the right tool for this task during removal of the Elwha River dams.
When the Elwha River dam removals were being planned and permitted in the 1990s, the mass balance model MB1 (and later MB2) represented an innovative and, to an extent, experimental approach, but going forward, similar models could be developed for any dam removal where the investment of time required is merited by the level of sediment-related risk. For the Elwha River dams, MB2’s predictive capabilities with respect to sediment erosion and export rates, morphodynamics and downstream turbidity all proved useful prior to, and during, dam removal. The ability to periodically update boundary conditions in the MB2 (and possibly recalibrate) as the dam removal progresses, reduced the predictive uncertainty over time.
The wide availability of powerful desktop computers now makes probabilistic modeling using a mass balance model feasible, especially if models are set running simultaneously on multiple machines. The need for probabilistic modeling reflects irreducible uncertainties that cannot be resolved in a deterministic model. For example, it would allow the sediment management team to explore a range of realistic initial values for key variables and coefficients in the model that are difficult to define precisely, e.g. representative discharge, grain size distribution, terrace erodibility, the size of draw down increments, the length of hold periods, and issues at downstream water abstraction points. Probability distributions could be developed for each variable and thousands of simulations run to identify the most likely system responses and thus to make quantitative calculations of future risks and benefits. We are not aware of this having been attempted to date for a sediment transport model.
Adaptive management is well suited for phased dam removals, as the intervals between drawdown increments provide the time required to modify multiple aspects of the adopted sediment management strategy, e.g., the duration of hold periods. The key requirement is to quickly and accurately predict the volume, caliber and rate at which sediment enters the downstream system and for three practical reasons a mass balance model may currently be the best tool for doing this. First, model simulations can be set up, run and interpreted within a single day, which matches the time scale needed for adaptive management reviews and decision making. Second, these short run times allow the model’s delta surface geometry to be updated in real time with field-monitored data defining current channel slopes, bank lines, and planform patterns. This significantly improves model accuracy and provides better understanding of what to expect during subsequent time steps, with or without an adaptive change to the removal plan or sediment management strategy. Third, once lateral erosion coefficients for coarse and fine sediments have been calibrated using monitoring data, erosion rates and volumes can be predicted more accurately, thus increasing confidence that the removal plan will perform as designed or that it requires modification. Identifying appropriate values for model coefficients again emphasizes the need for a good conceptual model that correctly identifies all the major processes-form interactions likely to occur, coupled with field measurements of actual erosion made during the early phases of dam removal. Conceptual modeling and a field monitoring program that start prior to dam removal and continue during dam removal are thus vital for successfully utilizing a mass balance model to support adaptive management decision making. Significant monitoring elements that contributed to the success of the Elwha adaptive management modeling included near real-time structure-for-motion photogrammetry (Ritchie et al., 2025), discharge, turbidity data, web cameras, reservoir stage, and field inspections of reservoir landscape evolution (Ritchie et al., 2018).
Experience gained at the Elwha River demonstrates the value of physical modeling. For example, the decision to excavate the pilot channel would not have been made without the palpable evidence of its effectiveness that only a physical model like that operated at SAFL could provide. That said, caution must be exercised when interpreting quantitative system behavior based on the outcomes of physical models, due to unavoidable scale effects. In the SAFL model, disproportionately large, armor-forming clasts influenced the evolution of the incising channel’s long profile and, hence, the absolute amounts of vertical and lateral erosion. Inaccurate boundary conditions, such as the absence of fine-grained, delta bottomsets, also led to differences in system behavior in the model when compared to what actually happened. Even if bottomsets had been included in the SAFL model, the impossibility of accurately scaling cohesion when model scale exceeds 1:1 would have precluded perfect replication of the influence of fine-sediments on the morphodynamics observed in Lake Mills.
Accurately assessing the cohesive strength of fine sediment field samples is itself challenging. Tests of samples from Lakes Mills showed no significant cohesion, but they contained just enough clay and organic material to ensure that flows running parallel to fine sediment banks and terraces generally eroded them less than three meters, which resulted in the channel remaining narrower than expected. Conversely, when the flow struck the same type of sediments at an angle more extensive erosion occurred. This suggests that the laboratory test for cohesion, which is designed to identify issues associated with the loadings imposed by buildings or roads, may be inappropriate for fluvial applications. These difficulties notwithstanding, the qualitative process similarities of the physical model and drawdown experiment compared to those of the full dam removal demonstrate the vital role these studies play in informing conceptual modeling and the formulation of numerical and mass balance models.
Incoming Elwha River sediment from the upper watershed was accounted for in the MB1 and MB2 models, but in the actual dam removal was initially inconsequential because large floods did not occur until after dam removal was complete. One boundary condition not addressed in any of the Elwha models was sediment inputs from tributaries that had input sediment to the delta and which also incised during dam removal. This omission was inconsequential because the Elwha tributaries are much smaller than the mainstream river and their lateral evolution lagged behind that of the mainstem. As a result, they contributed only about 1.5% of the sediment trapped in the reservoir. However, in reservoirs where tributaries have provided a significant proportion of accumulated sediment, they should be considered during sediment management planning and adaptation. Where tributary deltas have the potential to control patterns of erosion and redistribution of sediments during dam removal, they should also be included, as was done for Boulder Creek in this study. The downstream boundary condition for tributary models would be the receding reservoir water surface elevation, and fluvial processes and morphodynamics could be simulated using either a 1D or a 2D model as appropriate for the degree to which the tributary is laterally confined.
6. Conclusions
Experienced gained over the three decades during which removal of the Elwha River dams was planned and executed, coupled with the results of monitoring restoration of the Elwha River and its sediment system, has provided useful insights into both the complex and protracted evolution of deltas in the reservoirs of large, incrementally-removed dams, and into the nature, rate and duration of elevated sediment concentrations, bed profile adjustments, and planform changes in the river downstream. The work has highlighted the relative strengths and weaknesses of conceptual, numerical, physical, and reduced complexity ma
ss balance models in simulating the complex morphodynamic behavior of river systems impacted by large dam removals, and of using multiple models in a complimentary fashion to provide the best possible sediment management advice. Also emerging from this work is an appreciation of the value of synoptically, which provides a framework for synthesizing data and experience on system attributes and behaviors from a range of models and disciplinary viewpoints. It is hoped that the experiences reported in this paper will be useful to others tasked with managing the sediment-related uncertainty associated with other high-risk dam-removal projects.
Author Contributions
Chris Bromley was lead author of the paper and conducted all the physical modeling of Lake Mills. Timothy J. Randle was developer of the mass balance models (versions 1 and 2) and Jennifer A. Bountry conducted the mass balance model runs during the project. Bountry and Randle participated in data collection and led data analyses and numerical modeling efforts in support of the adaptive management program before, during and after dam removal. Bromley, Randle, Bountry, and Thorne collaboratively developed the concept and outline for the paper, and all participated in writing and editing. All authors have read and agreed to the published version of the manuscript.
Funding
Doctoral research performed by Chris Bromley while at Nottingham University was funded by the US Forest Service, Pacific Northwest Research Laboratory; Colorado State University; the National Centre for Earth-surface Dynamics (NCED) through the STC Program of the National Science Foundation under Agreement Number EAR-0120914; the National Park Service; and the US Bureau of Reclamation Science and Technology Program under contract No. 05PG810011. Colin Thorne’s contribution to the paper was supported by the Engineering and Physical Sciences Research Council (grant numbers EP/K013661/1 & EP/N008103/1). Timothy J. Randle and Jennifer A. Bountry were employed by the Bureau of Reclamation.
Data Availability Statement
Rectified orthophotographs of the Elwha River, including Lake Mills and Lake Aldwell are hosted by Service: U.S. Geological Survey data service at https://cmgds.marine.usgs.gov/data-services/rscc/Elwha_PlaneCam/.
Acknowledgments
We thank Gordon Grant, Chester Watson, and Gary Parker for their support of that doctoral research conducted by Chris Bromley. Reviews by Michael Burke, Kristen Covaleski, Marty Melchior and anonymous reviewers significantly improved the manuscript and are gratefully acknowledged.
Conflicts of Interest
The authors declare no conflicts of interest.
Abbreviations
The following abbreviations are used in this manuscript:
| 1D | One-dimensional |
| 2D | Two-dimensional |
| MB1 | Mass balance model version 1 |
| MB2 | Mass balance model version 2 |
References
- For the final manuscript, references will be numbered in order of appearance in the text. For this review draft, references are listed in alphabetical order.
- American Rivers (2021). American Rivers dam removal database. Accessed 29th November 2021. 2021.
- Barbarossa, V., Schmitt, R.J.P., Huijbregts, M.A.J., Zarfl, C., King, H. & Schipper, A.M. (2020) Impacts of current and future large dams on the geographic range connectivity of freshwater fish worldwide. Proceedings of the National Academy of Sciences, 117(7), 3648–3655. Available from: https://doi.org/10.1073/pnas.1912776117. [CrossRef]
- Beechie, T.J., Liermann, M., Pollock, M.M., Baker, S., Davies, J., 2006. Channel pattern and river–floodplain dynamics in forested mountain river systems. Geomorphology 78, 124–141.
- Bergstedt, L.C. and Bergersen, E.P., 1997. Health and movements of fish in response to sediment sluicing in the Wind River, Wyoming. Canadian Journal of Fisheries and Aquatic Sciences, 54: 312-319.
- Bellmore J. Ryan, Duda Jeffrey J., Craig Laura S., Greene Samantha L., Torgersen Christian E., Collins Mathias J., Vittum Katherine, (2016). Status and trends of dam removal research in the United States. WIREs Water 2016. [CrossRef]
- Bellmore J.R., Pess, G.R, Duda, J.J., O’Connor, J.E, East, A.E., Foley, M.M., Wilcox, A.C., Major, J.J., Shafroth, P.B., Morley, S.A., Magirl, C., Anderson, C.W., Evans, J.E., Torgersen, C.E., Craig, L.S. (2019). Conceptualizing Ecological Responses to Dam Removal: If You Remove It, What's to Come?, BioScience, Volume 69, Issue 1, 26-39. 69. [CrossRef]
- Birnie-Gauvin, K., Nielsen, J., Frandsen, S.B., Olsen, H.M. & Aarestrup, K. (2020) Catchment-scale effects of river fragmentation: A case study on restoring connectivity. Journal of Environmental Management, 264, 110408. Available from: https://doi.org/10.1016/j.jenvman.2020.110408. [CrossRef]
- Bountry, J.A., Ferrari, R., Wille, K., T.J. Randle, (2011). 2010 Survey Report for Lake Mills and Lake Aldwell on the Elwha River, Washington, SRH-2010-23, U.S. Department of the Interior, Bureau of Reclamation, Denver, CO, June 2011. 20 June.
- Bountry, J., Randle, T.J., Ritchie, A.C., 2018. Adaptive Sediment Management Program Final Report for the Elwha River Restoration Project, Technical Report SRH-2018-13, U.S. Department of the Interior, Bureau of Reclamation, Geological Survey, National Park Service, Denver, CO, February 2018.
- Bromley, C., 2007. The Morphodynamics of Sediment Movement Through a Reservoir During Dam Removal. (PhD Thesis). University of Nottingham, p. 316.
- Bundgaard, R.C. 1951. A procedure of short-range weather forecasting. In: Byers, H.R.,Landsberg, H.E., Wexler, H., Haurwitz, B., Spilhaus, A.F., Willett, H.C., Houghton, H.G. and Malone, T.F, ed., Compendium of Meteorology. American Meteorological Society, Boston, MA, pp. 766-795.
- Cheng, F. and Granata, T., 2007. “Sediment transport and channel adjustments associated with dam removal: field observations.” Water Resources Research, 43:W03444.
- Childers, D., Kresch, D.L., Gustafson, D.L., Randle, T.J., Melena, J.T. Cluer, B. 2000. Hydrological Data Collected During the 1994 Lake Mills Drawdown Experiment, Elwha River, Washington. Water Resources Investigations Report, 99-4215, U.S. Geological Survey, Tacoma, WA. 115 pp.
- Collins, Mathias J., Noah P. Snyder, Graham Boardman, William S.L. Banks, Mary Andrews, Matthew E. Baker, Maricate Conlon, et al. (2017). Channel Response to Sediment Release: Insights from a Paired Analysis of Dam Removal. Earth Surface Processes and Landforms. [CrossRef]
- Cui, Y., Wooster, J.K., Braudrick, C.A., Bruce, K. (2014) Lessons Learned from Sediment Transport Model Predictions and Long-Term Postremoval Monitoring: Marmot Dam Removal Project on the Sandy River in Oregon, Journal of Hydraulic Engineering, Volume 140, Issue 9. [CrossRef]
- Cui, Y., Collins, M. J., Andrews, M., Boardman, G. C., Wooster, J. K., Melchior, M., & McClain, S. (2018). Comparing 1-D sediment transport modeling with field observations: Simkins Dam removal case study. International Journal of River Basin Management, 17(2), 185–197. [CrossRef]
- Dam Removal Europe (2021). Website Case studies - Dam Removal Europe accessed on 2nd March 2021.
- Doyle, M.W., E.H. Stanley, J.M. Harbor, (2003). Channel adjustments following two dam removals in Wisconsin, Water Resources Research, 39(1), 1011. [CrossRef]
- Duda, J. J., Warrick, J. A., & Magirl, C. S. (Eds.). (2011). Coastal Habitats of the Elwha River, Washington: Biological and Physical Patterns and Processes Prior to Dam Removal. US Department of the Interior, US Geological Survey.
- Duda, J.J., Wagner, E.J., Wieferich, D.J., Johnson, R.C., and Bellmore, J.R., (2018), USGS Dam Removal Science Database v3.0 (ver. 4.0, June 2021): U.S. Geological Survey data release, USGS Dam Removal Science Database v4.0 - ScienceBase-Catalog. 20 June.
- Duda, J.J., Torgersen, C.E., Brenkman, S.J., Peters, R.J., Sutton, K.T., Connor, H.A., et al. (2021) Reconnecting the Elwha River: Spatial patterns of fish response to dam removal. Frontiers in Ecology and Evolution, 9, 765488. Available from: https://doi.org/10.3389/fevo.2021.765488. [CrossRef]
- Dynesius, M. and Nilsson, C., 1994. Fragmentation and Flow Regulation of River Systems in the Northern Third of the World. Science, 266(5186): 753-762.
- East, A.E., Pess, G.R., Bountry, J.A., Magirl, C.S., Ritchie, A.C., Logan, J.B., Randle, T.J., Mastin, M.C., Duda, J.J., Liermann, M.C., McHenry, M.L., Beechie, T.J., Shafroth, P.B., (2015). Large-scale dam removal on the Elwha River, Washington, USA: river channel and floodplain geomorphic change. Geomorphology. [CrossRef]
- East, A.E., Harrison, L.R., Smith, D.P., Logan, J.B. & Bond, R.M. (2023) Six years of fluvial response.
- to a large dam removal on the Carmel River, California, USA. Earth Surface Processes and Landforms, 48(8), 1487–1501. Available from: https://doi.org/10.1002/esp.556. [CrossRef]
- Federal Energy Regulatory Commission, 2022, Final Environmental Impact Statement for Hydropower License Surrender and Decommissioning, Federal Energy Regulatory Commission Office of Energy Projects, https://elibrary.ferc.gov/eLibrary/filelist?accession_number=20220826-3006.
- Gilbert, J. and Link, R., 1995. Alluvium distribution in Lake Mills, Glines Canyon Project and Lake Aldwell, Elwha Project, Washington. Elwha Technical Series PN-95-4, U.S. Bureau of Reclamation, Pacific Northwest Region, Boise, ID. 72 pp.
- Grant G.E., O’Connor J.E., and Wolman M.G. (2013). A River Runs Through It: Conceptual Models in Fluvial Geomorphology. In: John F. Shroder (ed.) Treatise on Geomorphology, Volume 9, pp. 6-21. San Diego: Academic Press.
- Hess, J.E., Paradis, R.L., Moser, M.L., Weitkamp, L.A., Delomas, T.A. & Narum, S.R. (2020) Robust recolonization of Pacific lamprey follow ing dam removals. Transactions of the American Fisheries Society, 150(1), 56–74. Available from: https://doi.org/10.1002/tafs.10273. [CrossRef]
- Heinz Centre, 2002. Dam Removal: Science and Decision Making. The H. John Heinz III Center for Science, Economics and the Environment, Washington, D.C., 221 pp.
- Hosey and Associates, 1990. Distribution and Composition of Sediments Stored in Lake Aldwell and Lake Mills and Sediment Transport Characteristics (unpublished report). Elwha Project (FERC No. 2683) and Glines Project (FERC No. 588), James River II, Inc., Port Angeles, WA.
- Ibisate, A., Ollero, A., Ballarin, D., Horacio, J., Mora, D., Mesanza, A., et al. (2016) Geomorphic monitoring and response to two dam removals: Rivers Urumea and Leitzaran (Basque Country, Spain). Earth Surface Processes and Landforms, 41(15), 2239–2255. Available from: https://doi.org/10.1002/esp.4023. [CrossRef]
- Konrad, C.P (2009). Simulating the recovery of suspended sediment transport and river-bed stability in response to dam removal on the Elwha River, Washington. Ecological Engineering, 35, 1104-1115. doi:10.1016/j.ecoleng.2009.03.018.Lai, Y.G. 2014. Modeling of delta erosion during Elwha Dam removal with SRH-2D. Technical Report No. SRH-2014-31, U.S. Bureau of Reclamation. 49pp.
- Lai, Y.G. 2014. Modeling of delta erosion during Elwha Dam removal with SRH-2D. Technical Report No. SRH-2014-31, U.S. Bureau of Reclamation. 49pp.
- Lai, Y.G. 2015. Bank erosion modeling with SRH-2D on the Rio Grande, New Mexico. Proceedings of SEDHYD-2015, 3rd Joint Federal Interagency Conference, April 19-23, 2015, Reno, NV. 19 April.
- Leung, V., Mohrig, D.C., Buttles, J.L., Johnson, J.P. and Montgomery, D.R. (2019). Flume experiments on the effects of buried wood debris on delta processes and sediment exhumation during a phased base-level drop. In: Leung, V., Large woody debris and river morphology in scour pool formation, dam removal, and delta formation, PhD Dissertation, University of Washington, pp. 88-119.
- Magilligan, F. J., Graber, B. E., Nislow, K. H., Chipman, J. W., Sneddon, C. S., & Fox, C. A. (2016). River restoration by dam removal: Enhancing connectivity at watershed scales. Elementa: Science of the Anthropocene, 4(1), 000108. [CrossRef]
- Magirl, C.S., Hilldale, R.C., Curran, C.A., Duda, J.J., Straub, T.D., Domanski, M., Foreman, J.R., 2015. Large-scale dam removal on the Elwha River, Washington, USA: fluxes of river sediment. Geomorphology Volume 246, 1 October 2015, Pages 669-686. 1 October.
- Major, J.J., O’Connor, J.E., Podolak, C.J., Keith, K., Grant, G.E., Spicer, K.R., Pittman, S., Bragg, H.M., Wallick, J.R., Tanner, D.Q., Rhode, A. and Wilcock, P.R., (2012). Geomorphic Response of the Sandy River, Oregon to Removal of Marmot Dam, USGS Professional Paper 1792, 64 pp.
- Major, J.J., East, A.E., O'Connor, J.E., Grant, G.E. Wilcox, A.C., Magirl, C.S., Collins, M.J., Tullos, D.D., (2017), Geomorphic responses to dam removal in the United States-a two-decade perspective, in Tsutsumi, D. and Laronne, J.B., editors, Gravel-Bed Rivers: Processes and Disasters. John Wiley and Sons, p. 355-383.
- McAllister, D.E., Craig, J.F., Davidson, N., Delaney, S. and Seddon, M., 2001. Biodiversity Impacts of Large Dams, Background Paper Nr. 1 prepared for IUCN / UNEP / WCD. 63pp.
- National Research Council, 1996. Upstream: Salmon and Society in the Pacific Northwest. National Academy Press, Washington D.C., First Edition, 452 pp.
- O'Connor, J. E., Duda, J. J., and Grant, G. E., (2015). 1000 dams down and counting. Science 348 (6234), 496-497. [CrossRef]
- Packman, A.I. and MacKay, J.S., 2003. Interplay of stream-subsurface exchange, clay particle deposition, and streambed evolution. Water Resources Research, 39(4).
- Pejchar, L. and Warner, K., 2001. A river might run through it again: criteria for consideration of dam removal, and interim lessons from California. Environmental Management, 28(5): 561-575.
- Petts, G.E., 1984. Impounded Rivers: Perspectives for Ecological Management. John Wiley & Sons, New York.
- Poff, N.L., Allan, J.D., Bain, M.B., Karr, J.R., Prestegaard, K.L., Richter, B.D., Sparks, R.E. and Stromberg, J.C., 1997. The natural flow regime: A paradigm for conservation and restoration of river ecosystems. Bioscience, 47(11): 769-784.
- Pohl, M.M., 2002. Bringing down our dams: Trends in American dam removal rationales. Journal of the American Water Resources Association, 38(6): 1511-1519.
- Randle, T.J., Young, C.A., Melena, J.T., Ouellette, E.M., (1996). Sediment analysis and modeling of the river erosion alternative, Elwha River Ecosystem and Fisheries Restoration Project, Washington, Elwha Technical Series PN-95-9, U.S. Department of the Interior, Bureau of Reclamation, Boise, Idaho (136 pp).
- Randle, T.J., Bountry, J.A., Ritchie, A.C., Wille, K.B, (2015), “Large-scale dam removal on the Elwha River, Washington, USA: erosion of reservoir sediment,” Journal of Geomorphology Volume 246, 1 October 2015, Pages 709-728. 1 October.
- Randle, T.J., Bountry, J.A., Smillie, G., (2012a). Technical Basis for Elwha Restoration Adaptive Sediment Management and Monitoring Plan, Report Number: SRH-2012-10, Bureau of Reclamation and National Park Service, U.S. Department of the Interior.
- Randle, T.J., Bountry, J.A., Smillie, G., (2012b). Elwha River Restoration: Sediment Adaptive Management Summary, Report Number: SRH-2012-09, Bureau of Reclamation and National Park Service, U.S. Department of the Interior.
- Randle, T.J. and Bountry, J. (2017). Dam Removal Analysis Guidelines for Sediment. 58pp. Advisory Committee on Water Information, Subcommittee on Sedimentation, 179pp. last accessed at https://www.usbr.gov/tsc/techreferences/mands/mands-pdfs/DamRemovalAnalysisGuidelinesForSediment12-2017_508.pdf.
- Randle, T.J. and Bountry, J.A., Wille, K.B. (2021). Mass balance model for reservoir sediment erosion. 58pp. US Department of the Interior, Bureau of Reclamation, August 2021. Mass Balance Model for Reservoir Sediment Erosion (usbr.gov). 20 August.
- Reid, A.J., Carlson, A.K., Creed, I.F., Eliason, E.J., Gell, P.A., Johnson, P.T.J., Kidd, K.A., MacCormack, T.J., Olden, J.D., Ormerod, S.J., Smol, J.P., Taylor, W.W., Tockner, K., Vermaire, J.C., Dudgeon, D. and Cooke, S.J., 2018. Emerging threats and persistent conservation challenges for freshwater biodiversity. Biological Reviews. [CrossRef]
- Ritchie, A.C., Warrick, J.A., East, A.E., Magirl, C.S., Stevens, A.W., Bountry, J.A., Randle, T.J., Curran, C.A., Hilldale, R.C., Duda, J.J., Gelfenbaum, G., Miller, I.M., Pess, G.R., Foley, M.M., McCoy, R., Ogsten, A.S., (2018). Morphodynamic evolution following sediment release from the world’s largest dam removal. Scientific Reports (2018) 8:13279, 1: Scientific Reports (2018) 8, 2018. [CrossRef]
- Ritchie, A.C., Winter, B.D., and Warrick, J.A., 2025, Elwha PlaneCam – Aerial imagery and derivatives from periodic and event-response surveys of the Elwha River, Olympic Mountains, and Washington Coast, in Remote Sensing Coastal Change Simple Data Distribution Service: U.S. Geological Survey data service, accessed [November 26, 2025], at https://doi.org/10.5066/P9M3NYWI. [Data directly accessible at https://cmgds.marine.usgs.gov/data-services/rscc/Elwha_PlaneCam/].
- Sellars, W. (1962). "Philosophy and the Scientific Image of Man," in: Robert Colodny, ed., Frontiers of Science and Philosophy, Pittsburgh: University of Pittsburgh Press, pp. 35–78.
- Servizi, J.A. and Martens, D.W., 1992. Sub-lethal responses of coho salmon (Oncorhynchus kisutch) to suspended sediments. Canadian Journal of Fisheries and Aquatic Sciences, 49: 1389-1395.
- Simons, D.B. and Li, R.M., 1982. Sediment Problems Associated with Dam Removal - Muskegon River, Michigan. Engineering Analysis of Fluvial Systems.
- Stanley, E.H., Luebke, M.A., Doyle, M.W. and Marshall, D.W., (2002). Short-term changes in channel form and macro invertebrate communities following low head dam removal. Journal of the North American Benthological Society, 21(1): 172-187.
- Tang, L., Mo, K., Zhang, J., Wang, J., Chen, Q., He, S., et al. (2021) Removing tributary low-head dams can compensate for fish habitat losses in dammed rivers. Journal of Hydrology, 598, 126204. Available from: https://doi.org/10.1016/j.jhydrol.2021.126204. Available from. [CrossRef]
- Thorne, C.R. and Osman, A.M. (1988). The influence of bank stability on regime geometry of natural channels. In International Conference on River Regime, 18-20 May. Wallingford. 135-147.
- Thorne, C R, Bathurst, J C & Hey, R D (editors) (1987) Sediment Transport in Gravel-Bed Rivers J. Wiley & Sons, Chichester, UK, 995pp.
- URS and Stillwater Sciences (2014). Matilija Dam Removal, Sediment Transport, and Robles Diversion Mitigation Project: Draft Inoitial Options Screening Report. Prepared for Ventura County Watershed Protection District. 104 pp.
- U.S. Department of the Interior (DOI), 1994. Draft Environmental Impact Statement for Elwha River Ecosystem Restoration, National Park Service, Olympic National Park, WA, October 1994.
- U.S. Department of the Interior (DOI), 1995. Draft Environmental Impact Statement for Elwha River Ecosystem Restoration, National Park Service, Olympic National Park, WA, August 1995.
- U.S. Department of the Interior (DOI), 1996a. Elwha River Ecosystem Restoration Implementation, Draft Environmental Impact, National Park Service, Olympic National Park, WA, April 1996.
- U.S. Department of the Interior (DOI), 1996b. Elwha River Ecosystem Restoration Implementation, Final Environmental Impact, National Park Service, Olympic National Park, WA, November 1996.
- U.S. Department of the Interior (DOI), 2004. Elwha River Ecosystem Restoration Implementation, Draft Supplement to the Final Environmental Impact Statement, National Park Service, Olympic National Park, WA, December 2004.
- U.S. Department of the Interior (DOI), 2005a. Elwha River Ecosystem Restoration Implementation, Final Supplement to the Final Environmental Impact Statement, National Park Service, Olympic National Park, WA, July 2005.
- U.S. Department of the Interior (DOI), 2005b. Record of Decision, Elwha River Ecosystem Restoration Implementation, Final Supplement to the Final Environmental Impact Statement, National Park Service, Olympic National Park, WA, November 2005.
- Wang, H.W. & Kuo, W.C. (2016) Geomorphic responses to a large check-dam removal on a mountain river in Taiwan. River Research and Applications, 32, 1094–1105.
- Warrick, J.A., Draut, A.E., McHenry, M.L., Miller, I.M., Magirl, C.S., Beirne, M.M., Stevens, A.W., Logan, J.B., (2011). Geomorphology of the Elwha River and its delta. In: Duda, J.J., Warrick, J.A., Magirl, C.S. (Eds.), Coastal habitats of the Elwha River, Washington—biological and physical patterns and processes prior to dam removal. U.S. Geological Survey Scientific Investigations Report 2011 5120, pp. 47–74.
- Warrick, J.A., Bountry, J.A., East, A.E., Magirl, C.S., Randle, T.J., Gelfenbaum, G., Ritchie, A.C., Pess, G.R., Leung, V., Duda, J.J., (2015). Large-scale dam removal on the Elwha River, Washington, USA: Source-to-sink sediment budget and synthesis, Geomorphology (2015). [CrossRef]
- Warrick, J.A., Ritchie, A., East, A.E., Magirl, C.S., Bountry, J.A., Randle, T.J., 2017. “Fluvial and coastal morphodynamic evolution following a massive sediment release from the world’s largest dam removal,” GSA 2017 Annual Meeting, T183. Advances and Challenges in Quantifying Sediment Budgets for River Systems.
- Wik, S.J., 1995. Reservoir Drawdown - Case-Study in Flow Changes to Potentially Improve Fisheries. Journal of Energy Engineering, ASCE, 121(2): 89-96.
- Wilcox, A.C., J.E. O’Connor, and J.J. Major, (2014). “Rapid Reservoir Erosion, Hyper concentrated Flow, and Downstream Deposition Triggered by Breaching of 38-m-Tall Condit Dam, White Salmon River, Washington.” Journal of Geophysical Research: Earth Surface 119: 1376-1394. [CrossRef]
- Wolman, M. G., and Leopold, L. B. (1957). "River floodplains: Some observations on their formation." U.S. Geological Survey Professional Paper, 282-C, 87-109.
Figure 1.
Location map.
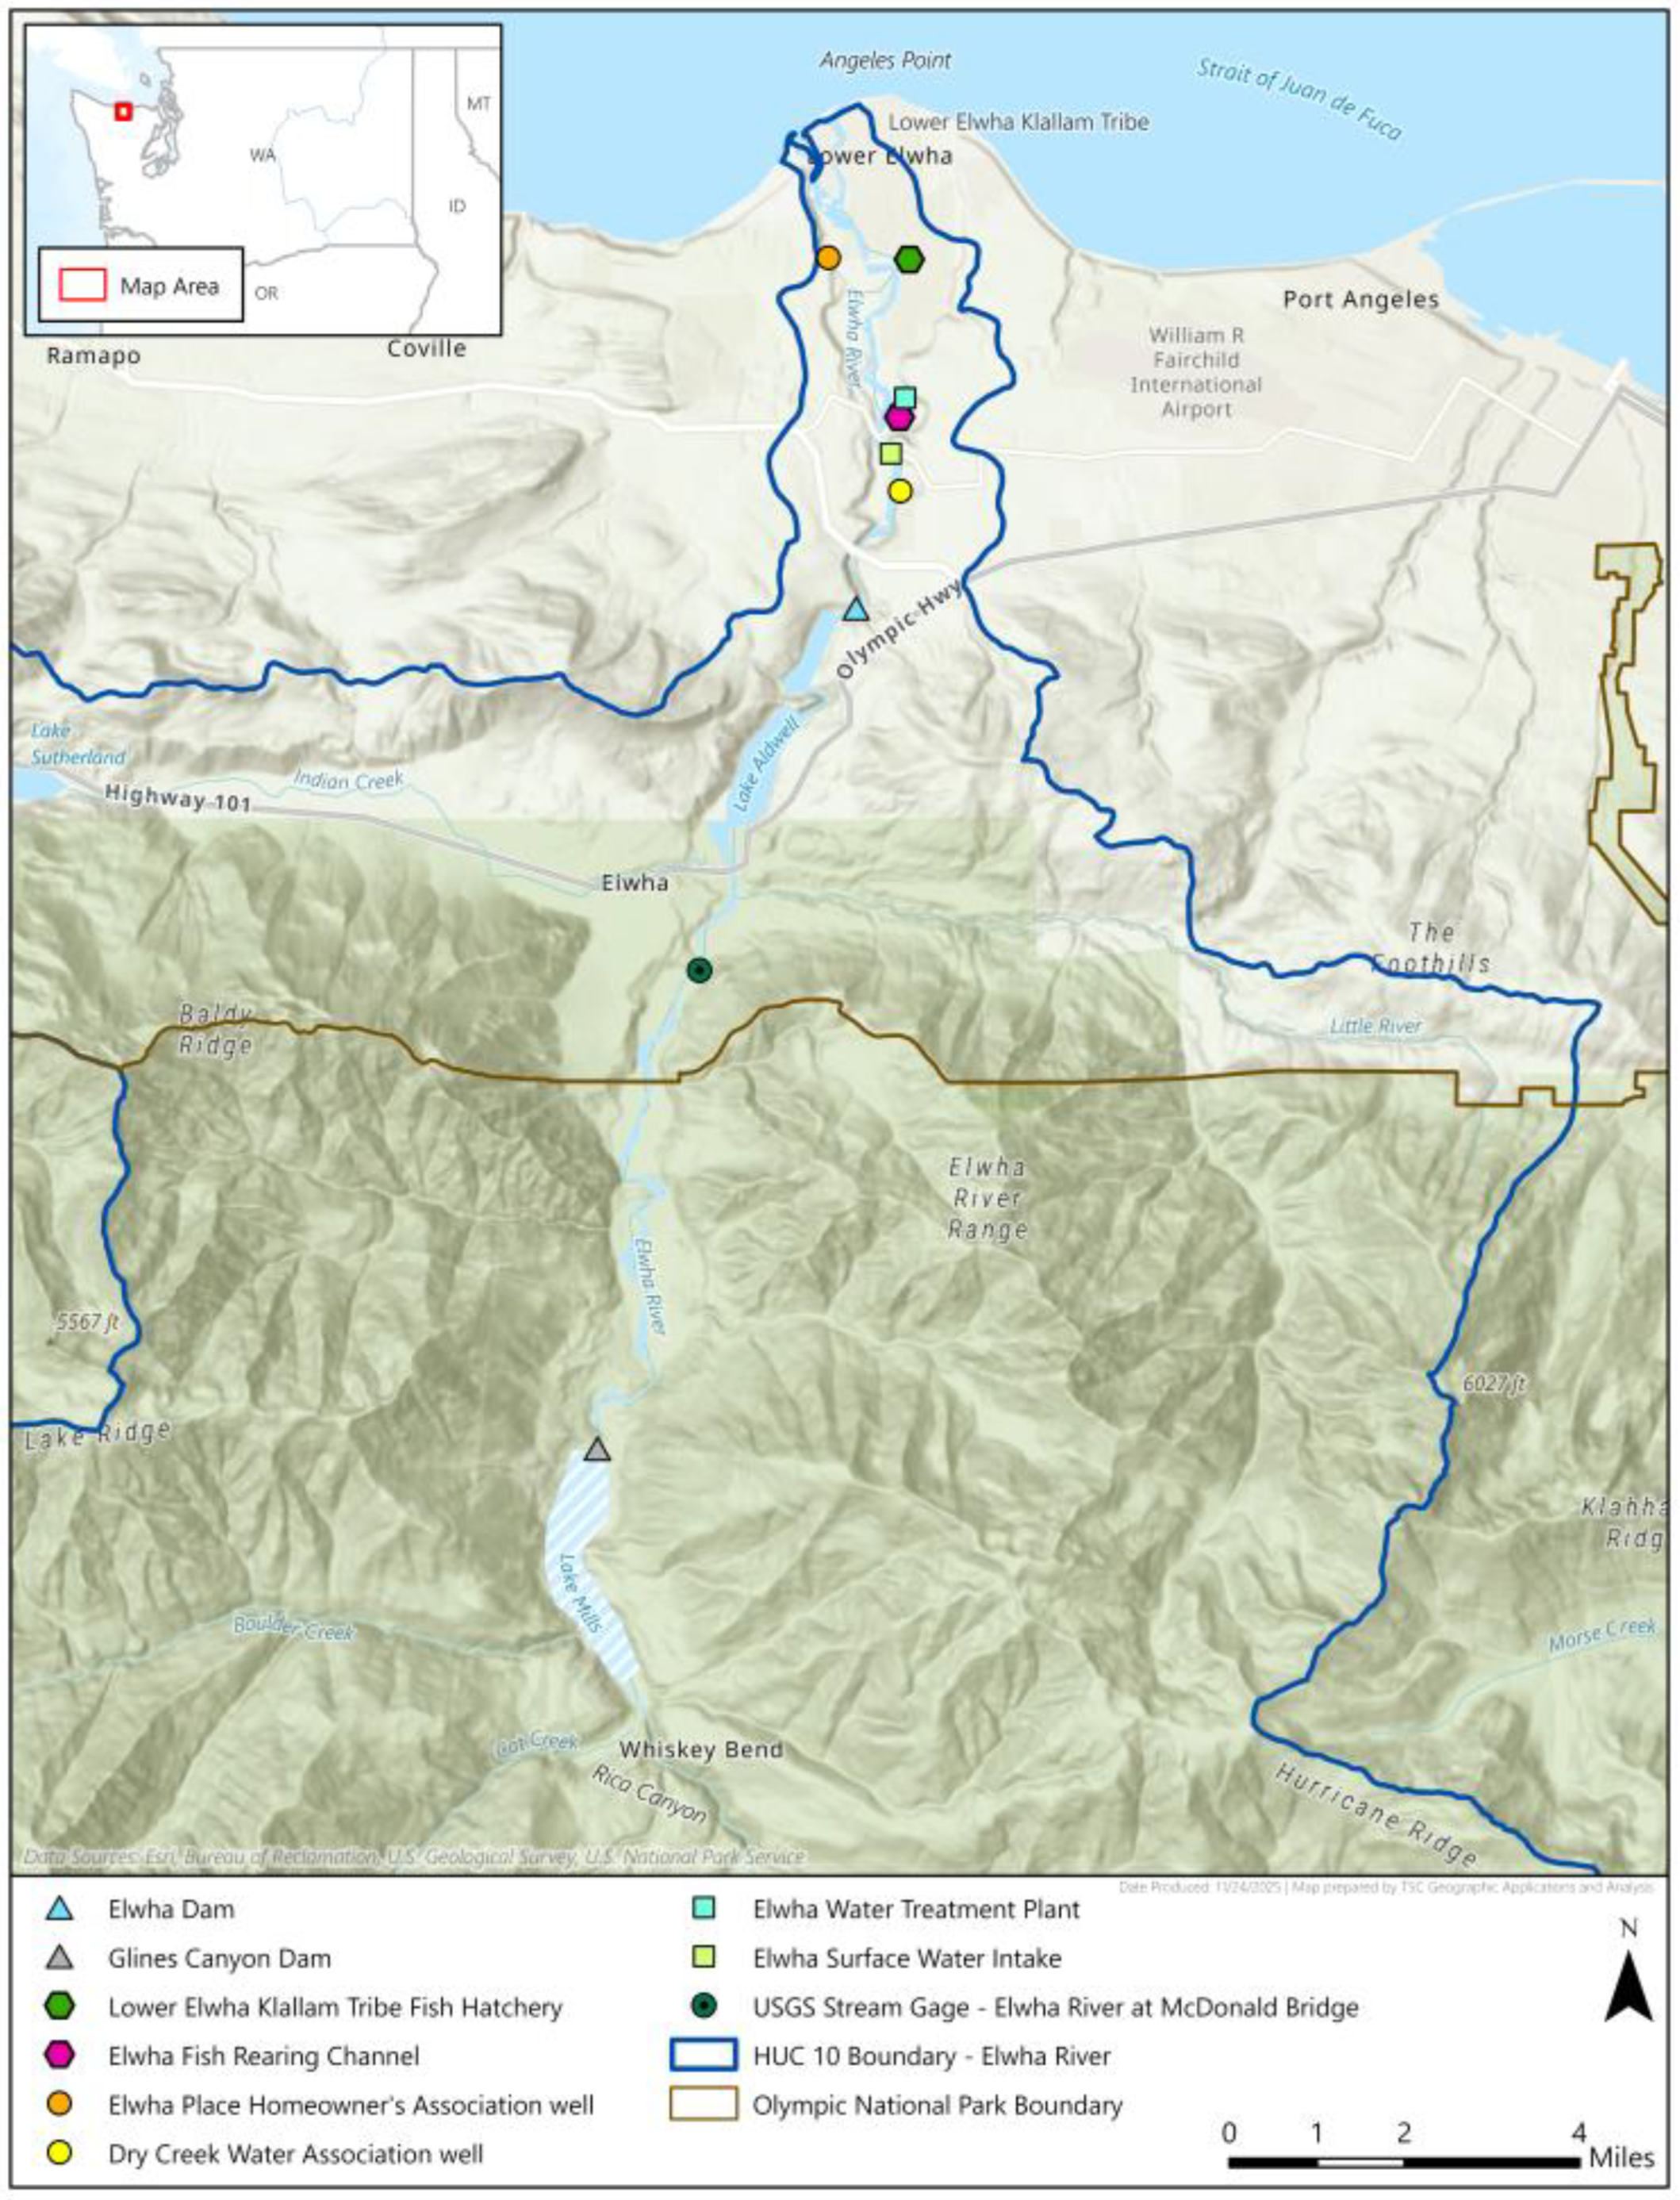
Figure 2.
(a) University of Nottingham tabletop model; (b) SAFL model basin (Bromley, 2007); (Leung et al. 2019); (c) MB2 model concept (Randle et al., 2021).
Figure 2.
(a) University of Nottingham tabletop model; (b) SAFL model basin (Bromley, 2007); (Leung et al. 2019); (c) MB2 model concept (Randle et al., 2021).
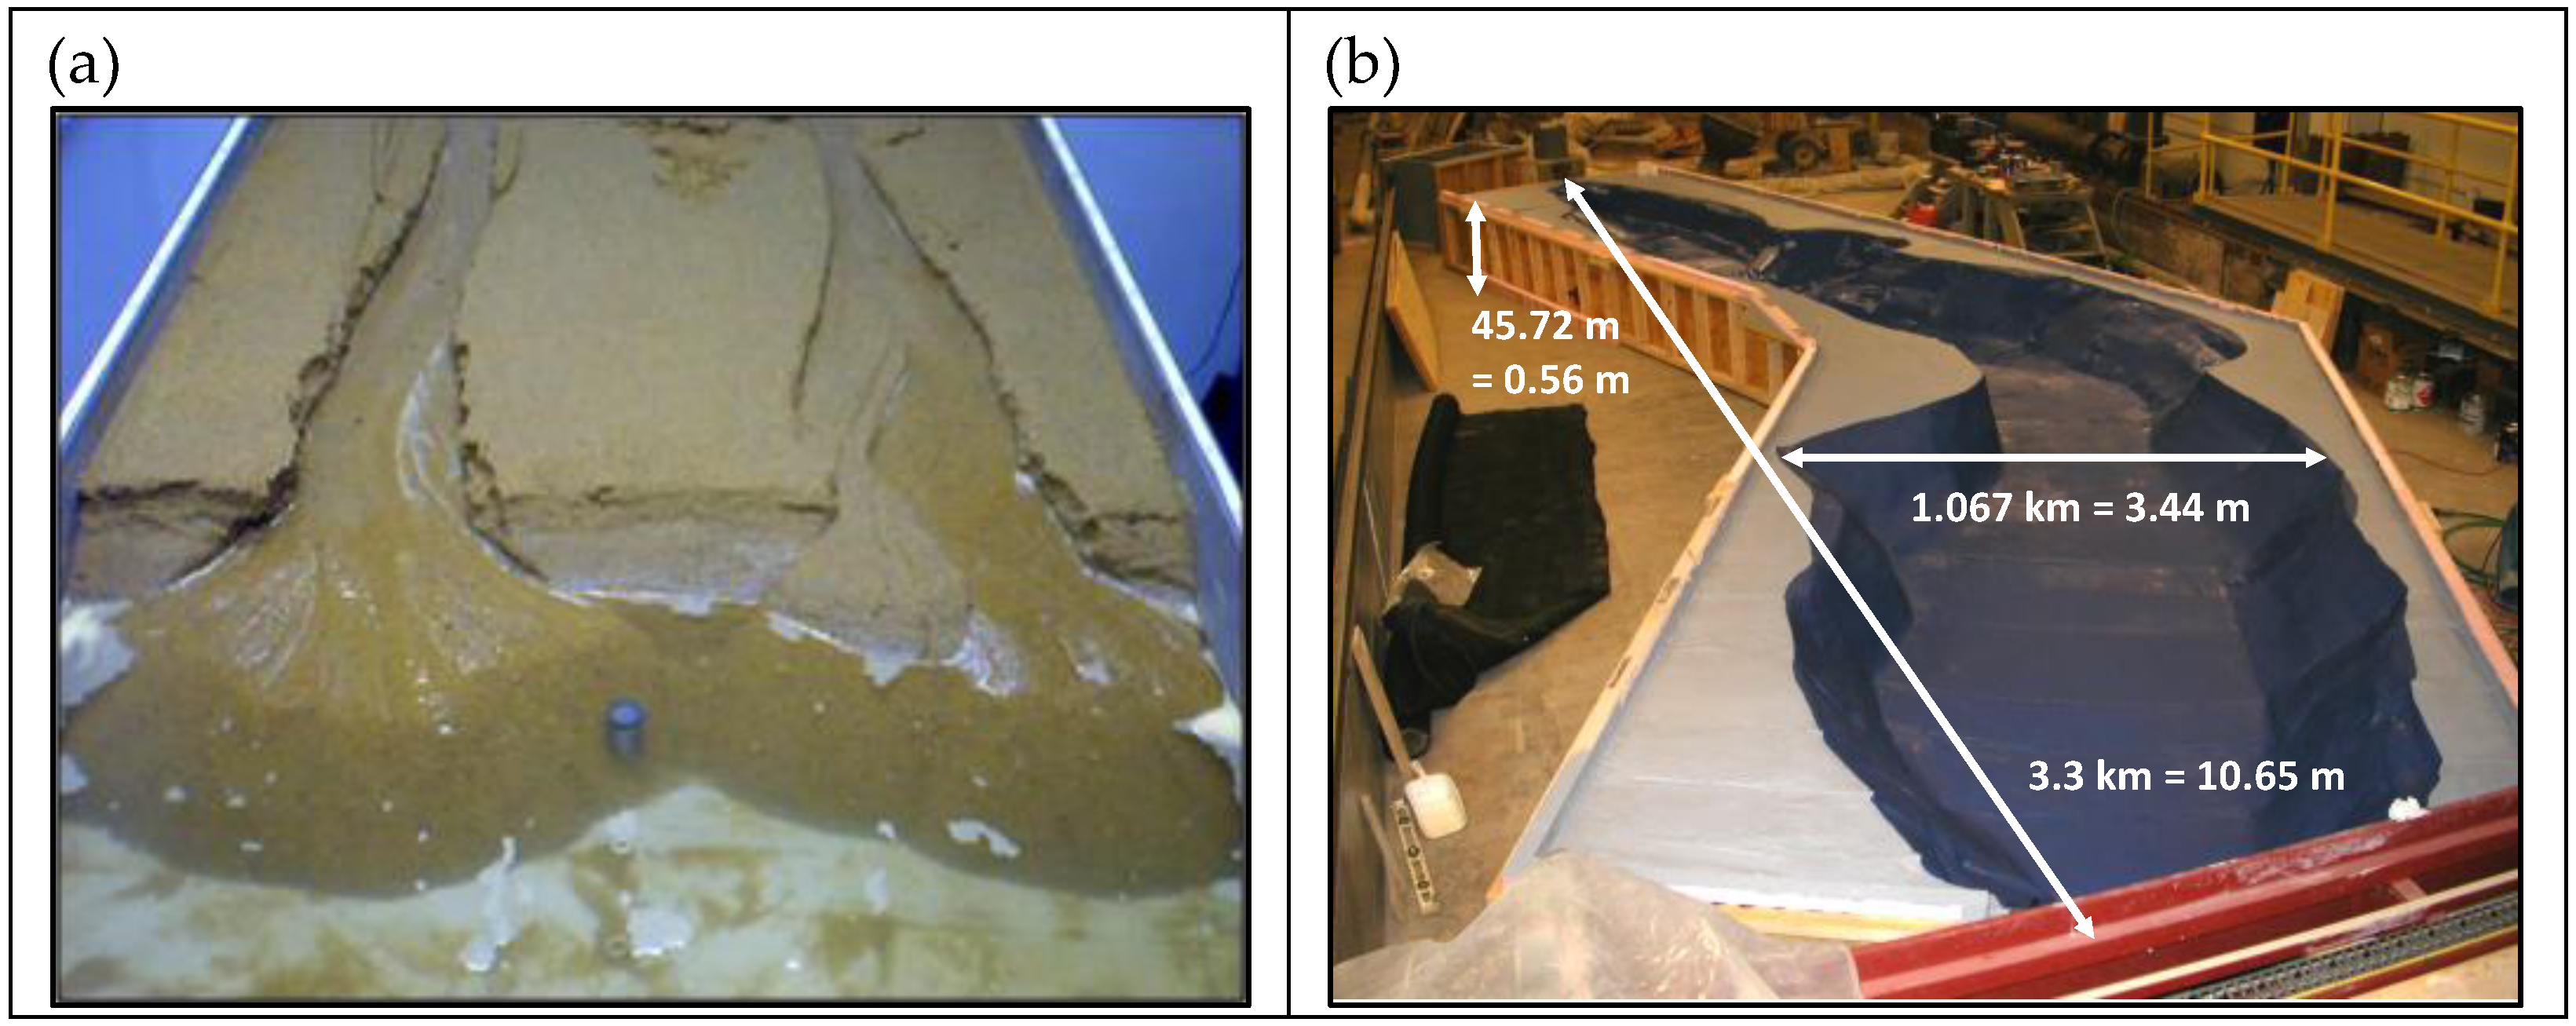
Figure 3.
Pilot channels: (a) SAFL model, (b) field before pilot channel excavation, (c) field after initial pilot channel excavation, d) field with pilot channel after first flood.
Figure 3.
Pilot channels: (a) SAFL model, (b) field before pilot channel excavation, (c) field after initial pilot channel excavation, d) field with pilot channel after first flood.
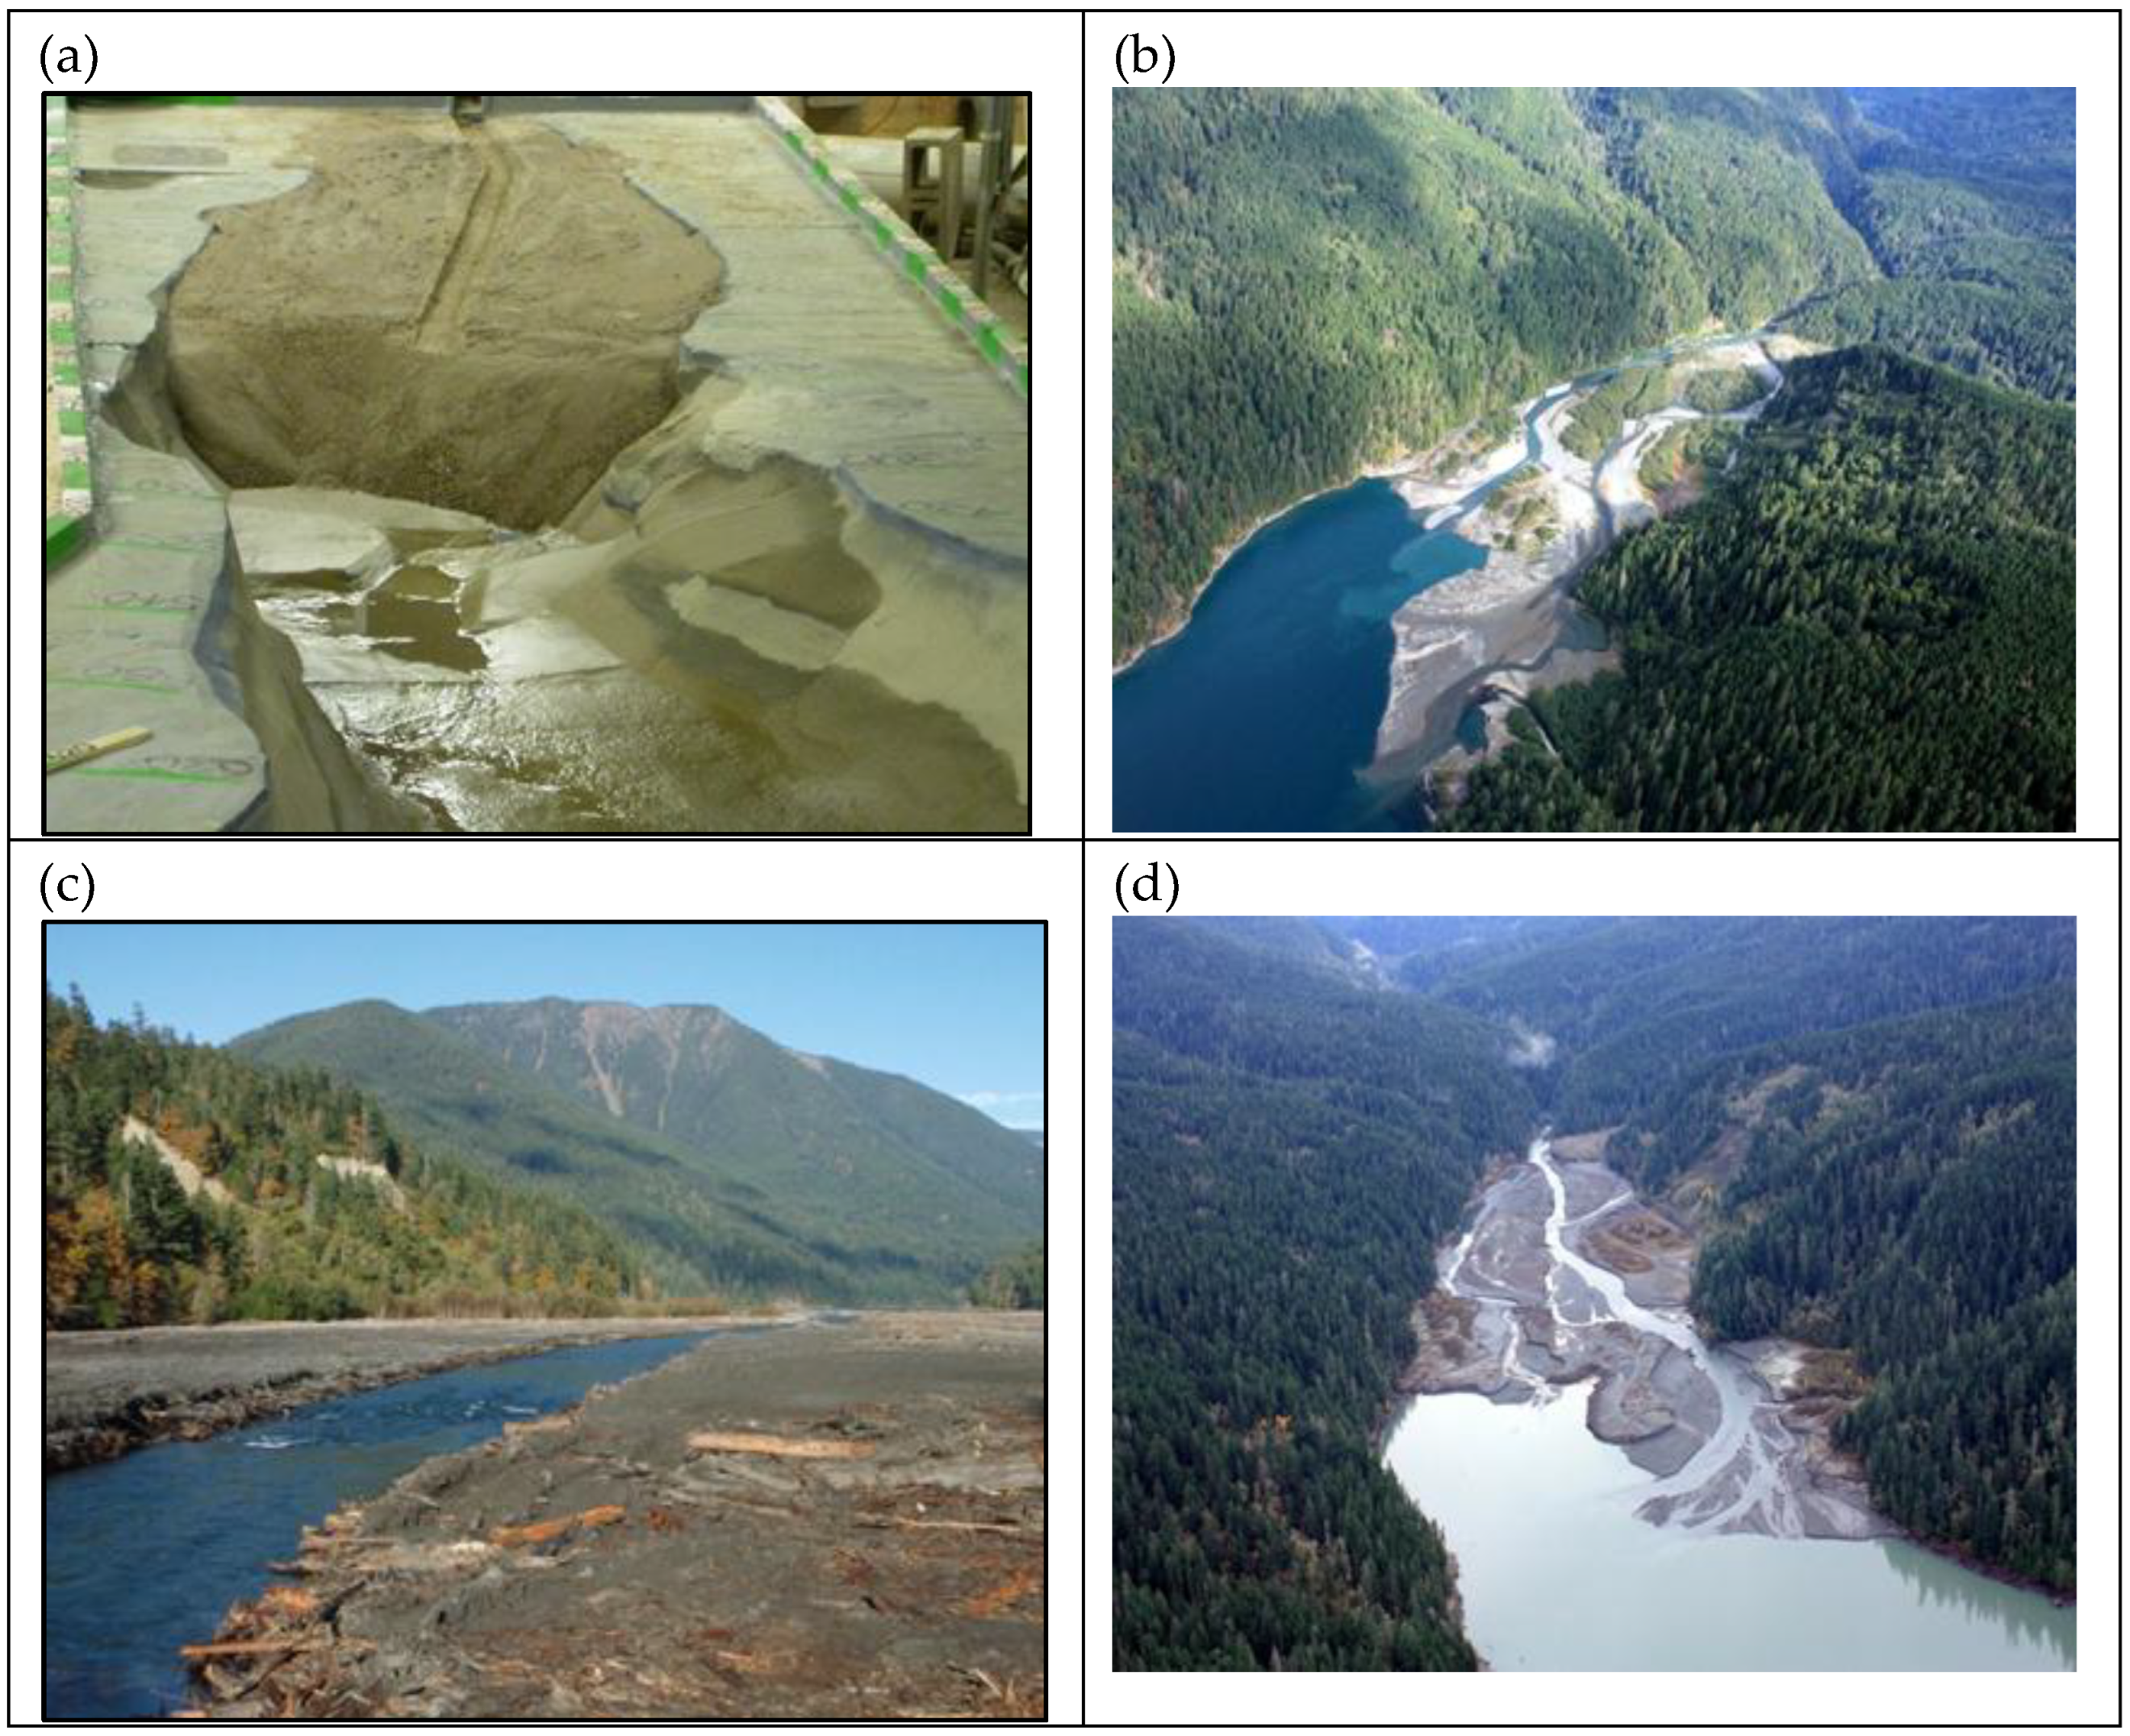
Figure 4.
Predicted and observed locations of reservoir erosion in feet during water year 2015 for (a) multiple floods with one large flood peak; (b) a single moderate magnitude flood; and (c) in water year 2016 with one 5- to 10-year flood peak (Bountry et al., 2018). Unfilled polygons denote areas of predicted erosion.
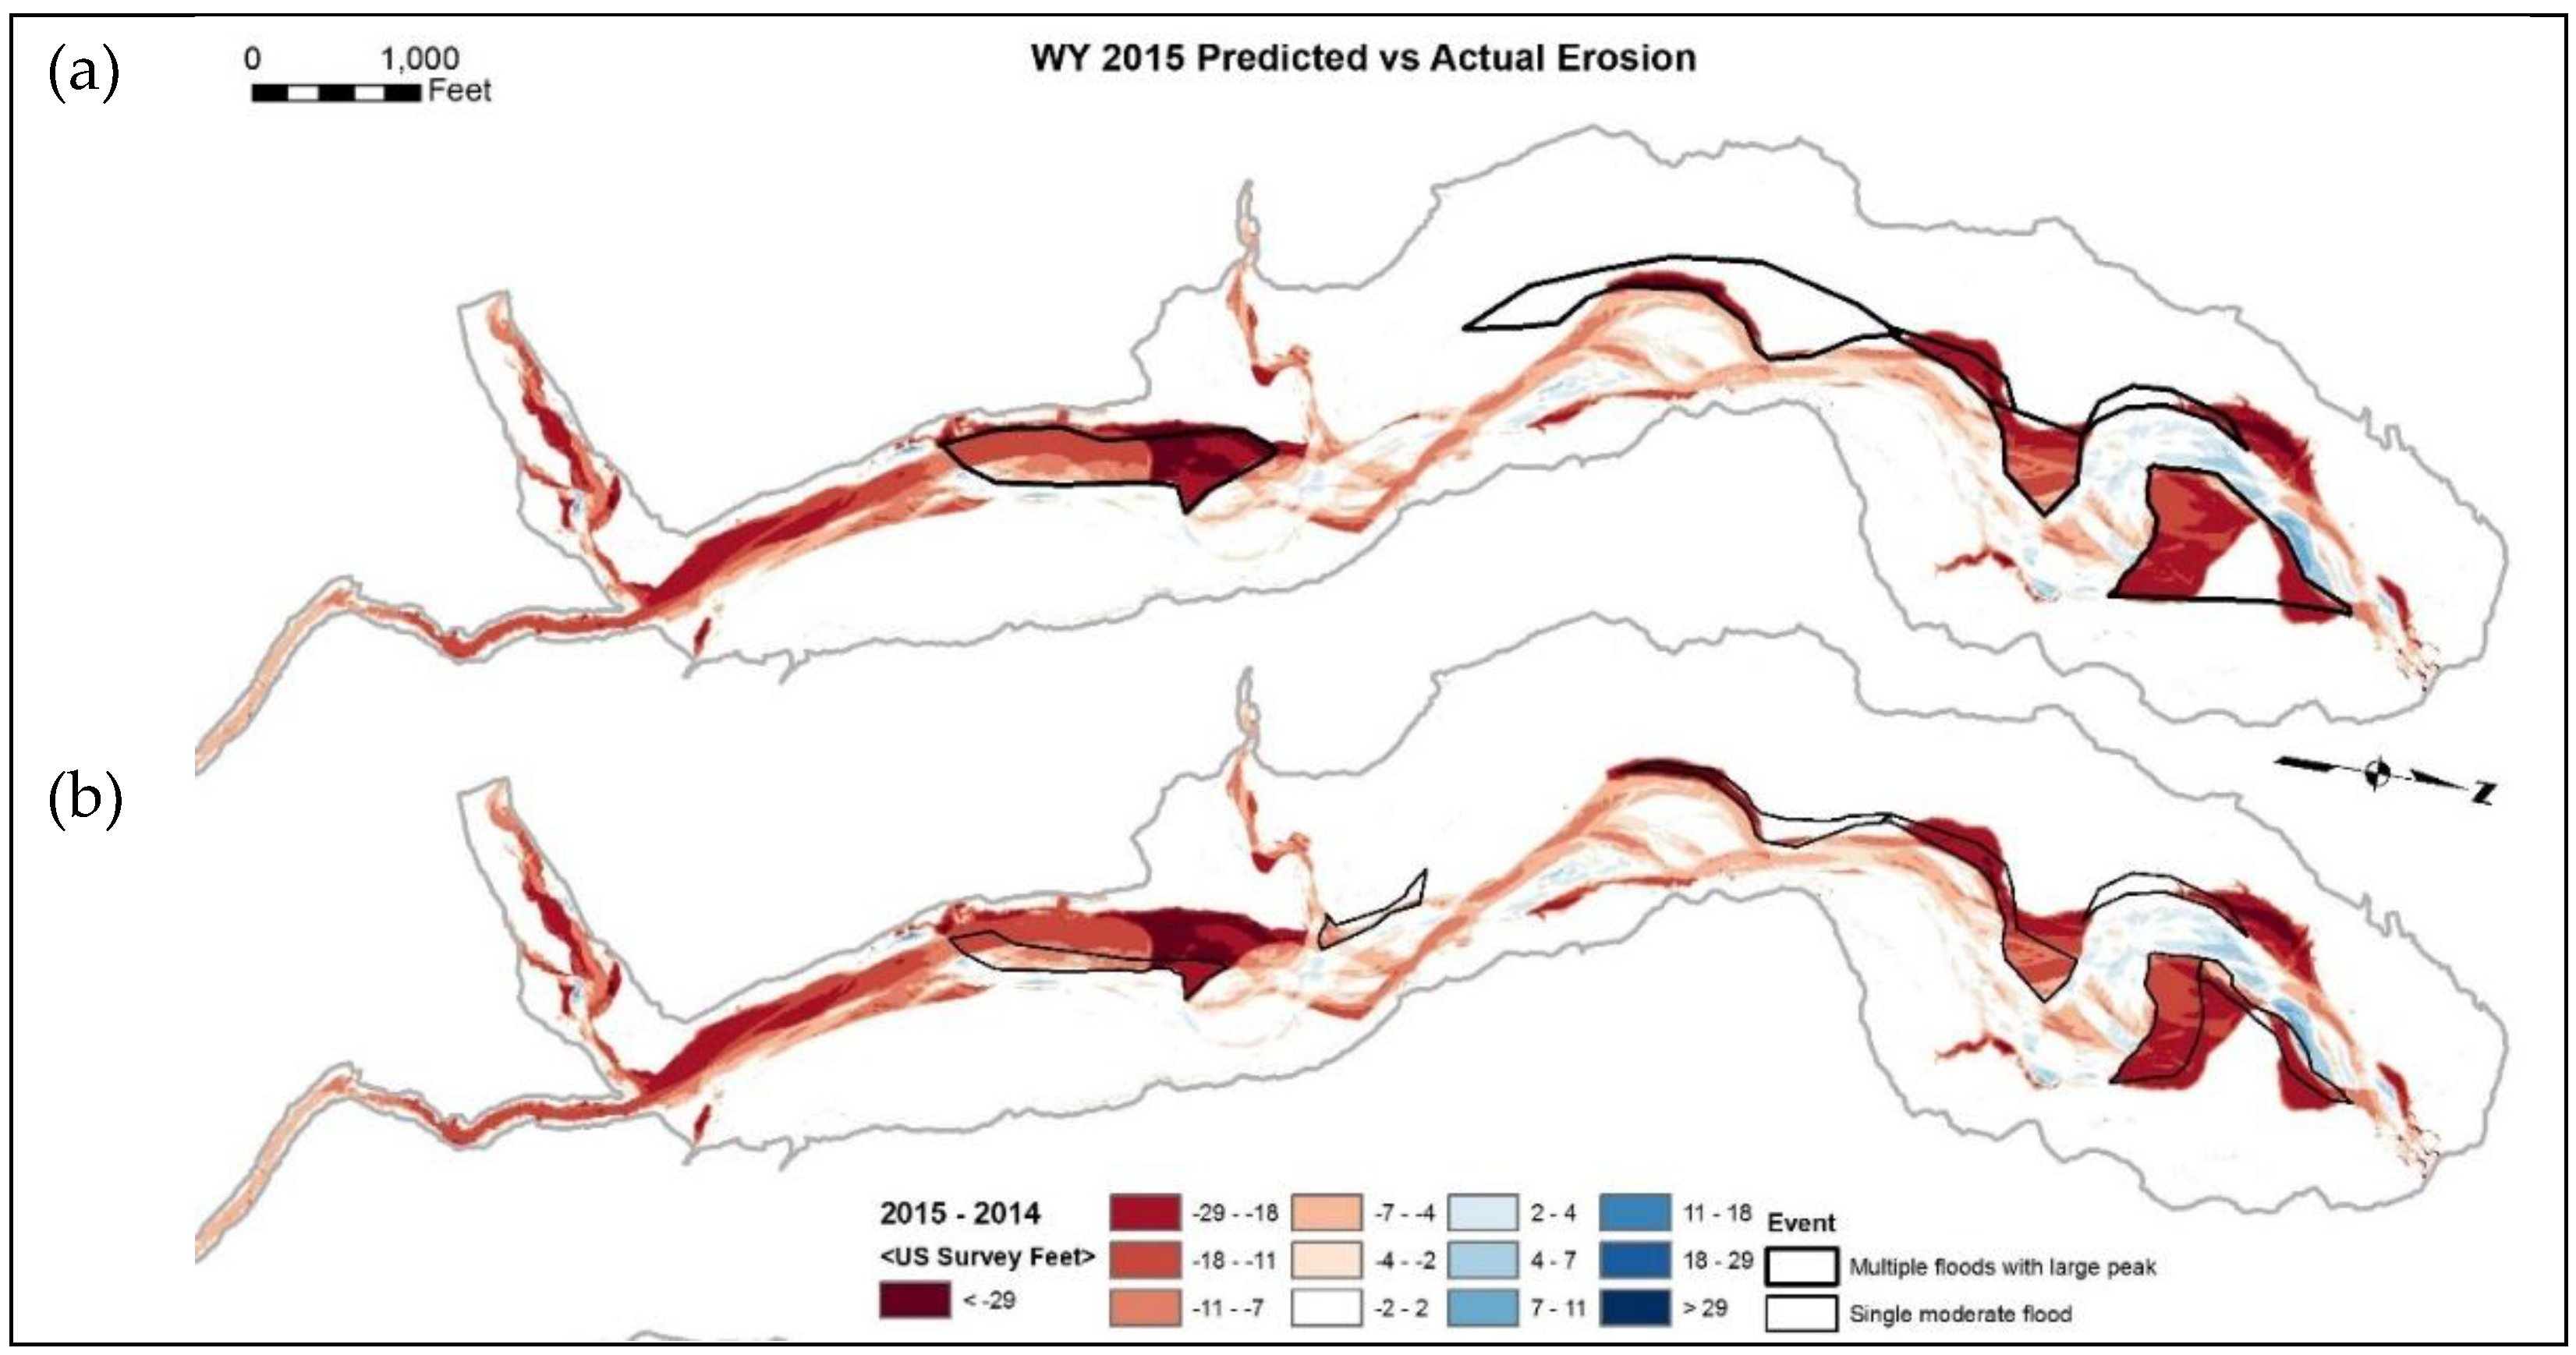
Figure 7.
Plan-view time series of delta evolution simulated by the SAFL model (top row) and MB2 (middle row), and the observed field conditions (bottom row). Percentage values denote proportion of reservoir drawdown. Red lines denote active channel banks.
Figure 7.
Plan-view time series of delta evolution simulated by the SAFL model (top row) and MB2 (middle row), and the observed field conditions (bottom row). Percentage values denote proportion of reservoir drawdown. Red lines denote active channel banks.
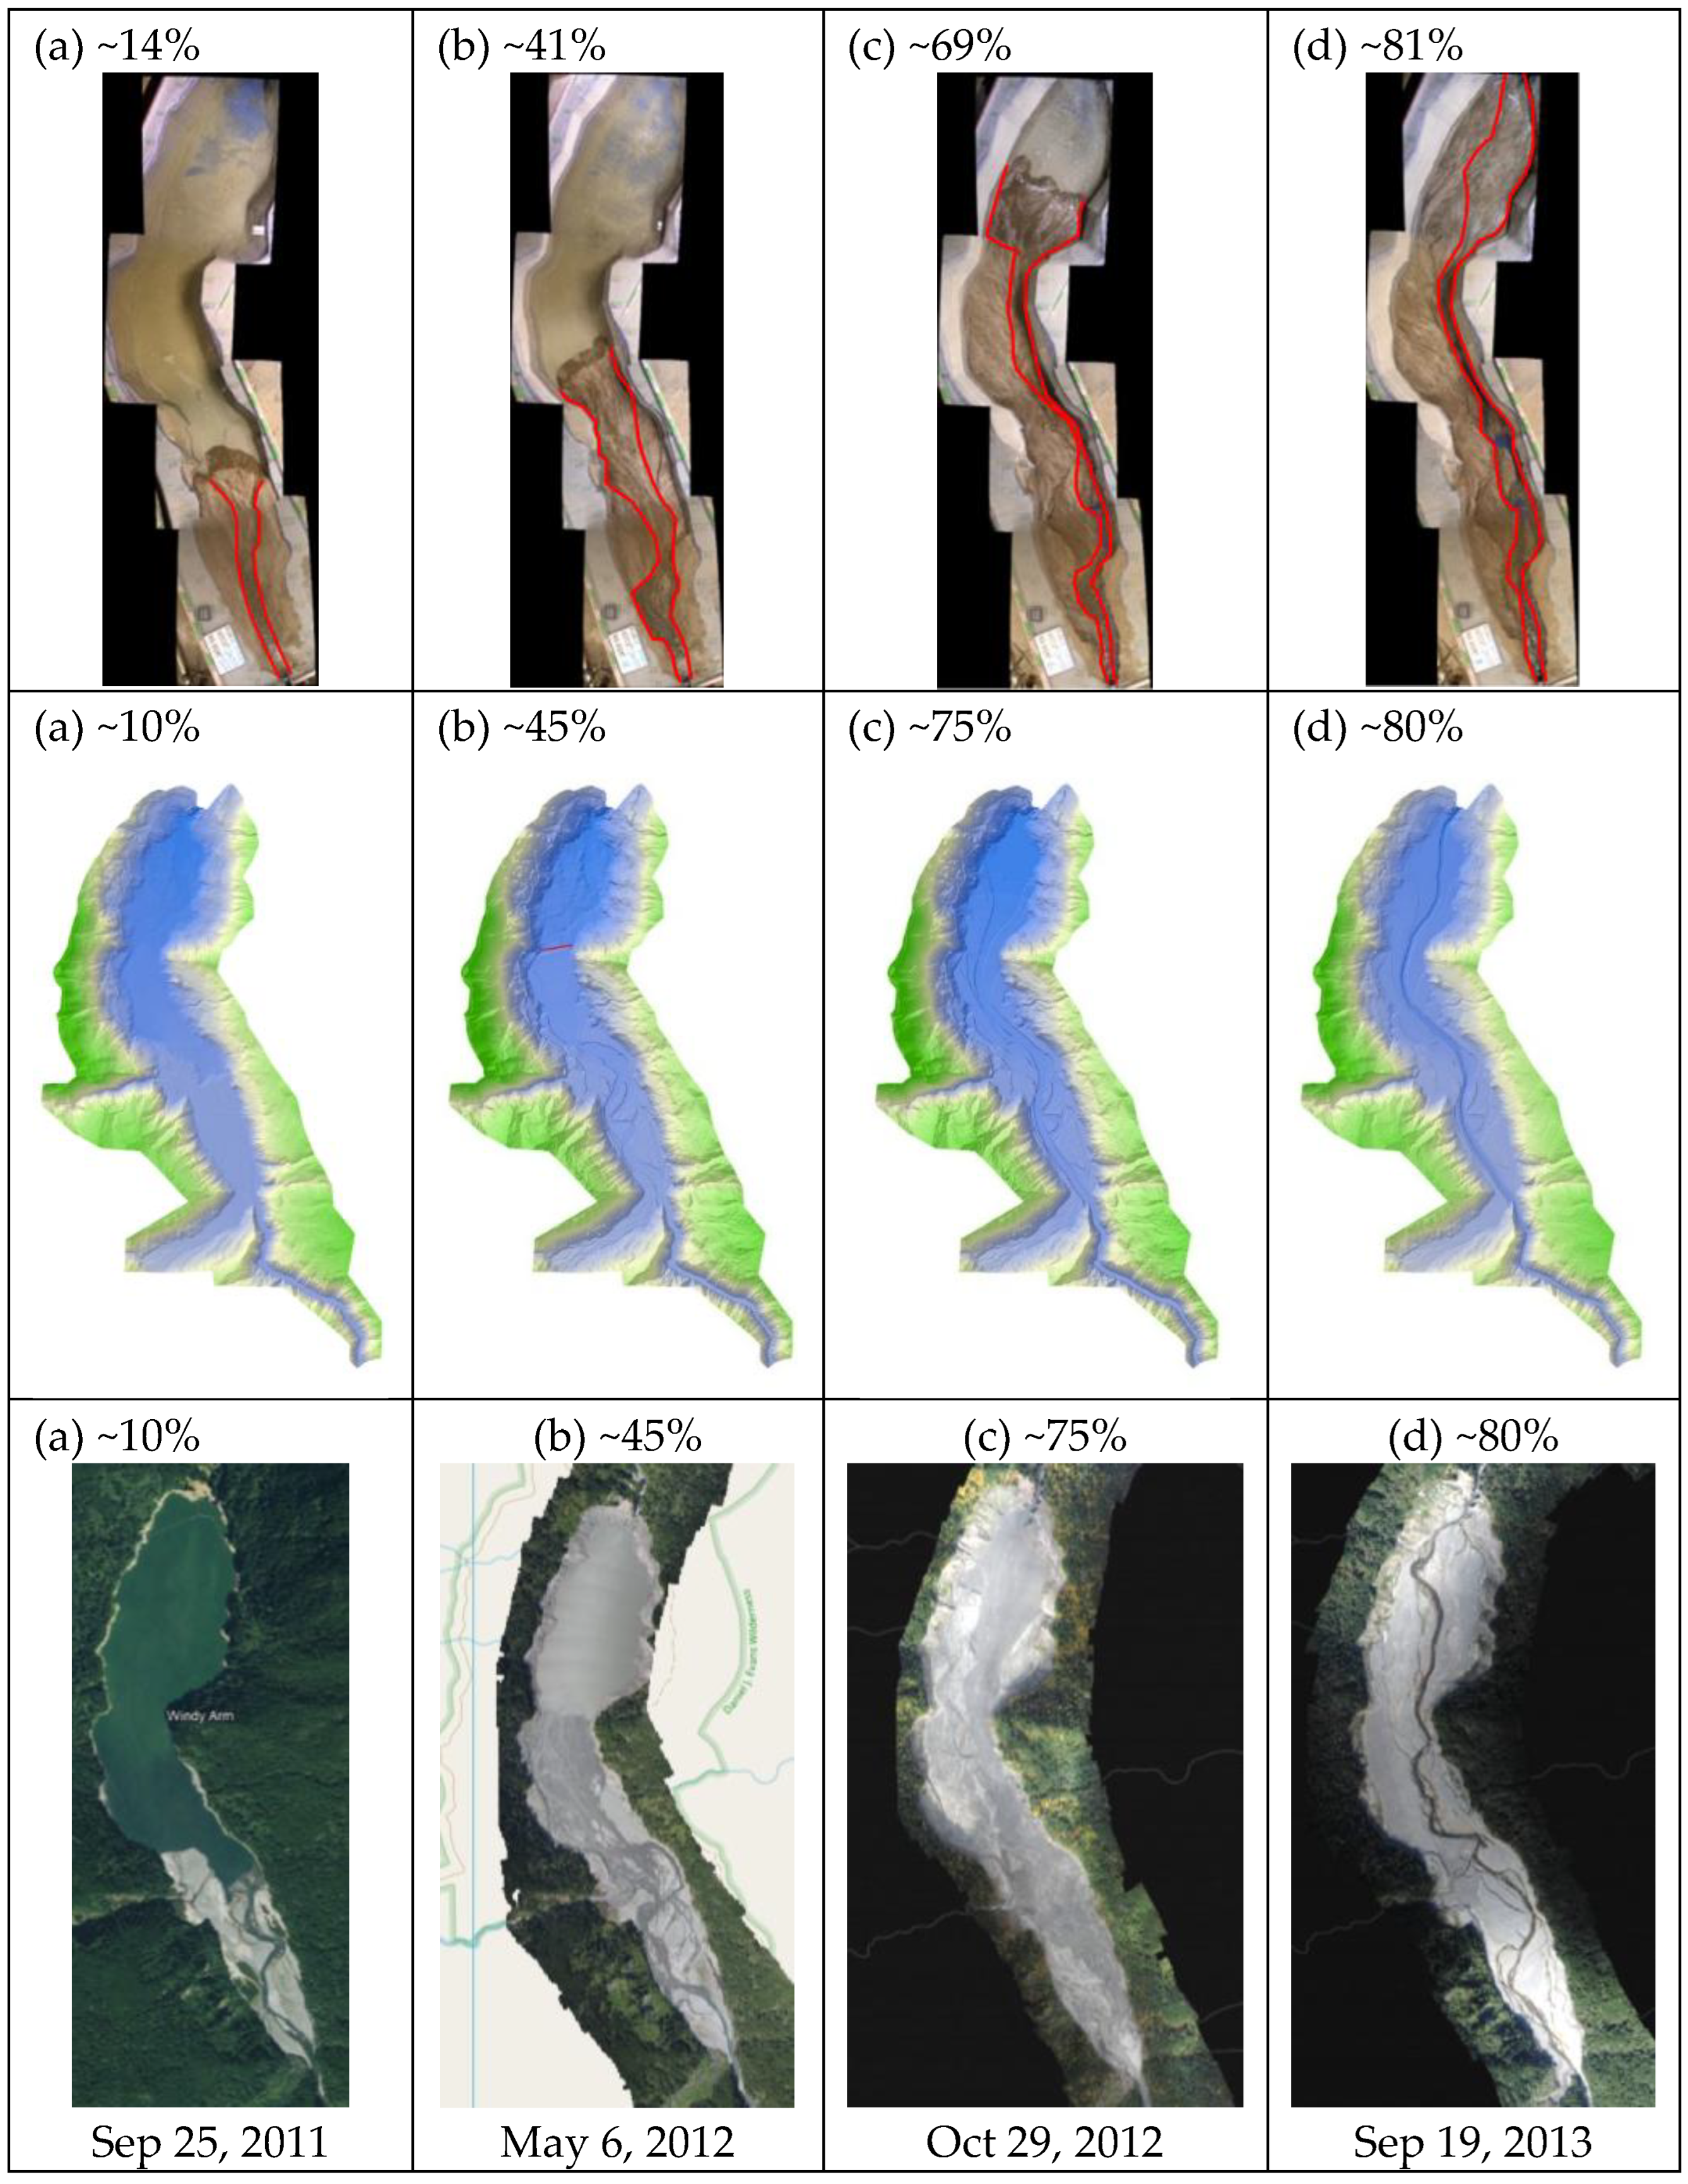
Figure 8.
Comparisons of simulated and observed turbidity levels past Elwha Dam (Randle et al., 2021).
Figure 8.
Comparisons of simulated and observed turbidity levels past Elwha Dam (Randle et al., 2021).
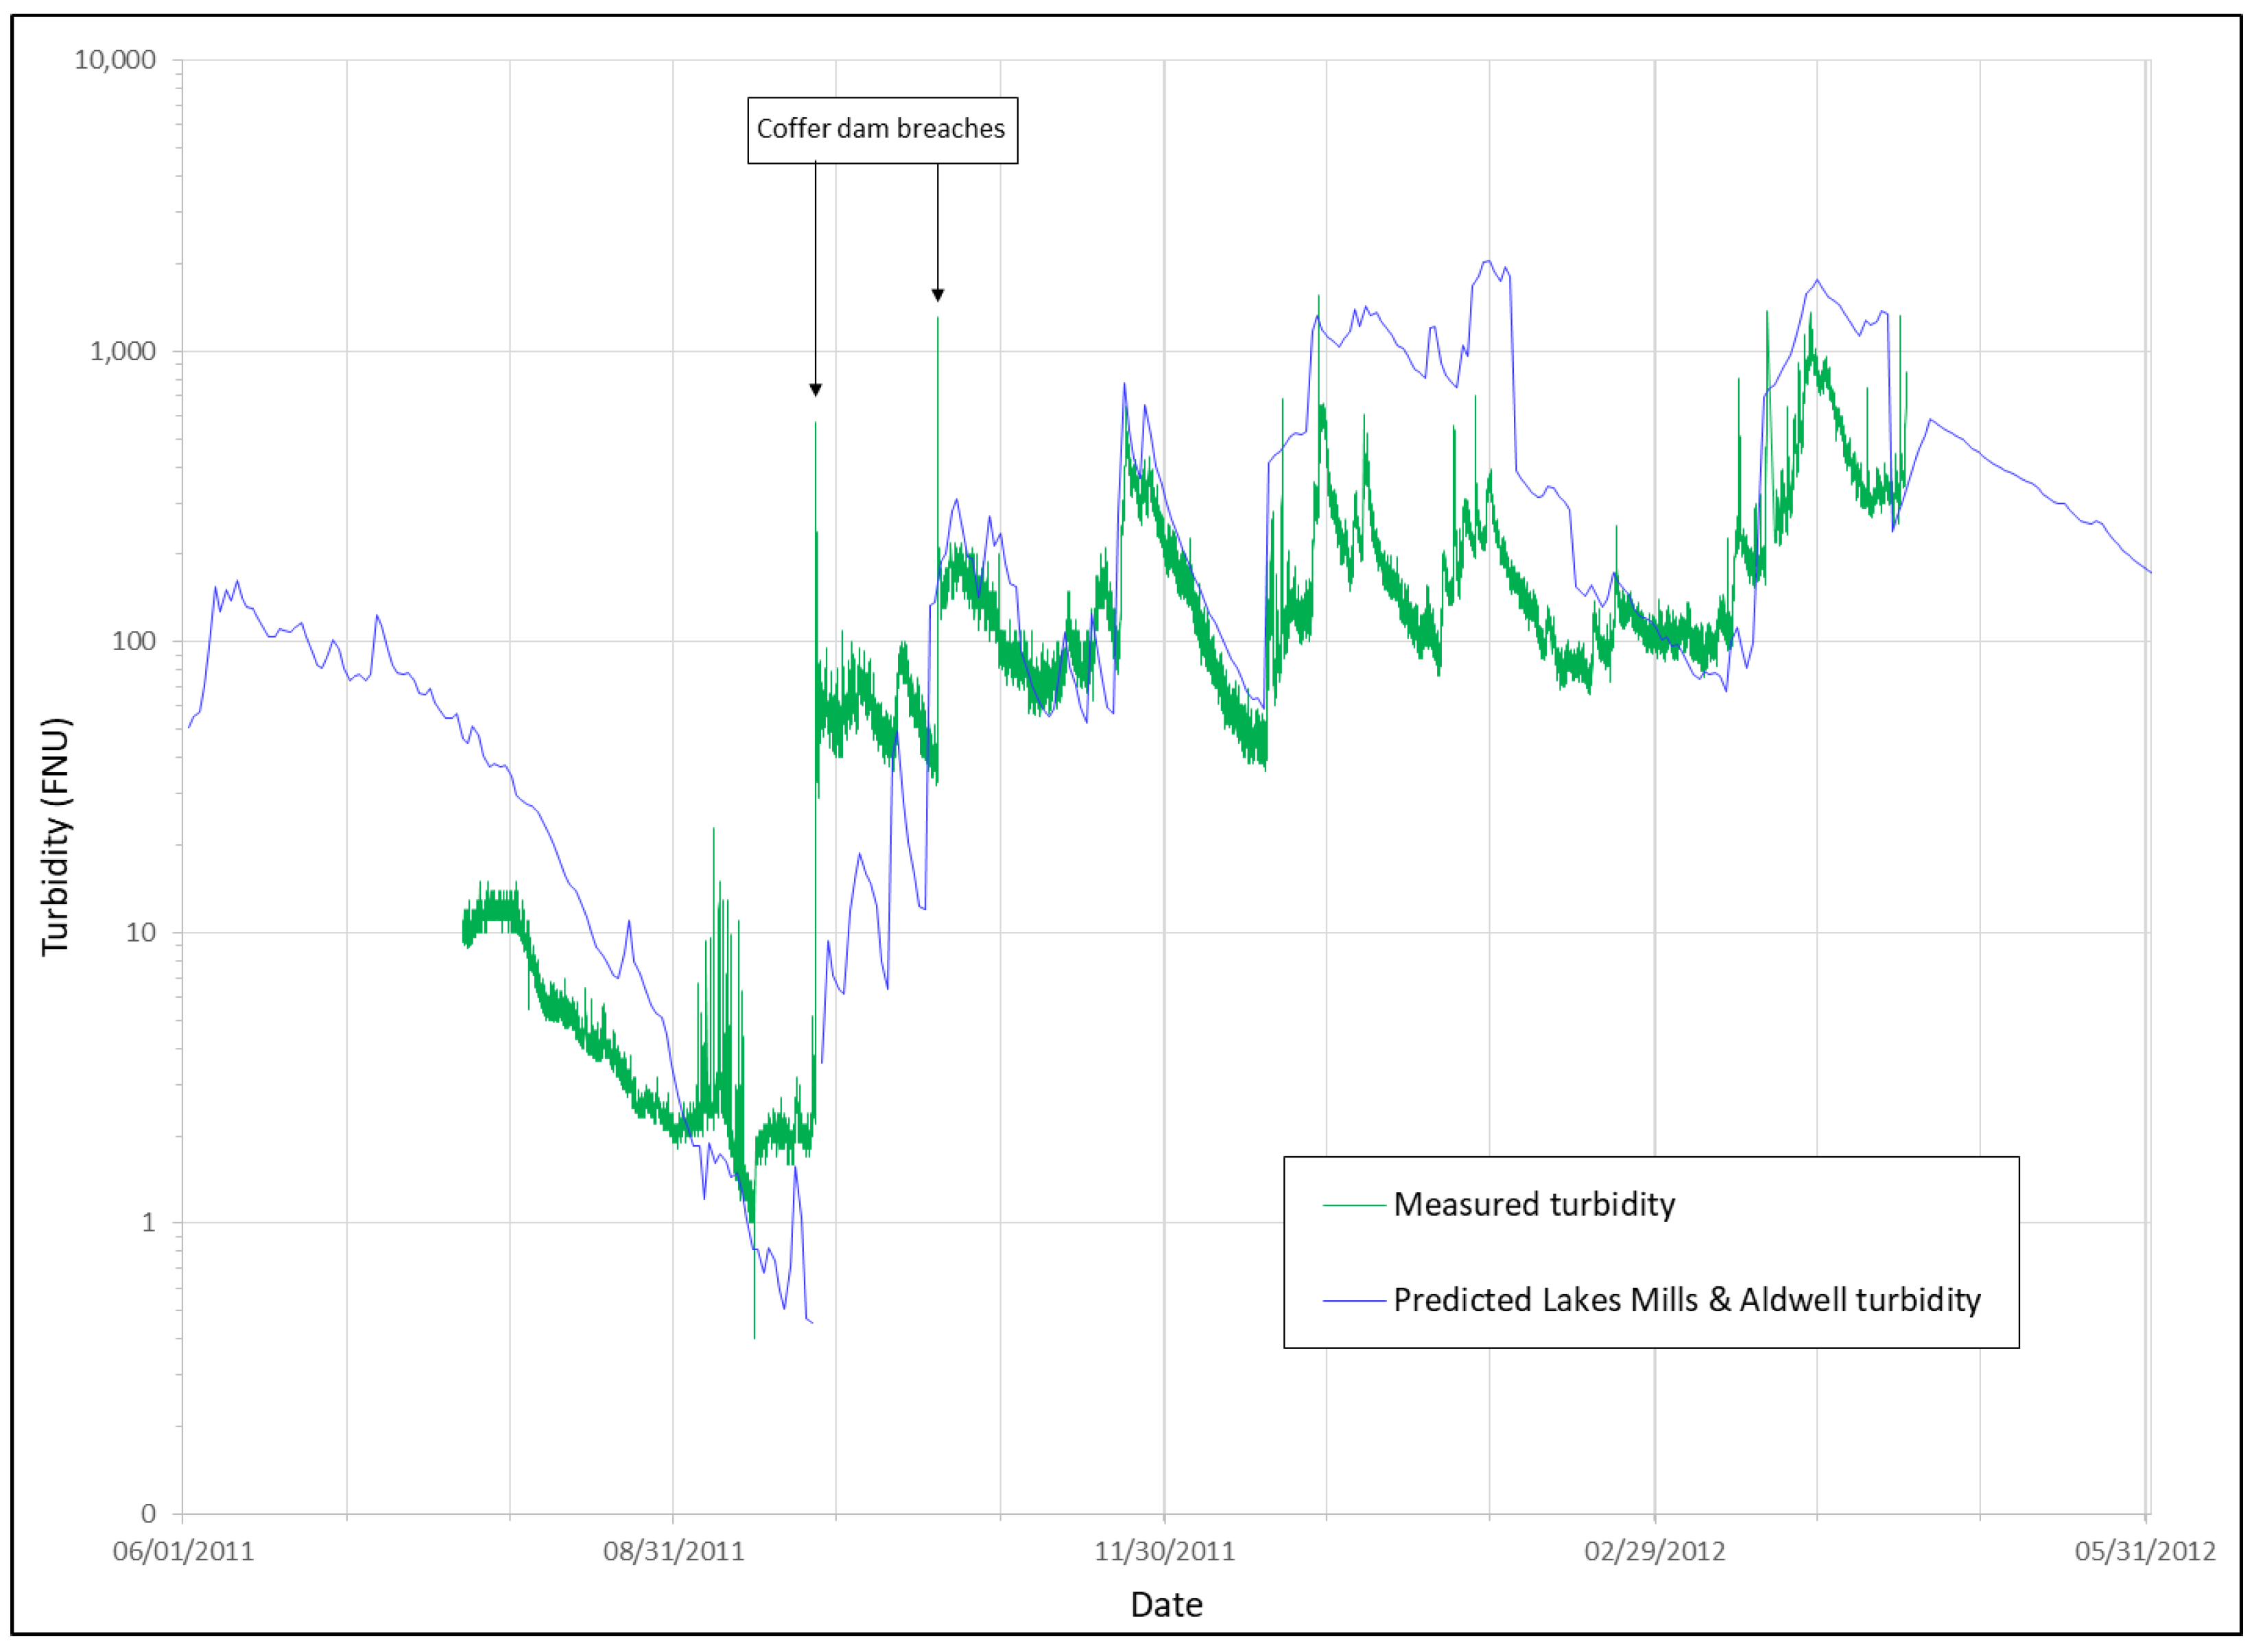

Table 1.
Use of geomorphic analyses to assess recovery of the Elwha River system towards dynamic equilibrium (Bountry et al., 2018).
Table 1.
Use of geomorphic analyses to assess recovery of the Elwha River system towards dynamic equilibrium (Bountry et al., 2018).
| Criteria | Findings | Information from | |
|---|---|---|---|
| Reservoir Area | |||
| 1 | River incised to pre-dam valley bottom indicates low likelihood of further removal-related incision. | Exposure of pre-dam tree stumps, historical photos and pre-dam & contemporary topography indicate river through former reservoir reached pre-dam valley bottom by October 2017. | Repeat fluvial audit; contemporary ground-based photos; historical and contemporary surveys. |
| 2 | At least one flood peak greater than the 5-year flood has occurred since dam removal. | Seven peaks ranging from 2- to 10-yr recurrence intervals have occurred since removal. | Stream gauging and analysis. |
| 3 | Lateral erosion of terraces is localized (not along entire bank line), only occurs during floods, and a flood of a given magnitude erodes less than the previous flood of a similar magnitude. | Terrace erosion reduced annually since dam removal: larger, more frequent flooding in water year (WY) 2016 eroded less sediment than in WY 2015; a peak flow no larger than a 2-yr flood in WY 2017 eroded minimal sediment; a 2- to 5-yr flood in WY 2018 eroded 5%-10% of the terraces eroded previously. | Repeat fluvial audit. |
| 4 | Annual erosion of remaining sediment is less than natural variability in year-to-year background sediment loads. | By the start of WY 2018, erosion volumes were less than the natural variability in background loads. | Stream gauging; sedimentological data; repeat topographical & bathymetrical surveys; calculation of natural background sediment loads; geomorphic change detection |
| 5 | Net annual erosion from the reservoir relative to natural background loads exhibits an exponential decay over time. | Net erosion declined exponentially from 63 times background rate in WY 2013 to 0.4 and 0.8 times the background rates in WYs 2017 and 2018 respectively. | As for criterion 4. |
| 6 | Woody vegetation covering the majority of fine sediment deposits on reservoir hillslopes and terrace surfaces prevents erosion by rainfall runoff, snowmelt and wind. | By the end of 2017, reservoir hillslopes and sediment terraces were covered in dense vegetation, including woody species. | Repeat surveys; oblique time lapse photos. |
| Downstream river channel | |||
| 1 | Recovery of pool-riffle morphology indicates that most of the released coarse sediment has been transported to the coastal delta. | The pool-riffle morphology, with abundant gravel bars and wood deposits, re-established itself within a more complex, laterally migrating, naturally dynamic channel by 2014. Sediment erosion and deposition occur within the active channel and floodplain. | Repeat topographical survey & ground-based photography. |
| 2 | Most of the eroded reservoir sediment has been transported to the Elwha River mouth. | 90% of the eroded reservoir sediment has been transported to the coast, greatly enlarging the delta (Warrick et al., 2017). Sediment remaining in the river has been sorted to restore fish habitat and natural river ecosystem function. | Historical survey; pre- and post-removal topographic and bathymetric survey; aerial LiDAR; sedimentological data; geomorphic change detection; gauging data; sediment transport data; calculation of natural background sediment loads; sediment budgeting. |
| 3 | Lateral channel migration and associated terrace and bank erosion is limited to periods during floods. | Lateral channel migration and bank erosion occurred during floods but reduced in longitudinal length and in surface area over time. | Repeat fluvial audit. |
Disclaimer/Publisher’s Note: The statements, opinions and data contained in all publications are solely those of the individual author(s) and contributor(s) and not of MDPI and/or the editor(s). MDPI and/or the editor(s) disclaim responsibility for any injury to people or property resulting from any ideas, methods, instructions or products referred to in the content. |
© 2025 by the authors. Licensee MDPI, Basel, Switzerland. This article is an open access article distributed under the terms and conditions of the Creative Commons Attribution (CC BY) license (http://creativecommons.org/licenses/by/4.0/).
Copyright: This open access article is published under a Creative Commons CC BY 4.0 license, which permit the free download, distribution, and reuse, provided that the author and preprint are cited in any reuse.


