
Submitted:
03 December 2025
Posted:
05 December 2025
You are already at the latest version
Abstract
The rapid integration of artificial intelligence (AI) and smart technologies is transforming hospitality operations, yet guest acceptance remains uneven, shaped by utilitarian, experiential, ethical, and cultural evaluations. This study develops and empirically tests a multicomponent framework to explain how these factors jointly influence two behavioral outcomes: whether AI-enabled features affect hotel choice and whether guests are willing to pay a premium. A cross-sectional survey of 689 hotel guests in Tirana, Albania, an emerging hospitality market and rapidly growing tourist destination in the Western Balkans, was analyzed using cumulative link models, partial proportional-odds models, nonlinear and interaction extensions, and binary robustness checks. Results show that prior experience with smart or AI-enabled hotels, higher awareness, and trust in AI, especially trust in responsible data handling, consistently increase both acceptance and willingness to pay. Perceived value, operationalized through the breadth of identified benefits and desired features, also exhibits robust positive effects. In contrast, privacy concerns selectively suppress strong acceptance, particularly financial willingness, while cultural–linguistic fit and support for human–AI collaboration contribute positively but modestly. Interaction analyses indicate that trust can mitigate concerns about reduced personal touch. Open-ended responses reinforce these patterns, highlighting the importance of privacy, human interaction, and staff–AI coexistence. Overall, findings underscore that successful AI adoption in hospitality requires aligning technological innovation with ethical transparency, experiential familiarity, and cultural adaptation.
Keywords:
artificial intelligence
; smart hospitality
; guest acceptance
; willingness to pay
; trust in AI
; privacy concerns
; cultural fit
; human–AI collaboration
; ordinal regression
; hospitalitytechnology adoption
1. Introduction
The hospitality industry is undergoing a rapid and structural transformation driven by the integration of artificial intelligence (AI) and smart technologies. Hotels increasingly deploy AI-powered concierges, service robots, mobile check-in systems, predictive analytics, and in-room voice assistants to enhance operational efficiency, personalize guest experiences, and address workforce shortages (Marghany et al. 2025; Ren et al. 2025). The adoption of such technologies accelerated markedly during the COVID-19 pandemic, when digital and contact-light service processes became essential for reducing physical interactions and maintaining operational continuity (Kim et al. 2021; Yang et al. 2021). As AI continues to develop, understanding how guests evaluate these innovations has become strategically important for the future competitiveness and sustainability of hotel operations.
Despite significant technological progress, guest acceptance remains uneven and often ambivalent. While some travelers value the convenience, efficiency, and novelty of smart and AI-enabled services, others express reservations related to impersonality, reduced human warmth, job displacement, and the loss of emotional connection traditionally associated with hospitality encounters (Gursoy 2025; Kang et al. 2023). Privacy and data-security concerns amplify this ambivalence: many guests hesitate to adopt systems requiring behavioral or personal data, citing fears of surveillance, profiling, or misuse (Jia et al. 2024; Hu and Min 2025). These tensions underline a practical dilemma: if guests do not accept AI-enabled services, investments risk underuse, reputational challenges, and strategic misalignment, particularly in emerging markets, where digital transformation is still consolidating and guest exposure to advanced smart technologies varies widely.
Albania provides a compelling context for examining these issues. As one of the fastest-growing tourism destinations in the Western Balkans, the country has experienced rapid increases in international arrivals and substantial investment in accommodation infrastructure. Yet the integration of smart and AI-enabled systems in Albanian hotels remains at an early developmental stage, characterized by heterogeneous adoption, unequal technological readiness, and limited guest familiarity. This combination of strong tourism growth and emergent digitalization makes Albania an ideal empirical setting for studying how guests evaluate AI-enabled hospitality services when exposure, expectations, and cultural norms are still forming. Moreover, understanding acceptance dynamics in such settings can inform both local managerial strategies and broader debates about AI adoption in developing and transitional tourism markets.
The academic literature offers important insights, but significant gaps remain. Foundational models such as the Technology Acceptance Model (TAM) (Davis 1989) and the Unified Theory of Acceptance and Use of Technology (UTAUT/UTAUT2) (Venkatesh et al. 2003; Venkatesh et al. 2012) emphasize utilitarian determinants, usefulness and ease of use. More recent hospitality frameworks, including the Service Robot Acceptance Model (SRAM), incorporate anthropomorphism, trust, social presence, and emotional expectations (Shum et al. 2024; Chi et al. 2023). Yet most existing studies examine one technology at a time, focus on specific contexts (e.g., robots, kiosks, or chatbots), or rely on highly technologically developed markets. Little is known about how multiple experiential, ethical, interpersonal, and cultural considerations jointly shape guest acceptance in emergent hospitality ecosystems, where exposure to AI technologies remains limited.
A second gap concerns value perceptions and financial willingness. While some studies examine behavioral intentions, far fewer investigate whether guests are willing to pay more for AI-enhanced services, a key managerial consideration as hotels weigh the costs and benefits of technological investment. A third gap relates to interaction effects: although concerns about depersonalization are well documented, little empirical research has examined whether trust in AI can buffer or moderate these concerns.
To address these gaps, this study develops and tests a comprehensive framework integrating three complementary domains. The first domain encompasses core acceptance drivers, including utilitarian evaluations, experiential familiarity, and awareness of AI-enabled hospitality technologies. The second domain addresses human and ethical dimensions, such as trust in AI, privacy and data-handling concerns, and interpersonal expectations regarding warmth and human interaction. The third domain captures contextual and value-based considerations, particularly cultural–linguistic fit and guests’ willingness to pay for AI-enhanced services. Together, these dimensions allow for an integrated perspective that goes beyond narrow, single-construct models. The empirical analysis focuses on two ordered behavioral outcomes: whether smart or AI technologies influence hotel choice and whether guests are willing to pay more for AI-enabled services, reflecting both attitudinal and financial acceptance.
Building on this conceptual foundation, the study investigates five research questions (RQs), each linked to theoretically grounded hypotheses (Hs).
RQ1 examines experiential and awareness-related determinants of acceptance. Correspondingly, H1 proposes that guests with prior smart/AI hotel experience exhibit higher acceptance, while H2 posits that greater awareness of AI technologies increases acceptance, particularly willingness to pay.
RQ2 considers how trust, privacy, and ethical concerns shape guest responses. H3 asserts that higher trust in AI and responsible data handling increases acceptance, whereas H4 predicts that privacy concerns reduce strong acceptance, especially financial willingness.
RQ3 investigates how perceived value influences behavioral intentions and financial readiness. H5 states that perceiving more benefits and desirable features increases acceptance and willingness to pay, while H6 predicts that privacy concerns suppress willingness to pay more strongly than general interest.
RQ4 addresses interpersonal and cultural expectations. H7 suggests that lower digital familiarity is associated with reduced acceptance, H8 notes that preference for human interaction may relate ambiguously to acceptance, and H9 proposes that better cultural–linguistic fit enhances acceptance.
Finally, RQ5 examines interaction mechanisms. H10 hypothesizes that trust weakens the negative effect of perceived loss of personal touch on acceptance.
By integrating these conceptual streams and applying cumulative link models, partial proportional-odds models, nonlinear extensions, and robustness checks to a large in-person survey conducted in Albania, the study provides new empirical evidence on how guests in emerging markets evaluate AI-enabled hospitality services. The findings contribute to the literature by (1) offering a unified, multi-domain framework that incorporates experiential, ethical, interpersonal, and cultural influences; (2) addressing financial acceptance as a distinct and managerially relevant outcome; and (3) identifying interaction mechanisms, particularly involving trust, that shape how guests negotiate trade-offs between convenience, ethical confidence, and interpersonal expectations. These insights offer practical relevance for researchers and practitioners designing ethically transparent, culturally adaptive, and guest-centered AI-enabled hospitality services in Albania and comparable emerging destinations.
2. Literature Review
Artificial intelligence (AI) has rapidly become one of the most transformative forces shaping contemporary hospitality services. Hotels increasingly deploy AI-enabled systems such as intelligent check-in kiosks, natural-language chatbots, predictive recommendation engines, facial-recognition entry, voice-controlled smart rooms, and automated service fulfillment. These technologies rely on machine learning, natural language processing, and real-time data analytics to enhance convenience, streamline interactions, and support personalized service delivery (Tussyadiah 2020; Buhalis & Leung 2018; Ivanov and Webster 2019). As these systems expand across both front-stage and back-stage operations, understanding how guests form evaluations and intentions toward AI-enabled hospitality services has become a central research priority (Mariani & Borghi 2023; Huang and Rust 2018).
Within this context, the literature highlights three broad domains: utilitarian-experiential foundations, human–social and ethical considerations, and contextual value assessments, that align closely with the constructs measured in this study. The following sections review these domains using terminology parallel to the survey instrument and analytical framework.
2.1. Core Acceptance Drivers: Utilitarian, Experiential, and Prior Experience
Technology acceptance theories such as TAM (Davis 1989) and UTAUT/UTAUT2 (Venkatesh et al. 2003; 2012) consistently emphasize functionality, performance expectancy, and ease of use as foundational drivers of technology adoption. In AI-enabled hospitality, these drivers typically manifest as perceived improvements in convenience, speed, and personalization, shaping guests’ evaluations of whether AI-enabled services are useful, reliable, and conducive to a smooth hotel experience (Gursoy et al. 2019); Prentice et al. 2020). Operationally, such gains are reflected in technology-mediated guest journeys, where self-service interfaces reduce perceived waiting burdens at check-in (Kokkinou & Cranage 2013), AI-supported personalization strengthens the perceived relevance of recommended services (Makivić et al. 2024), and smart-hotel attributes include in-room control features (e.g., lighting/room settings) that enhance convenience and perceived performance (Kim et al. 2020).
Consistent with this theoretical foundation, awareness of smart and AI-enabled technologies emerges as an important antecedent of acceptance. Awareness can shape expectations about functionality and reduce ambiguity by helping individuals understand what AI systems can do and when they are appropriate to use. In tourism and hospitality contexts, evidence also indicates that consumers differ substantially in their familiarity with AI tools and in the benefits/disadvantages they attribute to them, supporting the premise that knowledge and awareness condition subsequent evaluations and intentions (Sousa et al. 2024).
Similarly, prior smart/AI hotel experience is expected to predict acceptance because experiential familiarity reduces uncertainty and increases confidence in navigating technology-mediated service encounters. In smart-hotel research, perceived usefulness and ease of use are empirically linked to technology amenities and visiting intentions, supporting the role of direct exposure and learning-by-using in strengthening acceptance (Yang et al. 2021). Related evidence from AI personalization in hotels also shows that technological experience is integral to how guests evaluate AI-enabled value creation and service outcomes (Makivić et al. 2024).
Perceived value plays a central role in shaping both attitudinal and financial acceptance. In this study, value is operationalized through the number of perceived benefits associated with AI-enabled hospitality services and the number of desired AI features guests would like hotels to adopt. These measures reflect functional, emotional, and epistemic value dimensions commonly identified in hospitality technology research (Mariani and Borghi 2021; Prentice et al. 2020). Perceived benefits include convenience, speed, personalization, multilingual assistance, and enhanced accuracy, while desired features capture interest in additional AI capabilities such as smart-room automation, predictive recommendations, or enhanced check-in efficiency (Said 2023). Research consistently shows that guests who identify more benefits or express interest in more AI features demonstrate higher acceptance and greater willingness to pay (Ivanov & Webster 2024).
Collectively, awareness, prior experience, and perceived value, captured through perceived benefits and desired features, represent the utilitarian and experiential core of AI acceptance.
2.2. Human and Social Dimensions: Interaction, Trust, and Ethics
AI-enabled hospitality interactions are shaped not only by functional evaluations but also by human–social and ethical expectations. Hospitality is a service domain where warmth, empathy, and human interaction traditionally play central roles (Barnes et al. 2020). Accordingly, constructs such as trust in AI, privacy concerns, perceived loss of personal touch, and support for human–AI collaboration capture the interpersonal and ethical evaluations that shape adoption.
Trust in AI, defined as confidence in the accuracy, fairness, responsibility, and data-handling competence of AI systems, is widely recognized as one of the strongest determinants of acceptance (Wirtz et al. 2018; Hoffman et al. 2013). When guests trust that AI systems operate reliably and ethically, they experience lower uncertainty and are more likely to rely on AI-enabled services. Trust also reduces perceived risk in contexts involving sensitive information or automated decision-making (McLean et al. 2020; Kim et al. 2020).
Conversely, privacy concerns represent a major inhibitor of AI adoption. Because AI systems often rely on personal, behavioral, or biometric data, guests frequently worry about how information is collected, stored, and used (Culnan & Armstrong 1999; Morosan and DeFranco 2015). Privacy concerns have especially strong effects on financial acceptance suppressing willingness to pay for AI-enabled services even among guests who express general curiosity or mild interest. This aligns directly with the operationalization used in this study.
Interpersonal expectations further shape acceptance. Perceived loss of personal touch, measured directly in the survey, captures concerns that AI interactions may feel less warm, less empathetic, or less emotionally attuned. These concerns often arise in interactions involving chatbots, automated recommendations, or standardized AI responses. Research shows that such interpersonal reservations may not always reduce acceptance directly but may influence how guests interpret other constructs, such as trust (Kang et al. 2023).
This is especially relevant for the interaction mechanism tested in the present study, where trust in AI is hypothesized and found to weaken the negative implications of perceived loss of personal touch. Prior literature supports this buffering effect: trust can mitigate concerns about depersonalization by increasing comfort with automated interactions (Wirtz et al. 2018).
Finally, support for human–AI collaboration captures attitudes toward hybrid service models in which AI augments rather than replaces staff. Studies show that guests often prefer AI systems that assist employees (e.g., by automating routine tasks or providing real-time recommendations), enabling staff to focus on emotional labor and personalized service (Tuomi et al. 2021; Ivanov and Webster 2024). This construct aligns with the collaborative-service logic embedded in the instrument.
Together, these human–social and ethical constructs reflect a multidimensional evaluation that goes beyond functionality and addresses the relational and emotional expectations that define hospitality.
2.3. Contextual and Value Considerations: Cultural Fit and Willingness to Pay
Acceptance of AI-enabled hospitality services also depends on contextual and cultural fit. Cultural–linguistic fit, measured as the perceived alignment between AI system communication and local language or cultural norms, plays a critical role in shaping comfort and trust (Holmqvist et al. 2017) AI interactions that reflect appropriate language structures, politeness norms, and culturally sensitive communication patterns are perceived as more natural and reliable. Conversely, poorly localized AI outputs may generate friction, reduce perceived authenticity, or signal technological immaturity, especially in emerging markets (Mariani and Borghi 2023).
These contextual perceptions shape behavioral outcomes. In this study, acceptance is operationalized through two distinct behavioral and financial outcomes: whether AI-enabled services influence hotel choice and whether guests are willing to pay more for such services. These measures align with the hospitality literature, which distinguishes between attitudinal interest and financial readiness (Prentice et al. 2020).
The privacy calculus framework predicts that perceived benefits increase both outcomes, whereas privacy concerns suppress them, particularly willingness to pay (Culnan and Armstrong 1999; Morosan and DeFranco 2015). Similarly, cultural–linguistic fit enhances both behavioral acceptance and perceived value, contributing to guests’ readiness to support AI-integrated experiences (Ren et al. 2025).
These insights emphasize that AI acceptance is not solely a matter of technical performance but depends on cultural resonance, ethical confidence, and perceived value relative to cost.
3. Materials and Methods
3.1. Study Design and Context
This study investigates hotel guests’ acceptance of smart and AI-enabled technologies in accommodation settings. A cross-sectional quantitative survey design was employed, consistent with methodological approaches in hospitality-technology and AI-acceptance research that emphasize structured behavioral-intention modelling (Chiu and Chen 2025; Ozturk et al. 2023; Ren et al. 2025; Soliman et al. 2025). The conceptual framework integrates multiple theoretical streams. First, technology-acceptance perspectives from TAM (Davis 1989) and UTAUT/UTAUT2 (Venkatesh et al. 2012) inform the utilitarian foundations of the instrument. Second, human–social dimensions of technology-mediated service encounters: trust, privacy, perceived loss of human touch, and preferences for interpersonal interaction, draw on empirical research in service automation and AI-enabled hospitality contexts (Wirtz et al. 2018; Kim et al. 2021; Lin and Mattila 2021). Third, contextual and cultural value considerations, including cultural–linguistic fit and support for human–AI collaboration, reflect emerging literature on service-ecosystem adaptation (Holmqvist et al. 2014; Holmqvist et al. 2017; Ivanov et al. 2022).
Within this integrated framework, the study investigates two ordered behavioral outcomes: whether smart or AI-enabled features influence hotel choice and whether guests are willing to pay more for such services. Both outcomes were measured as three-category ordinal variables and analyzed using cumulative link models (CLMs) and, where necessary, partial proportional-odds models (PPOMs), which are appropriate for ordinal data and enable direct modelling of category transitions (Agresti 2010; Christensen 2023; Peterson & Harrell 1990).
The empirical setting is Tirana, the capital of Albania, a rapidly expanding tourism hub in the Western Balkans where the adoption of smart and AI-enabled systems in accommodation remains emergent. Skanderbeg Square, the city’s central plaza, was selected due to its heterogeneous, high-footfall mix of domestic and international visitors, providing access to diverse respondents rather than a statistically representative population. To avoid overstating generalizability, claims of representativeness were deliberately avoided, and the non-probability nature of the sampling design is explicitly acknowledged in the Discussion.
3.2. Instrument Development and Constructs
The survey instrument, Guest Acceptance of Smart and AI Technologies in Hospitality, was developed following an extensive review of contemporary hospitality-technology research and empirical studies on AI-enabled service encounters, robotics, and digital guest experiences. TAM and UTAUT/UTAUT2 informed the utilitarian determinants. Research on hedonic motivation, trust, privacy, ethics, and anthropomorphism guided the human–social domain (Wirtz et al. 2018); (Lin & Mattila 2021); (Kim et al. 2021). Cultural adaptation and human–AI collaboration items were designed in line with service-ecosystem and cultural-fit literature (Holmqvist et al. 2017; Ivanov and Webster 2019).
Items from validated scales were adapted where applicable and examples of adapted constructs (e.g., trust, privacy, human-interaction importance) are documented in Table A1 to ensure transparency. For constructs lacking validated measures, particularly cultural fit and support for AI–staff collaboration, items were developed following best-practice guidelines for clarity and non-leading wording (Dillman et al. 2015). Content and face validity were strengthened via expert review by two hospitality-technology academics and a pilot test (N = 20), which confirmed comprehension and resulted in minor refinements.
The final questionnaire contained four conceptual blocks: (a) awareness and experience, (b) perceived benefits and desired features, (c) ethical–human–trust evaluations, and (d) behavioral outcomes. A full list of all items, response formats, and variable names is provided in Table A1 (Appendix).
3.3. Measurement Model and Reliability Considerations
The survey instrument comprised utilitarian, experiential, and ethical constructs measured using single-item evaluations, Likert-type items, and multi-response checklists. The study employed ordinal and logistic regression models rather than a latent-variable SEM framework; consequently, constructs were operationalized through theoretically appropriate single-item or formative indicators. Item specifications and coding rules are detailed in Table A1 and in the accompanying reproducible R script (Code S1, Supplementary, Materials).
Several constructs, including trust in AI, cultural-linguistic fit, privacy concern, and perceived loss of personal touch, were intentionally designed as single, conceptually narrow items. Psychometric research supports the use of single-item measures when the underlying construct is narrow, unambiguous, and readily understood by respondents (Bergkvist & Rossiter 2007; Fuchs & Diamantopoulos 2009). Because these constructs were measured with single items, internal-consistency reliability indices (e.g., Cronbach’s α or McDonald’s ω) and related multi-indicator metrics (e.g., composite reliability) were not applicable and were therefore not reported (DeVellis 2017; Tavakol & Dennick 2011; Fuchs & Diamantopoulos 2009).
Perceived benefits and desired features were collected through multi-response selection lists. These were treated analytically as formative “breadth indicators,” where each selected option contributes distinct information about perceived value and omissions do not constitute measurement error.
Likert-type (1–5) evaluations of comfort with AI, trust, human-interaction importance, cultural fit, and support for human–AI collaboration were treated as approximately interval-scaled. This approach aligns with methodological evidence that common parametric procedures are generally robust for Likert-type responses, especially when sample sizes are moderate-to-large and/or items are aggregated into scales, often yielding inferences comparable to nonparametric alternatives (Harpe 2015; Norman 2010; Sullivan & Artino 2013). Tri-level items, such as privacy concern, perceived loss of personal touch, awareness, and prior AI experience, were coded on an ordered 0–2 scale to preserve ordinal meaning for subsequent ordinal modelling.
All preprocessing steps including harmonization of categorical variables, construction of indicator variables, generation of formative breadth counts, and creation of ordinal and binary outcomes, are comprehensively documented in the reproducible R script (Code S1, Supplementary, Materials). Descriptive distributions, missing-data patterns, and pairwise correlations were examined to verify the expected behavioral and attitudinal structure prior to model estimation.
3.4. Sample and Data Collection
Data were collected between May and October 2025 using an intercept survey administered face-to-face by trained undergraduate students from the University of Tirana. Respondents were screened to ensure that they had recently stayed in a hotel or planned to do so during their current visit. Participation was voluntary and anonymous, and all respondents provided informed consent.
Survey administration was conducted digitally via Google Forms, accessed through QR codes or tablets provided by the students team. This ensured immediate electronic capture, minimized transcription errors, and allowed real-time monitoring for data quality. A total of 689 complete responses were collected. After excluding cases with missing dependent-variable values, analytic subsamples consisted of N_infl = 687 for the influence-on-choice models, N_wtp = 687 for willingness-to-pay models, and N_both = 686 for joint analyses.
The voluntary, intercept-based data collection conducted in a public urban space introduces potential self-selection and time-of-day or day-of-week sampling biases. Because no weighting adjustments were feasible, these limitations are explicitly acknowledged in the Discussion.
All procedures complied with the ethical standards of the University of Tirana and adhered to principles of anonymity, voluntary participation, confidentiality, and the right to withdraw at any time.
3.5. Data Preparation and Coding
Data preparation followed standard analytical procedures and was conducted using a fully scripted workflow to ensure transparency and reproducibility. Raw responses were screened for completeness and inconsistencies, and missing patterns were examined descriptively. Categorical variables were harmonized across all items. Tri-level evaluative items such as privacy concerns, perceived loss of personal touch, awareness of smart technologies, and prior AI experience were recoded into ordered 0–2 formats to preserve ordinal distinctions.
Likert-type items (1–5) capturing comfort with AI, trust in AI, human-interaction importance, cultural-linguistic fit, and support for AI–staff collaboration were treated as approximately interval-scaled. This practice is supported by methodological research showing that parametric analyses applied to Likert-type measures are robust in samples of this size (Norman 2010; Harpe 2015; Sullivan & Artino 2013). The use of numeric codings for these items does not affect the ordinal-logit modeling of dependent variables, which remain strictly ordinal.
Multiple-response questions assessing perceived benefits and desired smart or AI features were converted into binary indicators for each selected option and aggregated into two count variables representing the breadth of perceived value (n_benefits and n_features). These indicators reflect the number of selections made rather than a reflective latent construct.
The two primary behavioral outcomes were recoded as ordered factors: infl_choice3 (No / Unsure / Yes) reflecting whether smart or AI technologies influence hotel choice, and wtp3 (No / Depends / Yes) capturing willingness to pay more for AI-enabled services. In addition, binary “top-box” indicators (infl_yes, wtp_yes) were created for robustness analyses focusing exclusively on unequivocal acceptance, with acknowledgment that dichotomization reduces information but enhances interpretability in robustness checks.
Demographic variables, including age group, gender, and hotel-stay frequency, were recoded into harmonized categories with explicit handling of missing responses. Descriptive statistics (means, standard deviations, minima, maxima) were generated for all numeric predictors, and frequency distributions were produced for categorical and ordinal variables. Pearson correlation matrices were computed for the numeric codings; the decision not to compute polychoric correlations is justified because no factor analysis was conducted and the models relied on ordinal regression frameworks.
All coding rules and preprocessing functions are documented in the reproducible R script (Code S1, Supplementary, Materials).
3.6. Statistical Modelling Strategy
The modelling strategy followed a sequential structure aligned with the conceptual organization of the questionnaire. Both behavioral outcomes: whether smart and AI technologies influence hotel choice and whether guests are willing to pay more, were measured using three ordered response categories. Cumulative link models (CLMs) with a logit link (i.e., proportional-odds models) were therefore used as the primary analytical framework, as they are well-suited to ordinal outcomes and estimate cumulative odds across ordered thresholds (Agresti 2010; Christensen 2023; McCullagh 1980).
The first stage estimated parsimonious baseline models (A1, A2) incorporating core determinants of technology acceptance, including awareness of smart technologies, prior AI-related experience, comfort with AI, perceived value (captured through the breadth of selected benefits and features), and demographic factors. Ethical and privacy-related constructs: privacy concerns and perceived reduction of personal touch, were added in the second stage (B1, B2) to assess whether reservations related to surveillance, data protection, or diminished human warmth attenuate acceptance independently of utilitarian evaluations. These factors are well established as inhibitors of service-technology adoption (Wirtz et al. 2018; McLeay et al. 2021; Jia et al. 2024; Lv et al. 2025).
Full attitudinal models (C1, C2) incorporated broader human–social and cultural factors: trust in AI to manage personal data, the importance placed on human interaction during hotel stays, cultural–linguistic fit, and support for human–AI collaboration. Including these constructs enabled a comprehensive assessment of whether cultural alignment, interpersonal expectations, and ethical considerations shape acceptance of AI-enabled hospitality services.
For each CLM, the proportional-odds assumption was evaluated using nominal tests. When predictors violated the proportional-odds (parallel-slopes) assumption, partial proportional-odds models were fitted within the VGAM vector generalized linear modeling framework (Peterson & Harrell 1990; Yee 2010). PPOMs retain the ordinal structure of CLMs while allowing selected coefficients to vary across thresholds, yielding a more flexible model when parallel slopes are not supported empirically.
Robustness checks were conducted using binary logistic regressions for the top-box outcomes (infl_yes, wtp_yes), which isolate respondents expressing unequivocal acceptance. Model adequacy was evaluated using the Akaike information criterion (AIC) and McFadden’s pseudo-R2 (Akaike 1974; McFadden 1974). Multicollinearity was assessed using variance inflation factors (VIFs), (O’brien 2007; Fox & Monette 1992; Liu & Zhang 2018; Greenwell et al. 2018). and ordinal-model diagnostics were examined using surrogate residuals to assess fit and detect potential outliers or influential observations.
Nonlinearities were examined by including centered quadratic terms for n_benefits and n_features (models D1, D2). Interaction models (E1, E2) tested whether trust moderated the effect of perceived loss of personal touch, with predicted probabilities and 95% confidence intervals computed to aid interpretation.
Finally, open-ended recommendations were analyzed using a lightweight text-mining procedure. Responses were tokenized, stop-words were removed, and unigram and bigram frequencies were computed to identify salient themes that complement the quantitative findings.
3.7. Software, Transparency, and Reproducibility
All analyses were conducted in R (R Core Team 2024) using widely adopted and well-documented packages for data import, preprocessing, ordinal modelling, diagnostics, visualization, and text processing. Data were imported with readxl and prepared using the tidyverse ecosystem (e.g., dplyr, tidyr, stringr, forcats, tibble) (Wickham et al. 2019). Ordinal outcomes were analysed using cumulative link models implemented in ordinal (Christensen 2023) and, where proportional-odds violations required relaxation, partial proportional-odds models were estimated using VGAM (Yee 2010). Diagnostic procedures drew on car. Visualizations were produced with ggplot2 (Wickham 2016). Open-ended recommendations were processed using tidy text-mining workflows with tidytext (Silge & Robinson 2016).
To ensure transparency and reproducibility, the complete data-cleaning and modelling workflow, including all recoding rules, derived-variable construction, model specifications, diagnostics, robustness checks, and exported outputs, was documented in a fully reproducible R script provided in Code S1, Supplementary Materials. The script covers the full pipeline from raw data import to final model estimation, including the construction of derived measures, estimation of baseline and extended ordinal models, proportional-odds diagnostics, PPOM estimation, binary logistic robustness checks, nonlinearity and interaction assessments, and text-mining routines. Key outputs (e.g., descriptive statistics, correlation matrices, CLM/PPOM estimates, diagnostic tests, and text-mining frequency tables) are included in tabular form.
The study followed ethical standards for social-science research and adhered to responsible practices in the use of artificial intelligence. Generative AI tools were used exclusively for language refinement and organizational editing of the manuscript. No generative AI systems were used for data handling, model estimation, statistical analysis, or interpretation, in line with emerging best-practice recommendations for AI-assisted academic writing (Porsdam Mann et al. 2024).
4. Results
4.1. Sample Characteristics and Outcome Prevalence
The final dataset comprised 689 respondents, with 687 non-missing observations for each of the two main outcomes (“Smart technologies and AI influences hotel choice” and “willingness to pay more”). The age structure was skewed toward younger adults: 35.1% were 18–24 years, 20.5% were 25–34, and 17.3% were 35–44, while 12.5% were 45–54, 10.9% were 55+, and 3.8% were under 18 (Table 1). Respondents under 18 were retained following ethics approval permitting anonymous voluntary participation without identifying information. All reported proportions are unweighted.
Women represented 55.4% of the sample, men 43.8%, and a small fraction reported “other/missing” (Table 2). Hotel-stay frequency was generally moderate, with almost exactly four in five respondents reporting 1–5 hotel stays per year and only about one fifth staying more than six times (Table 3). Hotel-stay frequency refers to all hotel stays, domestic or international.
Outcome distributions showed that most respondents were cautious or uncertain about smart technologies and AI in hospitality. For hotel choice, 17.9% stated that smart technologies and AI would not influence their choice, 53.7% were unsure, and 28.4% indicated that smart technologies and AI would influence their choice (Table 4). For willingness to pay more, 26.2% responded “No,” 51.4% “Depends,” and 22.4% “Yes” (Table 5).
Cross-tabulations by gender and age indicate broadly similar patterns across groups, with some tendencies for older respondents and women to be less willing to pay more, but these differences are modest at the descriptive level (Table A2, Table A3, Table A4 and Table A5, Appendix).
Missing data were minimal across all variables. For most predictors and both outcomes, only a small number of responses were missing, leading to model-specific sample sizes between N = 677 and N = 682, relative to the full analytic sample of N = 689 (Table S1, Supplementary Materials). Depending on model complexity, this corresponds to approximately 26–40 observations per estimated coefficient (Table S2, Supplementary Materials), which is comfortably above common heuristic thresholds used to reduce small-sample bias and instability in logistic-type regression models (e.g., ≈10+ events per parameter), supporting coefficient reliability (Peduzzi et al. 1996; Vittinghoff & McCulloch 2007; Riley et al. 2019).
4.2. Descriptive Patterns in Key Constructs
Descriptive statistics for the main numeric constructs are reported in Table 6. On average, respondents identified 2.79 smart and AI related benefits (SD = 1.39, range 1–7) and 6.21 desired technological features (SD = 3.38, range 1–16). Frequency distributions for these two counts (Table A6, A7, Appendix) show that most guests see multiple benefits rather than a single isolated advantage, and that many desire relatively rich feature sets.
Comfort with AI-enabled hotel services was moderate, with a mean of 3.35 on a 1–5 scale (SD = 1.05). Awareness of smart technologies in hospitality was relatively high (mean 1.65 on a 0–2 scale), while prior experience with smart and AI hotels was more limited but non-trivial (mean 1.18 on a 0–2 scale). Ethical and human-centered attitudes showed substantial variation. Privacy concerns were roughly evenly distributed across the three levels (0, 1, 2), and more than half of respondents felt that AI makes hotel services “somewhat” or “much” less personal (Table A8, A9, Appendix). In contrast, trust in AI for handling personal data was centered around the mid to high end of the scale (mean 3.15, SD 0.98), with a clear majority in the “3–4” range and a smaller group at the extremes (Table A10, Appendix). Cultural and linguistic fit and support for staff–AI training were evaluated very positively: approximately 70% selected the two highest categories for both “AI fits local language and culture” and “Hotels should train staff to collaborate with AI” (Table A11, A12, Appendix). These patterns are summarized graphically in Figure 1, which displays distributions for key ethical and attitudinal indicators. Percentages are shown without error bars because they represent full-sample distributions.
Overall, the descriptive results suggest a nuanced profile: respondents recognize several potential benefits and are interested in a variety of smart features, but they also express non-negligible privacy concerns and a strong desire to preserve human interaction, while simultaneously supporting AI as a tool that complements and augments staff.
4.3. Correlations and Collinearity Diagnostics
Pearson correlations among the numeric predictors (Table A13, Appendix) show that the strongest association occurs between the number of perceived benefits and the number of desired features (r = 0.51), indicating that these variables capture a shared underlying tendency toward valuing smart and AI-enabled hotel services. All remaining relationships among predictors are small to modest in magnitude, with most absolute correlations falling below |r| < 0.25 and only a limited number extending into the 0.22–0.30 range. Comfort with AI shows modest associations with the number of desired features (r = 0.22), prior experience with AI-enabled hotels (r = 0.22), and trust in AI (r = 0.23). Awareness of smart technologies correlates moderately with prior AI experience (r = 0.30), reflecting expected experiential links. Privacy concerns exhibit a small positive association with perceiving AI as making hotel services less personal (r = 0.18) and a modest negative association with trust in AI (r = –0.25). These patterns are consistent with prior hospitality automation research showing that privacy/risk perceptions and human-touch related evaluations represent distinct considerations alongside functional and experiential value in guests’ technology acceptance (Lei et al. 2024; Huang and Rust 2018; Lin & Mattila 2021; McLean et al. 2020; Pizam et al. 2024; Wirtz et al. 2018).
Extending the analysis to include the ordinal outcomes (Table S3, Supplementary Materials) shows that both behavioral variables exhibit small-to-moderate associations with theoretically relevant attitudinal predictors. For the “influence on hotel choice” outcome, the strongest correlations appear with trust in AI (r = 0.19), prior AI hotel experience (r = 0.18), and awareness of smart technologies (r = 0.13). For willingness to pay more, awareness (r = 0.25), prior AI experience (r = 0.30), and trust (r = 0.26) are again the most notable correlates. Associations with demographic variables (age, gender) were weak, consistent with hospitality technology-acceptance evidence that intentions are more strongly explained by psychological appraisals and prior experience than by demographics, which often show limited or inconsistent effects once these factors are modeled (Kim 2016; Premathilake et al. 2025).
To assess the potential for multicollinearity to bias model estimation, variance inflation factors (VIFs) were computed for predictor sets in the binary logistic robustness models (Table S4, S5, Supplementary Materials). As rules of thumb, VIF values above roughly 5 (and especially 10) are often taken to indicate problematic multicollinearity, whereas values close to 1 indicate minimal inflation; accordingly, the observed VIFs (1.0–1.6) suggest negligible multicollinearity (Kim 2019; O’brien 2007). These results confirm that shared variance among predictors is modest, and that multicollinearity is unlikely to compromise coefficient stability, inflate standard errors, or distort inferential accuracy in either the ordinal or logistic models.
4.4. Ordinal models for AI influence on hotel choice
Table 7 presents the results from three cumulative link models (CLMs) estimating the ordinal outcome “AI influences hotel choice” (“No,” “Unsure,” “Yes”). Model A1 includes core technology-relevant constructs: perceived benefits, desired smart-feature counts, comfort with AI, awareness of smart technologies, and prior AI or smart hotel experience, together with demographic controls (age, gender, and hotel-stay frequency). Model B1 extends this baseline by adding two ethical concerns: privacy and perceived loss of personal touch. Model C1 further incorporates attitudinal predictors: trust in AI, importance of human interaction, perceived cultural and linguistic fit, and support for AI–staff collaboration.
Model performance improves gradually across specifications. McFadden’s pseudo-R2 increases from 0.047 (A1) to 0.053 (B1) and 0.073 (C1), while AIC decreases from 1342.94 to 1318.45 (Table 7). Based on McFadden’s benchmarks, values between 0.02 and 0.13 are typical for behavioral choice models; thus, these results indicate small to moderate explanatory power, appropriate for complex consumer-attitude outcomes.
The full coefficient and odds-ratio tables for all CLM, logistic, nonlinear, and PPOM models are provided in Supplementary Materials, Table S6. Reference categories for all analyses are: age = 18–24, gender = female, and privacy concern = 0 (no concerns reported).
The full coefficient estimates for Model C1 are reported in Tables S7, S8 (Supplementary Materials). Two predictors demonstrate consistent and statistically significant positive associations with stronger reported AI influence on hotel choice: prior stays in AI enabled hotels and trust in AI. These findings indicate that both direct experiential familiarity and confidence in AI capabilities shape guests’ willingness to rely on AI enabled hotel services. A pronounced age gradient is also evident: respondents aged 55+ report significantly lower levels of smart and AI driven influence than younger guests, consistent with the descriptive distributions by age (Table 1). Other variables, including perceived benefits, desired features, comfort with AI, privacy concerns, perceived loss of personal touch, and cultural expectations, do not reach conventional significance thresholds in Model C1, although their directions are broadly consistent with the descriptive frequency distributions of these attitudes (Table A2, Table A3, Table A8, Table A9, Table A10, Table A11 and Table A12). This pattern is visualized in Figure A1 (Appendix), where marginal effects were computed using the ggeffects package and show that higher trust in AI mitigates the dampening effect associated with perceiving AI as making hotel services less personal.
To assess whether the proportional-odds assumption was satisfied, proportional-odds diagnostics were performed using nominal_test() from the ordinal package. The results, shown in Table S9 (Supplementary Materials), consistently identify significant violations for privacy concerns in all influence and willingness-to-pay models (e.g., χ2 = 12.60, p < .001 for AI influence; χ2 = 10.57, p < .01 for WTP). A second, weaker but repeatable violation appears for n_features, which shows non-parallel effects in both extended and attitudinal models (e.g., p = .014 for AI influence; p = .023 for WTP).
These empirical violations match the descriptive cross-tabulations: respondents with higher privacy concerns are markedly less likely to choose “Yes” in both outcomes (Table A14, Table A15 Appendix). Binary logistic regression models (Table S10, S11 Supplementary Materials) reinforce this pattern, showing signifiant negative effects of privacy concerns for WTP (p < .001) and a near-significant negative relationship for AI influence (p ≈ .098).
Given the proportional-odds violations, a partial proportional-odds model (PPOM F1) was estimated, relaxing the parallel-slopes assumption for privacy concerns and n_features, the predictors flagged by the nominal tests. The PPOM for the influence outcome shows AIC = 1359.61, representing ΔAIC = +41.16 relative to Model C1. The PPOM reveals a clear asymmetry in privacy effects (Table S12, S13 Supplementary Materials). Privacy concerns exert their strongest negative influence on the highest category (“Yes”), with substantially weaker effects on transitions from “No” to “Unsure/Depends.” This aligns with the raw distributions, where reductions in “Yes” responses dominate the privacy gradient. Although these violations are statistically meaningful, the substantive conclusion remains unhanged: privacy concerns selectively suppress strong endorsement rather than shifting responses uniformly across the entire response scale. Pseudo-R2 values are not reported for PPOMs because the VGAM framework does not compute the null-model log-likelihood required for McFadden-type indices; AIC is therefore the primary evaluation metric.
Robustness checks using binary logistic regressions confirm these findings. Dichotomizing responses (“Yes” vs. “Not yes”) yields pseudo-R2 values of 0.096 for influence and 0.154 for willingness-to-pay (Table A16 Appendix), closely tracking the ordinal results. Trust in AI and prior AI-hotel experience remain the strongest predictors, while priay oncers again show a negative association, highly significant for WTP and near-significant for influence, consistent with their role in the CLM and PPOM models.
Multicollinearity diagnostics further support model stability. All variance-inflation factors fall between 1.05 and 1.60 (Tables S4, S5 Supplementary Materials), consistent with the moderate correlations observed in the numeric predictor matrix (Table A13) and the extended matrix including ordinal and binary outcomes (Table S3, Supplementary Materials).
Taken together, results from the CLM, PPOM, and logistic-regression analyses converge on a coherent conclusion: trust in AI, prior AI hotel experience, and age differences are the most reliable determinants of whether AI influences hotel choice. Ethical concerns, particularly privacy, exert focused and selective effects, primarily reducing strong acceptance rather than shaping moderate or uncertain responses.
4.5. Ordinal Models for Willingness to Pay More
Parallel to the analysis of AI influence on hotel choice, three cumulative link models (CLMs) were estimated for the ordinal outcome willingness to pay more (“No,” “Depends,” “Yes”). The baseline Model A2 includes core technology-acceptance predictors; Model B2 adds privacy and personal-touch concerns; and Model C2 incorporates the full attitudinal block, including trust in AI, human-interaction importance, cultural expectations, and views on AI–staff collaboration.
Model performance improves steadily across specifications. As shown in Table 7, pseudo-R2 increases from 0.089 in the baseline model (A2) to 0.100 in the extended model (B2) and 0.125 in the attitudinal model (C2). AIC declines from 1321.4 to 1309.6 and 1282.8. Based on McFadden’s benchmarks (0.02–0.13), these values indicate small-to-moderate explanatory power, and the models account for more variance in willingness to pay than in the influence-on-choice outcome, consistent with the descriptive distributions (Tables 5 and A3).
The full estimates for Model C2 are reported in Table S8 (Supplementary Materials) and reveal several statistically and substantively meaningful predictors.Higher awareness of smart and AI technologies is associated with greater willingness to pay more; this is one of the strongest attitudinal effects in the model. Prior stays in smart and AI enabled hotels also show a robust positive association, suggesting that direct experience increases the perceived value of smart and AI supported services. Respondents who desire a broader set of smart features exhibit modestly higher willingness to pay that is consistent with descriptive frequency patterns in Appendix Table A3, while higher trust in AI is consistently associated with movement toward a higher willingness-to-pay category. In contrast, privacy concerns are negatively associated with willingness to pay, and this effect is statistically significant (p ≈ 0.009). This pattern mirrors the cross-tabulations in Appendix Table A3, where 36.6% of respondents with low privacy concerns select “Yes,” compared to only 14–15% among those with moderate or high concerns.
Two attitudinal variables, importance of human interaction and perceived cultural fit of AI, show positive but borderline-significant effects, suggesting that respondents who feel AI can complement rather than replace human service may be slightly more willing to pay a premium. Gender differences also emerge: men report greater willingness to pay than women (p ≈ 0.038), whereas gender differences were less pronounced for influence on hotel choice.
Diagnostic tests indicate that several predictors violate the proportional-odds assumption. The nominal-effects tests (using nominal_test() from the ordinal package) in Table S9 (Supplementary Materials) show significant violations for privacy concerns, desired feature counts, and two attitudinal variables (importance of human interaction and cultural fit). The χ2 statistics for these violations range approximately from 4 to 15 (p < .05), consistent with the crosstabs for privacy concerns (Table A8, Appendix) and the wider correlation structure shown in the extended matrix (Table S3, Supplementary Materials), where privacy concerns consistently exhibit the strongest negative associations with both willingness-to-pay variables (wtp3 and wtp_yes).
To account for these violations, a partial proportional-odds model (PPOM F2) was estimated, allowing privacy concerns, feature counts, human-interaction importance, and cultural fit to vary across thresholds. The PPOM results, reported in Appendix Table A17, reproduce the core findings of the CLM. Privacy concerns continue to exert a strong negative effect, and trust and prior experience continue to show positive associations with willingness to pay. The category-specific slopes reveal sharper contrasts between the “No” and higher categories, consistent with the descriptive distributions and the marginal-effects patterns (Figure A2, Appendix).
Binary logistic regressions (wtp_yes vs. all other responses) provide an additional robustness check. As shown in Appendix Table A16, pseudo-R2 reaches 0.154, higher than the ordinal pseudo-R2 values, while trust in AI, prior experience, and privacy concerns again emerge as significant predictors. These results closely mirror those from the CLM and PPOM models, supporting the stability of the main effects.
Finally, multicollinearity diagnostics (VIF values in Supplementary Tables S4 and S5) are all below conventional thresholds, indicating that the predictor set does not pose a threat to model stability. This aligns with the moderate correlations observed in the numeric matrix (Table A13, Appendix) and the full extended correlation structure (Table S3, Supplementary Materials).
Overall, the willingness-to-pay models present a coherent pattern across all specifications: awareness of smart technologies, prior smart and AI-hotel experience, trust in AI, and the desire for more smart features reliably increase willingness to pay a premium, while privacy concerns and older age reduce it. These results remain consistent across the CLM, PPOM, nonlinear, interaction, and binary logistic frameworks and are strongly supported by the descriptive patterns in the dataset and the consolidated odds-ratio evidence reported in Table S6 (Supplementary Materials).
4.6. Nonlinearities and Interaction Effects
To assess whether the effects of perceived value exhibit nonlinear patterns, Models D1 and D2 extended the attitudinal specifications by including mean-centered quadratic terms for the number of perceived benefits and features (quadratic terms were mean-centered to ensure interpretability and reduce collinearity). Across both outcomes, these nonlinear components were small in magnitude and not consistently statistically significant (Tables S14–S16, Supplementary Materials). For willingness to pay, the squared term for n_benefits showed a small effect (p ≈ 0.07), hinting at a mildly convex association in which incremental perceived benefits may exert slightly stronger effects among respondents already reporting a higher number of benefits. Nevertheless, the effect sizes remained modest, and improvements in model fit relative to the corresponding linear models were limited (ΔAIC < 4; pseudo-R2 increasing only from 0.073 to 0.075 for influence and from 0.125 to 0.130 for willingness to pay). Given these minimal gains, the linear formulation was retained for parsimony and interpretability.
Interaction Models E1 and E2 evaluated whether trust in AI moderates the relationship between perceived loss of personal touch and the two behavioral outcomes. Interaction predictors were centered prior to model estimation to reduce multicollinearity. For influence on hotel choice, the interaction between less_personal_num and trust_ai_num was statistically significant (estimate ≈ −0.25, p ≈ 0.015), resulting in a modest improvement in predictive performance (pseudo-R2 = 0.078 vs. 0.073; Table S19, Supplementary Materials). Predicted probabilities from Model E1 (Figure A1, Appendix), estimated using ggeffects::ggpredict, reveal a differentiated pattern: among respondents with low trust in AI, higher perceived loss of personal touch corresponds to a moderate increase in the probability of reporting that AI would influence their hotel choice (from roughly 5% to 20% “Yes” when trust = 1). By contrast, among high-trust respondents, greater perceived loss of personal touch slightly reduces the likelihood of reporting that AI matters for hotel choice (from approximately 51% to 40% “Yes” when trust = 5). This suggests that trust attenuates sensitivity to concerns about reduced human interaction, leading high-trust respondents to discount the negative implications of reduced personal touch.
For willingness to pay, the interaction term was not statistically significant (p ≈ 0.63), and changes in model fit relative to the attitudinal model were negligible (Model E2 vs. C2; Tables S17–S18, Supplementary Materials). Predicted probabilities (Figure A2, Appendix) indicate that, once overall trust and privacy concerns are accounted for, willingness to pay is driven predominantly by these broader attitudinal factors rather than by the interaction between perceived personal-touch loss and trust.
4.7. Binary Robustness Checks
To assess the robustness of the ordinal findings and to isolate respondents expressing unequivocal acceptance, additional binary logistic regressions were estimated for both outcomes, coded as “Yes” versus all other responses. Because dichotomization reduces variability and compresses information, these robustness models are interpreted cautiously. Results are summarized in Appendix Table A16, and complete odds-ratio estimates with 95% confidence intervals are reported in Table S6 (Supplementary Materials).
The model predicting whether smart technologies and AI influence hotel choice achieved an AIC of 784.7 with a McFadden pseudo-R2 of 0.096, while the willingness-to-pay model yielded an AIC of 662.7 and a pseudo-R2 of 0.154. These values align closely with the explanatory magnitudes observed in the cumulative link models, indicating broadly consistent performance across modelling approaches.
For the outcome reflecting whether smart technologies and AI influence hotel choice, the binary specification reproduces the strongest effects identified in the ordinal C1 model. Prior experience with smart or AI-enabled hotels shows a clear positive association (e.g., OR ≈ 1.53, 95% CI ≈ 1.18–1.98; Table S6, Supplementary Materials), indicating that respondents with direct experience are substantially more likely to answer “Yes.” Trust in AI likewise displays a robust positive effect (OR ≈ 1.41, 95% CI ≈ 1.22–1.65), again emerging as one of the most influential predictors. Hotel-stay frequency also contributes positively to the likelihood of endorsement, whereas respondents aged 55+ exhibit significantly lower odds (OR ≈ 0.61, 95% CI ≈ 0.42–0.88), confirming the pronounced age gradient observed in earlier models. Ethical and privacy-related constructs, particularly privacy concerns and perceptions of reduced personal touch, do not achieve statistical significance in the binary model, mirroring their weaker or threshold-specific effects in the ordinal C1 specification.
For willingness to pay more for AI-enhanced services, the binary results similarly reinforce the conclusions from the ordinal analysis. Awareness of smart technologies (OR ≈ 1.36), prior smart-AI hotel experience (OR ≈ 1.46), trust in AI (OR ≈ 1.49), and higher hotel-stay frequency all increase the probability of selecting “Yes,” with effect sizes closely reflecting those in the C2 model (Table S11, S6, Supplementary Materials). Privacy concerns exert a strong negative association (OR ≈ 0.68, 95% CI ≈ 0.54–0.86), confirming that privacy-related reservations most strongly constrain financial willingness rather than general interest. The perceived importance of human interaction shows a small, marginally significant positive association, suggesting that respondents who value human service may still appreciate AI when perceived as a complementary enhancement.
Across both outcomes, the binary models yield odds-ratio patterns highly consistent with the cumulative link and partial proportional-odds models. The direction and magnitude of key effects: trust in AI, prior experience, age differences, and privacy concerns, remain stable across all modelling frameworks, supporting the robustness of the core findings. Finally, multicollinearity diagnostics (VIF values in Tables S4–S5, Supplementary Materials) are within acceptable limits, aligning with the moderate correlations observed in the predictor matrices (Table A13 Appendix; Table S3 Supplementary Materials).
4.8. Analysis of Open-Ended Recommendations
To complement the quantitative findings, the open-ended responses were analyzed using a lightweight text-mining approach. All recommendations were tokenized into single words and bigrams, lowercased, and stripped of punctuation and stop-words. No lemmatization or stemming was applied; analyses were conducted on raw tokens to preserve respondents’ original lexical choices. To improve the interpretability of extracted terms, a custom stop-word list including generic hospitality terms such as “hotel,” “service,” and “guest” when used non-substantively, was added to the standard stop-word dictionary.
The resulting frequency distributions provide insight into the dominant themes that respondents emphasized when describing their expectations for AI-enabled hospitality services. Across all responses, the most frequent individual words (Table S20, Supplementary Materials) include “AI”, “hotels”, “data”, “staff”, and “guests”. These terms reflect a general concern with data handling, the interaction between AI and hotel staff, and the guest experience. Notably, “data” appears among the top tokens despite not being explicitly prompted, indicating that data protection and responsible data use resonate strongly with respondents.
Bigram analysis (Table S21, Supplementary Materials) uncovers more structured themes. The most common bigrams: “guest experience,” “human interaction,” “smart technologies,” “human touch,” and “personal data”, align closely with the central constructs measured in the survey. For example, the prominence of “human interaction” and “human touch” supports the quantitative finding that concerns about depersonalization remain salient even among technologically open respondents. Similarly, frequent references to “personal data” reinforce the consistent patterns observed for privacy concerns in the CLM, PPOM, and logistic models.
To ensure interpretive accuracy, the extracted lexical themes were subsequently reviewed manually for face validity by the research team. The qualitative patterns align closely with the statistical results, highlighting that respondents value technological convenience but remain attentive to issues of service warmth, privacy, and staff–AI collaboration. The correspondence between the qualitative themes and the model-based findings strengthens the conclusion that acceptance of smart and AI technologies is shaped not only by perceived utility but also by ethical, interpersonal, and experiential considerations.
5. Discussion
This study examined the determinants of hotel guests’ acceptance of smart and AI-enabled technologies through an integrated framework combining utilitarian, experiential, ethical, and cultural considerations. Two ordered behavioral outcomes: whether AI influences hotel choice and willingness to pay a premium, were analyzed through cumulative link models, partial proportional-odds models where necessary, nonlinear and interaction extensions, and binary robustness checks. The overall pattern of findings provides consistent empirical support for several of the proposed hypotheses, while also highlighting boundaries and contingencies in guests’ acceptance of AI-enabled hospitality services. As the empirical work was conducted in Albania, fast-growing but digitally emergent tourism market, the findings are particularly informative for understanding acceptance dynamics in settings where technological exposure and expectations are still developing.
5.1. Experiential and Awareness Factors
The results offer strong support for H1, indicating that prior experience with smart or AI-enabled hotels is a robust and stable predictor of acceptance across all modeling frameworks. This aligns with previous research emphasizing the role of experiential familiarity in reducing uncertainty and strengthening perceived usefulness in service technologies (Tavitiyaman et al. 2022; Yang et al. 2021; Venkatesh et al. 2003). The positive association between awareness of smart technologies and acceptance, especially willingness to pay, supports H2 and suggests that informational exposure may increase both perceived feasibility and perceived value.
These findings can be interpreted through (Rogers 2003) Diffusion of Innovations framework. Guests with prior smart-hotel experience can be viewed as more likely to belong to earlier adopter segments (innovators/early adopters/early majority) because they have already encountered and used AI-enabled services. In settings where such technologies are still emerging, the effect of direct exposure is consistent with Rogers’ concept of trialability, whereby opportunities to experiment with an innovation reduce uncertainty and perceived risk and can accelerate adoption intentions.
Likewise, the significant role of awareness aligns with the knowledge stage of the innovation-decision process, in which individuals first become informed about an innovation before developing more favorable evaluations and adoption intentions.
Notably, awareness predicted willingness to pay more strongly than general acceptance, suggesting that informational exposure may operate differently across behavioral outcomes. While classical diffusion models treat knowledge acquisition as a precondition for attitude formation broadly, the present findings indicate that awareness may be particularly consequential when financial commitment is required, a nuance that extends existing theoretical frameworks. In an emerging destination such as Albania, where guest familiarity varies widely, and exposure to AI-enabled hospitality remains uneven, these experiential and informational factors appear especially decisive. The results suggest that increasing public awareness through demonstrations, showcasing real-world applications, and facilitating low-risk trial opportunities may be critical strategies for accelerating responsible AI adoption in such markets.
5.2. Trust, Privacy, and Ethical Evaluations
The results strongly confirm H3, showing that trust in AI, particularly trust in data handling, emerges as one of the most influential predictors in both outcomes. This aligns with service-automation research showing that trust mitigates perceived risk and increases behavioral intentions toward AI-enabled services (Della Corte et al. 2023; Pavlou 2003). Notably, the trust measure employed in this study primarily captures what the literature identifies as integrity and benevolence dimensions of trust, specifically confidence that hotels will handle personal data responsibly and ethically (Mayer et al. 1995). Other trust facets, such as competence trust (belief in AI’s functional capability to deliver quality service), were not directly measured. Future research could examine whether these distinct trust dimensions exert independent or interactive effects on acceptance, potentially revealing more nuanced pathways through which trust shapes guest responses to AI-enabled hospitality services.
The evidence for H4 is also clear: privacy concerns consistently dampen the likelihood of strong endorsement in both ordinal and binary models. However, the impact is asymmetrical, affecting “Yes” responses more strongly than “No” versus “Depends.” This selective suppression can be understood through the lens of prospect theory (Kahneman & Tversky, 1979), which posits that perceived losses loom larger than equivalent gains in decision-making under uncertainty. When guests contemplate firm commitment to AI-enabled services, privacy risks may become psychologically salient in ways they do not when responses remain tentative or exploratory. Construal level theory offers a complementary explanation: abstract, non-committal responses (“Un-sure” or “Depends”) involve distant, low-level construal where privacy risks remain cognitively peripheral, whereas concrete endorsement (“Yes”) triggers proximal, high-level construal that foregrounds specific concerns about data vulnerability and surveillance (Morosan & DeFranco 2015; Lee & Cranage 2011; Karwatzki et al. 2017). The PPOM results further demonstrate that privacy effects violate the proportional-odds assumption, indicating heterogeneous effects across response thresholds, which strengthens the argument that privacy concerns function as threshold-based inhibitors that disproportionately reduce strong acceptance rather than uniformly shifting attitudes across the response scale.
The correlation between trust and privacy concerns observed in this study suggests that these constructs may function as reciprocal or countervailing forces rather than independent predictors. High trust may buffer privacy concerns by reducing perceived vulnerability to data misuse, while unaddressed privacy concerns may progressively erode trust over time. This dynamic interplay has practical implications: interventions aimed at building trust through transparent data governance may indirectly attenuate privacy-related resistance, offering hotels a dual pathway for enhancing acceptance. However, the cross-sectional design of this study precludes causal inference regarding the directionality of this relationship, and it remains possible that privacy-concerned guests differ systematically in unmeasured ways, such as general technology skepticism or dispositional anxiety, that confound the observed associations.
In terms of practical significance, the odds ratios for trust (OR ≈ 1.41–1.49 across models) and privacy concerns (OR ≈ 0.68 for willingness to pay) (Table S6, Supplementary Materials), indicate substantively meaningful effects. A one-unit increase in trust corresponds to approximately 40–50% higher odds of endorsing AI influence on hotel choice or willingness to pay a premium, while elevated privacy concerns reduce the odds of financial willingness by roughly one-third. These magnitudes suggest that trust-building and privacy mitigation represent strategically important levers for hospitality managers, not merely statistically detectable but practically modest associations.
The Albanian context adds further interpretive depth to these findings. Albania established a national personal data protection framework with Law No. 9887 on Protection of Personal Data 2008, which was later amended, and more recently adopted Law No. 124/2024 On Personal Data Protection 2024 as part of a broader alignment with EU General Data Protection Regulation (GDPR). Despite this formal framework, institutional reports indicate that enforcement capacity and public awareness of data rights have historically lagged behind many EU member states (Albania 2020 Report SWD(2020) 354 2020), conditions that may heighten uncertainty when guests encounter AI-enabled systems requesting personal information and thereby amplify privacy sensitivity. The findings therefore underscore the need for hotels operating in Albania to implement transparent, EU-aligned data-handling practices and to proactively communicate privacy safeguards, not only for compliance, but also as a practical mechanism for strengthening the trust that appears central to guest acceptance of AI-enabled services.
5.3. Perceived Value and Financial Acceptance
The results provide strong support for H5: respondents who identify more benefits and desire more smart features are significantly more likely to express both acceptance and willingness to pay. In terms of practical magnitude, the odds ratios from the full attitudinal models (Table S6) indicate that each additional perceived benefit corresponds to approximately 15–20% higher odds of acceptance, while each additional desired feature increases odds by roughly 8–12%. These effect sizes, while modest at the individual unit level, become substantively meaningful when considering the observed ranges-guests at the upper end of benefit recognition (6–7 benefits) exhibit markedly higher acceptance probabilities than those identifying only one or two benefits. For practitioners, this suggests that expanding guests’ awareness of the multidimensional value proposition of AI-enabled services represents a viable strategy for enhancing both attitudinal and financial acceptance.
These findings confirm the foundational assumption of value-driven adoption central to TAM and UTAUT/UTAUT2 (Davis 1989; Venkatesh et al. 2012), though the operationalization employed here warrants theoretical reflection. Unlike traditional reflective scales measuring perceived usefulness as a unitary latent construct, the present study captured perceived value through formative “breadth indicators” counts of distinct benefits and features identified by each respondent. This approach conceptualizes perceived value as cumulative scope rather than unidimensional intensity: guests who identify more benefits perceive AI as useful across multiple functional domains (efficiency, personalization, convenience, sustainability) rather than intensely useful on a single dimension. This breadth-based operationalization may represent a complementary extension to standard TAM and UTAUT/UTAUT2 measures, capturing the multifaceted nature of value perceptions that single-item or narrow reflective scales may not fully represent. Future research could examine whether breadth and intensity of perceived use-fulness exert independent or interactive effects on technology acceptance.
The nonlinear analyses reported in Section 4.6, though ultimately yielding modest improvements in model fit, revealed a marginally significant convex relationship between perceived benefits and willingness to pay (p ≈ 0.07). This pattern suggests potential threshold or accelerating effects: guests perceiving many benefits may exhibit disproportionately higher willingness to pay than those perceiving moderate benefits, as if accumulated value perceptions trigger a “tipping point” where hesitancy transforms into enthusiastic endorsement. Although linear models were retained for parsimony, this finding hints at nonlinear dynamics in value–acceptance relationships that merit further investigation, particularly in emerging markets where baseline value perceptions may cluster at lower levels, and interventions that shift guests across critical thresholds could yield outsized returns.
Regarding H6, privacy concerns reduce willingness to pay more strongly than they reduce general acceptance, as evidenced by larger effect sizes and consistent statistical significance in all models for the WTP outcome (OR ≈ 0.68, p < 0.01). This differential impact can be understood through several complementary theoretical lenses. Mental accounting theory (Thaler 1985) suggests that financial outlays trigger deliberate cost-benefit evaluations in which potential losses, including privacy risks, receive heightened cognitive scrutiny. Regulatory focus theory (Higgins 1997) posits that payment contexts may activate a prevention orientation (focused on avoiding negative outcomes) rather than a promotion orientation (focused on achieving positive outcomes), thereby amplifying sensitivity to threats such as data vulnerability. Additionally, research on the “pain of paying” indicates that monetary commitment activates loss-averse processing, rendering negative attributes more cognitively accessible and influential in decision-making (Prelec & Loewenstein 1998). Together, these frameworks suggest that the act of contemplating financial commitment fundamentally alters the psychological weighting of risks and benefits, explaining why privacy concerns that remain peripheral during general attitude formation become decisive when willingness to pay is at stake.
This distinction resonates with prior hospitality research demonstrating that willingness to pay for service innovations, whether green hotel features, smart room technologies, or experiential upgrades, is particularly sensitive to perceived risks and ethical evaluations (Kim & Han 2010; Kang et al. 2012; Hao et al. 2023). Guests appear to apply more stringent evaluative criteria when actual expenditure is involved, suggesting that the psychological processes governing WTP differ qualitatively from those shaping general acceptance. For AI-enabled hospitality services, this implies that value communication alone may be insufficient to secure price premiums; hotels must simultaneously address ethical concerns to convert positive attitudes into financial commitment.
It should be acknowledged that guests who identify more benefits or desire more features may differ systematically from others in unmeasured ways. Such individuals might possess higher technology readiness, greater innovativeness, or stronger general enthusiasm for novel experiences, dispositional factors that could partially account for the observed associations between perceived value and acceptance. While the models control for demographics, hotel-stay frequency, and prior AI experience, un-measured heterogeneity remains a potential confound that limits causal interpretation. The substantial variance in perceived benefits (SD = 1.39) and desired features (SD = 3.38) further underscores that guests are not homogeneous in their value perceptions, suggesting opportunities for market segmentation. Hotels might identify “value-sensitive” segments requiring extensive benefit communication and reassurance versus “tech-enthusiast” segments already primed to pay premiums with minimal persuasion. Tailored marketing strategies and tiered service offerings could capitalize on this heterogeneity.
These patterns underscore a crucial strategic insight for emerging markets such as Albania: the commercial viability of AI-enabled upgrades depends not only on functional value but also on guests’ ethical comfort, especially regarding data use. Several contextual factors amplify the importance of these findings. First, price sensitivity may be elevated in emerging economies, meaning that guests require more explicit and compelling justification for AI-related price premiums than might be necessary in wealthier markets. Second, the relatively modest average number of perceived benefits observed in this sample (M = 2.79 out of 7 possible) suggests the guests do not yet recognize the full value spectrum of AI-enabled services, representing both a challenge and an opportunity for targeted communication strategies that expand benefit awareness. Third, currency and income dynamics in Albania affect the practical interpretation of “willingness to pay more”; a price premium that appears modest in absolute euro terms may represent a significant relative expenditure for domestic travelers, heightening the evaluative scrutiny applied to such decisions. Collectively, these considerations suggest that hotels in Albania and comparable emerging markets must craft value propositions that are not only functionally compelling but also ethically transparent and economically justified relative to local purchasing power.
The results provide strong support for H5: respondents who identify more benefits and desire more smart features are significantly more likely to express both acceptance and willingness to pay, supporting value-based adoption mechanisms central to TAM (perceived usefulness) and UTAUT/UTAUT2 (performance expectancy and price value) (Davis 1989); Venkatesh et al. 2012).
Regarding H6, privacy concerns reduce willingness to pay more strongly than they reduce general acceptance, as evidenced by larger effect sizes and consistent statistical significance in all models for the WTP outcome. This distinction suggests that financial commitment heightens the salience of perceived privacy risk, consistent with evidence that privacy concerns and privacy assurances shape purchase-related responses in travel/hospitality digital contexts and that consumers may even pay price premiums for more privacy-protective options (Lee and Cranage 2011; Morosan & DeFranco 2015; Tsai et al. 2011).
These patterns underscore a crucial strategic insight for emerging markets such as Albania: the commercial viability of AI-enabled upgrades depends not only on functional value but also on guests’ ethical comfort, especially regarding data use.
5.4. Interpersonal, Cultural, and Moderation Effects
The findings provide partial support for H7, showing that lower digital familiarity, operationalized through limited awareness or experience, is associated with lower acceptance. While age differences emerged descriptively and in some models, the broad-er pattern indicates that digital exposure rather than age alone better explains the acceptance gradient.
Evidence for H8 is mixed. A preference for human interaction did not systematically reduce acceptance; in some models, it showed weak or borderline-positive effects. This ambiguity warrants deeper theoretical exploration. First, guests may simultaneously value human interaction and appreciate AI efficiency, these are not mutually exclusive preferences. The Paradoxes of Technology literature (Mick & Fournier 1998) suggests that consumers often hold contradictory attitudes toward technology, embracing its benefits while harboring reservations about its implications. Second, the importance of human interaction likely varies by service context: guests may strongly prefer human engagement for emotionally complex encounters (complaint resolution, personalized recommendations) while readily accepting AI for routine transactions (check-in, information requests). The global measure employed in this study may obscure such context-specific preferences. Third, framing effects may shape responses: whether AI is perceived as replacing or augmenting staff fundamentally alters evaluations, and the survey context may have primed respondents toward a complementary framing. Finally, the single Likert item capturing “importance of human interaction” may conflate distinct constructs preference for human warmth, discomfort with technology, need for service customization, that relate differently to AI acceptance. This measurement limitation suggests caution in interpreting the ambiguous findings and highlights the need for more differentiated assessment of interpersonal preferences in future research.
The weak effects observed may also reflect social desirability bias: guests might over-state the importance of human interaction in survey responses while behaviorally accepting AI-mediated services in practice. Alternatively, guests expressing strong preference for human interaction yet showing acceptance may represent a segment that compartmentalizes preferences, valuing human contact for some service elements while welcoming AI for others. These alternative explanations underscore the complexity of interpersonal expectations in technology-mediated hospitality encounters.
Support for H9 is modest but directionally consistent: better perceived cultural-linguistic fit correlates with higher acceptance, particularly in willingness to pay. This aligns with theories of cultural congruence in service encounters, indicating that guests evaluate AI technologies not only on functional performance but also on perceived alignment with local norms and communication styles (Holmqvist & Grönroos 2012; Holmqvist et al. 2014). However, it must be acknowledged that cultural-linguistic fit was operationalized through a single item, limiting interpretive confidence. Cultural congruence is inherently multidimensional, encompassing language adaptation, cultural idioms, communication style norms, humor conventions, and value alignment (Holmqvist et al. 2017; Paparoidamis et al. 2019). The global perception captured by the present measure cannot distinguish which specific dimensions of cultural fit matter most for AI acceptance. Future research employing multi-item scales or experimental manipulations of specific cultural adaptation features, such as language formality, greeting conventions, or locally relevant recommendations, could more precisely identify the mechanisms through which cultural fit shapes guest responses.
The Albanian context enriches interpretation of these cultural findings. Albanian hospitality traditions emphasize warmth, personal relationships, and guest honor, cultural values encapsulated in concepts such as “mikpritja” (the sacred duty of hospitality) that may heighten sensitivity to perceived impersonality in service encounters. Furthermore, Albania’s tourism sector serves diverse visitor segments, regional Balkan tourists, Western European travelers, and diaspora visitors returning to their homeland, each bringing distinct language preferences, cultural expectations, and familiarity with AI technologies. This heterogeneity complicates one-size-fits-all AI implementations and underscores the importance of culturally adaptive systems capable of adjusting interaction styles across guest segments. Additionally, post-communist legacies of institutional distrust in Albania may create unique dynamics: guests who harbor skepticism toward formal institutions may transfer such reservations to AI systems perceived as opaque or corporate-controlled, while simultaneously being receptive to technologies that enhance personal autonomy and reduce dependence on potentially unreliable human intermediaries. These culturally embedded factors likely shape acceptance in ways that differ from Western European contexts where most hospitality AI research has been conducted.
Consistent with H10, the interaction model provides evidence that trust moderates the negative influence of perceived loss of personal touch. The interaction coefficient from Model E1 (estimate ≈ −0.25, p ≈ 0.015; Table S18) indicates a statistically significant moderation effect, with model fit improving modestly (pseudo-R2 = 0.078 vs. 0.073 for the non-interaction specification). Examination of predicted probabilities (Figure A1) reveals that when trust in AI is low (trust = 1), perceiving AI as impersonal actually increases endorsement of AI-driven hotel choice, from approximately 5% to 20% probability of selecting “Yes” as perceived impersonality increases from low to high. This counterintuitive pattern may reflect a desire for efficiency over warmth among low-trust guests: those who distrust AI’s data handling may nonetheless accept its functional utility precisely because they do not expect relational warmth from a system they regard skeptically. When trust is high (trust = 5), this relationship reverses: higher perceived impersonality corresponds to slightly reduced endorsement (from approximately 51% to 40% “Yes”), suggesting that highly trusting guests apply more holistic evaluative criteria that include interpersonal expectations.
This “trust compensation” mechanism can be understood through several established psychological frameworks. Halo effects (Nisbett & Wilson 1977) may lead high-trust guests to interpret AI attributes more charitably, perceiving impersonality as professional efficiency rather than relational deficiency. Cognitive consistency theory (Festinger 2001) suggests that guests experiencing high trust may minimize concerns about impersonality to maintain consonance between their positive AI attitudes and potential reservations about reduced warmth. The risk-as-feelings hypothesis (Loewenstein et al. 2001) offers a complementary explanation: trust may function as an affective heuristic that dampens the emotional weight of interpersonal concerns, enabling more favorable holistic evaluations. Finally, high-trust guests may have recalibrated their expectations, accepting that AI-mediated service involves inherent trade-offs between efficiency and warmth, and thus evaluate AI against different criteria than guests who remain skeptical.
These findings align with the broader literature on human-AI collaboration in service contexts (Huang & Rust 2018; Wirtz et al. 2018), which increasingly advocates an “augmentation” rather than “replacement” perspective. Guests appear to accept AI more readily when it is perceived as enhancing rather than substituting human capabilities, a framing consistent with the strong support for staff-AI collaboration observed in the descriptive results (M = 4.10 on a 5-point scale; Table 6). The interaction findings extend this perspective by demonstrating that trust serves as a psychological mechanism enabling guests to reconcile efficiency benefits with interpersonal expectations, facilitating acceptance of AI within a complementary service model.
However, the interaction did not extend to willingness to pay, with the trust × personal touch term failing to reach significance (p ≈ 0.63). Several explanations may account for this null finding. Financial decisions may be governed more by cognitive cost-benefit calculations than by affective or relational considerations, rendering interpersonal trade-offs less influential once price enters the equation. As demonstrated in Section 5.3, willingness to pay appears more directly determined by perceived functional value and privacy concerns, potentially leaving insufficient variance to be explained by interpersonal moderations. Additionally, guests willing to pay premiums may have already resolved interpersonal concerns during earlier attitudinal processing, creating a ceiling effect that attenuates moderation at the financial commitment stage. It should also be acknowledged that the non-significant interaction may reflect statistical power limitations: detecting interaction effects typically requires larger samples than main effects, and the present study may have been underpowered to identify moderation of the expected magnitude for the willingness-to-pay outcome. Future research with larger samples or experimental designs manipulating trust and impersonality independently could more definitively test whether this moderation operates differently across attitudinal and financial outcomes.
The possibility that a third variable drives the observed interaction cannot be entirely excluded. Guests high in technology readiness or dispositional openness to experience may simultaneously exhibit higher trust in AI and greater tolerance for impersonal service encounters, not because trust causally attenuates impersonality concerns, but because both orientations stem from a common underlying disposition. While the models control for multiple covariates, such unmeasured individual differences represent potential confounds that limit causal interpretation of the interaction.
These findings carry implications for service design in Albanian hotels and comparable emerging-market contexts. The trust-moderation finding suggests that hotels should prioritize trust-building initiatives, through transparency regarding data practices, visible security assurances, and demonstrations of AI reliability, before or alongside AI deployment. Establishing trust may preemptively buffer concerns about reduced personal touch, smoothing the acceptance pathway for guests who might otherwise resist technology perceived as impersonal. The importance of cultural-linguistic fit implies that AI interfaces in Albania should incorporate Albanian language options, culturally appropriate interaction styles (including appropriate formality gradients and greeting conventions), and local contextual knowledge (such as familiarity with Albanian destinations, customs, and service expectations). The ambiguous role of human interaction preferences suggests that hybrid service models, where AI handles routine, transactional interactions while human staff manage complex, emotional, or high-stakes encounters, may optimize acceptance across diverse guest segments. Such configurations honor guests’ interpersonal expectations while capturing the efficiency and consistency benefits that AI can provide, reflecting the complementary human-AI relationship that respondents in this study broadly endorsed.
5.5. Integration of Quantitative and Qualitative Findings
To complement the quantitative models, the open-ended recommendation item (“Do you have any recommendations for hotels planning to integrate AI and smart technologies?”) was analyzed using a lightweight text-mining procedure. Of the 689 respondents, 228 provided written recommendations (33.1%). Responses ranged from single-word or short-phrase comments to longer statements (range 1–60 words; median ≈ 10 words; five responses contained ≥ 50 words). Response propensity did not differ meaningfully by gender or age group, suggesting limited evidence of systematic nonresponse along basic demographic lines; nevertheless, as with any optional open-ended item, some degree of self-selection toward more engaged participants cannot be ruled out.
Text preprocessing followed a transparent, reproducible pipeline (documented in the Supplementary R script): responses were lowercased, punctuation was removed, and common stop-words were excluded (English stop-words supplemented with a small set of Albanian function words). No stemming or lemmatization was applied, so morphologically related forms were retained as separate tokens. After preprocessing, the corpus contained 614 unique word types. Consistent with the survey focus, the most frequent terms were “ai” (85 occurrences), “hotels” (39 occurrences), “data” (32 occurrences), “staff” (27 occurrences), “guests” (27 occurrences), “human” (26 occurrences), and “smart” (26 occurrences), followed by “technology” (21 occurrences), “experience” (18 occurrences), “service” (16 occurrences), “privacy” (15 occurrences), and “personal” (11 occurrences). Notably, “data” and “privacy” emerged prominently despite not being explicitly prompted in the open-ended question, reinforcing the salience of information governance as a spontaneous concern. The co-occurrence of “privacy” (15 occurrences) with “security” (7 occurrences) and “transparency” (6 occurrences) further aligns with the quantitative evidence that ethical and data-handling considerations are central in respondents’ evaluations of AI-enabled hospitality services.
Bigram (two-word combination) analysis provided additional contextual structure, yielding 1,234 unique bigrams after preprocessing. The most frequent bigrams included “guest experience” (8 occurrences) and “human interaction” (8 occurrences), followed by “smart technologies” (7 occurrences) and “human touch” (6 occurrences). Several bigrams directly reflected implementation priorities and governance concerns, including “personal data” (5 occurrences), “integrate ai” (5 occurrences), and “data handling” (3 occurrences), as well as operational references such as “check ins” (4 occurrences) and “faster check” (3 occurrences). Importantly, a cluster of replacement-related bigrams: “replace human” (5 occurrences), “replace humans” (3 occurrences), “replace staff” (3 occurrences), and “replacing human” (2 occurrences), indicates that displacement concerns were raised voluntarily by respondents, even though job-loss anxiety was not a primary multi-item focus of the structured instrument. This is consistent with broader discussions in the hospitality automation literature that emphasize the importance of positioning AI as augmentative rather than substitutive (Ivanov & Webster 2019).
Taken together, the lexical patterns can be summarized as a set of recurring themes that map closely onto the study’s conceptual framing: (i) functional/operational value (e.g., faster or more convenient transactions), (ii) interpersonal experience (e.g., maintaining “human interaction” and “human touch”), (iii) privacy/data governance (e.g., “personal data,” “privacy,” “security,” “transparency,” “data handling”), and (iv) implementation and workforce readiness (e.g., “staff,” “training”). The latter is consistent with the strong endorsement of staff–AI collaboration observed in the structured item (mean ≈ 4.10 on a 5-point scale). A smaller subset of comments also referenced energy/sustainability (e.g., “energy” with mentions such as “energy management”), suggesting that environmental value propositions may be salient for some guests and could be explored more explicitly in future instrument refinements.
From a validity standpoint, the open-ended corpus provides convergent qualitative support for the quantitative results: privacy and data-handling language appears frequently and spontaneously, interpersonal warmth remains a salient reference point, and respondents often discuss implementation in terms of staff integration rather than full replacement. At the same time, the text-mining approach has clear limitations that should be acknowledged: frequency metrics capture lexical prominence but not sentiment, argument structure, or context; and without lemmatization, conceptually related word forms are distributed across separate tokens. Finally, because two-thirds of respondents did not provide textual recommendations, the qualitative results should be interpreted as complementary evidence rather than a fully representative distribution of views.
Practically, the phrasing used by respondents suggests actionable communication cues. The prominence of “human interaction” and “human touch” supports messaging that frames AI as enhancing service while preserving warmth. Similarly, frequent unprompted references to “personal data,” “privacy,” “security,” and “data handling” indicate that privacy communication should use accessible, guest-facing language rather than purely technical statements. The appearance of “gdpr” (2 occurrences) and “gdpr compliance” (1 occurrence) further suggests that explicit compliance-oriented reassurance may resonate with a subset of guests, particularly when framed as part of transparent data-governance practices.
5.6. Implications for Practice
The findings yield actionable implications for hospitality managers and technology designers, with particular relevance for Albania and comparable emerging tourism markets where guest-facing AI adoption remains nascent and expectations are evolving. To reduce over-interpretation and support implementation planning, the implications below are ordered by evidential strength: from model-consistent, robust effects to directionally suggested patterns, and each is framed with practical guidance and potential risks.
First, trust-building should be treated as the central strategic priority. Trust in AI was the most consistent attitudinal predictor across modelling frameworks; a one-unit increase in trust corresponded to approximately 40–50% higher odds of both acceptance and willingness to pay (OR ≈ 1.41–1.49; Table S6, Supplementary Materials). This places trust as a prerequisite for uptake, rather than a downstream consequence of adoption. In the Albanian context, trust-building is especially consequential because data-protection awareness and perceived safeguards vary across guest segments, and AI-enabled services often require some degree of personal-data handling. Regulatory messaging must also be accurate: Albania established a personal-data protection framework under Law No. 9887/2008 on Protection of Personal Data, and has more recently adopted Law No. 124/2024 , which aims to align national practice more closely with GDPR standards (Regulation (EU) 2016/679). Hotels should therefore communicate GDPR consistent practices in a way that is verifiable and aligned with operational reality. Operationally, trust-building requires visible practices rather than abstract assurances e.g., concise privacy notices at key touchpoints (booking page, check-in, Wi-Fi login), explicit opt-in consent for non-essential data uses, simple controls to disable personalization, and staff training so employees can explain data-handling practices clearly. A key risk is overpromising: if hotels claim transparency but cannot demonstrate consistent implementation (unclear retention rules, ambiguous vendor roles), perceived deception may erode trust more than silence would.
Second, privacy-sensitive design is particularly important when hotels seek price premiums. Privacy concerns reduced willingness to pay substantially (OR ≈ 0.68, p < 0.01) and the effect was stronger for WTP than for general acceptance. This implies that privacy protection is not merely a compliance issue but a revenue-relevant design constraint for premium, data-intensive features. For higher-end smart-room functions and personalization, hotels should implement safeguards that are both real and visible: guest-controlled data toggles; clear deletion options at checkout; transparent retention periods; and plain-language explanations of whether outputs are based on individual-level data or aggregated patterns. The qualitative prominence of “personal data,” “privacy,” and “data handling” indicates that governance concerns arise spontaneously; thus, guest-facing communication should use accessible language rather than technical jargon. An implementation risk is complexity: overly elaborate privacy interfaces can frustrate users or inadvertently imply excessive data collection. Privacy-by-default configurations, combined with optional personalization, reduce friction while preserving autonomy.
Third, experiential familiarity should be actively cultivated through low-risk onboarding. Prior experience with smart/AI-enabled hotels was a robust predictor (OR ≈ 1.46–1.53; Table S6, Supplementary Materials), consistent with the diffusion logic that trialability reduces perceived uncertainty. In lower-exposure markets, lowering the “risk of first use” may be one of the most efficient levers for improving acceptance. Hotels can operationalize this through brief demonstrations at check-in, QR-linked tutorials, staff-guided introductions for guests who opt in, and phased activation (basic functions first, advanced personalization later). Qualitative references to “guest experience,” comfort, and ease suggest that onboarding should prioritize clarity and reassurance rather than technological sophistication. Poor demonstrations can produce durable negative impressions; therefore, piloting with staff and a small set of guests before full rollout is advisable.
Fourth, AI should be framed and operationalized as augmentation rather than replacement of staff. Support for staff–AI collaboration was high (M = 4.10; Table 6), while open-ended feedback contained replacement-related language, indicating that displacement concerns remain salient. Together, these patterns suggest that acceptance is higher when AI is positioned as supporting staff rather than substituting for human service labor. Messaging should therefore emphasize augmentation (e.g., “AI supports routine tasks so staff can focus on hospitality and problem-solving”) and preserve human service pathways for complex or emotionally sensitive interactions. Internal alignment is equally important: if employees interpret AI as surveillance or a precursor to workforce reduction, their skepticism may undermine guest trust. Involving frontline staff in implementation decisions, training, and escalation protocols can build ownership and improve service recovery when AI fails.
Fifth, cultural and linguistic localization appears to add incremental value, particularly for willingness to pay. Cultural–linguistic fit showed modest but directionally positive associations, suggesting that localized interfaces may improve perceived relevance and comfort across Albania’s mixed market (domestic guests, diaspora, regional visitors, and broader international tourism). Priorities include high-quality Albanian language support, appropriate formality and greeting conventions, and locally grounded recommendations. The risk is superficial adaptation: poor translations or culturally inappropriate suggestions may appear inauthentic and can damage trust. Localization should therefore involve local expertise and systematic testing with staff and guests prior to deployment.
Sixth, hotels should avoid one-size-fits-all implementations and instead offer differentiated pathways. The observed variability in perceived benefits, desired features, and attitudes implies that guest orientations are heterogeneous. A pragmatic segmentation for implementation can distinguish: (i) high-trust/high-exposure guests (most receptive to advanced features and potential premiums), (ii) cautious-but-open guests (best served by hybrid models with strong privacy assurances), and (iii) human-preference guests (best served by maintaining fully human pathways and introducing AI unobtrusively or behind-the-scenes). Segmentation can be operationalized via preference prompts (pre-arrival), opt-in behavior, and early-use patterns without requiring intrusive profiling.
Seventh, implementation priorities should be calibrated to property type and service context. Luxury properties may justify premium AI experiences if privacy assurances and service quality are high; budget properties may benefit more from operational efficiency tools than from guest-facing premium upgrades. Urban hotels may prioritize speed and information services, whereas resort properties may emphasize experience personalization. Independent properties may adopt phased approaches due to vendor and staffing constraints, while chains can standardize but must ensure local language and context fit.
Eighth, staff readiness is a core implementation condition rather than a downstream operational detail. Guest acceptance is partly mediated through staff behaviors; enthusiastic, competent staff support can facilitate uptake, while resistance can undermine even well-designed systems. Hotels should therefore implement basic change-management practices: clear internal communication about AI’s role, training that builds literacy (not only procedures), protocols for failures and service recovery, and scripts enabling staff to explain AI and data practices in guest-friendly language.
Ninth, a phased rollout with monitoring is advisable. A practical sequence is: (a) governance foundation (privacy notices, consent flows, vendor accountability, staff training), (b) low-risk optional guest-facing features (digital check-in, basic smart-room controls, simple recommendations while preserving human alternatives), (c) premium tier expansion for opt-in segments, and (d) optimization of the human–AI division of labor. Hotels should track KPIs aligned to the constructs in this study: trust indicators (perceived data safety, clarity of data practices), adoption indicators (usage and opt-in/opt-out rates), experience indicators (AI-specific feedback), financial indicators (premium uptake where offered), and staff indicators (comfort and training adequacy). Monitoring enables early detection of friction before it affects guest satisfaction and revenue.
Overall, successful AI implementation in Albanian hospitality is most likely when hotels prioritize trust-building and privacy protection, facilitate experiential familiarity, frame AI as augmenting human service, localize interfaces where relevant, differentiate offerings by guest segment and property context, invest in staff readiness, and continuously monitor outcomes. The evidence indicates that strategies integrating functional value with interpersonal and ethical safeguards are best positioned to convert positive attitudes into sustained use and, where feasible, financial premiums.
5.7. Limitations and Directions for Future Research
This study has several limitations that should be acknowledged when interpreting the findings and their practical implications.
First, the sampling and fieldwork design constrains generalizability. Data were collected through a voluntary, intercept-based approach in a public urban setting, which may introduce self-selection and coverage biases. Respondents who were socially oriented, had more discretionary time, or were more willing to engage with survey administrators may be overrepresented, potentially skewing the sample toward leisure visitors relative to business travelers. The May–October collection window may further oversample peak-season profiles and underrepresent off-season domestic travel patterns. In addition, the geographic focus on Tirana limits coverage of other Albanian tourism contexts (e.g., coastal resorts, mountain destinations, and heritage sites) where guest compositions and technology expectations may differ. Finally, because the design is non-probabilistic, conventional inferential statistics should be interpreted cautiously: p-values and confidence intervals describe uncertainty within the observed sample rather than supporting formal population-level inference.
Second, the study relies on self-reported attitudes and stated behavioral intentions, rather than observed behavior. Although diagnostic checks supported stable model performance, intention-based measures are subject to the well-documented intention–behavior gap in technology adoption research. Stated willingness to pay and privacy concerns may not translate directly into actual booking decisions, feature usage, or willingness to incur real monetary costs. Future work should therefore complement survey evidence with revealed-preference data, such as booking behavior, usage logs for guest-facing AI features, or experimental designs that incorporate real or incentive-compatible trade-offs.
Third, measurement and method factors warrant consideration. Collecting all measures from the same respondents at the same time using similar response formats raises the possibility of common method variance. While anonymity assurances can reduce social desirability pressure, face-to-face administration by student researchers may still have influenced response styles. Several key constructs (e.g., trust in AI, cultural–linguistic fit, privacy concern, perceived loss of personal touch) were measured via single items. Although single-item measures can be defensible for conceptually narrow constructs, this approach limits the assessment of internal consistency, measurement invariance, and the separation of true score variance from measurement error, potentially attenuating effect sizes and increasing uncertainty around construct interpretation.
Fourth, unmeasured confounding and causal ambiguity remain. The analyses controlled for demographics, hotel-stay frequency, and prior AI experience, but relevant drivers such as technology readiness, income, travel purpose (business vs. leisure), and individual difference variables (e.g., openness to experience or general risk aversion) were not measured. These factors may jointly influence both predictors and outcomes, limiting causal interpretation. Moreover, despite multiple robustness checks, the cross-sectional design does not support causal claims, and statistical power for detecting interaction effects may be more limited than for main effects, especially when interactions are modest in magnitude.
Several extensions would strengthen the evidence base and address the patterns observed in this study. Experimental research could test mechanisms more directly, particularly the finding that trust moderated the relationship between perceived loss of personal touch and acceptance more clearly than for willingness to pay. For example, randomized interventions that vary the clarity of data-governance communication, the presence of opt-in controls, or the framing of AI as augmentation versus replacement could help isolate causal pathways. In addition, privacy concerns displayed threshold-specific effects (violating proportional-odds assumptions), which merits deeper investigation using larger samples, alternative modeling approaches, and designs that explicitly test whether commitment decisions involve genuine psychological thresholds or reflect measurement and categorization artifacts. The open-ended responses also highlighted displacement concerns; future instruments should systematically incorporate labor-ethics items alongside privacy and data-handling measures to assess this dimension quantitatively.
From a design perspective, future research would benefit from probabilistic or stratified sampling, including broader geographic coverage across Albania to improve external validity. Longitudinal panel designs, surveying guests prior to first exposure to smart/AI-enabled hotel services, immediately after use, and at follow-up, could capture how acceptance evolves with familiarity and lived experience. Cross-national comparative studies (e.g., Albania versus neighboring Balkan markets and selected EU destinations) could clarify the role of market maturity and cultural context. Finally, qualitative fieldwork conducted in operational hotels (e.g., observations and in-depth interviews) could enrich understanding of how guests interpret AI-enabled service encounters and how expectations, trust, and privacy concerns are negotiated in practice.
More broadly, the findings should be interpreted in light of the rapid evolution of AI technologies and public awareness. Patterns observed in 2025 may shift as AI becomes more prevalent, regulatory frameworks mature, and high-profile AI incidents influence public perceptions. Repeated cross-sectional surveys or longitudinal tracking, combined with replications across diverse markets, will be important for assessing the robustness, boundary conditions, and temporal stability of the relationships identified in this study.
6. Conclusions
This study examined hotel guests’ acceptance of smart and AI-enabled technologies through an integrated framework connecting utilitarian, experiential, ethical, and cultural evaluations with two behavioral outcomes: whether such technologies influence hotel choice and whether guests are willing to pay a premium for AI-enabled services. Using cumulative link models, partial proportional-odds models, nonlinear and moderation extensions, and binary robustness checks, the analysis revealed a consistent pattern across all methodological specifications.
Across both outcomes, prior experience with smart or AI-enabled hotels and trust in AI, particularly trust in responsible data handling, emerged as the most stable and influential predictors. These results underscore the central role of experiential familiarity and ethical confidence as prerequisites for adoption in hospitality contexts. Perceived value, captured through the breadth of identified benefits and desired features, also exhibited strong positive associations with acceptance and financial willingness. In contrast, privacy concerns consistently reduced support, especially willingness to pay, indicating that ethical reservations become more salient when financial commitment is required.
Interpersonal and cultural considerations added further nuance. While concerns about reduced human warmth did not uniformly deter acceptance, they interacted meaningfully with trust: higher trust attenuated the negative implications of perceived depersonalization, reflecting a compensatory mechanism documented in prior research on AI-mediated service interactions. Cultural–linguistic fit was also positively associated with acceptance, suggesting that guests evaluate AI not only for its functional utility but also for its alignment with local communication norms and cultural expectations.
The qualitative analysis of open-ended recommendations reinforced these patterns. Frequent references to human interaction, personal data, human touch, and staff–AI collaboration highlighted that guests balance convenience with socio-emotional and ethical considerations. The strong thematic convergence across qualitative and quantitative evidence strengthens the ecological validity of the findings.
Taken together, the results offer a coherent and empirically supported account of AI acceptance in hospitality within an emerging-market setting. Conducted in Tirana, Albania, a rapidly expanding tourism destination where smart-hotel technologies are still at an early stage, the study provides rare insight into how guests in developing hospitality ecosystems evaluate AI-enabled services. The findings suggest that successful adoption in such contexts is most likely when guests perceive clear functional benefits, trust the underlying technology and data practices, and view AI as augmenting rather than replacing human service. At the same time, privacy concerns and cultural misalignment remain substantive barriers, particularly for premium-priced offerings.
The study’s non-probability sampling design, reliance on self-reported measures, and cross-sectional structure limit generalizability and causal interpretation. Nonetheless, the analytical rigor, multiple robustness checks, and integration of qualitative insights enhance confidence in the core conclusions. As AI-enabled hospitality services continue to expand in Albania and similar emerging markets, the findings emphasize the need for implementation strategies that combine technological innovation with ethical transparency, cultural sensitivity, and a balanced approach to human–AI collaboration.
Supplementary Materials
The following supporting information can be downloaded at the website of this paper posted on Preprints.org. The de-identified dataset used in this study is available as Dataset S1, together and the full set of R script used for data preparation, modelling, diagnostics, and visualization (Code S1). Additional supplementary tables include: item-level missingness and sample-size diagnostics (Tables S1–S2), the full predictor correlation matrix (Table S3), and variance-inflation factors for binary models (Tables S4–S5). Core modelling outputs are provided in: the Master Odds-Ratio Summary Table for all acceptance models (Table S6), cumulative link model estimates for AI influence on hotel choice and willingness to pay (Tables S7–S8), and proportional-odds assumption tests (Table S9). Robustness analyses include logistic regression coefficients (Tables S10–S11), partial proportional-odds model estimates (Tables S12–S13), and nonlinear model specifications (Tables S14–S16). Interaction analyses are reported in model-fit summaries and estimates (Tables S17–S19). Finally, qualitative analyses of open-ended recommendations are summarized through word-frequency and bigram-frequency tables (Tables S20–S21).
Author Contributions
Conceptualization, M.G. and T.T.; methodology, M.G., R.M., and T.T.; formal analysis, M.G.; original draft preparation, M.G. and R.M.; supervision, M.G. and K. S; funding acquisition, K.S. All authors have read and agreed to the published version of the manuscript.
Funding
This research was funded by the National Agency for Scientific Research and Innovation of Albania (AKKSHI) under Grant PTI 2024.
Institutional Review Board Statement
The study was approved by the Ethics Committee of the University of Tirana (protocol code NO.1007/1, date of approval: 5 July 2024).
Informed Consent Statement
Informed consent was obtained from all the subjects involved in the study.
Data Availability Statement
The data supporting the findings of this study are available from the corresponding author upon reasonable request owing to privacy restrictions.
Acknowledgments
The authors express their gratitude to the group of undergraduate students from the Faculty of Economy, University of Tirana, who assisted with the intercept data collection in Skanderbeg Square and supported the fieldwork throughout the study. Their effort in engaging domestic and international guests was essential to the successful execution of this research.
Conflicts of Interest
The authors declare no conflict of interest. The funders had no role in the study design; collection, analyses, or interpretation of data; writing of the manuscript; or decision to publish the results.:
Abbreviations
The following abbreviations are used in this manuscript:
| AI | Artificial Intelligence |
| CLM | Cumulative Link Model |
| PPOM | Partial Proportional-Odds Model |
| TAM | Technology Acceptance Model |
| UTAUT/UTAUT2 | Unified Theory of Acceptance and Use of Technology (and its extension UTAUT2) |
| SRAM | Service Robot Acceptance Model |
| WTP | Willingness to Pay |
| NHT | Need for Human Touch |
| AIC | Akaike Information Criterion |
| VIF | Variance Inflation Factor |
| OR | Odds Ratio |
| CI | Confidence Interval |
| RQ | Research Question |
| H | Hypothesis |
| SD | Standard Deviation |
Appendix A

Table A1.
Survey Instrument Structure and Item List Across the Four Conceptual Blocks.
| Block | Construct Domain | Item Wording | Variable Name | Response Format |
|---|---|---|---|---|
| Block 1. Awareness, Experience, Comfort |
Awareness | Are you aware of smart technologies used in accommodations? |
aware_smart | No / Not sure / Yes |
| Prior Experience | Have you previously stayed in a hotel that used AI or smart technology? |
prior_ai_stay | No / Not sure / Yes | |
| Comfort with AI | How would you rate your comfort level in using AI-based hotel services? |
comfort_ai | 1–5 Likert | |
| Hotel Frequency | How often do you stay in a hotel per year? | hotel_freq | Ordinal categories | |
| Block 2. Perceived Benefits & Features |
Desired Features | Which smart or AI technologies would you like to experience? (multi-select) | want_features | Multiple response |
| Smart room controls; Keyless entry; AI concierge/ chatbot; Personalized service; Voice assistants; Facial recognition; Smart mirrors; In-room tablets; Multilingual translation tools; Automatic check-in/out |
feat_* | 0/1 Dummies |
||
| Perceived Benefits | What do you see as the main benefits of AI and smart technologies? (multi-select) |
benefits | Multiple response | |
| Faster service; Personalized experiences; Room customization; Energy efficiency; Contactless services; Innovative guest experience; Cost savings |
ben_* | 0/1 Dummies |
||
| Block 3. Human, Ethical, Privacy, Trust, Cultural |
Human Interaction | How important is human interaction during your hotel stay? |
human_importance | 1–5 Likert |
| Loss of Personal Touch | Do smart/AI technologies reduce the sense of personal touch? | less_personal | No / Not sure / Yes | |
| Privacy Concerns | Do you have concerns about privacy or surveillance? |
privacy_concern | No / Not sure / Yes | |
| Trust in AI | How much would you trust a hotel that uses AI to handle personal data? |
trust_ai | 1–5 Likert | |
| Cultural Fit | AI and smart technologies should reflect local culture and language. | ai_culture | 1–5 Likert | |
| AI–Staff Collaboration | Hotels should train staff to work together with AI instead of replacing them. |
ai_staff_train | 1–5 Likert | |
| Block 4. Behavioral Outcomes |
Influence on Hotel Choice | Would the presence of smart/AI technologies influence your hotel choice? | influence_choice | No / Unsure / Yes |
| Willingness to Pay More | Would you be willing to pay a higher rate for smart/AI services? | wtp_more | No / Depends / Yes |
|
| Open Recommendations | Do you have any recommendations for hotels adopting AI? |
open_recommendations | Open response |
Table A2.
Influence of Smart Techonolgies and AI on Hotel Choice by Gender.
| Gender | Response Category | n | Row % |
|---|---|---|---|
| Female | No | 60 | 15.71% |
| Unsure | 213 | 55.76% | |
| Yes | 109 | 28.53% | |
| Male | No | 63 | 21.00% |
| Unsure | 153 | 51.00% | |
| Yes | 84 | 28.00% | |
| Missing/Other | Unsure | 3 | 60.00% |
| Yes | 2 | 40.00% |
Table A3.
Willingness to Pay More for Smart Technologies and AI-Enhanced Services by Gender.
| Gender | Response Category | n | Row % |
|---|---|---|---|
| Female | No | 108 | 28.35% |
| Depends | 202 | 53.02% | |
| Yes | 71 | 18.64% | |
| Male | No | 69 | 22.92% |
| Depends | 150 | 49.83% | |
| Yes | 82 | 27.24% | |
| Missing/Other | No | 3 | 60.00% |
| Depends | 1 | 20.00% | |
| Yes | 1 | 20.00% |
Table A4.
Influence of Smart Technologies and AI on Hotel Choice by Age Group.
| Age Group | Response Category | n | Row % |
|---|---|---|---|
| 18–24 | No | 36 | 14.94% |
| Unsure | 134 | 55.60% | |
| Yes | 71 | 29.46% | |
| 25–34 | No | 21 | 14.89% |
| Unsure | 81 | 57.45% | |
| Yes | 39 | 27.66% | |
| 35–44 | No | 17 | 14.41% |
| Unsure | 66 | 55.93% | |
| Yes | 35 | 29.66% | |
| 45–54 | No | 17 | 19.77% |
| Unsure | 42 | 48.84% | |
| Yes | 27 | 31.40% | |
| 55+ | No | 28 | 37.33% |
| Unsure | 34 | 45.33% | |
| Yes | 13 | 17.33% | |
| Under 18 | No | 4 | 15.38% |
| Unsure | 12 | 46.15% | |
| Yes | 10 | 38.46% |
Table A5.
Willingness to Pay More for Smart Technologies and AI on Hotel Choice by Age Group.
| Age Group | Response Category | n | Row % |
|---|---|---|---|
| 18–24 | No | 54 | 22.50% |
| Depends | 137 | 57.08% | |
| Yes | 49 | 20.42% | |
| 25–34 | No | 32 | 22.70% |
| Depends | 79 | 56.03% | |
| Yes | 30 | 21.28% | |
| 35–44 | No | 25 | 21.01% |
| Depends | 61 | 51.26% | |
| Yes | 33 | 27.73% | |
| 45–54 | No | 25 | 29.07% |
| Depends | 38 | 44.19% | |
| Yes | 23 | 26.74% | |
| 55+ | No | 37 | 49.33% |
| Depends | 25 | 33.33% | |
| Yes | 13 | 17.33% | |
| Under 18 | No | 7 | 26.92% |
| Depends | 13 | 50.00% | |
| Yes | 6 | 23.08% |
Table A6.
Frequency Distribution of the Number of Perceived AI-Related Benefits.
| Number of Benefits | n | % |
|---|---|---|
| 1 | 150 | 21.77 |
| 2 | 154 | 22.35 |
| 3 | 182 | 26.42 |
| 4 | 130 | 18.87 |
| 5 | 52 | 7.55 |
| 6 | 9 | 1.31 |
| 7 | 12 | 1.74 |
Table A7.
Frequency Distribution of the Number of Desired Smart and AI Features.
| Number of Features | n | % |
|---|---|---|
| 1 | 46 | 6.68 |
| 2 | 54 | 7.84 |
| 3 | 65 | 9.43 |
| 4 | 72 | 10.45 |
| 5 | 78 | 11.32 |
| 6 | 76 | 11.03 |
| 7 | 66 | 9.58 |
| 8 | 63 | 9.14 |
| 9 | 53 | 7.69 |
| 10 | 43 | 6.24 |
| 11 | 24 | 3.48 |
| 12 | 18 | 2.61 |
| 13 | 14 | 2.03 |
| 14 | 4 | 0.58 |
| 15 | 2 | 0.29 |
| 16 | 11 | 1.60 |
Table A8.
Frequency Distribution of Privacy Concern Levels.
| Privacy Concern Level (0–2) | n | % |
|---|---|---|
| 0 | 246 | 35.70 |
| 1 | 236 | 34.25 |
| 2 | 204 | 29.61 |
| NA | 3 | 0.44 |
Table A9.
Frequency Distribution of Perceived Reduction in Personal Touch.
| Less Personal (0–2) | n | % |
|---|---|---|
| 0 | 143 | 20.75 |
| 1 | 186 | 27.00 |
| 2 | 358 | 51.96 |
| NA | 2 | 0.29 |
Table A10.
Frequency Distribution of Trust in AI for Handling Personal Data.
| Trust in AI (1–5) | n | % |
|---|---|---|
| 1 | 34 | 4.93 |
| 2 | 131 | 19.01 |
| 3 | 276 | 40.06 |
| 4 | 190 | 27.58 |
| 5 | 56 | 8.13 |
| NA | 2 | 0.29 |
Table A11.
Frequency Distribution of Perceived Cultural–Linguistic Fit of AI Systems.
| AI Cultural–Linguistic Fit (1–5) | n | % |
|---|---|---|
| 1 | 3 | 0.44 |
| 2 | 22 | 3.19 |
| 3 | 156 | 22.64 |
| 4 | 366 | 53.12 |
| 5 | 137 | 19.88 |
| NA | 5 | 0.73 |
Table A12.
Frequency Distribution of Support for Staff–AI Collaboration and Training.
| Support for AI–Staff Training (1–5) |
n | % |
|---|---|---|
| 1 | 11 | 1.60 |
| 2 | 15 | 2.18 |
| 3 | 93 | 13.50 |
| 4 | 344 | 49.93 |
| 5 | 223 | 32.37 |
| NA | 3 | 0.44 |
Table A13.
Pearson Correlation Matrix for Key Numeric Predictors.
| n_benefits | n_features | comfort_ai_num | aware_smart_num | prior_ai_stay_num | human_importance_num | privacy_concern_num | less_personal_num | trust_ai_num | ai_culture_num | ai_staff_train_num | |
| n_benefits | 1.00 | 0.51 | 0.17 | 0.16 | 0.17 | -0.18 | 0.03 | -0.12 | 0.21 | 0.03 | 0.15 |
| n_features | 0.51 | 1.00 | 0.22 | 0.11 | 0.10 | -0.14 | 0.02 | -0.05 | 0.11 | 0.05 | 0.16 |
| comfort_ai_num | 0.17 | 0.22 | 1.00 | 0.13 | 0.22 | -0.17 | 0.03 | -0.08 | 0.23 | 0.01 | 0.05 |
| aware_smart_num | 0.16 | 0.11 | 0.13 | 1.00 | 0.30 | -0.03 | -0.04 | -0.05 | 0.09 | 0.02 | 0.00 |
| prior_ai_stay_num | 0.17 | 0.10 | 0.22 | 0.30 | 1.00 | 0.01 | -0.11 | -0.13 | 0.19 | 0.02 | 0.04 |
| human_importance_num | -0.18 | -0.14 | -0.17 | -0.03 | 0.01 | 1.00 | -0.01 | 0.25 | -0.23 | 0.19 | 0.07 |
| privacy_concern_num | 0.03 | 0.02 | 0.03 | -0.04 | -0.11 | -0.01 | 1.00 | 0.18 | -0.25 | 0.10 | 0.09 |
| less_personal_num | -0.12 | -0.05 | -0.08 | -0.05 | -0.13 | 0.25 | 0.18 | 1.00 | -0.21 | 0.01 | 0.04 |
| trust_ai_num | 0.21 | 0.11 | 0.23 | 0.09 | 0.19 | -0.23 | -0.25 | -0.21 | 1.00 | -0.04 | 0.03 |
| ai_culture_num | 0.03 | 0.05 | 0.01 | 0.02 | 0.02 | 0.19 | 0.10 | 0.01 | -0.04 | 1.00 | 0.24 |
| ai_staff_train_num | 0.15 | 0.16 | 0.05 | 0.00 | 0.04 | 0.07 | 0.09 | 0.04 | 0.03 | 0.24 | 1.00 |
Figure A1.
Marginal Effects of the Interaction Between Perceived Loss of Personal Touch and Trust in AI on the Probability That AI Influences Hotel Choice (“Yes”).
Figure A1.
Marginal Effects of the Interaction Between Perceived Loss of Personal Touch and Trust in AI on the Probability That AI Influences Hotel Choice (“Yes”).
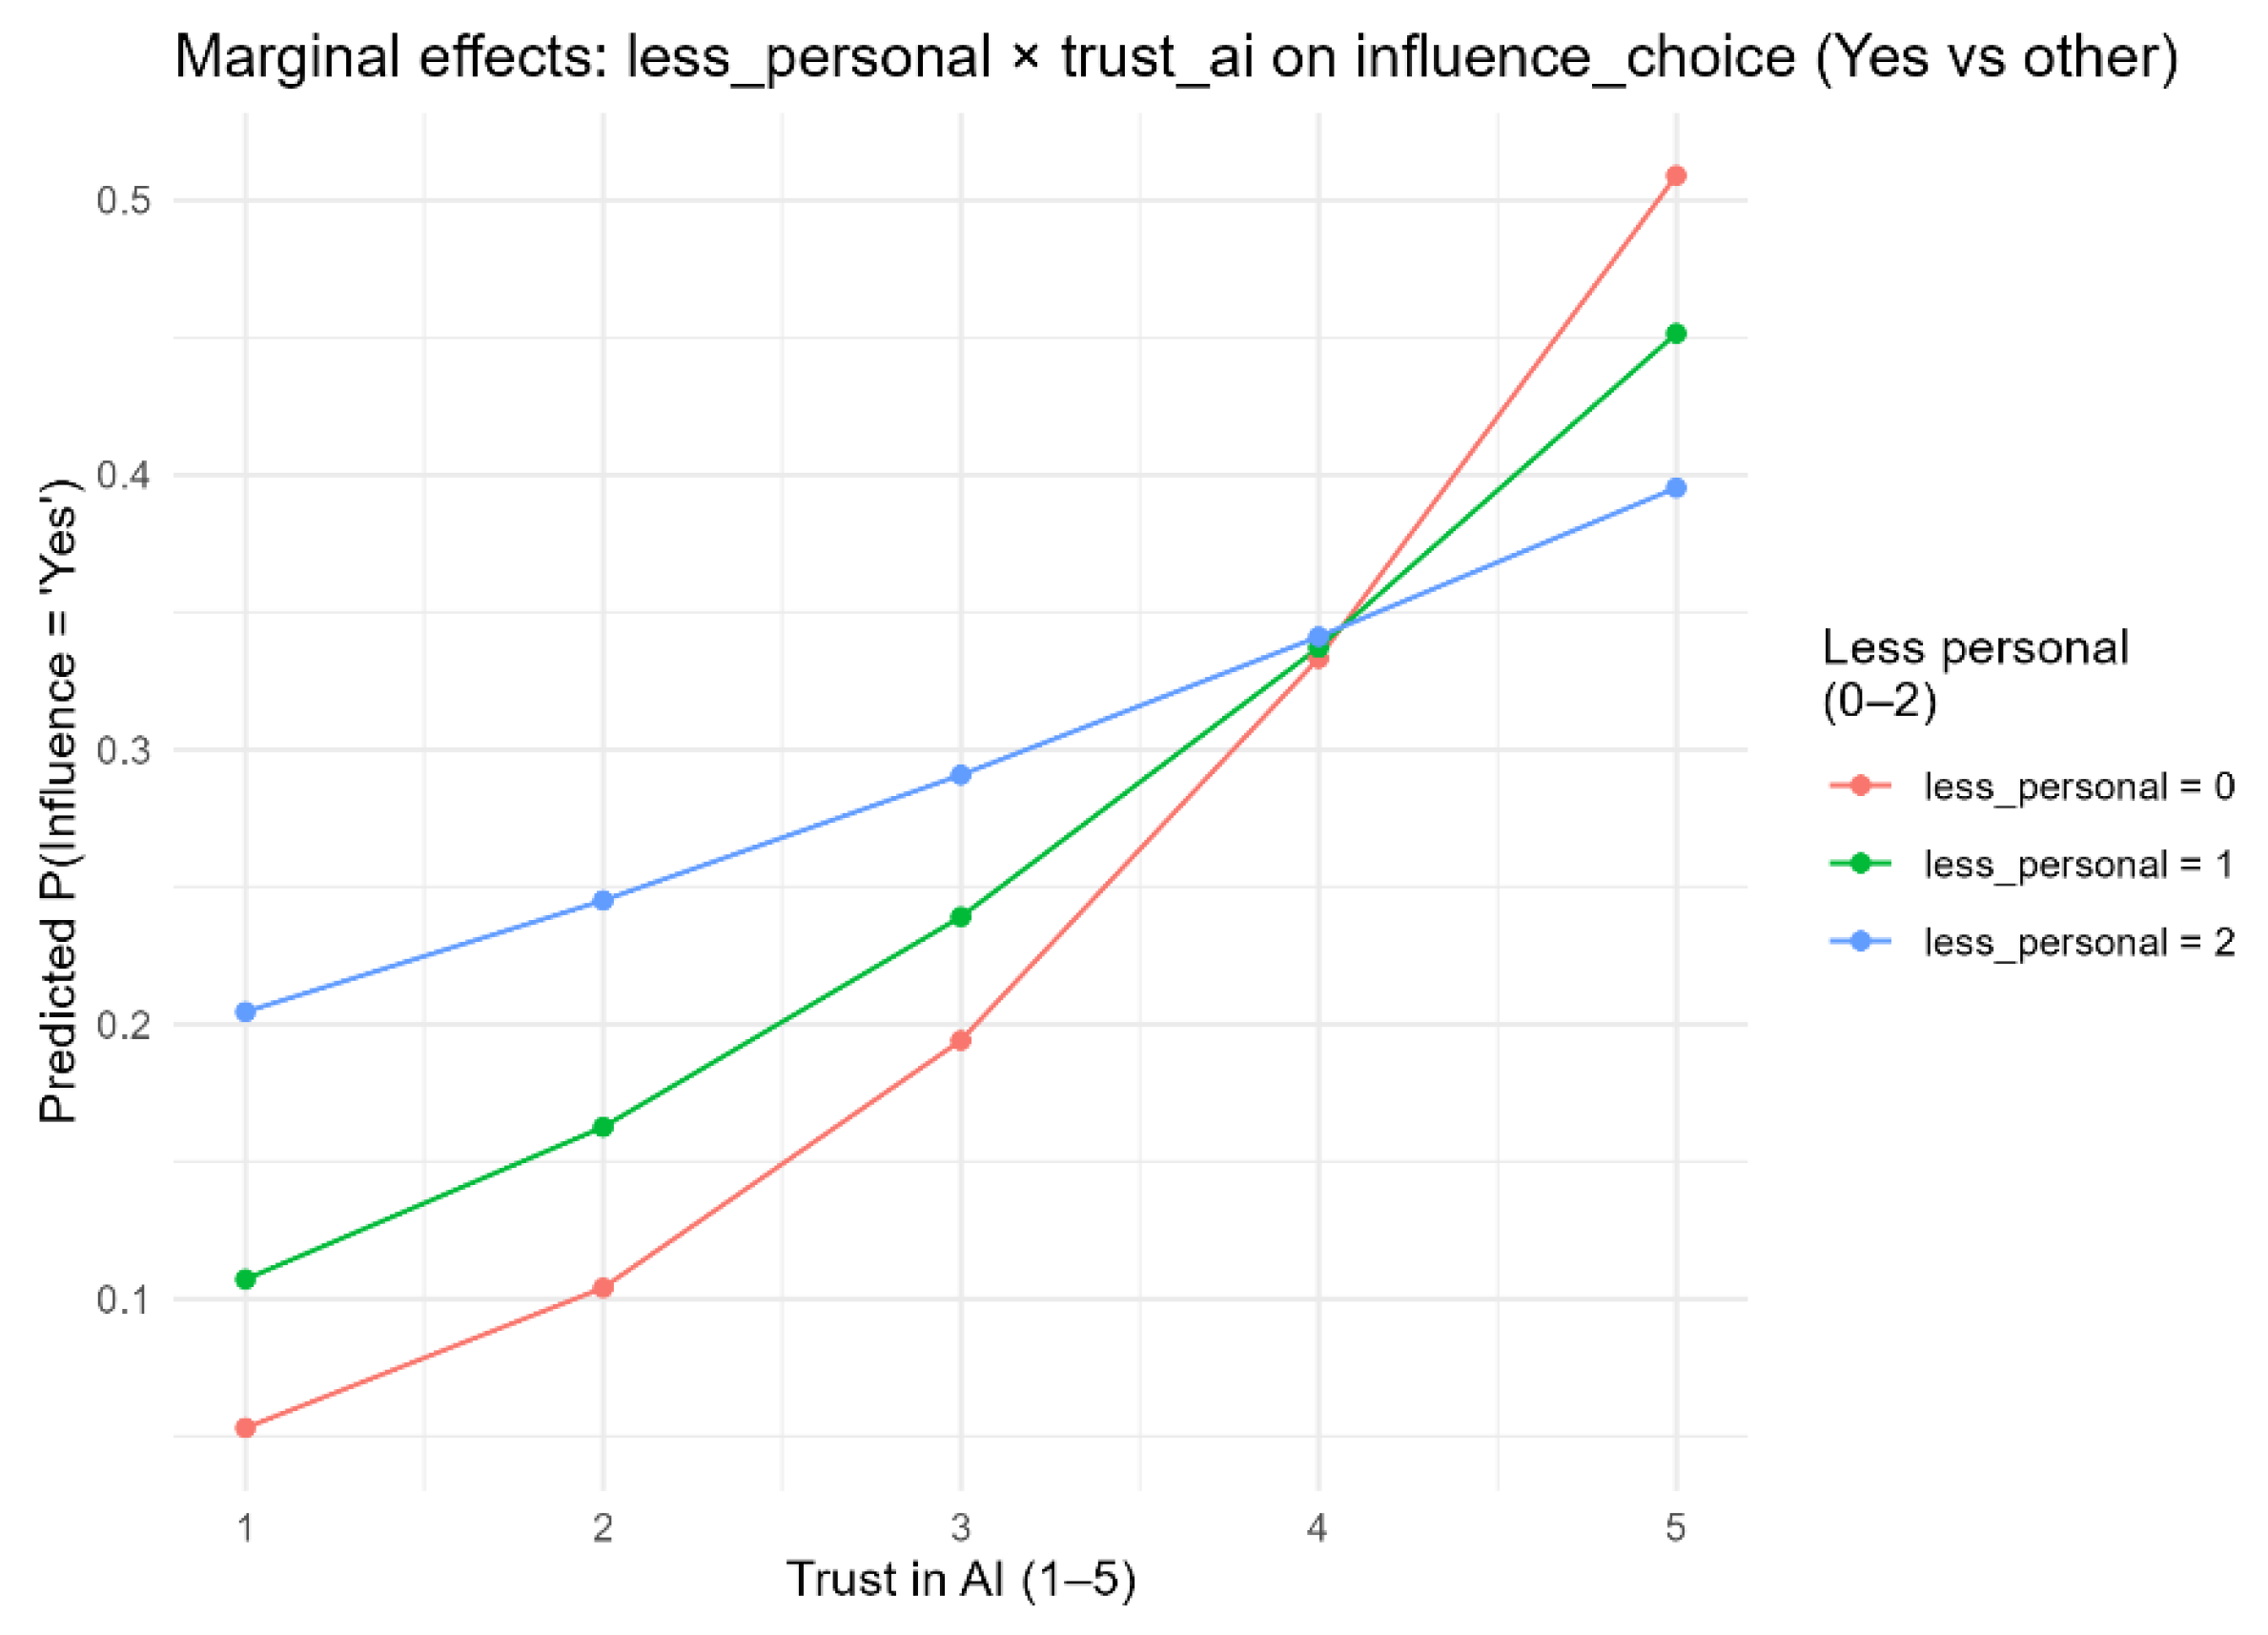
Figure A2.
Marginal Effects of the Interaction Between Perceived Loss of Personal Touch and Trust in AI on the Probability of Willingness to Pay More for AI-Enabled Services (“Yes”).
Figure A2.
Marginal Effects of the Interaction Between Perceived Loss of Personal Touch and Trust in AI on the Probability of Willingness to Pay More for AI-Enabled Services (“Yes”).
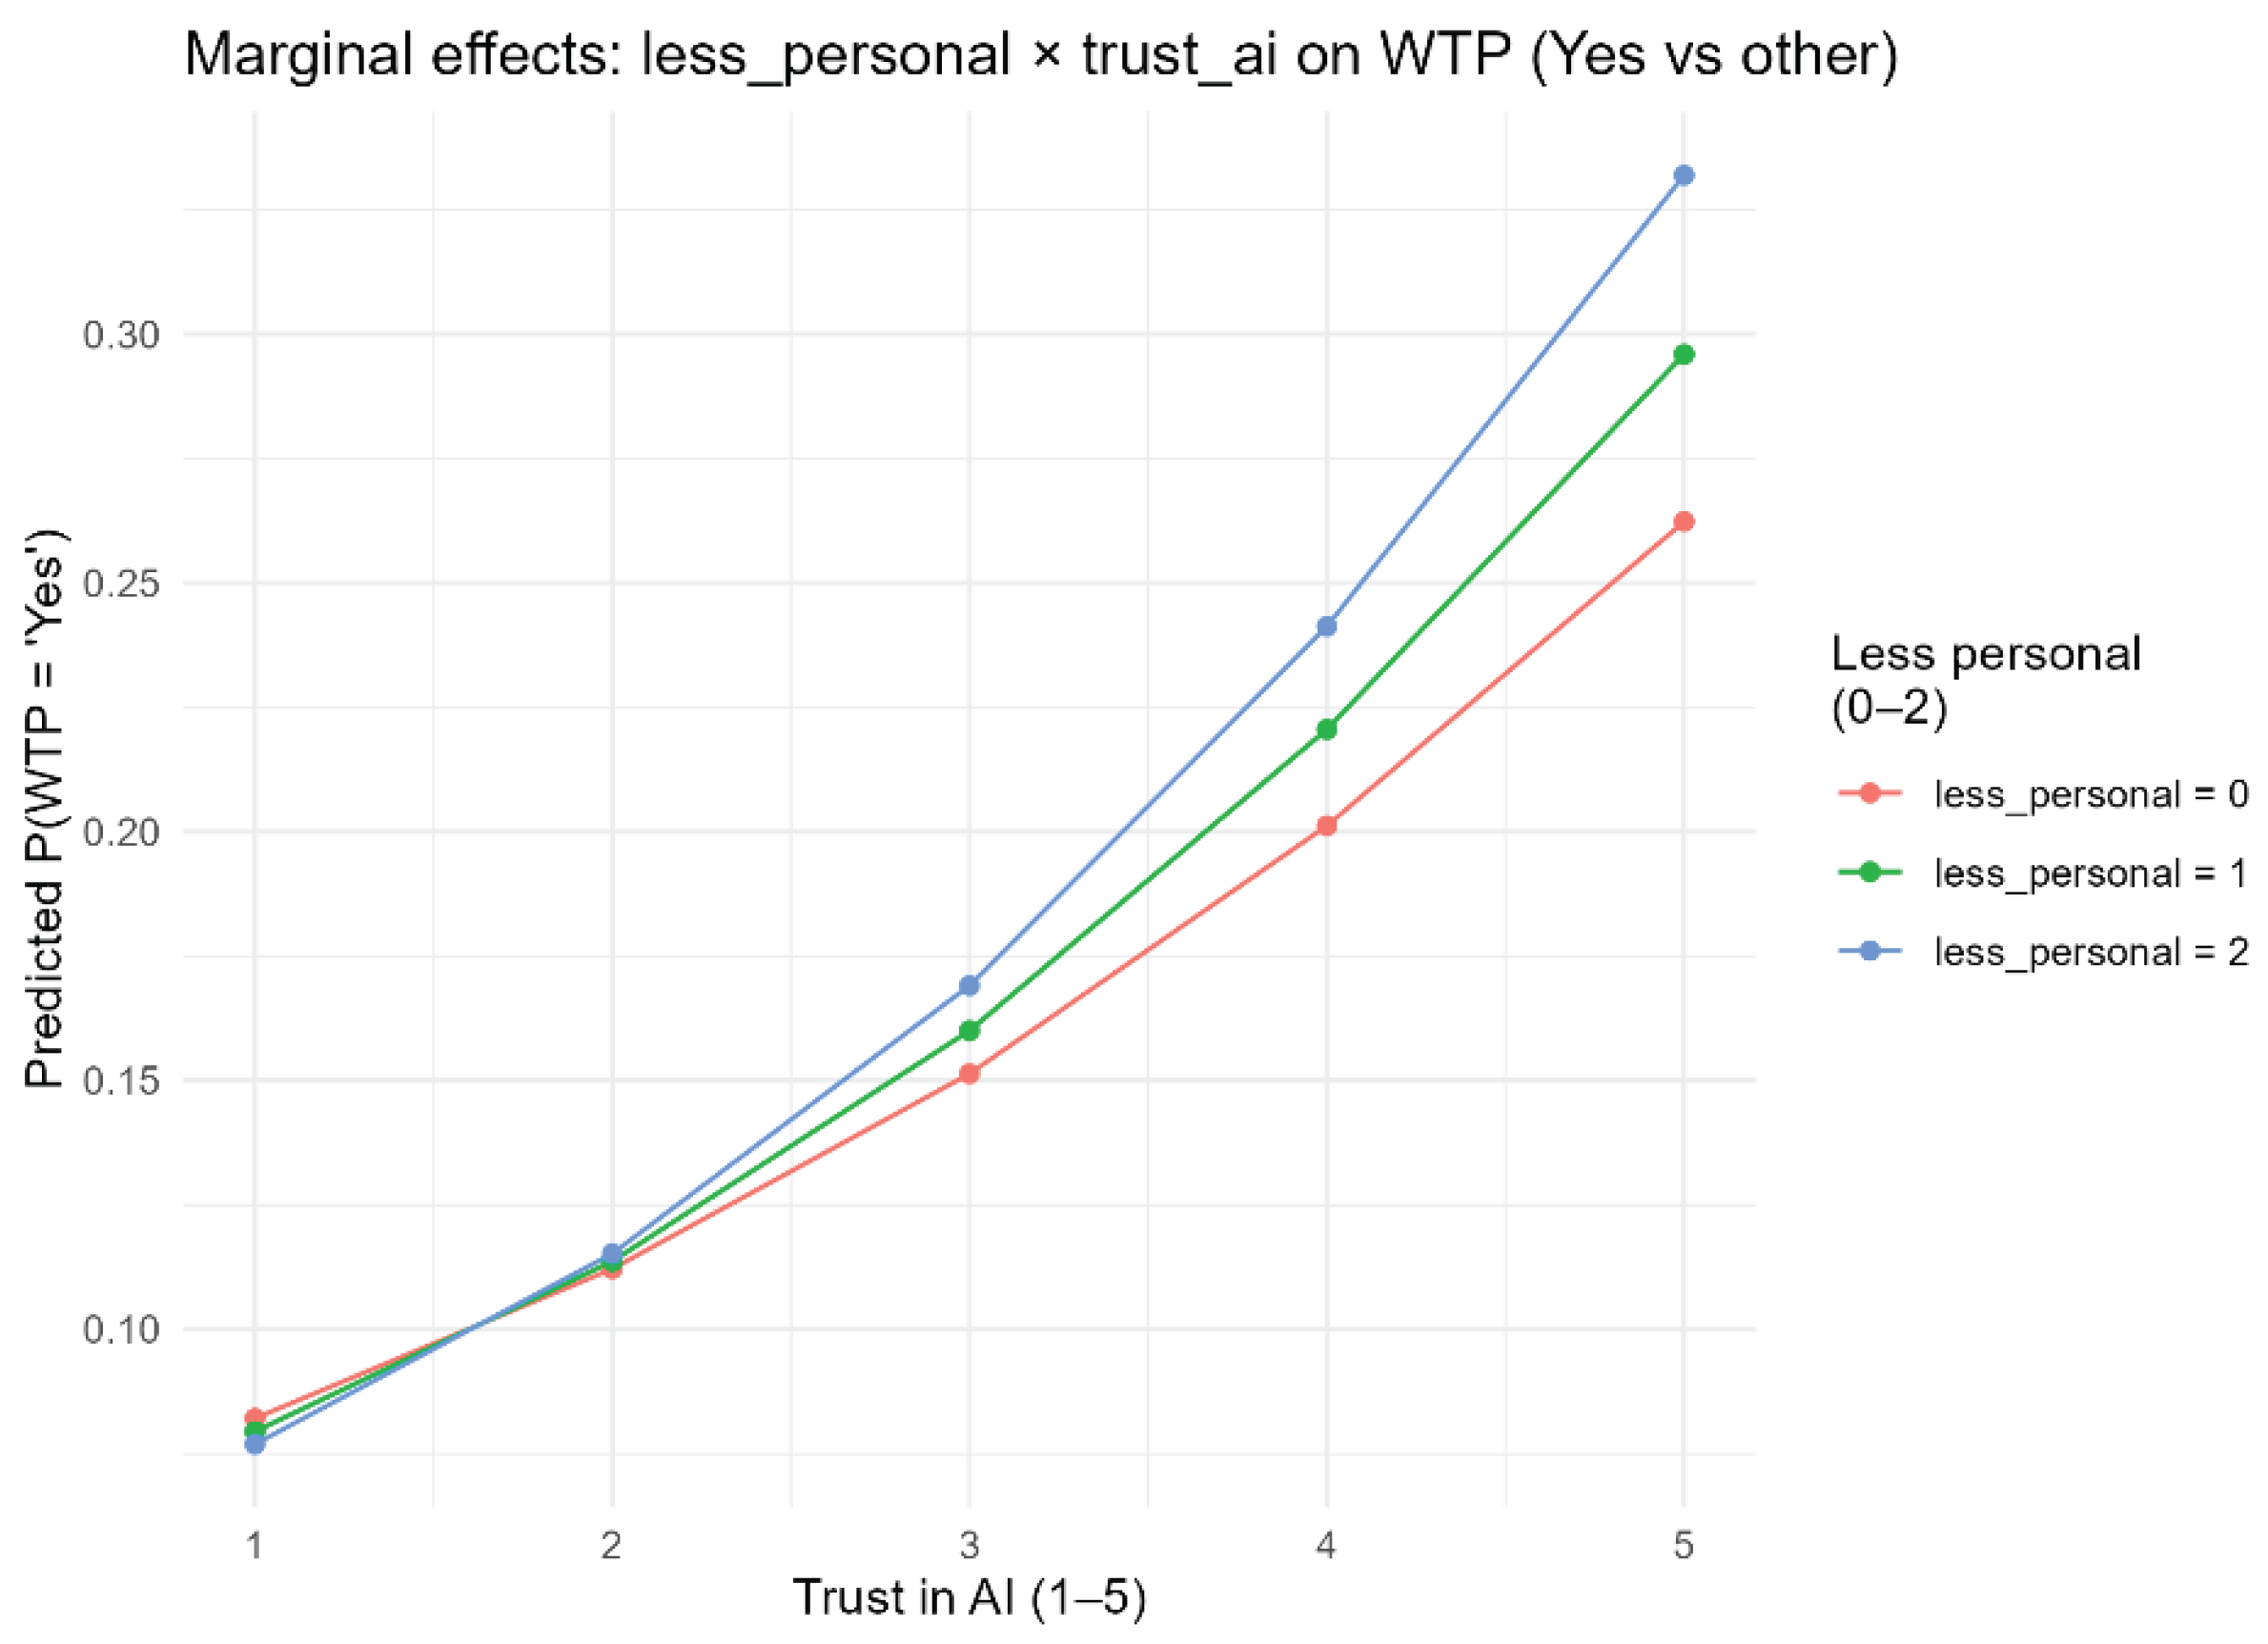
Table A14.
crosstab_influence_privacy.
| privacy_concern_num | infl_choice3 | Freq |
|---|---|---|
| 0 | No | 48 |
| 0 | Unsure | 99 |
| 0 | Yes | 99 |
| 1 | No | 42 |
| 1 | Unsure | 154 |
| 1 | Yes | 40 |
| 2 | No | 33 |
| 2 | Unsure | 115 |
| 2 | Yes | 55 |
Table A15.
crosstab_wtp_privacy.
| privacy_concern_num | wtp3 | Freq |
|---|---|---|
| 0 | No | 58 |
| 0 | Depends | 98 |
| 0 | Yes | 90 |
| 1 | No | 58 |
| 1 | Depends | 144 |
| 1 | Yes | 34 |
| 2 | No | 64 |
| 2 | Depends | 110 |
| 2 | Yes | 30 |
Table A16.
Summary of Binary Logistic Regression Fit Statistics.
| Outcome | Version | AIC | Pseudo-R2 |
|---|---|---|---|
| infl_yes (binary) | Logit_full | 784.7203 | 0.096302 |
| wtp_yes (binary) | Logit_full | 662.7059 | 0.153782 |
Table A17.
Partial Proportional-Odds Model (PPOM) Fit Statistics.
| Outcome | Model | AIC | Pseudo-R2 |
|---|---|---|---|
| influence_choice | PPOM_F1 | 1359.614 | — |
| wtp | PPOM_F2 | 1271.286 | — |
References
- Agresti, Alan. 2010. Analysis of Ordinal Categorical Data. 2nd ed. Wiley Series in Probability and Statistics. Wiley.
- Akaike, H. 1974. “A New Look at the Statistical Model Identification.” IEEE Transactions on Automatic Control 19 (6): 716–23. [CrossRef]
- Albania 2020 Report SWD(2020) 354. 2020. EUROPEAN COMMISSION.
- Barnes, Stuart J., Jan Mattsson, Flemming Sørensen, and Jens Friis Jensen. 2020. “The Mediating Effect of Experiential Value on Tourist Outcomes from Encounter-Based Experiences.” Journal of Travel Research 59 (2): 367–80. [CrossRef]
- Bergkvist, Lars, and John R. Rossiter. 2007. “The Predictive Validity of Multiple-Item versus Single-Item Measures of the Same Constructs.” Journal of Marketing Research 44 (2): 175–84. [CrossRef]
- Buhalis, Dimitrios, and Rosanna Leung. 2018. “Smart Hospitality—Interconnectivity and Interoperability towards an Ecosystem.” International Journal of Hospitality Management 71 (April): 41–50. [CrossRef]
- Chi, Oscar Hengxuan, Christina G. Chi, Dogan Gursoy, and Robin Nunkoo. 2023. “Customers’ Acceptance of Artificially Intelligent Service Robots: The Influence of Trust and Culture.” International Journal of Information Management 70 (June): 102623. [CrossRef]
- Chiu, Fei-Rung, and Yan-Kwang Chen. 2025. “Travelers’ Accommodation Intention Towards Smart Hotels: A Two-Stage Analysis Using SEM and fsQCA.” Tourism and Hospitality Management 31 (3). [CrossRef]
- Christensen, Rune Haubo B. 2023. Regression Models for Ordinal Data. V. 2023.12-4.1. Released. https://github.com/runehaubo/ordinal.
- Culnan, Mary J., and Pamela K. Armstrong. 1999. “Information Privacy Concerns, Procedural Fairness, and Impersonal Trust: An Empirical Investigation.” Organization Science 10 (1): 104–15. [CrossRef]
- Davis, Fred D. 1989. “Perceived Usefulness, Perceived Ease of Use, and User Acceptance of Information Technology.” MIS Quarterly 13 (3): 319. [CrossRef]
- Della Corte, Valentina, Fabiana Sepe, Dogan Gursoy, and Anna Prisco. 2023. “Role of Trust in Customer Attitude and Behaviour Formation towards Social Service Robots.” International Journal of Hospitality Management 114 (September): 103587. [CrossRef]
- DeVellis, Robert F. 2017. Scale Development: Theory and Applications. Fourth edition. SAGE.
- Dillman, Don A., Jolene D. Smyth, and Leah Melani Christian. 2015. Internet, Phone, Mail, and Mixed-Mode Surveys: The Tailored Design Method. 4. ed. Wiley.
- European Parliament. 2016. “REGULATION (EU) 2016/679 OF THE EUROPEAN PARLIAMENT AND OF THE COUNCIL.” https://eur-lex.europa.eu/eli/reg/2016/679/oj/eng.
- Festinger, Leon. 2001. A Theory of Cognitive Dissonance. Reissued by Stanford Univ. Press in 1962, Renewed 1985 by author, [Nachdr.]. Stanford Univ. Press.
- Fox, John, and Georges Monette. 1992. “Generalized Collinearity Diagnostics.” Journal of the American Statistical Association 87 (417): 178–83. [CrossRef]
- Fuchs, Christian and Diamantopoulos, Adamantios. 2009. “Using Single-Item Measures for Construct Measurement in Management Research: Conceptual Issues and Application Guidelines.” Die Betriebswirtschaft 69 (2): 195–210.
- Greenwell, Brandon, M., Andrew McCarthy J., Bradley Boehmke C., and Dungang Liu. 2018. “Residuals and Diagnostics for Binary and Ordinal Regression Models: An Introduction to the Sure Package.” The R Journal 10 (1): 381. [CrossRef]
- Gursoy, Dogan. 2025. “Artificial Intelligence (AI) Technology, Its Applications and the Use of AI Powered Devices in Hospitality Service Experience Creation and Delivery.” International Journal of Hospitality Management 129 (August): 104212. [CrossRef]
- Gursoy, Dogan, Oscar Hengxuan Chi, Lu Lu, and Robin Nunkoo. 2019. “Consumers Acceptance of Artificially Intelligent (AI) Device Use in Service Delivery.” International Journal of Information Management 49 (December): 157–69. [CrossRef]
- Hao, Fei, Richard T. R. Qiu, Jinah Park, and Kaye Chon. 2023. “The Myth of Contactless Hospitality Service: Customers’ Willingness to Pay.” Journal of Hospitality & Tourism Research 47 (8): 1478–502. [CrossRef]
- Harpe, Spencer E. 2015. “How to Analyze Likert and Other Rating Scale Data.” Currents in Pharmacy Teaching and Learning 7 (6): 836–50. [CrossRef]
- Higgins, E. Tory. 1997. “Beyond Pleasure and Pain.” American Psychologist 52 (12): 1280–300. [CrossRef]
- Hoffman, Robert R., Matthew Johnson, Jeffrey M. Bradshaw, and Al Underbrink. 2013. “Trust in Automation.” IEEE Intelligent Systems 28 (1): 84–88. [CrossRef]
- Holmqvist, Jonas, and Christian Grönroos. 2012. “How Does Language Matter for Services? Challenges and Propositions for Service Research.” Journal of Service Research 15 (4): 430–42. [CrossRef]
- Holmqvist, Jonas, Yves Van Vaerenbergh, and Christian Grönroos. 2014. “Consumer Willingness to Communicate in a Second Language: Communication in Service Settings.” Management Decision 52 (5): 950–66. [CrossRef]
- Holmqvist, Jonas, Yves Van Vaerenbergh, and Christian Grönroos. 2017. “Language Use in Services: Recent Advances and Directions for Future Research.” Journal of Business Research 72 (March): 114–18. [CrossRef]
- Hu, Yaou, and Hyounae Kelly Min. 2025. “Information Transparency, Privacy Concerns, and Customers’ Behavioral Intentions Regarding AI-Powered Hospitality Robots: A Situational Awareness Perspective.” Journal of Hospitality and Tourism Management 63 (June): 177–84. [CrossRef]
- Huang, Ming-Hui, and Roland T. Rust. 2018. “Artificial Intelligence in Service.” Journal of Service Research 21 (2): 155–72. [CrossRef]
- Ivanov, Stanislav, and Craig Webster. 2019. “Perceived Appropriateness and Intention to Use Service Robots in Tourism.” In Information and Communication Technologies in Tourism 2019, edited by Juho Pesonen and Julia Neidhardt. Springer International Publishing. [CrossRef]
- Ivanov, Stanislav, and Craig Webster. 2024. “Automated Decision-Making: Hoteliers’ Perceptions.” Technology in Society 76 (March): 102430. [CrossRef]
- Ivanov, Stanislav, Craig Webster, and Katerina Berezina. 2022. Handbook of E-Tourism. Springer International Publishing. [CrossRef]
- Jia, Shizhen (Jasper), Oscar Hengxuan Chi, and Lu Lu. 2024. “Social Robot Privacy Concern (SRPC): Rethinking Privacy Concerns within the Hospitality Domain.” International Journal of Hospitality Management 122 (September): 103853. [CrossRef]
- Kang, Kyung Ho, Laura Stein, Cindy Yoonjoung Heo, and Seoki Lee. 2012. “Consumers’ Willingness to Pay for Green Initiatives of the Hotel Industry.” International Journal of Hospitality Management 31 (2): 564–72. [CrossRef]
- Kang, Sung-Eun, Chulmo Koo, and Namho Chung. 2023. “Creepy vs. Cool: Switching from Human Staff to Service Robots in the Hospitality Industry.” International Journal of Hospitality Management 111 (May): 103479. [CrossRef]
- Karwatzki, Sabrina, Olga Dytynko, Manuel Trenz, and Daniel Veit. 2017. “Beyond the Personalization–Privacy Paradox: Privacy Valuation, Transparency Features, and Service Personalization.” Journal of Management Information Systems 34 (2): 369–400. [CrossRef]
- Kim, Jinkyung Jenny, Myong Jae Lee, and Heesup Han. 2020. “Smart Hotels and Sustainable Consumer Behavior: Testing the Effect of Perceived Performance, Attitude, and Technology Readiness on Word-of-Mouth.” International Journal of Environmental Research and Public Health 17 (20): 7455. [CrossRef]
- Kim, Jong Hae. 2019. “Multicollinearity and Misleading Statistical Results.” Korean Journal of Anesthesiology 72 (6): 558–69. [CrossRef]
- Kim, Jungsun (Sunny). 2016. “An Extended Technology Acceptance Model in Behavioral Intention toward Hotel Tablet Apps with Moderating Effects of Gender and Age.” International Journal of Contemporary Hospitality Management 28 (8): 1535–53. [CrossRef]
- Kim, Seongseop (Sam), Jungkeun Kim, Frank Badu-Baiden, Marilyn Giroux, and Youngjoon Choi. 2021. “Preference for Robot Service or Human Service in Hotels? Impacts of the COVID-19 Pandemic.” International Journal of Hospitality Management 93 (February): 102795. [CrossRef]
- Kim, Yunhi, and Heesup Han. 2010. “Intention to Pay Conventional-Hotel Prices at a Green Hotel—a Modification of the Theory of Planned Behavior.” Journal of Sustainable Tourism 18 (8): 997–1014. [CrossRef]
- Kokkinou, Alinda, and David A. Cranage. 2013. “Using Self-Service Technology to Reduce Customer Waiting Times.” International Journal of Hospitality Management 33 (June): 435–45. [CrossRef]
- Law No. 124/2024 On Personal Data Protection. 2024. Republic of Albania. https://idp.al/wp-content/uploads/2025/04/Law-no.124-2024-DP.pdf.
- LAW No. 9887 Dated 10.03.2008 ON PROTECTION OF PERSONAL DATA. 2008. Republic of Albania. https://idp.al/wp-content/uploads/2024/01/LDP_english_version_amended_2014-1.pdf.
- Lee, Chung Hun, and David A. Cranage. 2011. “Personalisation–Privacy Paradox: The Effects of Personalisation and Privacy Assurance on Customer Responses to Travel Web Sites.” Tourism Management 32 (5): 987–94. [CrossRef]
- Lei, Sut Ieng, Lawrence Hoc Nang Fong, and Shun Ye. 2024. “‘Touch over Tech’: A Longitudinal Examination of Human Touch along a Travel Journey.” International Journal of Contemporary Hospitality Management 36 (3): 927–45. [CrossRef]
- Lin, Ingrid Y., and Anna S. Mattila. 2021. “The Value of Service Robots from the Hotel Guest’s Perspective: A Mixed-Method Approach.” International Journal of Hospitality Management 94 (April): 102876. [CrossRef]
- Liu, Dungang, and Heping Zhang. 2018. “Residuals and Diagnostics for Ordinal Regression Models: A Surrogate Approach.” Journal of the American Statistical Association 113 (522): 845–54. [CrossRef]
- Loewenstein, George F., Elke U. Weber, Christopher K. Hsee, and Ned Welch. 2001. “Risk as Feelings.” Psychological Bulletin 127 (2): 267–86. [CrossRef]
- Lv, Xingyang, Yufan Yang, Dazhi Qin, and Xiaoyan Liu. 2025. “AI Service May Backfire: Reduced Service Warmth Due to Service Provider Transformation.” Journal of Retailing and Consumer Services 85 (July): 104282. [CrossRef]
- Makivić, Ranko, Dragan Vukolić, Sonja Veljović, et al. 2024. “AI Impact on Hotel Guest Satisfaction via Tailor-Made Services: A Case Study of Serbia and Hungary.” Information 15 (11): 700. [CrossRef]
- Marghany, Mostafa N.M., Nirmeen M.A.A. Elmohandes, Ibrahim Mohamad, et al. 2025. “Robots at Your Service: Understanding Hotel Guest Acceptance with Meta-UTAUT Investigation.” International Journal of Hospitality Management 130 (September): 104227. [CrossRef]
- Mariani, Marcello, and Matteo Borghi. 2021. “Customers’ Evaluation of Mechanical Artificial Intelligence in Hospitality Services: A Study Using Online Reviews Analytics.” International Journal of Contemporary Hospitality Management 33 (11): 3956–76. [CrossRef]
- Mariani, Marcello, and Matteo Borghi. 2023. “Exploring Environmental Concerns on Digital Platforms through Big Data: The Effect of Online Consumers’ Environmental Discourse on Online Review Ratings.” Journal of Sustainable Tourism 31 (11): 2592–611. [CrossRef]
- Mayer, Roger C., James H. Davis, and F. David Schoorman. 1995. “An Integrative Model of Organizational Trust.” The Academy of Management Review 20 (3): 709. [CrossRef]
- McCullagh, Peter. 1980. “Regression Models for Ordinal Data.” Journal of the Royal Statistical Society Series B: Statistical Methodology 42 (2): 109–27. [CrossRef]
- McFadden, D. 1974. Frontiers in Econometrics. Conditional Logit Analysis of Qualitative Choice Behavior. Academic Press.
- McLean, Graeme, Kofi Osei-Frimpong, Alan Wilson, and Valentina Pitardi. 2020. “How Live Chat Assistants Drive Travel Consumers’ Attitudes, Trust and Purchase Intentions: The Role of Human Touch.” International Journal of Contemporary Hospitality Management 32 (5): 1795–812. [CrossRef]
- McLeay, Fraser, Victoria Sophie Osburg, Vignesh Yoganathan, and Anthony Patterson. 2021. “Replaced by a Robot: Service Implications in the Age of the Machine.” Journal of Service Research 24 (1): 104–21. [CrossRef]
- Mick, David Glen, and Susan Fournier. 1998. “Paradoxes of Technology: Consumer Cognizance, Emotions, and Coping Strategies.” Journal of Consumer Research 25 (2): 123–43. [CrossRef]
- Morosan, Cristian, and Agnes DeFranco. 2015. “Disclosing Personal Information via Hotel Apps: A Privacy Calculus Perspective.” International Journal of Hospitality Management 47 (May): 120–30. [CrossRef]
- Nisbett, Richard E., and Timothy D. Wilson. 1977. “The Halo Effect: Evidence for Unconscious Alteration of Judgments.” Journal of Personality and Social Psychology 35 (4): 250–56. [CrossRef]
- Norman, Geoff. 2010. “Likert Scales, Levels of Measurement and the ‘Laws’ of Statistics.” Advances in Health Sciences Education 15 (5): 625–32. [CrossRef]
- O’brien, Robert M. 2007. “A Caution Regarding Rules of Thumb for Variance Inflation Factors.” Quality & Quantity 41 (5): 673–90. [CrossRef]
- Ozturk, Ahmet Bulent, Abraham Pizam, Ahmet Hacikara, et al. 2023. “Hotel Customers’ Behavioral Intentions toward Service Robots: The Role of Utilitarian and Hedonic Values.” Journal of Hospitality and Tourism Technology 14 (5): 780–801. [CrossRef]
- Paparoidamis, Nicholas G., Huong Thi Thanh Tran, and Constantinos N. Leonidou. 2019. “Building Customer Loyalty in Intercultural Service Encounters: The Role of Service Employees’ Cultural Intelligence.” Journal of International Marketing 27 (2): 56–75. [CrossRef]
- Pavlou, Paul A. 2003. “Consumer Acceptance of Electronic Commerce: Integrating Trust and Risk with the Technology Acceptance Model.” International Journal of Electronic Commerce 7 (3): 101–34. [CrossRef]
- Peduzzi, Peter, John Concato, Elizabeth Kemper, Theodore R. Holford, and Alvan R. Feinstein. 1996. “A Simulation Study of the Number of Events per Variable in Logistic Regression Analysis.” Journal of Clinical Epidemiology 49 (12): 1373–79. [CrossRef]
- Peterson, Bercedis, and Frank E. Harrell. 1990. “Partial Proportional Odds Models for Ordinal Response Variables.” Applied Statistics 39 (2): 205. [CrossRef]
- Pizam, Abraham, Ahmet Bulent Ozturk, Ahmet Hacikara, et al. 2024. “The Role of Perceived Risk and Information Security on Customers’ Acceptance of Service Robots in the Hotel Industry.” International Journal of Hospitality Management 117 (February): 103641. [CrossRef]
- Porsdam Mann, Sebastian, Anuraag A. Vazirani, Mateo Aboy, et al. 2024. “Guidelines for Ethical Use and Acknowledgement of Large Language Models in Academic Writing.” Nature Machine Intelligence 6 (11): 1272–74. [CrossRef]
- Prelec, Drazen, and George Loewenstein. 1998. “The Red and the Black: Mental Accounting of Savings and Debt.” Marketing Science 17 (1): 4–28. [CrossRef]
- Premathilake, Gehan Wishwajith, Hongxiu Li, Chenglong Li, Yong Liu, and Shengnan Han. 2025. “Understanding the Effect of Anthropomorphic Features of Humanoid Social Robots on User Satisfaction: A Stimulus-Organism-Response Approach.” Industrial Management & Data Systems 125 (2): 768–96. [CrossRef]
- Prentice, Catherine, Scott Weaven, and IpKin Anthony Wong. 2020. “Linking AI Quality Performance and Customer Engagement: The Moderating Effect of AI Preference.” International Journal of Hospitality Management 90 (September): 102629. [CrossRef]
- R Core Team. 2024. R: A Language and Environment for Statistical Computing. R Foundation for Statistical Computing, released. https://www.R-project.org/.
- Ren, Gang, Gang Wang, and Tianyang Huang. 2025. “What Influences Potential Users’ Intentions to Use Hotel Robots?” Sustainability 17 (12): 5271. [CrossRef]
- Riley, Richard D, Kym Ie Snell, Joie Ensor, et al. 2019. “Minimum Sample Size for Developing a Multivariable Prediction Model: PART II— Binary and Time-to-event Outcomes.” Statistics in Medicine 38 (7): 1276–96. [CrossRef]
- Rogers, Everett M. 2003. Diffusion of Innovations. Fifth edition. Free Press.
- Said, Saara. 2023. “The Role of Artificial Intelligence (AI) and Data Analytics in Enhancing Guest Personalization in Hospitality.” Journal of Modern Hospitality 2 (1): 1–13. [CrossRef]
- Shum, Cass, Hyun Jeong Kim, Jennifer R. Calhoun, and Eka Diraksa Putra. 2024. “‘I Was so Scared I Quit’: Uncanny Valley Effects of Robots’ Human-Likeness on Employee Fear and Industry Turnover Intentions.” International Journal of Hospitality Management 120 (July): 103762. [CrossRef]
- Silge, Julia, and David Robinson. 2016. “Tidytext: Text Mining and Analysis Using Tidy Data Principles in R.” The Journal of Open Source Software 1 (3): 37. [CrossRef]
- Soliman, Mohamed, Arunneewan Buaniew, Aris Hassama, Muhammadafeefee Assalihee, and Reham Adel. 2025. “Investigating the Role of Smart Hotel Technologies in Enhancing Guest Experiences and Sustainable Tourism in Thailand.” Discover Sustainability 6 (1): 1091. [CrossRef]
- Sousa, Ana Elisa, Paula Cardoso, and Francisco Dias. 2024. “The Use of Artificial Intelligence Systems in Tourism and Hospitality: The Tourists’ Perspective.” Administrative Sciences 14 (8): 165. [CrossRef]
- Sullivan, Gail M., and Anthony R. Artino. 2013. “Analyzing and Interpreting Data From Likert-Type Scales.” Journal of Graduate Medical Education 5 (4): 541–42. [CrossRef]
- Tavakol, Mohsen, and Reg Dennick. 2011. “Making Sense of Cronbach’s Alpha.” International Journal of Medical Education 2 (June): 53–55. [CrossRef]
- Tavitiyaman, Pimtong, Xinyan Zhang, and Wing Yin Tsang. 2022. “How Tourists Perceive the Usefulness of Technology Adoption in Hotels: Interaction Effect of Past Experience and Education Level.” Journal of China Tourism Research 18 (1): 64–87. [CrossRef]
- Thaler, Richard. 1985. “Mental Accounting and Consumer Choice.” Marketing Science 4 (3): 199–214. [CrossRef]
- Tsai, Janice Y., Serge Egelman, Lorrie Cranor, and Alessandro Acquisti. 2011. “The Effect of Online Privacy Information on Purchasing Behavior: An Experimental Study.” Information Systems Research 22 (2): 254–68. [CrossRef]
- Tuomi, Aarni, Iis P. Tussyadiah, and Jason Stienmetz. 2021. “Applications and Implications of Service Robots in Hospitality.” Cornell Hospitality Quarterly 62 (2): 232–47. [CrossRef]
- Tussyadiah, Iis. 2020. “A Review of Research into Automation in Tourism: Launching the Annals of Tourism Research Curated Collection on Artificial Intelligence and Robotics in Tourism.” Annals of Tourism Research 81 (March): 102883. [CrossRef]
- Venkatesh, Morris, Davis, and Davis. 2003. “User Acceptance of Information Technology: Toward a Unified View.” MIS Quarterly 27 (3): 425. [CrossRef]
- Venkatesh, Viswanath, James Y. L. Thong, and Xin Xu. 2012. “Consumer Acceptance and Use of Information Technology: Extending the Unified Theory of Acceptance and Use of Technology1.” MIS Quarterly 36 (1): 157–78. [CrossRef]
- Vittinghoff, E., and C. E. McCulloch. 2007. “Relaxing the Rule of Ten Events per Variable in Logistic and Cox Regression.” American Journal of Epidemiology 165 (6): 710–18. [CrossRef]
- Wickham, Hadley. 2016. Ggplot2. Use R! Springer International Publishing. [CrossRef]
- Wickham, Hadley, Mara Averick, Jennifer Bryan, et al. 2019. “Welcome to the Tidyverse.” Journal of Open Source Software 4 (43): 1686. [CrossRef]
- Wirtz, Jochen, Paul G. Patterson, Werner H. Kunz, et al. 2018. “Brave New World: Service Robots in the Frontline.” Journal of Service Management 29 (5): 907–31. [CrossRef]
- Yang, Huijun, Hanqun Song, Catherine Cheung, and Jieqi Guan. 2021. “How to Enhance Hotel Guests’ Acceptance and Experience of Smart Hotel Technology: An Examination of Visiting Intentions.” International Journal of Hospitality Management 97 (August): 103000. [CrossRef]
- Yee, Thomas W. 2010. “The VGAM Package for Categorical Data Analysis.” Journal of Statistical Software 32 (10). [CrossRef]
Figure 1.
Distributions of Key Ethical and Attitudinal Indicators Related to AI in Hospitality.
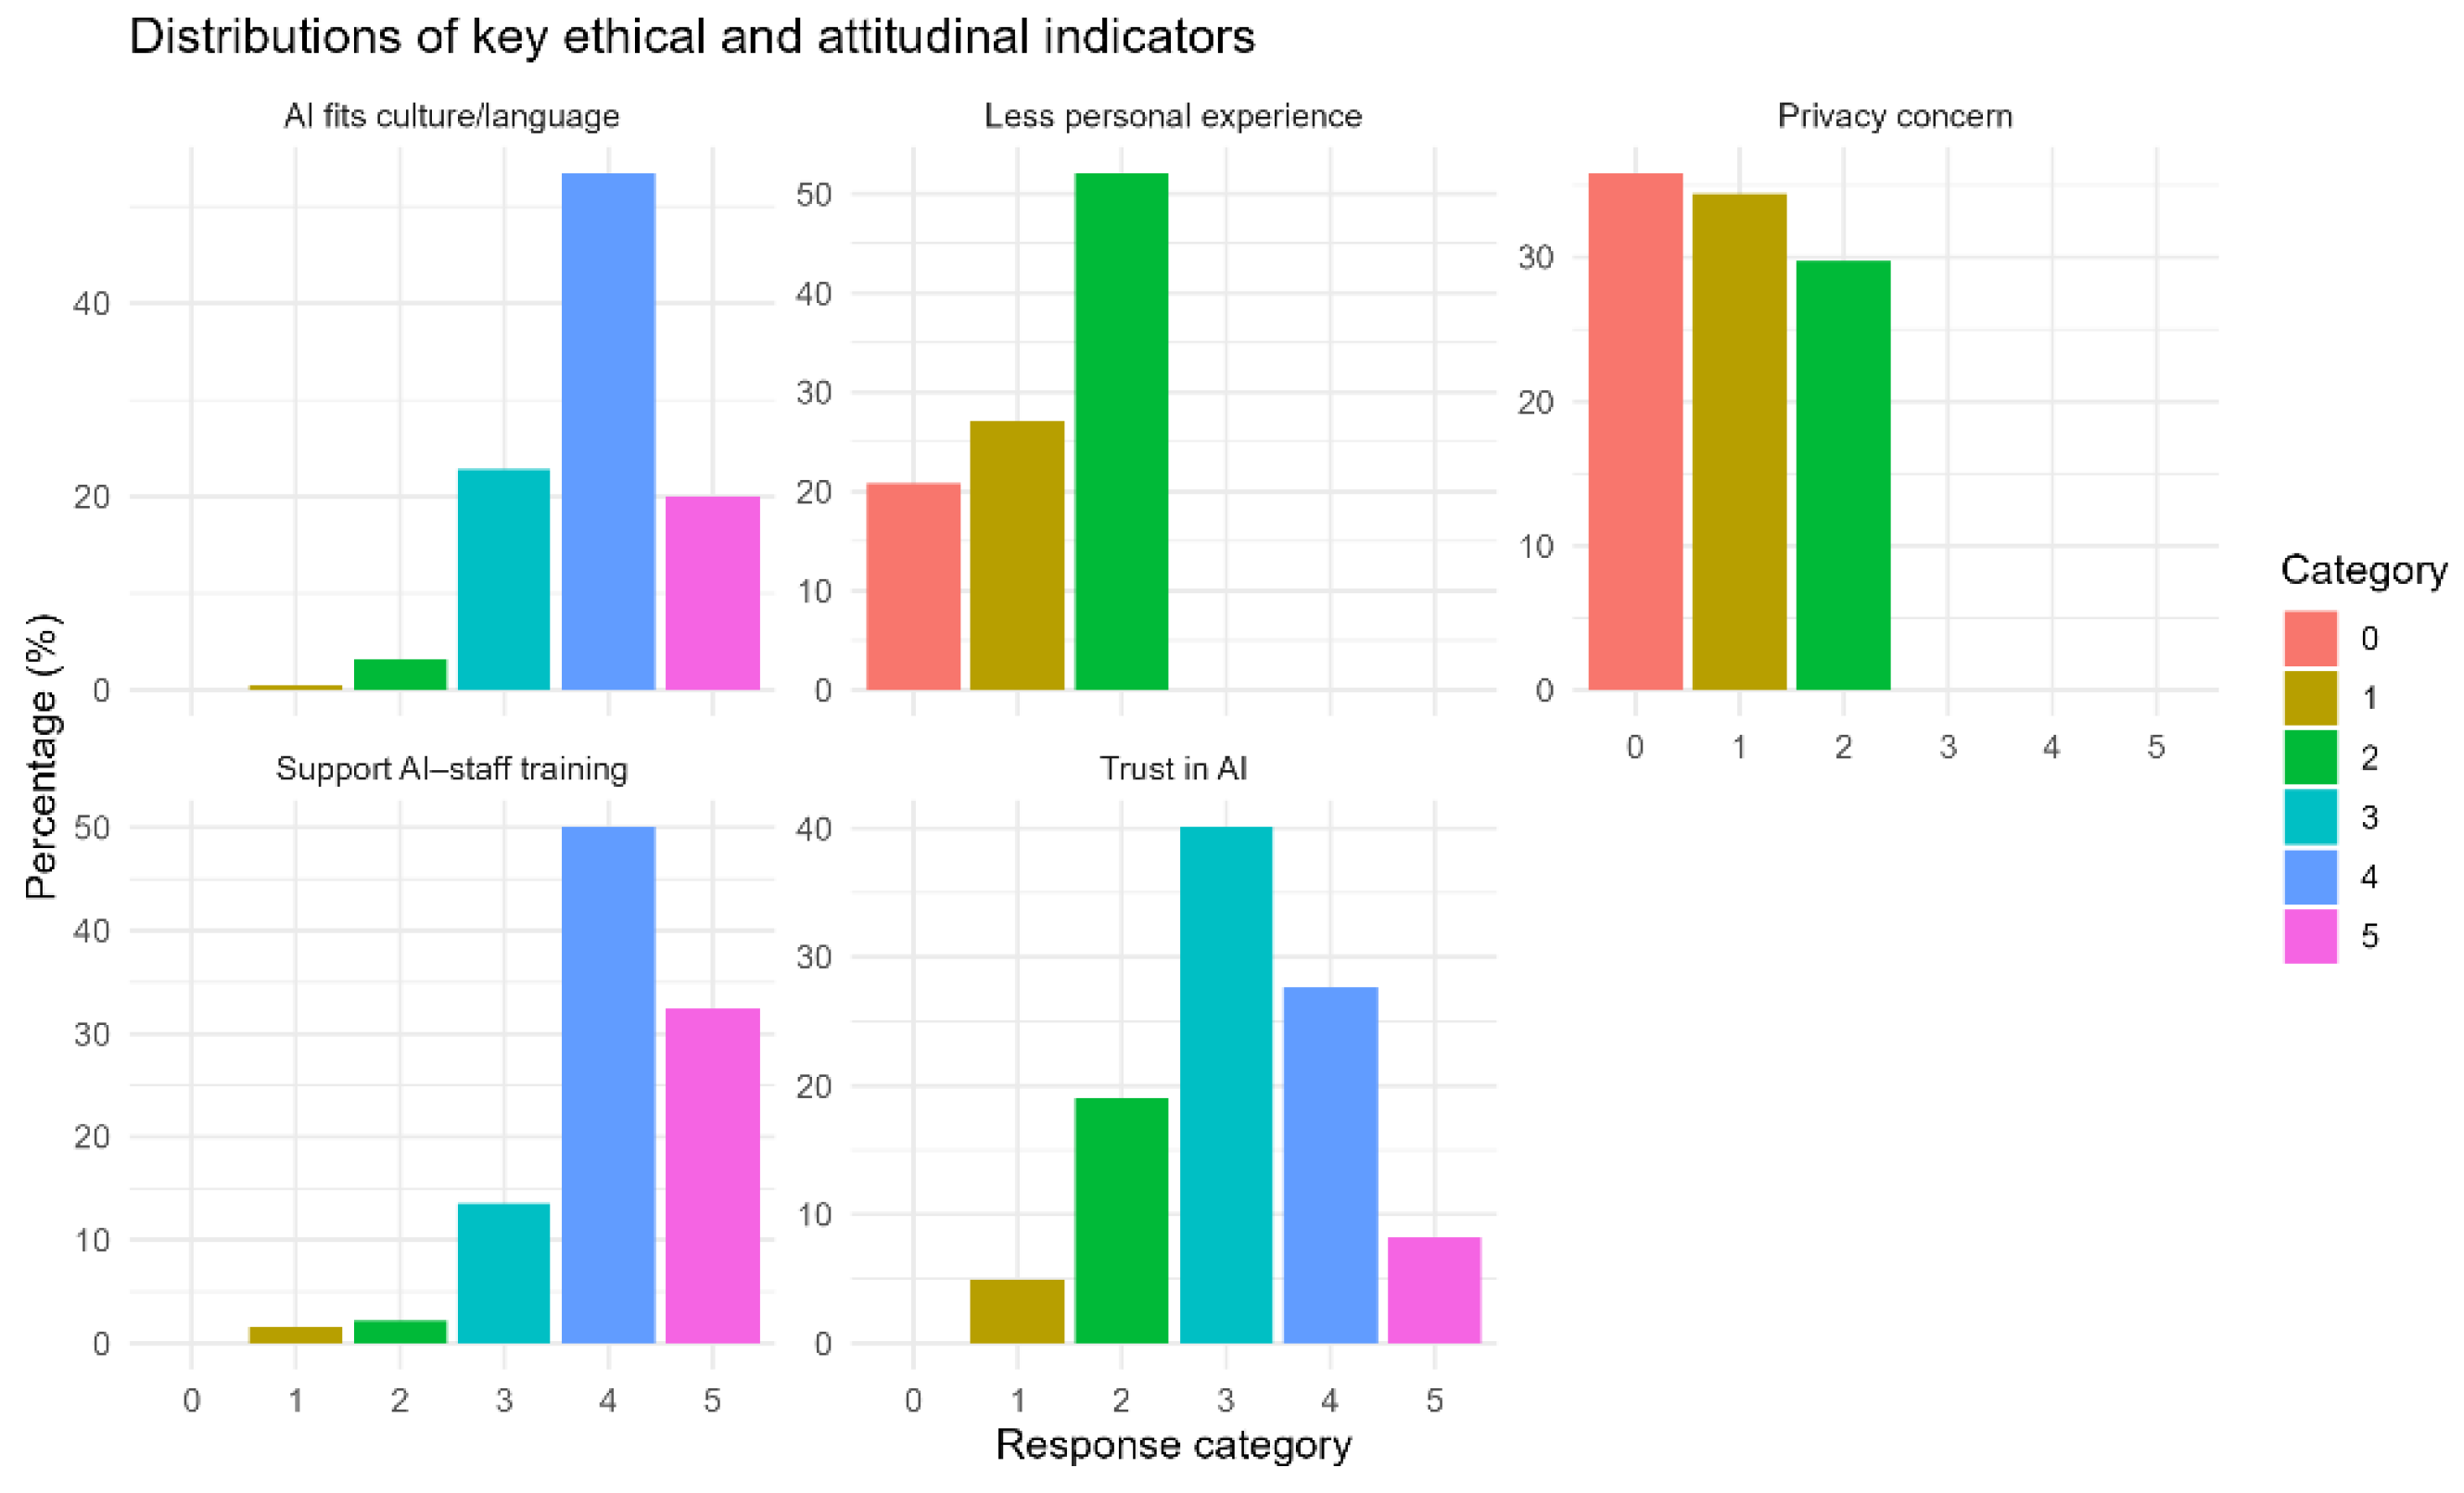
Table 1.
Age Group Distribution of Respondents.
| Age Group | n | % |
|---|---|---|
| 18–24 | 242 | 35.12% |
| 25–34 | 141 | 20.46% |
| 35–44 | 119 | 17.27% |
| 45–54 | 86 | 12.48% |
| 55+ | 75 | 10.89% |
| Under 18 | 26 | 3.77% |
Table 2.
Gender Distribution of Respondents.
| Gender | n | % |
|---|---|---|
| Female | 382 | 55.44% |
| Male | 302 | 43.83% |
| Missing/Other | 5 | 0.73% |
Table 3.
Frequency of Hotel Stays per Year Among Respondents.
| Hotel-Stay Frequency | n | % |
|---|---|---|
| 1–2 times | 273 | 39.62% |
| 3–5 times | 272 | 39.48% |
| 6–10 times | 98 | 14.22% |
| More than 10 times | 46 | 6.68% |
Table 4.
Distribution of Responses on Whether Smart Technologies and AI Influences Hotel Choice.
| Response Category | n | % |
|---|---|---|
| No | 123 | 17.90% |
| Unsure | 369 | 53.71% |
| Yes | 195 | 28.38% |
Table 5.
Distribution of Responses on Willingness to Pay More for Smart and AI-Enhanced Services.
| Response Category | n | % |
|---|---|---|
| No | 180 | 26.20% |
| Depends | 353 | 51.38% |
| Yes | 154 | 22.42% |
Table 6.
Descriptive Statistics for Key Numeric Constructs (N = 689).
| Variable | N | Mean | SD | Min | Max |
|---|---|---|---|---|---|
| Number of perceived benefits (n_benefits) |
689 | 2.79 | 1.39 | 1 | 7 |
| Number of desired features (n_features) |
689 | 6.21 | 3.38 | 1 | 16 |
| Comfort with AI services (comfort_ai_num) | 686 | 3.35 | 1.05 | 1 | 5 |
| Awareness of smart technologies (aware_smart_num) |
687 | 1.65 | 0.66 | 0 | 2 |
| Prior stay in smart/AI hotel (prior_ai_stay_num) |
689 | 1.18 | 0.89 | 0 | 2 |
| Importance of human interaction (human_ importance_num) |
688 | 3.82 | 0.99 | 1 | 5 |
| Privacy concerns (privacy_concern_num) |
686 | 0.94 | 0.81 | 0 | 2 |
| Perceived reduction in personal touch (less_ personal_num) |
687 | 1.31 | 0.80 | 0 | 2 |
| Trust in AI (trust_ai_num) | 687 | 3.15 | 0.98 | 1 | 5 |
| Cultural–linguistic fit of AI (ai_culture_num) | 684 | 3.89 | 0.77 | 1 | 5 |
| Support for staff–AI collaboration (ai_staff_train_num) |
686 | 4.10 | 0.83 | 1 | 5q |
| AI influences hotel choice (binary) (infl_yes) | 687 | 0.28 | 0.45 | 0 | 1 |
| Willingness to pay more (binary) (wtp_yes) | 687 | 0.22 | 0.42 | 0 | 1 |
Table 7.
Model Fit Summary for Ordinal Models.
| Outcome | Model Version | AIC | Pseudo-R2 |
| Influence on hotel choice | Baseline A1 | 1342.94 | 0.047 |
| Influence on hotel choice | Extended B1 | 1338.155 | 0.053 |
| Influence on hotel choice | Attitudinal C1 | 1318.449 | 0.073 |
| Willingness to pay | Baseline A2 | 1321.396 | 0.088 |
| Willingness to pay | Extended B2 | 1309.571 | 0.099 |
| Willingness to pay | Attitudinal C2 | 1282.789 | 0.125 |
Disclaimer/Publisher’s Note: The statements, opinions and data contained in all publications are solely those of the individual author(s) and contributor(s) and not of MDPI and/or the editor(s). MDPI and/or the editor(s) disclaim responsibility for any injury to people or property resulting from any ideas, methods, instructions or products referred to in the content. |
© 2025 by the authors. Licensee MDPI, Basel, Switzerland. This article is an open access article distributed under the terms and conditions of the Creative Commons Attribution (CC BY) license (http://creativecommons.org/licenses/by/4.0/).
Copyright: This open access article is published under a Creative Commons CC BY 4.0 license, which permit the free download, distribution, and reuse, provided that the author and preprint are cited in any reuse.


