
Submitted:
03 December 2025
Posted:
05 December 2025
You are already at the latest version
Abstract
Trichloroethylene (TCE) and tetrachloroethylene (PCE) are chlorinated organic liquids widely employed in various industrial processes. However, due to their high toxicity and cancerogenic proprieties, these compounds are recognized as environmental pollutants. Therefore, the removal of TCE and PCE from wastewater is a crucial objective for environmental protection. This work investigated the adsorption capacity of syndiotactic polystyrene (sPS) fibers, activated in the nanoporous crystalline δ form, to remove volatile organic compounds from aqueous solutions. TCE can be adsorbed in the nanoporous crystalline δ form of sPS, leading to the formation of a clathrate structure, in which it acts as the guest molecule. This adsorption mechanism allows for high process selectivity, as well as the capture of even trace amounts (in the ppb range) of the pollutants under consideration, in relatively short times (e.g., 67 hours). Also, a process with two successive adsorption tests was performed replacing the solid used for the first contact with the contaminated solution with fresh δ-sPS fibers. This approach allowed the reduction of TCE concentration down to 8 ppb. In conclusion, δ-sPS nanoporous fibers demonstrated a great potential for the efficient removal of chlorinated organic compounds from wastewater, providing a promising alternative to conventional adsorption processes.
Keywords:
TCE
; δ-sPS fibers
; water remediation
1. Introduction
Trichloroethylene (TCE) and tetrachloroethylene (PCE) are colorless, volatile liquid organic compounds that are classified as Group 2A carcinogens by the International Agency for Research on Cancer (IARC). They belong to polychlorinated organic compounds and are among the main substances responsible for water and environmental pollution [1]. TCE and PCE are largely used in industrial practices related to chemicals, dry cleaning, textile, food, agricultural, electrical and leather processing [2]. Since their densities (1.46 g/cm3 for TCE and 1.62 g/cm3 for PCE) exceed that of water, these organics are defined as DNAPLs (dense non-aqueous phase liquids). They show a high adsorption capacity in soils and low aqueous solubility that lead to an extremely difficult remediation [3].
Various technologies have been proposed to remove these organic compounds down to a few part per billion (ppb) from the environment, such as biological treatments [4], catalytic processes [5], membrane separation [6] and adsorption [7]. Lan et al. attempted the elimination of TCE employing reductive dechlorination using oxalated zerovalent iron (Ox-ZVIbm) obtained by mechanical ball-milling of micro-scale ZVI and H2C2O4⋅2H2O. The aim was the generation of unsaturated coordination Fe(II) to enhance TCE adsorption. Laboratory-scale tests were performed on simulated wastewater containing 10 ppm of TCE and, using Ox-ZVIbm, the TCE concentration was kept below 210 ppb in 7 days [8]. Liu et al. used photocatalytic optical hollow fibers (POHFs) coupled with spiral-shaped Cl- adsorption fibers to remove TCE from wastewater. This kind of material increased the production of reactive ⋅O-2 and ⋅OH species, improving the degradation of TCE. In particular, TCE, chemical oxygen demand, and Cl- ion removal rates were about 99%, 69%, and 99%, respectively. The initial loading was approximately 100 ppm and this result means that a final TCE content of 1 ppm was present in the residual water phase [9]. All these remediation methods suffer from some limitations, since they are time-consuming and difficult to scale-up processes, they work in batch-mode, and require expensive, long and complex preparation of the materials involved, before the application. Moreover, the elimination of TCE and PCE remains problematic with respect to regulation limits set at a few ppb.
To overcome these technical and economic limitations, adsorption is frequently proposed to remove contaminants from water, since it is a simple and effective purification method, relatively cheap and easy to scale-up [10,11]. Chen et al. carried out the adsorption of TCE and PCE in two different adsorbent materials: silica gel and activated carbon. The equilibrium adsorption capacities of silica gel for TCE and PCE ranged from 4 to 7 ppm and from 5 to 8 ppm, respectively. Furthermore, the removal percentages of silica gel were 67-73% for TCE and 70-76% for PCE. The equilibrium adsorption capacities of activated carbon were found to range between 0.5 to 0.9 ppm for TCE and from 0.6 to 1.0 ppm for PCE. Moreover, the removal efficiencies of activated carbon were 88-90% and 92-93%, respectively. Although the removal efficiency of activated carbon for TCE and PCE was larger than that of silica gel, activated carbon is expensive; therefore, to reduce adsorption costs, these authors used silica gel to decrease pollutant concentration first and then, activated carbon should be added to continue adsorption [12]. Remmani et al. proposed biochar (BC) derived from date palm seeds as an adsorbent material for the removal of TCE and PCE from aqueous solutions. The experiments were carried out using a concentration of TCE or PCE equal to 50 ppm and a solid to liquid ratio of 0.5. The optimized BC, characterized by high surface area and nanotube morphology, demonstrated adsorption capacities of about 87 mg/g for TCE and 86 mg/g for PCE. The sampling to monitor the TCE and PCE concentrations was performed over a period of 28 hours [13]. Lees et al. developed microporous oil shale kerogen-derived semicokes for TCE adsorption. The material exhibited a high surface area. 5 mg of semicokes were placed in an agitated vial containing 40 mL of a solution of TCE, with an initial concentration between 0.1 and 7 ppm, for five days. This material showed an adsorptive capacity of roughly 70 mg/g [14]. However, these last two studies did not specify the residual concentration of contaminants after adsorption. Moghaddam et al. synthesized zeolitic imidazolate frameworks (ZIFs) nanoparticles for the removal of TCE from aqueous solutions. Using 0.313 g/L adsorbent dosage, pH 7.5 and a contact time of 96 min, a removal efficiency of 96.3% was achieved for an initial TCE concentration of 50 ppm, corresponding to a final concentration of 1.8 ppm [15].
However, the adsorption performance of these materials depends on physico-chemical factors, including crystalline structure, particle size, pore dimension, pore volume, specific surface area of the adsorbent, and type of adsorbate [12,16]. In the overall, studies in the literature reported process durations ranging from several hours to a few days, with residual TCE concentrations between a few ppm and about 200 ppb.
In this context, nanoporous crystalline polymers can represent effective adsorbent materials, able to adsorb very high quantities of volatile organic compounds (VOCs), as in the case of syndiotactic polystyrene (sPS). In this case, guest-induced crystallization of amorphous sPS fibers leads to nanocrystalline forms that are suitable for the removal of organic pollutants from the environment down to ppb [17]. An example is the δ form of sPS that is characterized by isolated cavities and can host one guest molecule. Operating in this way, δ-sPS can adsorb molecules as isolated guests in the crystalline phase forming clathrates and making this polymer an impressive filter to remove pollutants from water and moist air [18,19,20].
Therefore, this work proposes a systematic study of TCE adsorption from model contaminated water using δ-sPS micrometric nanoporous fibers as an effective and alternative material for TCE and PCE removal. Gas-chromatographic method was used to measure the residual TCE in water, considering δ-sPS amount, pollutant concentration, and adsorption duration.
2. Materials and Methods
sPS nanoporous microfibers were produced by Idemitsu (sPS grade 300ZC). They were characterized by a smooth surface and a mean diameter of about 20 µm, as shown in the SEM image reported in Figure 1; their specific surface area (SSA) was equal to 1.08 m2/g. Then, they were treated with chloroform, to transform them in the δ-activated form (Figure 2) [21]. After this treatment, they showed a slightly rough surface, but the final mean diameter of the fibers was approximately the same as the untreated ones. After this treatment, SSA was equal to 9.48 m2/g. TCE (≥ 99.5%) and PCE (≥ 99.0%) were bought from Sigma Aldrich; distilled water was produced in laboratory.
2.1. Adsorption Tests
Adsorption tests were carried out changing the amount of δ-sPS fibers from 200 to 400 mg and the concentration of the contaminant from 2.5 to 10 ppm in water. In order to guarantee the complete immersion of δ-sPS fibers in the model contaminated water, an ad hoc system was created. In particular, adsorption tests were performed in batch-mode in a 100 mL volume glass bottle in which 50 mL of contaminated water were added. To maintain a uniform dispersion of the contaminant in water, the system was mixed by magnetic stirring at 150 rpm for the entire duration of the test. At different time intervals, a small aliquot (a few microliters) of water was taken from the system and used for the characterization analysis by gas-chromatography. The test was stopped when the variation of the contaminant concentration in water was negligible with time. All tests were performed in triplicate, and the obtained error was around 2%.
2.2. Characterization Methods
sPS fibers were characterized morphologically by a field emission scanning electron microscope (FE-SEM, Carl Zeiss, mod. Supra 35). To perform this analysis, a sample of fibers was deposited on an aluminum stub and coated with a thin gold layer using a sputter coater (mod. 108 A, Agar Auto Sputter Coater) at 40 mA for 180 s.
Specific surface area (SSA) of the fibers was measured by N2 adsorption at 77 K using a Novatouch LX4 (Quantachrome instruments), after degassing 200 mg of the sample at 35 °C for 16 h.
Gas-chromatography (GC) analysis was carried out using an Agilent 6890 Series GC system equipped with an Agilent mod. 123-1334 DB-624 capillary column (30 m×320 μm×1.80 μm) and a static head-space automatic sampler (7694 Headspace Sampler). In the preliminary part of the work, a flame ionization detector (FID) was used; then, the kind of detector was changed with an electron capture detector (µECD) that is specific to quantify chlorinated compounds down to ppb. The adopted operating conditions for GC with FID detector were the following:
- Injector: 250 °C, 1.027 bar, 99.5 mL/min total flow rate of the carrier gas (helium);
- Column: 1.7 bar, 5.4 total flow rate of the carrier gas (helium);
- FID: 250 °C, 450 mL/min total flow rate of air and 40 mL/min total flow rate of hydrogen;
- Oven: set point at 100 °C, then the temperature was increased up to 175 °C (10 °C/min);
- Head space sampler: 120 °C oven temperature, 175 °C loop temperature, 175 °C transfer-line temperature.
The operating parameters for GC with µECD detector were set as follows:
- Injector: 15:1 split ratio, 250 °C heater, 43.7 mL/min total flow rate of the carrier gas (helium);
- Oven: set point at 40 °C for 2 min, then temperature was increased up to 100 °C (5 °C/min);
- µECD: 310 °C heater, 30 mL/min N2 flow rate;
- Head-space sampler: 20 min cycle time, 20 min vial equilibration time, 1 min injection time, 110 °C oven temperature, 120 °C loop temperature, 140 °C transfer-line temperature.
3. Results and Discussion
The main objective of the feasibility study was to demonstrate the capability of δ-sPS fibers to reduce drastically the contaminant concentration (i.e., down to ppb) to overcome the main limitations found in the previous literature and discussed in the Introduction. Therefore, adsorption kinetics were studied over time by varying the initial concentration of the contaminant in water, while maintaining the same mass of adsorbent, and vice-versa. The polymer/water contact was obtained inside glass bottles, as described in the Materials and Methods section. During the adsorption tests, the solution was stirred to ensure composition homogeneity, while the solid was trapped using metal supports inserted into the bottles.
Preliminary adsorption tests showed a rapid reduction ( ̴ 1.5 h) in TCE and PCE concentration down to the limit of detectability of the flame detector ( ̴ 1 ppm). Since TCE and PCE exhibited a similar behavior, systematic tests were performed only on TCE using a µECD for detection down to ppb.
3.1. Adsorption Tests Using Aqueous Solutions at Different TCE Concentrations and 200 mg of δ-sPS Fibers
The first series of adsorption tests was carried out using 200 mg of δ-sPS fibers immersed in 50 mL of an aqueous solution at a starting TCE concentration of 10 ppm. Table 1 reports the results obtained in terms of residual TCE concentration measured by GC-µECD analysis at different time intervals.
Looking at the data collected, the decrease in TCE concentration in the aqueous solution was exponential. Specifically, after 2 h contact time, the pollutant concentration was one-tenth of the initial value. The largest part of adsorption was obtained within 8 h. Sampling at 24 and 27 h revealed that the amount of residual TCE in the solution remained unchanged, specifically at 0.23 ppm, maybe due to a saturation of the adsorption material or to a reduction of the driving force.
A second series of adsorption tests was performed using the same amount of δ-sPS fibers (i.e., 200 mg) and reducing the starting concentration of TCE at 5 ppm. Also in this case, the trend of adsorbed TCE over time followed a decreasing exponential curve, and the final measured value was equal to 0.11 ppm after 24 h testing.
Then, a third series of adsorption tests was carried out, further reducing the TCE concentration down to 2.5 ppm. Also 2.5 ppm TCE concentration followed an exponential decrease over the time; but, differently from the previous cases, the TCE concentration was reduced to 40 ppb in 24 h that is a very relevant result for chlorinated organic compounds.
The three adsorption kinetics present the same behavior when varying the initial concentration of TCE, using 200 mg of δ-sPS fibers, as shown in Figure 3. Since the δ-sPS fibers exhibit a strong affinity for TCE, the initial concentration of the contaminant does not affect the adsorption mechanism. Although the three sets of points followed a similar decreasing trend, the TCE final concentration value in solution changes; i.e., it was equal to 230, 110, and 40 ppb for 10, 5, and 2.5 ppm TCE starting concentration in the aqueous solution after the same contact time of 24 h. For this reason, the next set of experiments was carried out by changing the amount of δ-sPS fibers and maintaining constant TCE concentration at 2.5 ppm in water.
3.2. Adsorption Tests Using Different Amounts of δ-sPS Fibers and 2.5 ppm TCE Contaminated Aqueous Solutions
In the light of the results of the experiments previously described, further adsorption tests were carried out setting the TCE concentration at 2.5 ppm; but, increasing the mass of adsorbent used. In particular, the following test was performed using 300 mg of δ-sPS fibers to decontaminate 50 mL of an aqueous solution containing 2.5 ppm TCE. The results obtained are summarized in Table 2.
Starting from a contaminant concentration of 2.5 ppm, 300 mg of δ-sPS fibers were able to reduce up to 60 ppb the TCE concentration after 24 h testing; this result was similar to the one obtained in the case of 200 mg δ-sPS fibers after the same contact time with the aqueous solution at 2.5 ppm TCE. Therefore, the following adsorption test was carried out increasing again the δ-sPS fibers amount at 400 mg. However, similar results were obtained also in this case, as reported in Table 2; i.e., the final TCE concentration arrived also in this case at 50 ppb after 24 h adsorption test.
The results indicate that the adsorption capacity of the system and, consequently, the residual TCE concentration, is governed by the driving force rather than by the adsorbent mass, as shown in Figure 4. Indeed, when the concentration of the compound in the liquid phase is very low, the driving force for adsorption can be practically negligible.
At this point, the aim of the subsequent adsorption tests was to try to further decrease the TCE concentration by changing the test procedure. Essentially, the goal was to verify whether adsorption was favored even at very low contaminant concentrations. Therefore, the following experiments were carried out adopting a different strategy: i.e., removing the solid present in the bottle (used for the first adsorption step), and replacing it with new fibers to proceed with a second adsorption step. The results obtained, operating in this manner, are summarized in Table 3.
Using a two-stage configuration and starting from an initial concentration of 2.5 ppm TCE in the aqueous solution, it was possible to reach a residual TCE concentration of 8 ppb after 67 h contact time and using 300 mg δ-sPS fibers in each adsorption stage.
This finding is particularly relevant since, to ensure water safety, environmental regulations set strict limitations on TCE concentration, generally in the range of a few ppb of the contaminant, and this result was not specifically obtained in the works presented in the scientific literature, as discussed in the Introduction.
4. Conclusions
The results obtained from the adsorption tests carried out in this work showed that, using limited amounts of δ-sPS fibers, it was possible to strongly reduce the concentration of TCE in solution. Two-stage adsorption tests were also performed; operating in this manner, starting from a 2.5 ppm TCE concentration in water, a residual contaminant concentration of 8 ppb was successfully reached.
The next step of the work will be the scale-up of the process, introducing an appropriate amount of fibers into an adsorption tower and ensuring a proper contact time to decontaminate water. Another interesting aspect can be the possibility of using a supercritical CO2-assisted process, at pilot scale, to regenerate the adsorbent solid [22]. In particular, supercritical CO2 can be able to selectively remove the adsorbate molecules from sPS, making the fiber nanocavities ready to accommodate new guest molecules. Since the solid adsorbent will need to be regenerated after several days of operation, two fixed bed columns are required to obtain a continuous process. Specifically, when the bed of the first column is saturated, sPS nanoporous fibers in first column will be regenerated and the contaminated water will be redirected to the second column.
Author Contributions
Conceptualization, E.R. and L.B.; investigation, M.S. and R.R; writing—review and editing, E.R., L.B. and R.R; funding acquisition, E.R. and A.G. All authors have read and agreed to the published version of the manuscript.
Funding
This work was financially supported by the Zoo-Prophylactic Institute of Southern Italy.
Data Availability Statement
The original contributions presented in this study are included in the article/supplementary material. Further inquiries can be directed to the corresponding author(s).
Acknowledgments
The authors acknowledge prof. Gaetano Guerra of the Department of Chemistry and Biology “A. Zambelli”, University of Salerno, for his help in producing sPS fibers in the activated form.
Conflicts of Interest
The authors declare no conflicts of interest. The funders had no role in the design of the study; in the collection, analyses, or interpretation of data.
Abbreviations
The following abbreviations are used in this manuscript:
| TCE | Trichloroethylene |
| PCE | Tetrachloroethylene |
| sPS | Syndiotactic Polystyrene |
| DNAPLs | Dense non-aqueous phase liquids |
References
- Bruckner, J.V.; Davis, B.D.; Blancato, J.N. Metabolism, toxicity, and carcinogenicity of trichloroethylene. Crit. Rev. Toxicol. 1989, 20, 31–50. [Google Scholar] [CrossRef]
- Akinboye, A.J.; Lee, H.; Lee, J.G. Trichloroethylene and tetrachloroethylene contamination: A review of toxicity, analytical methods, occurrence in foods, and risk assessment. Food Sci. Preserv. 2024, 31, 360–373. [Google Scholar] [CrossRef]
- Chang, J.H.; Yang, P.Y.; Dong, C.D.; Kumar, M.; Shen, S.Y. An in-situ cosolvent/electrokinetics/pumping (CEP) technique to remediate the groundwater site contaminated by tetrachloroethylene. Chem. Eng. J. 2023, 477, 147258. [Google Scholar] [CrossRef]
- Amanat, N.; Matturro, B.; Villano, M.; Lorini, L.; Rossi, M.M.; Zeppilli, M.; Rossetti, S.; Papini, M.P. Enhancing the biological reductive dechlorination of trichloroethylene with PHA from mixed microbial cultures (MMC). J. Environ. Chem. Eng. 2022, 10, 107047. [Google Scholar] [CrossRef]
- Pavel, M.; Anastasescu, C.; State, R.N.; Vasile, A.; Papa, F.; Balint, I. Photocatalytic degradation of organic and inorganic pollutants to harmless end products: assessment of practical application potential for water and air cleaning. Catalysts 2023, 13, 380. [Google Scholar] [CrossRef]
- Peydayesh, M. Nanofiltration membranes: Recent advances and environmental applications. Membranes 2022, 12, 518. [Google Scholar] [CrossRef]
- Nagarajan, V.; Bhuvaneswari, R.; Chandiramouli, R. Trichloroethylene and tetrachloroethylene adsorption studies on α-antimony phosphorous nanosheets–A first-principles study. Comput. Theor. Chem. 2024, 1241, 114861. [Google Scholar] [CrossRef]
- Lan, J.; Qiu, L.; Cai, X.; Lin, Y.; Xie, B.; Shi, H.; Zhang, L.; Liu, X. Oxalate-modified microscale zero-valent iron for trichloroethylene elimination by adsorption enhancement and accelerating electron transfer. Sep. Purif. Technol. 2024, 331, 125966. [Google Scholar] [CrossRef]
- Liu, W.; Xie, Q.; Chen, T.; Ran, L.; Nie, Z.; Liu, Y.; He, Y.; Chang, H.; Zare, N.; Karimi-Maleh, H.; Zhong, N.; Aminabhavi, T.M. Synergistic coupling of photocatalytic optical fibers with chloride ion adsorption fibers to remove trichloroethylene from polluted water. Chem. Eng. J. 2025, 510, 161723. [Google Scholar] [CrossRef]
- Song, Q.; Kong, F.; Liu, B.F.; Song, X.; Ren, H.Y. Biochar-based composites for removing chlorinated organic pollutants: Applications, mechanisms, and perspectives. Environ. Sci. Ecotechnol. 2024, 21, 100420. [Google Scholar] [CrossRef]
- Somma, S.; Reverchon, E.; Baldino, L. Water Purification of Classical and Emerging Organic Pollutants: An Extensive Review. ChemEngineering 2021, 5, 47. [Google Scholar] [CrossRef]
- Chen, H.Y.; Lo, I.T. Theoretical and experimental adsorption of silica gel and activated carbon onto chlorinated organic compounds in water: a case study on the remediation assessment of a contaminated groundwater site. Appl. Sci. 2022, 12, 11955. [Google Scholar] [CrossRef]
- Remmani, R.; Papini, M.P.; Amanat, N.; Canales, A.R. Superior Adsorption of Chlorinated VOC by Date Palm Seed Biochar: Two-Way ANOVA Comparative Analysis with Activated Carbon. Environments 2024, 11, 288. [Google Scholar] [CrossRef]
- Lees, H.; Külaots, I.; Suuberg, E.M. Oil shale kerogen-derived adsorbents and their application to trichloroethylene adsorption from aqueous solutions. Microporous Mesoporous Mater. 2023, 354, 112523. [Google Scholar] [CrossRef]
- Moghaddam, M.H.; Nabizadeh, R.; Dehghani, M.H.; Akbarpour, B.; Azari, A.; Yousefi, M. Performance investigation of Zeolitic Imidazolate framework–8 (ZIF-8) in the removal of trichloroethylene from aqueous solutions. Microchem. J. 2019, 150, 104185. [Google Scholar] [CrossRef]
- De Smedt, J.; Heynderickx, P.M.; Arauzo, P.J.; Ronsse, F. Adsorption mechanism of different dyes on chemical activated carbon as quantitative assessment for wastewater treatment: Comparative study between ZnCl2 and its eutectic. Sep. Purif. Technol. 2024, 334, 126002. [Google Scholar] [CrossRef]
- Cozzolino, A.; Rizzo, P.; Gallo, C.; Bianchi, R.; Daniel, C.; Guerra, G. Axially oriented guest induced crystallization in syndiotactic polystyrene unstretched fibers. Polymer 2021, 228, 123908. [Google Scholar] [CrossRef]
- Albunia, A.R.; Guerra, G. Spectroscopic Investigation of Guest–Guest Interactions in the Nanoporous-Crystalline δ and ε Forms of Syndiotactic Polystyrene. J. Phys. Chemi. C. 2014, 118, 11774–11783. [Google Scholar] [CrossRef]
- Daniel, C.; Antico, P.; Yamaguchi, H.; Kogure, M.; Guerra, G. Microporous-crystalline microfibers by eco-friendly guests: An efficient tool for sorption of volatile organic pollutants. Microporous and Mesoporous Mater. 2016, 232, 205–210. [Google Scholar] [CrossRef]
- Milano, G.; Guerra, G. Understanding at molecular level of nanoporous and co-crystalline materials based on syndiotactic polystyrene. Prog. Mater. Sci. 2009, 54, 68–88. [Google Scholar] [CrossRef]
- Daniel, C.; Antico, P.; Guerra, G. Etched fibers of syndiotactic polystyrene with nanoporous-crystalline phases. Macromolecules 2018, 51, 6138–6148. [Google Scholar] [CrossRef]
- Reverchon, E.; Guerra, G.; Venditto, V. Regeneration of nanoporous crystalline syndiotactic polystyrene by supercritical CO2. J. Appl. Polym. Sci. 1999, 74, 2077–2082. [Google Scholar] [CrossRef]
Figure 1.
SEM image of sPS related to untreated fibers.
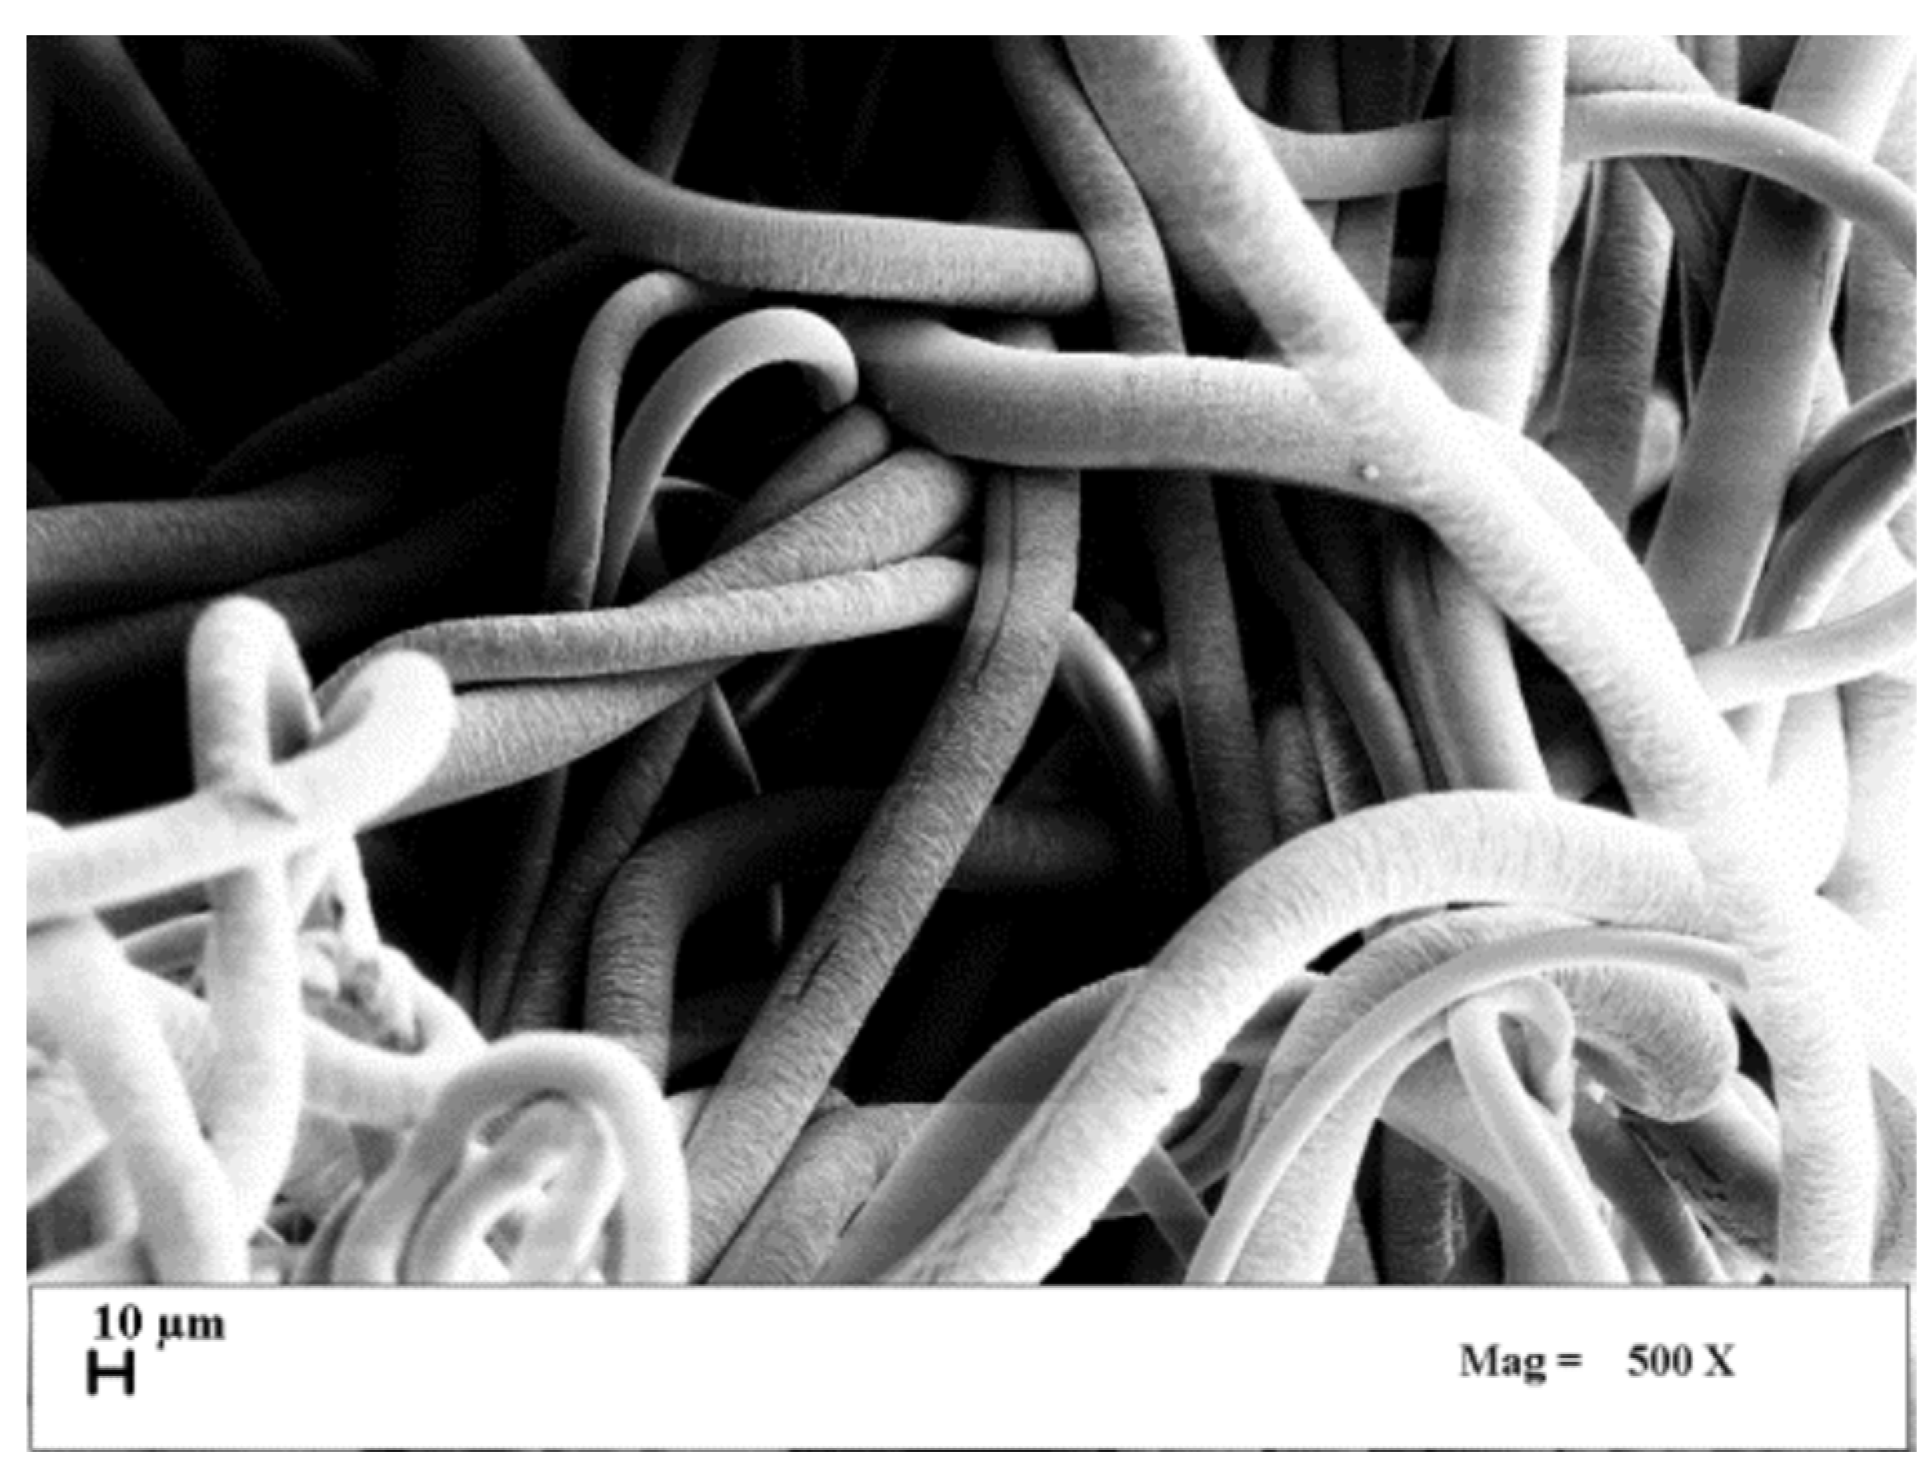
Figure 2.
SEM image of sPS related to activated fibers in the δ form.

Figure 3.
Summary of the adsorption kinetics of TCE from the aqueous solution varying the initial contaminant concentration: 10 ppm, 5 ppm, and 2.5 ppm, using 200 mg of δ-sPS fibers.
Figure 3.
Summary of the adsorption kinetics of TCE from the aqueous solution varying the initial contaminant concentration: 10 ppm, 5 ppm, and 2.5 ppm, using 200 mg of δ-sPS fibers.
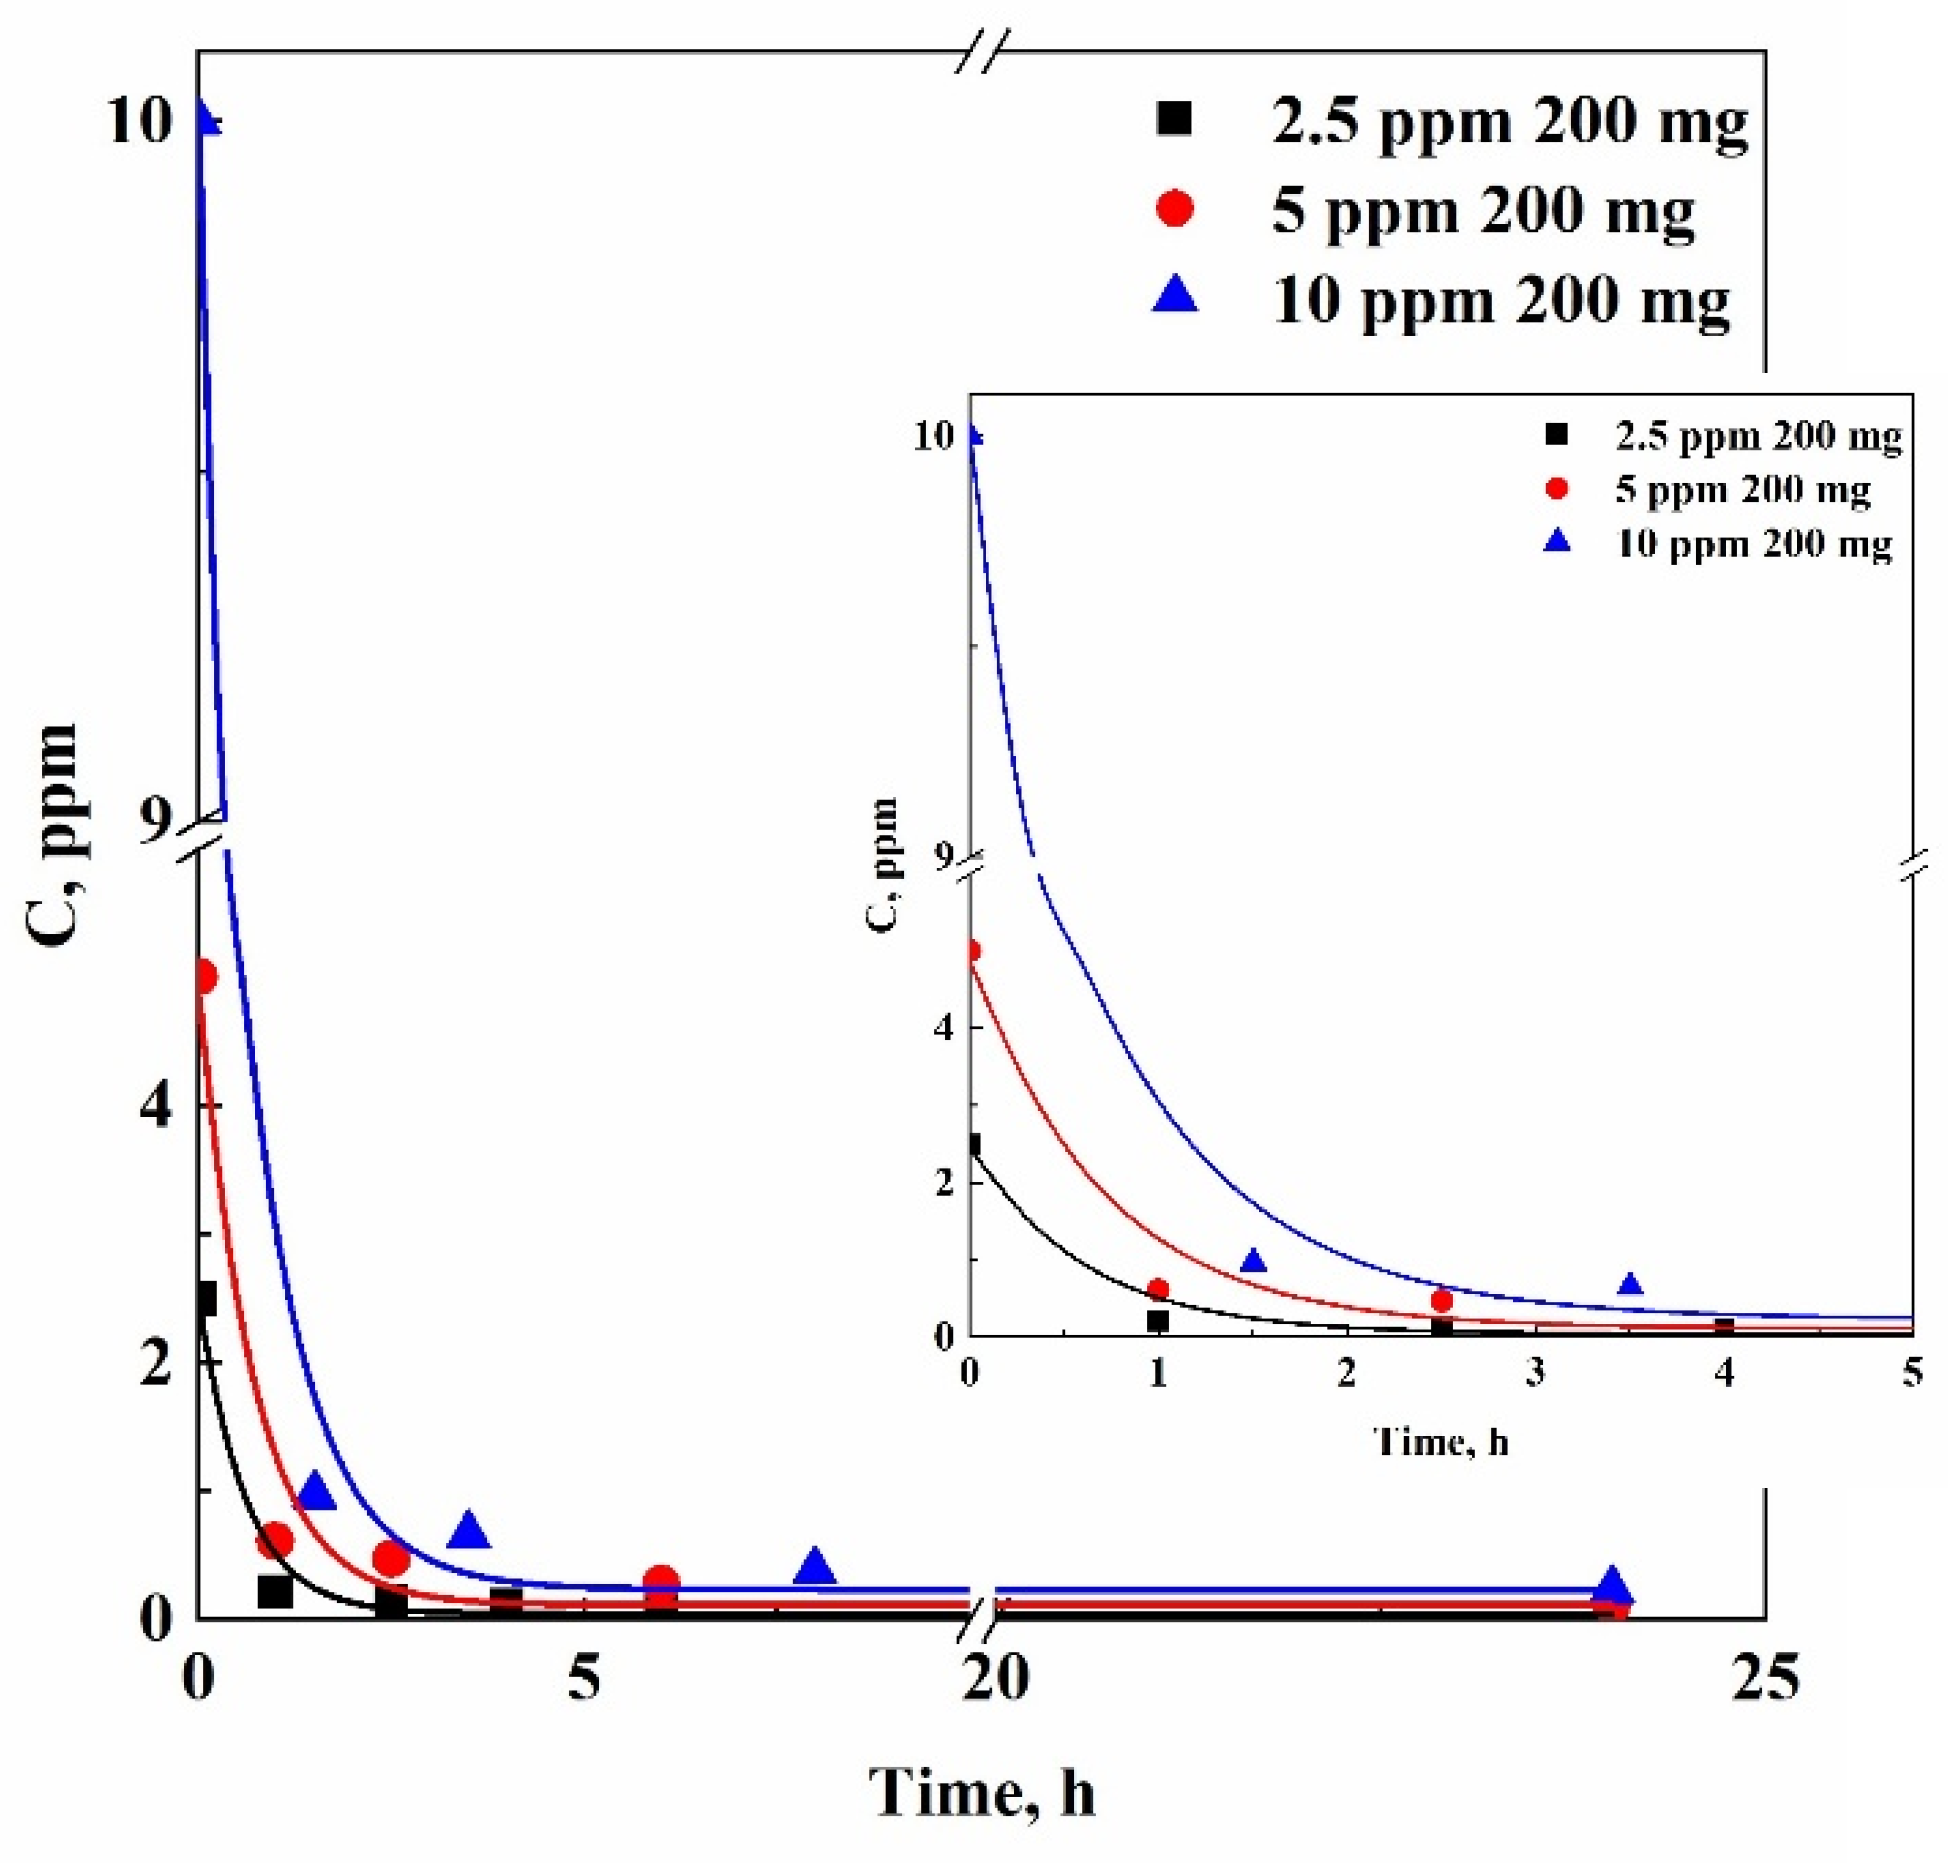
Figure 4.
Summary of the adsorption kinetics of TCE from the aqueous solution at a starting contaminant concentration of 2.5 ppm, varying the mass of the δ-sPS fibers: 200 mg, 300 mg and 400 mg.
Figure 4.
Summary of the adsorption kinetics of TCE from the aqueous solution at a starting contaminant concentration of 2.5 ppm, varying the mass of the δ-sPS fibers: 200 mg, 300 mg and 400 mg.
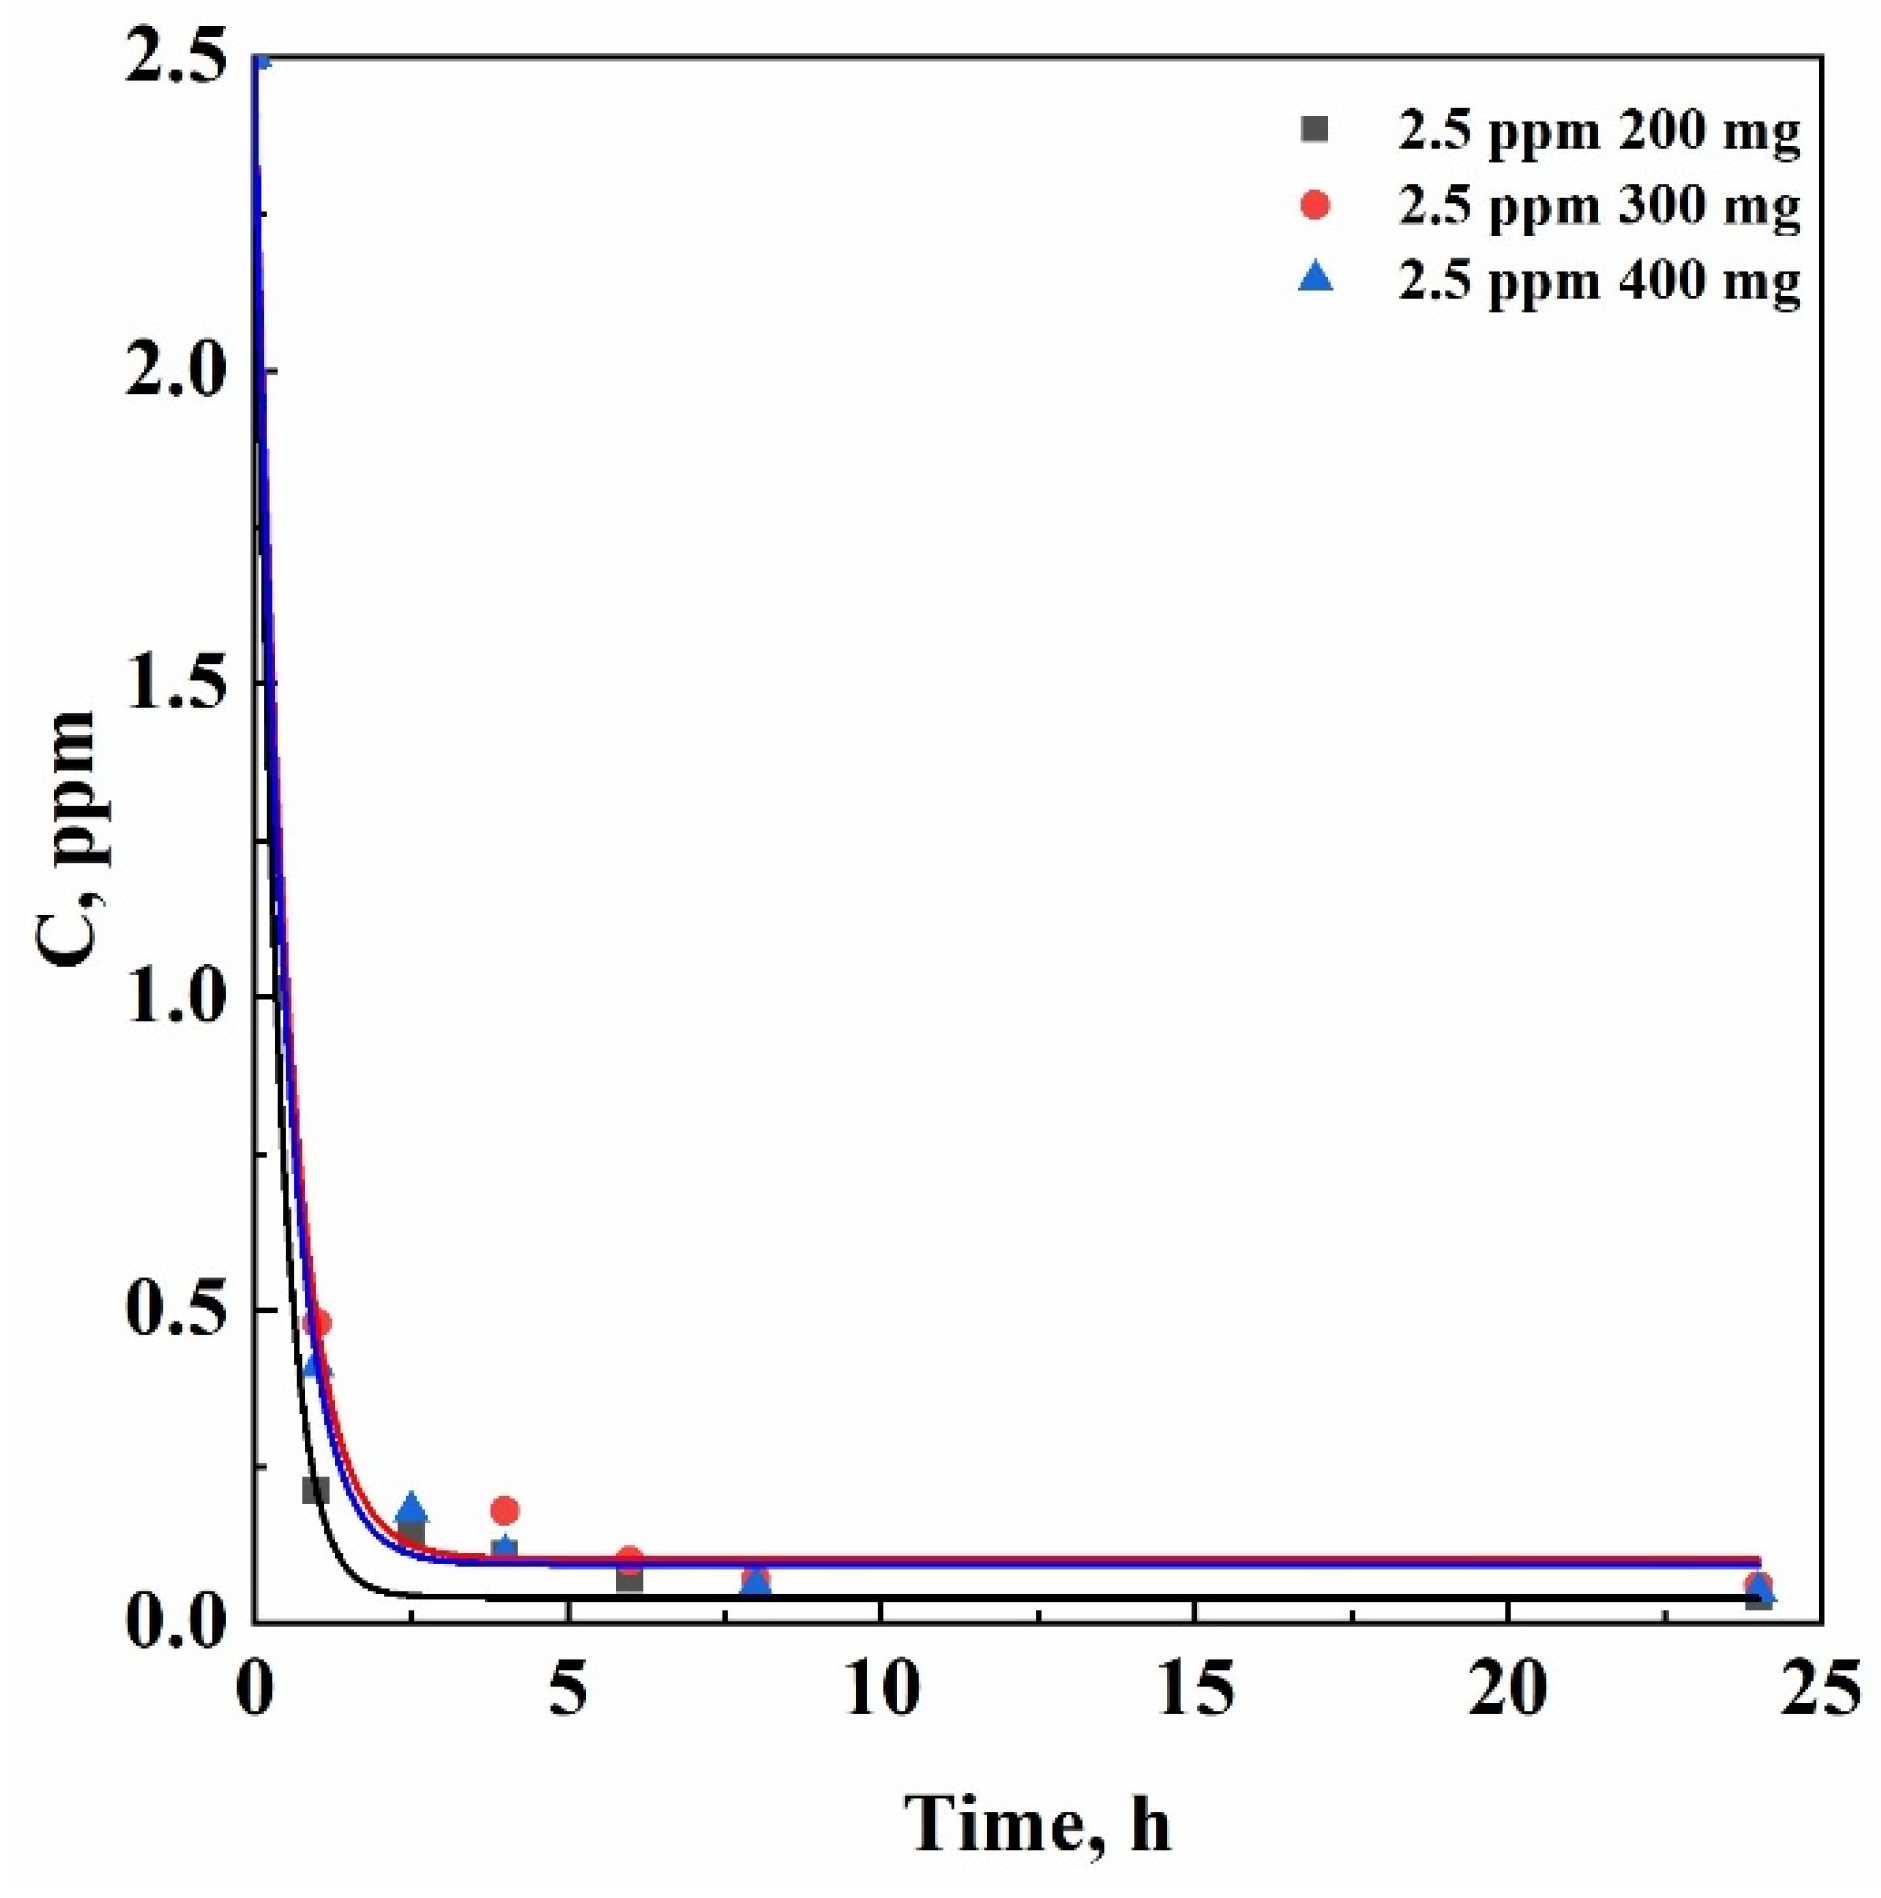

Table 1.
Results obtained for aqueous solutions having a starting TCE concentration equal to 10, 5, and 2.5 ppm, using 200 mg of δ-sPS fibers.
Table 1.
Results obtained for aqueous solutions having a starting TCE concentration equal to 10, 5, and 2.5 ppm, using 200 mg of δ-sPS fibers.
| Adsorption duration, h | TCE concentration, ppm |
|---|---|
| 0 | 10 |
| 1.5 3.5 8 24 |
0.97 0.66 0.38 0.23 |
| 0 | 5 |
| 1 2.5 6 24 |
0.61 0.47 0.27 0.11 |
| 0 | 2.50 |
| 1 2.5 4 6 24 |
0.21 0.14 0.11 0.07 0.04 |
Table 2.
Results obtained for aqueous solutions having a starting TCE concentration equal to 2.5 ppm, using 300 and 400 mg of δ-sPS fibers.
Table 2.
Results obtained for aqueous solutions having a starting TCE concentration equal to 2.5 ppm, using 300 and 400 mg of δ-sPS fibers.
| Adsorption duration, h | TCE concentration, ppm |
|---|---|
| 0 | 2.50 |
| 1 4 6 8 24 |
0.48 0.18 0.10 0.07 0.06 |
| 0 | 2.50 |
| 1 2.5 4 8 24 |
0.41 0.18 0.11 0.06 0.05 |
Table 3.
Two steps adsorption tests using 200 and 300 mg δ-sPS fibers in contact with 2.5 and 10 ppm TCE aqueous solutions.
Table 3.
Two steps adsorption tests using 200 and 300 mg δ-sPS fibers in contact with 2.5 and 10 ppm TCE aqueous solutions.
|
I adsorption step: TCE concentration, ppm |
δ-sPS fibers mass, mg |
Adsorption duration, h |
TCE residual concentration, ppm |
| 2.50 10 |
300 | 24 | 0.05 |
| 200 | 24 | 0.23 | |
|
II adsorption step: TCE concentration, ppm |
δ-sPS fibers mass, mg |
Adsorption duration, h |
TCE residual concentration, ppm |
| 0.05 0.23 |
300 | 67 | 0.008 |
| 200 | 61 | 0.020 |
Disclaimer/Publisher’s Note: The statements, opinions and data contained in all publications are solely those of the individual author(s) and contributor(s) and not of MDPI and/or the editor(s). MDPI and/or the editor(s) disclaim responsibility for any injury to people or property resulting from any ideas, methods, instructions or products referred to in the content. |
© 2025 by the authors. Licensee MDPI, Basel, Switzerland. This article is an open access article distributed under the terms and conditions of the Creative Commons Attribution (CC BY) license (http://creativecommons.org/licenses/by/4.0/).
Copyright: This open access article is published under a Creative Commons CC BY 4.0 license, which permit the free download, distribution, and reuse, provided that the author and preprint are cited in any reuse.


