
Submitted:
02 December 2025
Posted:
04 December 2025
You are already at the latest version
Abstract
This study investigates the behaviour of Compressed Earth Cylinders (CECs) and Compressed Earth Blocks (CEBs) during direct compression tests and examines the influence of aspect ratio and the effects of platen restraint. The experimental investigation utilises two soil types and examines the impact of jute fibre reinforcement on the failure mechanism of CECs with aspect ratios ranging from 0.50 to 2.00. Through experimental analysis and numerical modelling, the effects of platen restraint are examined, and a novel hypothesis of intersecting cones is presented. The results show that specimens with a lower aspect ratio exhibited higher compressive strength due to confinement caused by platen restraint. Moreover, this research has derived new aspect ratio correction factors which enable conversion from Apparent Compressive Strength (ACS) to Unconfined Compressive Strength (UCS) of unstabilised and fibre-reinforced CECs. A theoretical relationship between CECs and CEBs was also determined, with an accuracy of 2.7 %. The outcome of this research recommends a standard approach to the application of aspect ratio correction factors when interpreting and reporting the compressive strength of CECs and CEBs.

Keywords:
natural fibre reinforced compressed earth composites
; aspect ratio correction factors
; platen restraint
; hypothesis of intersecting cones
; numerical modelling
; influence of jute fibre reinforcement
1. Introduction
As a result of the growing demand for affordable and eco-friendly building materials [1], earth construction is increasingly becoming the subject of research and development, with a particular focus on Compressed Earth Cylinders (CECs) [2,3,4,5,6,7,8,9,10] and Compressed Earth Blocks (CEBs) [11,12,13,14,15,16,17,18]. Several previous experimental investigations on compressed earth have highlighted the necessity for standard production and testing techniques to guarantee that performance can be assessed and reported consistently and reliably [19,20,21]. To date, the absence of internationally recognised standard production and test methods, as well as limited scientific understanding, has caused inconsistencies in the measurement and reporting of engineering properties, such as compressive strength. Add knowledge gap here.
1.1. Existing Test Methods and the Importance of Aspect Ratio
For most load-bearing construction materials, the measure of compressive strength serves as a fundamental indicator of quality and performance. To determine the compressive strength of a specimen, three main laboratory test methods are used in existing literature, as illustrated in Figure 1. These include the direct compression test, the International Union of Laboratories and Experts in Construction Materials, Systems and Structures (RILEM) methodology suggested by the RILEM Technical Committee 164 [22], and indirect tests which rely on known empirical relationships, such as the 3-point bending test [23]. Within existing literature, the direct compression test is by far the most common method of determining the compressive strength of a CEB or CEC [11,12,13,14,15,16,17,18,24].
Numerous parameters are known to influence the compressive strength of CECs and CEBs, including the material composition, curing conditions, moisture content, dry density, and the compaction effort applied during manufacture [25,26,27,28]. However, if all of the aforementioned properties are identical, the compressive strength of a CEC or a CEB is influenced by its geometry, size and aspect ratio [5,19,29,30]. Aspect ratio is a geometric characteristic defined by the height of a test specimen divided by its smallest lateral dimension [31]. During a direct compression test, the strength of a specimen will be influenced by its aspect ratio due to the phenomena of platen restraint, also known as platen confinement [30,32,33,34].
When conducting a direct compression test, the specimen is subjected to loading in the same direction that would be experienced within a wall. As the load is applied, the specimen will experience lateral expansion as a consequence of the Poisson’s ratio effect [19]. The friction generated between the surfaces of the test sample and the platens of the test machine will restrain and limit lateral expansion near the ends of the test specimen, creating a conical or pyramidal confined zone as illustrated in Figure 2. The limitation of lateral expansion causes shear stresses within the sample which, when acting in combination with the uniaxial compression, results in a delay to the failure and gives the impression of an enhanced compressive strength [3,35]. This is also known as the Apparent Compressive Strength (ACS). The influence of platen restraint is directly related to the aspect ratio of a test specimen, whereby samples with a lower aspect ratio yield a higher ACS [3,36].
Within existing literature, several studies [36,37,38,39,40,41,42,43,44,45] have investigated the influence of platen restraint on the performance of concrete test specimens. During experimental analysis, the effect of confinement is commonly observed through the presence of conical or pyramidal crack patterns. In specimens tested to failure, relatively undamaged cones or pyramids in the centre of test samples are frequently reported [46]. The undamaged cones or pyramids make it possible to visualise the internal fractures and failure plane within a test sample. When testing concrete cylinders, the height of the undamaged cone is considered to be ½d√3 (where d is the lateral dimension of the specimen) [47]. As a result, the failure plane is commonly considered to be at an angle of 60 o from the horizontal.
Unconfined Compressive Strength (UCS) is a measure of the maximum amount of compressive stress a material can withstand when subjected to loading without any lateral support or confinement. It is an important measure of material performance [48,49,50] and a key design parameter which is applied when calculating the capacity of earth structures [51,52]. The UCS is obtained by testing samples with an aspect ratio whereby part of the sample is free from the effects of platen restraint, as illustrated in Figure 2C [53].
1.2. Effect of Aspect Ratio on Compressed Earth Blocks
Within past studies, the size and aspect ratio of CEBs vary significantly, as demonstrated in Table 1. The most common size is reported to be 295 mm (L) x 140 mm (W) x 90 mm (H), which results in an aspect ratio of 0.64 [19,27]. Although there is significant variation in the aspect ratio of test samples, the effect of platen restraint is frequently overlooked or inadequately considered when undertaking compressive strength tests, making it difficult to truly compare results from different studies. This oversight may be attributed to the absence of internationally accepted standard procedures for the production and testing of CEBs.
While there are no European Standards (EN) or British Standards (BS) to regulate the production or testing of CECs or CEBs, there is technical guidance originating from New Zealand [31,50,51,52,64,65], Australia [48,49] and India [66]. New Zealand Standard (NZS) 4298:1998 (Part A4.3) [50] provides correction factors for a wide range (0.4 to 5.0). The more recent NZS 4298:2020 (Part E2.4) [31] does cover the full range of aspect ratios in its scope, but the table of aspect ratio factors (Table E.1) only provides values for the range of 1.0 to 2.0, which excludes the majority of CEBs reported in literature (0.5 to 0.9, see Table 1). These standards outline the theoretical correlation between the characteristic compressive strength and the unconfined compressive strength of stabilised pressed bricks, as shown in Equation 1.
where:
f’e = Characteristic compressive strength (ACS) of a sample
ka = Aspect ratio correction factor
f’uc = Unconfined compressive strength (UCS) of a sample
A table of aspect ratio correction factors is published within NZS 4298:1998 [50], which allows the conversion of ACS to UCS, providing the aspect ratio is between 0.4 and 5.0. These correction factors originate from Krefeld [67] who performed research on fired clay masonry units. NZS 4298:1998 was recently withdrawn and replaced by NZS 4298:2020 [31]. The aspect ratio factors (ka) within the latest standard [31] are significantly different to its predecessor, as shown in Figure 3. The reason for this change is unknown.
The factors within the latest standard [31] only address aspect ratios ranging from 1.0 to 2.0, which does not account for most CEBs documented in the existing literature. This is a fundamental and noteworthy limitation of the latest standard. NZS 4298:2020 requires specimens to be fully cured and tested at a minimum of 28 days, which suggests the correction factors are only applicable to stabilised compressed earth. As such, there are no aspect ratio correction factors specifically for un-stabilised or fibre-reinforced CEBs, which is a significant gap in existing research.
1.3. Effect of Aspect Ratio on Compressed Earth Cylinders
It is widely recognised that the UCS of a sample is attained when testing samples with an aspect ratio greater than or equal to 2.0 [3,35,53,67,68,69,70,71,72]. Consequently, samples with an aspect ratio of 2.0 are commonly employed to evaluate the UCS of different materials, including concrete [70,71,72,73,74], rock core samples [75], soil-lime composites [76], soil-cement composites [69], and undisturbed cohesive soils [77]. Nevertheless, cylindrical samples of alternative proportions are often encountered. Existing research into the effect of platen restraint on cylindrical specimens has resulted in the publication of different aspect ratio correct factors for different materials, as detailed in Table 2. However, there are no aspect ratio correction factors for un-stabilised or fibre-reinforced CECs, which is a significant gap in existing research.
A recent study by the authors investigated the influence of aspect ratio on the compressive strength of un-stabilised compressed earth cylinders [3]. The results of the study found that small-scale un-stabilised CECs with an aspect ratio of 2.0 could be used to determine the UCS of the material, and small-scale CECs with an aspect ratio between 0.50 and 0.75 could be used to predict the compressive strength of CEBs with an aspect ratio of 0.67. The findings indicated that aspect ratio correction factors may depend on several parameters including soil constituents, dry density and relative strength. As a consequence, the application of generic correction factors should be used with caution. The conclusion of the previous study highlighted the need for further investigation into aspect ratio correction factors for fibre-reinforced compressed earth mixes.
1.4. Knowledge Gap
After examining the current aspect ratio correction factors within existing literature, several significant gaps in knowledge were identified, including:
- Current aspect ratio correction factors published within NZS 4298:2020 [31] only address aspect ratios ranging from 1.0 – 2.0, which does not account for the majority of compressed earth blocks documented in the existing literature, which appear to be between 0.5 – 0.9.
- Unlike other building materials, there are no aspect ratio correction factors for un-stabilised or fibre-reinforced compressed earth cylinders.
- Blocks and cylinders have been used in the existing literature to assess the mechanical properties of compressed earth composites. However, the relationship between blocks and cylinders remains ambiguous.
In recent years, there has been an increased focus on the use of natural fibre reinforcement within compressed earth to enhance mechanical properties and reduce the reliance on chemical stabilisers, such as Portland Cement [4,7,56,78,79,80]. The motivation to reduce or eliminate the use of chemical stabilisers is driven by the need to develop a truly environmentally friendly, sustainable and affordable building material. For this reason, a standardised approach to manufacturing and testing un-stabilised and fibre-reinforced compressed earth composites is essential. To achieve this, the development of specific aspect ratio correction factors for un-stabilised and fibre-reinforced compressed earth composites is required.
The purpose of this study is to develop knowledge and understanding of the influence of aspect ratio on the compressive strength of un-stabilised and fibre-reinforced CECs. The study aims to provide novel aspect ratio correction factors to enable conversion from Apparent Compressive Strength (ACS) to Unconfined Compressive Strength (UCS) of CECs. It also seeks to develop a theoretical relationship to estimate the compressive strength of CEBs. The outcome of this research encourages a standard approach to the application of aspect ratio correction factors when interpreting and reporting the compressive strength of CECs and CEBs.
2. Materials and Methods
2.1. Preparation and Classification of Materials
2.1.1. Soil Properties
In this experimental investigation, two soil types were utilised. Soil A was a combination of Kent Brick Earth (KBE) sourced from Kent (southeast of England, UK), with the addition of 20% (by weight) washed marine dredged sand with a non-uniform particle size. Soil B was a subsoil, obtained from Hampshire (south of England), that complied with the requirements of BS 8601:2013 [81].
A sieve analysis was carried out following the requirements of BS1377-2:2022, Part 10 [82] to determine the particle size distribution of each soil. Additional analysis of the fine fractions, i.e., the clay and silt content, was performed using a laser diffraction particle size analyser [83]. Other material properties were determined, as per BS1377-2:2022 [82], including Maximum Dry Density (MDD), Optimum Moisture Content (OMC), Liquid Limit (LL) and Plastic Limit (PL). The soils were classified as per the Unified Soil Classification System (USCS) [25]. Soil A and Soil B demonstrated significantly different properties, as shown in Table 3, with the most notable differences in the MDD and the PSD. Soil B demonstrated a high sand content, which exceeded the recommended limit for compressed earth mix designs [84], however, the relatively high clay content provided sufficient adhesion during the manufacture of test samples.
2.1.2. Fibre Properties
Jute was utilised as the natural fibre reinforcement due to its affordability [85], widespread availability [86], high tensile strength, and low density [74,87,88,89]. The mechanical properties of jute can differ, depending on the species of jute, the age of the plant, the location and conditions in which it was grown, and the method in which it was processed [87]. To minimise the potential variation, one source of jute cultivated in Bangladesh was used throughout the study. The jute was sourced as natural Jute Yarn (JY), also known as twine, and was cut into set lengths of 20 mm ± 2 mm for incorporation in jute-reinforced CECs and CEBs. The mechanical properties of the JY were established during a previous experimental investigation conducted by the authors [4], as summarised in Table 4.
2.2. Manufacture of Test Specimens
2.2.1. Mix Design
Four mix designs were investigated as part of this study, as shown in Table 5. Mix designs containing Soil A (BE and FRBE) were manufactured with 13.6 % water content and mix designs containing Soil B (SS and FRSS) were manufactured with 17.5 % water content. The water content was based on the optimum moisture content of each soil type at maximum dry density, determined as per BS 1377-2:2022, Part 11.3 [82]. The maximum dry density of each soil type was used to calculate the quantity of material, also known as dosage, required for the manufacture of each specimen [30]. Jute fibre reinforcement was added to mix designs FRBE and FRSS, comprising of 20 mm ± 2 mm fibres at 0.25 % content by weight. The fibre length and fibre quantity were selected based on recommendations outlined in existing research [90,91,92]. The jute fibre was added to the mix with its natural moisture content, i.e., it was not dried or soaked before mixing, as per the recommendations of a previous study [4].
2.2.2. Production Methodology
To assess the influence of aspect ratio, a collection of CECs and CEBs were manufactured and tested, as detailed in Table 5. To provide a comparison with the cylindrical test samples, 3 CEBs were manufactured per mix design with a target aspect ratio of 0.67. This specific geometry (150 mm (L), 75 mm (W), 50 mm (H) was chosen as it represents the half-scale CEB size used in prior research by the authors, known as the UoP-HSB [4], and yields an aspect ratio (0.67) that is highly representative of the most common dimensions reported in existing literature (0.64 to 0.73, see Table 1). A total of 25 CECs were manufactured per mix design, allowing 5 replicates for each aspect ratio.
The mixing procedure for the Fibre Reinforced mixes (FRBE and FRSS) was carefully designed to ensure uniform dispersion of the 20 mm jute fibres and actively mitigate clumping. The process began by first manually dry-blending the weighed jute yarn with a portion of the KBE-sand mix for 2 minutes to achieve preliminary fibre separation. This fibre/soil pre-blend was then introduced to the wet mixture in the pan mixer. To overcome the fibres’ inherent hydrophilic tendency to aggregate, the entire composite was subjected to a prolonged mixing duration of 10 minutes until a visibly consistent mix was achieved, directly minimising fibre clumping before the compression phase.
The CECs and CEBs were manufactured following the detailed methodology previously developed by the authors at the University of Portsmouth [3,24]. Bespoke equipment was used to manufacture the compressed earth composites, as illustrated in Figure 4. During manufacture, all specimens were compressed using a universal testing machine (Zwick/Roell Z250) [93] at a constant rate of 20 mm/minute until the target specimen height was attained. This displacement-controlled method of manufacture ensured consistent sample size and final dry density but meant that the compaction pressure can be varied. The compaction pressure was monitored and recorded throughout the production of test samples.
2.2.3. Sample Drying
To simulate natural drying conditions experienced in hot countries, the samples were dried in a Genlab MINO/100 oven [94] at 30 oC. Using the protocol outlined in BS 1377-2:2022 [82], the samples were re-weighed until a constant weight was observed +/- 0.01 g, signifying that the samples had achieved hygrothermal equilibrium. The cylinders and blocks reached hygrothermal equilibrium after 4 and 6 days respectively. Before testing, samples were re-weighed and re-measured to evaluate the amount of shrinkage throughout the drying process.
2.3. Destructive Testing
Destructive testing was performed under controlled quasi-static loading conditions across both CEC and CEB samples. It is important to note that there are no current European Standards (EN) or British Standards (BS) associated with the production and testing of CECs or CEBs. While the New Zealand Standard for Materials and Workmanship For Earth Buildings [31] provides guidance for the testing of CEBs, it does not guide the testing of CECs. As a result, British Standard and Eurocodes for concrete and masonry testing were followed in this study. Several previous investigations have also adopted these test standards for testing earthen building materials [30,56,80,95,96,97].
2.3.1. Compression Test of Compressed Earth Cylinders
A universal testing machine (Zwick/Roell Z250) [93] was utilised to perform compression tests on the CEC test specimens, according to BS EN 12390-3:2019 [46]. The dimensions of the test samples, including size and aspect ratio, were different from those stated in the test standard [86]. The load was applied a t a constant rate of 0.05 MPa/s until the sample failed, following the requirements of Section 7.2 of BS EN 12390-3:2019 [46]. This low, constant rate ensured that all compression testing was performed under quasi-static loading conditions, minimising the influence of inertial effects on the measured compressive strength. The Zwick/Roell Z250 is equipped with gauges that were used to measure and record the load and deformation. The failure load was recorded and the maximum compressed strength was determined following Section 8 of BS EN 12390-3:2019 [46].
2.3.2. Compression Test of Compressed Earth Blocks
A universal testing machine (Zwick/Roell Z250) [93] was utilised to perform compression tests on the CEB test specimens, according to BS EN 772-1 [98]. As in the CEC tests, this rate maintains quasi-static loading conditions to ensure accurate determination of the maximum compressive stress. To achieve even loading, 10 mm steel plates were placed on both the top and bottom of the test sample. The load was applied at a constant rate of 0.05 MPa/s until the sample failed, following the requirements of Table 2 in BS EN 772-1 [98]. The Zwick/Roell Z250 is equipped with gauges that were used to measure and record the load and deformation. The failure load was recorded and the maximum compressive stress was determined following Section 9 of BS EN 772-1 [98].
2.4. Numerical Modelling
Finite Element Analysis (FEA) software, ANSYS Workbench 2024R1 [99], was used to examine the stress concentrations within the cylindrical test samples and provide a comparison with the results obtained from the experimental analysis.
The models were created to replicate the size and aspect ratio of the cylindrical specimens tested in the experimental analysis and the geometry was created using ANSYS SpaceClaim 3D [100]. The platens of the test machine were modelled to simulate the influence of platen restraint. The contact between the platens and the CEC was modelled as a frictional contact with a coefficient of friction of 0.2, as recommended in an existing study [101]. The loading rate was modelled to replicate the conditions experienced during testing, as detailed in Section 2.3. The analysis settings were assigned in the static structural analysis system.
The material properties were informed directly by the average experimental stress/strain relationship for each mix, as per the example in Figure 5. This data was tabulated and inputted into a Solid65 element command created by the authors [30]. The Solid65 element, selected due to its proven success in modelling masonry and concrete failure [30,102,103,104,105,106,107]. Where possible, the results obtained from the experimental analysis were used to inform the material properties. H owever, the value of Poisson’s ratio (0.2) was obtained from existing literature [102,108,109,110,111].
The analysis settings were assigned in the static structural analysis system. Loading was applied incrementally to track the full non-linear behaviour up to failure. Convergence was controlled using the Newton-Raphson method, with a Tolerance Limit for Force Convergence set to 0.005 to ensure stability and accuracy throughout the descent phase of the stress-strain curve. A mesh size of 5.0 mm by 5.0 mm was utilised, which was determined following a thorough sequence of sensitivity analysis to provide a final balance between computational time and model accuracy.
2.5. Hypothesis of Intersecting Cones
As part of this study, a theoretical relationship between the aspect ratio of a Compressed Earth Cylinder (CEC) and Apparent Compressive Strength (ACS) is proposed. The novel concept is based on an idealised hypothesis of intersecting cones, whereby the geometry of the undamaged cone and the overlap of the confined region is used to calculate the ACS of a sample, with an aspect ratio ranging from 0.5 to 2.0. This concept builds upon observations made in past studies [36,37,38,39,40,41,42,43,44,45], and provides a more rigorous approach to existing theories surrounding platen restraint and the formation of undamaged cones.
The hypothesis, illustrated in Figure 6, considers the stress developed in the middle of a cylinder (H/2) normal to the direction of loading. Area A1 represents the unconfined region within the sample, while area A2 represents the confined region where the undamaged cones intersect. These areas are calculated based on the aspect ratio of the specimen and the geometry of the undamaged cone, which is dependent on the angle of the failure plane (α). The maximum force in the unconfined zone (F1) is calculated by multiplying A1 with the Unconfined Compressed Stress (UCS) of the sample. The maximum force in the confined zone (F2) is calculated by multiplying A2 with the UCS which is modified by a coefficient of confinement (k). The sum of the F1 and F2 is then divided by the area of the sample, which provides the ACS of a sample. The hypothesis of intersecting cones is presented in Equations 2.0 to 2.5.
| , | (2) | |
|
, |
(2.1) | |
| , | (2.2) | |
| , | (2.3) | |
| , | (2.4) | |
|
, (2.5) NOTE: |
(2.5) | |
| where: | ||
| = Unconfined Compressive Stress (MPa) | ||
| k = | Coefficient of Confinement, where: | |
| • BE & SS: k = 6.5 | ||
| • FRBE & FRSS: k = 12.0 | ||
| A = | Surface Area, (mm2) | |
| H = | Height of Cylinder (mm) | |
| r = | Radius of Cylinder (mm) | |
| α = | Angle of the Failure Plane (o), where: | |
| • BE & SS: α = 11 × AR + 42.25 (See Figure 10C for Derivation) | ||
| • FRBE & FRSS: α = 13.595 × AR + 37.416 (See Figure 10C for Derivation) | ||
| AR = | Aspect Ratio (Height / Diameter) of a Cylindrical Specimen | |
The angle of the failure plane (α) was measured during experimental analysis. Once the unreinforced BE and SS cylinders had been tested, damaged material fell away from the specimen, revealing the relatively undamaged cone within the centre of the samples. The fractured specimens were photographed and examined to determine the geometry of the undamaged cones and the angle of the failure plane.
Once the reinforced FRBE and FRSS cylinders had been tested, the samples remained intact due to the presence of fibre reinforcement. Because of this, Computed Tomography (CT) scans were performed using an XT H 225 CT Scanner [112] to enable non-destructive visualisation of the internal crack formations and measurement of failure planes (α) within the cylindrical samples. Scans were performed at 120 kV, using a 1 mm copper filter and a Molybdenum target metal. 3,600 images were taken per scan. A total of 5 scans were performed for each mix design (1 scan per aspect ratio). The values of α are presented in Figure 10C.
3. Results
3.1. Compressed Earth Cylinders
3.1.1. Properties of Compressed Earth Cylinders
Due to the importance of controlling the aspect ratio, the dimensions of the specimens were checked and recorded throughout the manufacture of the CECs. Once dried, the samples remained with ± 1.5 % of the target aspect ratio, as presented in Table 6. This level of accuracy was achieved by displacement-controlled compaction (also known as variable peak stress-constant stroke compaction), as opposed to force-controlled (also known as constant peak stress-variable stroke compaction) [113]. The average dry density closely resembled the maximum dry density of each soil type, as shown in Table 3 and Table 6. This was achieved through accurate measurement of material dosage and method of production. Samples that contained fibre reinforcement demonstrated a lower dry density compared to those without. This is due to the relatively low-density fibre occupying volume within the sample that would have otherwise been filled with the relatively high-density soil. This observation is consistent with existing literature [4,56,97,114].
The incorporation of natural fibre reinforcement in compressed earth is known to reduce linear shrinkage [26,56] due to the interlocking behaviour of the fibre, which holds the soil particles together and resists deformation during the drying process. On average, BE and FRBE specimens exhibited 0.41 % and 0.27 % linear shrinkage, while SS and FRSS exhibited 0.78 % and 0.42 % respectively. It was found that specimens containing Kent Brick Earth demonstrated less shrinkage compared to those containing BS8601 Subsoil, which is due to the different quantities and characteristics of the clay minerals within each soil type. The incorporation of JY into FRSS and FRBE samples reduced the amount of shrinkage by 53 % and 65 % respectively, demonstrating the effectiveness of jute fibre in reducing linear shrinkage.
The displacement-controlled compaction method produces specimens with consistent final dry density, which is essential for comparable mechanical testing. This consistency is achieved despite the variation in the compaction pressure required during the process, as the method prioritizes the final dry density over constant pressure. A positive linear relationship between compaction pressure and aspect ratio was observed, as presented in Figure 7. As the aspect ratio increases, the volume of material being compacted per unit area also increases. Consequently, more force is needed to compress the larger volume of material, leading to greater compaction effort required to achieve samples of the same density.
Figure 7 also shows that samples containing jute reinforcement required greater compaction pressure compared to those without. It is likely that, during static compaction, the presence of fibres resists and encumbers the densification of soil particles, which consequently requires greater compaction effort to achieve samples of equivalent density. Furthermore, due to the hydrophilic nature of JY [87,115,116], dry fibres may absorb water when added to the wet mix, reducing the overall free water content of the soil. A reduction in the moisture content is known to increase the compaction effort required due to the increased friction and lack of lubrication between soil particles [113].
3.1.2. Aspect Ratio vs Compressive Strength
The results of the compressive strength tests are presented in Figure 8. As shown, specimens containing Soil A (Kent Brick Earth) exhibited a greater compressive strength compared to those containing Soil B (BS8601 Subsoil). This difference can be attributed to several factors, including the distinct soil constituents and the variation of the sand, silt and clay content. The particle size distribution of Soil A closely adhered to the recommended limits [84], whereas Soil B exhibited a greater deviation from the specified ranges and contained a high proportion of sand. Furthermore, Soil A demonstrated a higher dry density, which is known to correlate with increased compressive strength [25,26].
The test results demonstrate a clear correlation between aspect ratio and compressive strength, indicating that a lower aspect ratio results in a higher compressive strength. This evidence supports the theory that, as the aspect ratio is reduced, a greater proportion of the specimen is confined by the effects of platen restraint, which increases the resistance to compressive forces and delays failure. This finding aligns with existing studies on aspect ratio effects [5,6,19,20,29] and demonstrates the significant influence of platen restraint.
Comparing SS with FRSS and BE with FRBE, results show that the addition of jute fibre reinforcement increases the apparent compressive strength at each aspect ratio. This finding is consistent with past studies [4,56,80], which have shown that the addition of natural fibre reinforcement may increase the strength of compressive earth due to the mechanical interlock between the fibre and the soil matrix, which enhances the material's ability to transfer stress and resist crack propagation. The majority of samples containing fibre reinforcement demonstrated a large variation in compressive stress, compared to those without fibre. This may be caused by the random distribution and orientation of fibres within the sample.
The results show that, within fibre-reinforced samples, there is a disproportionately large increase in compressive strength in samples with a low aspect ratio. This may be caused by the interaction of the fibre reinforcement within the confined zone of influence, resulting in increased resistance to lateral expansion, culminating in a further delay to compressive failure. Crucially, the statistical analysis in Section 3.1.3 confirms that, for low aspect ratios, the effect of fibre addition is statistically significant, allowing its influence to be separated from the soil type in this range.
Previous research [3,26] has suggested that the relationship between aspect ratio and compressive strength follows a second-order polynomial trendline. Within this study, regression analysis was performed using Minitab 17.3.1 [117] which identified asymptotic trendlines to provide a better fit than second-order polynomials. The asymptotic regression model characterises constrained growth, where Y approaches a horizontal asymptote as X tends to infinity. The models presented in this paper, shown in Equations 3 - 6, enable the approximate calculation of ACS for a cylindrical sample with an aspect ratio between 0.5 - 2.0. While interpolation between data points is permitted, extrapolation beyond the dataset should be avoided.
During compression testing of the BE and SS samples, conical fractures were observed on the surfaces of the specimens. As the test continued and reached peak stress, damaged material fell away from the specimen, revealing a relatively undamaged cone within the centre of the samples, as shown in Figure 9. Once the unreinforced BE and SS cylinders had been tested, the fractured specimens were photographed and examined to determine the geometry of the undamaged cones and the angle of the failure plane (α). In BE-2.00 and SS-2.00 specimens, the failure plane was found to be approximately 65 o from the horizontal. It was found that samples with a lower aspect ratio exhibited a lower angle, as presented in Figure 10C.
During compression testing of the FRBE and FRSS samples, similar conical fractures were observed on the surfaces of the specimens. However, due to the presence of fibre reinforcement, the samples remained intact once the peak stress had been reached. Generally, the samples containing fibre reinforcement exhibited ductile failure and demonstrated residual strength once the peak stress had been surpassed. This behaviour has been documented in previous studies [4,56,118,119] regarding fibre-reinforced compressed earth. Upon loading the test specimens, it was possible to see the influence of the fibres bridging the gaps between the cracks and voids. Similar observations have been reported in existing literature [7,120,121].
Computed Tomography (CT) scans were performed to visualise the internal crack formations and measure the angle of the failure plane (α) within the fibre-reinforced samples, as shown in Figure 10A. At aspect ratios 2.00 and 1.50, the reinforced specimens (FRBE & FRSS) demonstrated similar failure planes to the unreinforced specimens (BE & SS). However, the reinforced specimens with a low aspect ratio (1.00, 0.75 and 0.50) exhibited a progressively lower angle of failure compared to the unreinforced specimens, as shown in Figure 10C. For both the unreinforced and reinforced specimens, the relationship between the angle of the failure plane (α) and the aspect ratio was found to be linear with a high coefficient of determination (R2); however, the reinforced specimens exhibited a steeper positive gradient. This finding demonstrates the addition of fibre reinforcement influences the angle at which the failure plane develops, which is likely due to the increased resistance to lateral deformation caused by the fibre's ability to transfer stress and resist crack propagation. In samples with a low aspect ratio, the effects of confinement caused by platen restraint are compounded by the influence of fibre reinforcement, resulting in a disproportionately large increase in apparent compressive strength.
Existing research into concrete [47] suggests that the undamaged cone forms at a constant height of ½d√3 (where d is the lateral dimension of the specimen). This implies that the angle of the failure plane (α) is at 60 ° from the horizontal, regardless of the specimen’s aspect ratio. However, the findings from this study demonstrate that, in compressed earth composites, the angle of the failure plane changes depending on the aspect ratio of the specimen, which is an important finding.
Finite Element Analysis (FEA) was also used to model the cylindrical test specimens and examine the internal stress concentrations. The maximum stress and strain derived from the numerical modelling provided satisfactory correspondence with the results obtained from the experimental analysis. Furthermore, the internal stress concentrations observed in the modelling align with the failure planes observed in CT scans, as presented in Figure 10B. This demonstrates that a frictional contact condition can be used within FEA software to replicate the influence of platen restraint.
Figure 10.
Computed Tomography Scans showing Internal Fractures (A), Finite Element Analysis showing Stress Concentrations at Maximum Principal Stress (B), and Angle of Failure Plane vs Aspect Ratio (C).
Figure 10.
Computed Tomography Scans showing Internal Fractures (A), Finite Element Analysis showing Stress Concentrations at Maximum Principal Stress (B), and Angle of Failure Plane vs Aspect Ratio (C).
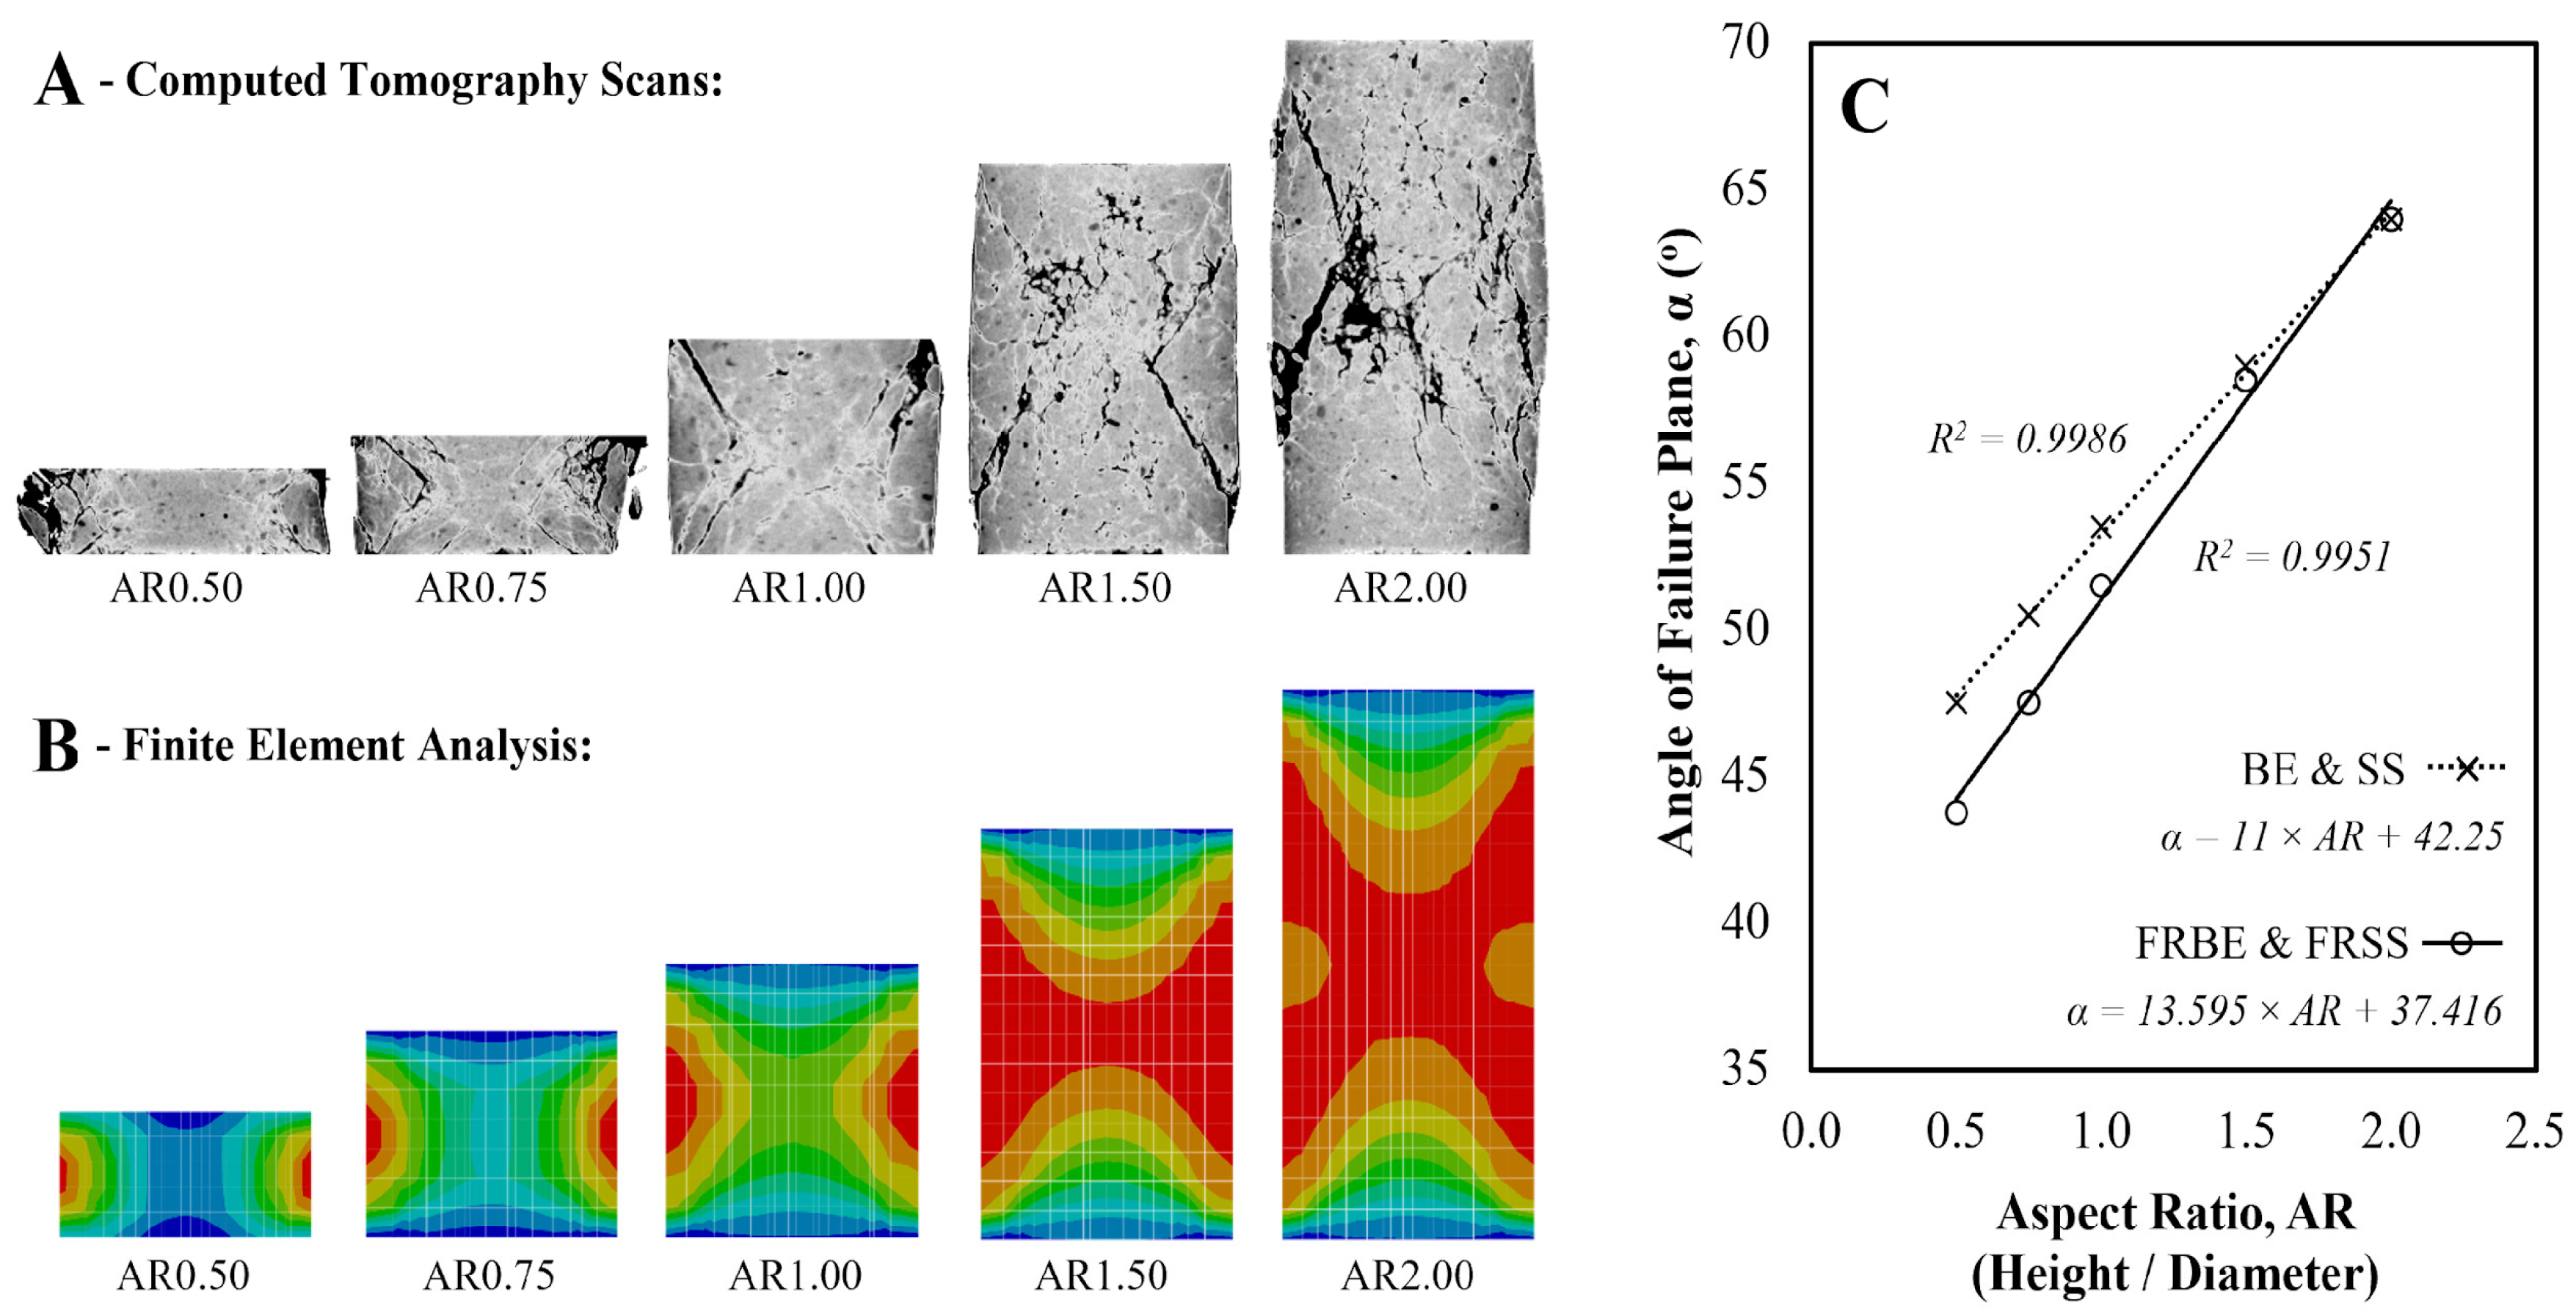
The equations presented in Figure 10C enable the angle of the failure plane (α) to be calculated for any given aspect ratio between 0.50 and 2.00. These equations were incorporated into the hypothesis of intersecting cones presented in Section 2.5 (Equations 2.0 to 2.5) to predict the ACS of the compressed earth cylinders. The coefficients of confinement (k) were determined through an iterative sequence of curve fitting and were found to be 6.5 for BE & SS samples and 12.0 for FRBE and FRSS samples. The theory of intersecting cones provided a strong correlation with the results obtained from experimental analysis, as presented in Figure 11.
In Figure 12, the results obtained from the experimental analysis are compared with the predicted values obtained from the asymptotic regression models (Figure 12A) and the hypothesis of intersecting cones (Figure 12B). The findings show that the models are similar and both exhibit a strong correlation with the experimental results. The asymptotic regression models show a slight improvement in the coefficient of determination (R2 = 0.9993), highlighting this as the most accurate method. Nevertheless, the hypothesis of intersecting cones also demonstrates a strong correlation with the experimental results (R2 = 0.9969), which validates the proposed hypothesis. The aspect ratio correction factors derived in the following section are based on the asymptotic regression models due to their increased accuracy and simplicity over the hypothesis of intersecting cones.
3.1.3. Aspect Ratio Correction Factors
It is widely recognised that the UCS of a cylindrical sample is obtained when testing specimens with an a spect ratio greater than or equal to 2.0 [3,35,67,68,69,70,71,72]. Therefore, the results presented in Figure 8 can be normalised to obtain aspect ratio correction factors (ka) by dividing the UCS by the ACS of each mix design, as shown in Equation 7.
where:
Unconfined Compressive Strength: The mean compressive strength of CEC at aspect ratio = 2.00
Apparent Compressive Strength: The mean compressive strength of CEC at aspect ratio < 2.00
Using Equation 7, all of the results were converted to correction factors and presented in Figure 13. Statistical analysis (ANOVA with Tukey pairwise comparison) was performed using Minitab 17.3.1 [117] to assess the statistical significance of the correction factors. This test was specifically employed to separate the potential confounding influences of the soil type and the fibre reinforcement. The mix design (BE, SS, FRBE & FRSS) was considered as the independent variable to determine if the soil constituents and/or fibre reinforcement influenced the correction factors. The results of the statistical analysis are presented in Table 7, whereby there are two categories of statistical significance (A and B). Results that are in the same category, i.e., share the same letter, are not significantly different at p-value < 0.05 (5%). The results of the statistical analysis for each aspect ratio should be interpreted independently.
As presented in Table 7, there was no statistically significant difference between SS and BE or FRSS and FRBE samples. This indicates that, in terms of the aspect ratio correction factors, soil type does not significantly confound the results. Conversely, the addition of fibre reinforcement did result in statistically significant differences at low aspect ratios (0.50, 0.75 and 1.00), confirming the fibre's distinct influence within the confined zone. This may be due to the interaction between the fibre reinforcement and the confined zone, as discussed in section 3.1.2. Further it is important to note that the finding presented in this study are based on two different soil types (A and B, see Table 3). Due to inherited variability of the regional and local soils results may different and therefore additional testing should be conducted to support broader applications.
Figure 13 shows the aspect ratio correction factors determined in this study, which are represented by asymptotic trendlines to illustrate the best fit. Following the results of the statistical analysis, the BE and SS datasets were combined and the FRBE and FRSS datasets were combined to generate an average asymptotic trendline for each. Figure 13A presents the combined trendline “SS and BE Average” which may be considered as the correction factor for un-stabilised CECs. Figure 13B presents the combined trendline “FRSS and FRBE Average” which may be considered as the correction factor for fibre-reinforced CECs. Figure 13C shows a comparison of the aspect ratio correction factors determined in this study with aspect ratio correction factors obtained from existing literature for different materials [31,50,68,70,72]. The correction factors determined in this study are within the region bounded by existing literature for rammed earth [68] and concrete cylinders [72].
The correction factors outlined in Figure 13 are of significant importance, as they provide a detailed understanding of the influence of platen restraint on un-reinforced and fibre-reinforced compressed earth cylinders. Furthermore, the correction factors outlined in Equations 8 and 9 enable the conversion between ACS and UCS for cylindrical samples with an aspect ratio ranging from 0.5 – 2.0.
The Root Mean Square Error (RMSE) is calculated using the following general formula, which measures the average magnitude of the errors between the predicted values (:) and the observed values (:).
where:
= Root Mean Square Error.
= The total number of data points used in the fitting process.
= The actual or observed value of the Correction Factor () for a specific Aspect Ratio ().
= The predicted value of the Correction Factor () for the same Aspect Ratio (), calculated using the fitted equation (SS & BE Average equation).
SS & BE Average Fit, using equation (8)
FRSS & FRBE Average Fit, using equation (9)
The RMSE values of 0.0039 (SS & BE Average Fit) and 0.0038 (FRSS & FRBE Average Fit) quantify the outstanding quality of the exponential fits. These numbers are extremely small, especially when compared to the range of the Correction Factor () shown on the y-axis (from 0.2 to 1.0) in Figure 13. An RMSE value this low confirms the initial observation from that the fitted curves lie exceptionally close to the actual underlying data points. Furthermore, the accompanying Coefficient of Determination (R2 = 0.999) indicates that over 99.9 % of the variation in the correction factor is successfully explained by the Aspect Ratio model. Collectively, these statistics demonstrate that the mathematical equations provide a highly accurate and robust representation of the data.
The correction factors determined are of significant engineering importance. By allowing the conversion of Apparent Compressive Strength measured on small or non-standard specimens (e.g., AR = 0.5) to Unconfined Compressive Strength (AR = 2.0), they provide engineers with a standardised, true measure of material performance. This UCS value is a key design parameter applied when calculating the capacity and stability of earth structures. The distinction between aspect ratio correction factor for unreinforced and fibre-reinforced composites prevents overestimation of strength in design, ensuring structural safety and integrity.
3.2. Compressed Earth Blocks
3.2.1. Properties of Compressed Earth Blocks
The CEBs were manufactured using the UoP-HSB mould and followed the same displacement-controlled method of manufacture that was employed for the CECs. This ensures the specimens maintain a consistent size and density. The compaction pressure required to manufacture the samples ranged from 2.50 – 4.11 MPa, which was on average 17% less than the pressure required to manufacture a cylindrical sample of equivalent aspect ratio. This variation may be caused by differences in mould geometry, boundary effects and frictional resistance.
The aspect ratio, dry density and mean compressive failure stress for each sample are summarised in Table 8. Much like the CEC samples, CEBs produced from Soil A (Kent Brick Earth) exhibited greater compressive strength in comparison to those produced from Soil B (BS8601 Subsoil). Furthermore, the addition of jute fibre reinforcement also provided a significant increase in the apparent compressive strength. The low standard deviation of the CEB strengths, with an average Coefficient of Variation (CoV) across the four mixes of approximately 6.1 %, confirms the high reliability of the mean values presented. During compression testing, diagonal fractures were observed in the test specimens, similar to those observed in the CEC samples.
The graph presented in Figure 14 provides an enlarged depiction of the data shown in Figure 8, with a particular focus on the aspect ratio of the CEC samples ranging from 0.50 – 0.60. The mean compressive strength of each CEB is presented in Figure 14, whereby a horizontal line has been plotted to determine the point of intersection with the corresponding CEC curve.
As shown in Figure 14, the compressive strength of the CEBs corresponds with the compressive strength of the CECs at an aspect ratio of between 0.54 and 0.56, with an average of 0.546. A conversion factor of 0.861 can be determined by dividing this value by the aspect ratio of the CEBs, as presented in Equation 10. The correction factor of 0.861 is similar to the relationship between the strength of concrete cylinders with concrete cubes [35].
where:
x = Aspect Ratio of Compressed Earth Cylinder
z = Aspect Ratio of Compressed Earth Block
In contrast to an existing study [3], this finding suggests that a conversion factor is required to correlate the aspect ratio and strength of CEBs to the aspect ratio and strength of CECs. The conversion factor of 0.861 is applicable to each mix design and enables the CECs to predict the ACS of CEBs with an accuracy of 2.7 %. This discovery suggest that, based on the experimental scope of this study, the conversion factor is insensitive to the difference between the two distinct soil types (Soil A/BE and Soil B/SS) and the presence of fibre reinforcement.
It must be noted that the conversion factor of 0.861 is applicable only to the size, aspect ratio and four specific mix designs (BE, FRBE, SS and FRSS) investigated in this study. It is recommended that further tests are performed on CECs and CEBs with different aspect ratios and mix designs to validate the applicability of the conversion factors and correction factors across broader parameters. It is also recognised that the apparent compressive strength of a CEB is influenced by its geometric features, such as the existence of vertical holes, openings, frogs and interlocking design [27]. It must be noted that the aspect ratio findings in this study are based on solid CEBs and, therefore, further research is required to identify correction factors of other CEB designs. However, the correlation allows to predict the ACS of a CEB at AR approx. 0.67 from the tested strength of a small-scale CEC. This ability is crucial as it enables the use of simpler, smaller, and more cost-effective cylindrical specimens for routine testing and quality control, which drastically reduces material and production time. Furthermore, this relationship is a critical step toward developing standardised conversion factors that can simplify testing requirements for earth building materials, particularly in resource-limited settings.
4. Conclusions
The results of this investigation demonstrate the influence of aspect ratio and the effects of platen restraint on the compressive strength of un-stabilised and fibre-reinforced Compressed Earth Cylinders (CECs) and Compressed Earth Blocks (CEBs). The main findings from this study are:
- Specimens with a lower aspect ratio displayed higher compressive strength due to confinement caused by platen restraint. The addition of jute fibre reinforcement was found to increase the apparent compressive strength at each aspect ratio. In samples with a low aspect ratio, the effects of confinement caused by platen restraint are compounded by the influence of fibre reinforcement, resulting in a disproportionately large increase in apparent compressive strength.
- Novel aspect ratio correction factors are derived from the experimental data to enable the conversion between the Unconfined Compressive Strength (UCS) and Apparent Compressive Strength (ACS) of un-stabilised and fibre-reinforced CECs. This directly supports standard structural design practices by providing the true material strength necessary for the capacity calculation. Further, statistical analysis suggests that soil type may not significantly influence aspect ratio correction factors. However, the addition of fibre reinforcement was found to statistically influence the aspect ratio correction factors of samples with low aspect ratios (0.50, 0.75 and 1.00).
- Computed Tomography (CT) scans were performed to visualise the fibre distribution and internal crack formations following compression testing. The observations suggest that the aspect ratio and the addition of fibre reinforcement (an independent variable in the statistical analysis) may influence the internal crack formation and the angle at which the shear failure plane is developed, influencing the ACS of the material.
- Finite Element Analysis (FEA) was successfully used to model Compressed Earth Cylinders at different aspect ratios to examine the internal stress concentrations. Frictional contact between the test specimen and platens of the test machine was modelled using a frictional coefficient of 0.2, which was found to accurately replicate the influence of platen restraint.
- A novel method for calculating the Apparent Compressive Strength (ACS) of CECs with an aspect ratio ranging from 0.5 to 2.0 is presented, utilising an original hypothesis of intersecting cones. The predicted values demonstrate a strong correlation with the experimental results, which validates the proposed hypothesis as a viable method, but is a slightly lesser predictor than the asymptotic model.
- The relationship between CECs and CEBs was assessed, and a conversion factor of 0.861 was determined. This conversion factor enabled the CECs to predict the ACS of CEBs with an accuracy of 2.7 %. The conversion factor was applicable to each mix design, which suggests that, for the two soil types investigated, the conversion factor is insensitive to the difference between the soil types or the presence of fibre reinforcement.
It is important to note that the current findings are based on testing of only two distinct soil types. Given the inherited variability of the regional and local soils, additional testing is recommended to support broader applications.This study encourages a standard approach to the application of aspect ratio correction factors and highlights the importance of considering aspect ratio when interpreting and reporting the compressive strength of CECs and CEBs. Implementing these factors is essential for establishing a reliable basis for material classification, quality control, and the drafting of future building codes for earth construction. By providing aspect ratio correction factors for unstabilised and fibre-reinforced compressed earth composites, this research fills a gap in existing knowledge and encourages future research into compressed earth building materials with a reduced reliance on environmentally harmful chemical stabilisers, such as Portland Cement. It is recommended that further tests are performed on CECs and CEBs with different aspect ratios and mix designs to improve the accuracy and reliability of the conversion factors and correction factors outlined in this study.
The use of small-scale CEC specimens proved advantageous in this study. The test samples require less material and a shorter production time, allowing for more test samples to be manufactured and tested. Further, CECs require only basic mould such as a piece of steel pipe and a top piston presser, eliminating the need for an expensive full-scale CEB machine. It is for this reason that the use of cylindrical test samples and the application of conversion factors and correction factors may be an efficient way to undertake future investigation into the material properties and performance of CECs and CEBs. This provides a highly affordable and accessible method for material testing in regions where resource is limited, directly aiding in deployment of sustainable housing solutions.
Author Contributions
Jack Andrew Cottrell: Conceptualisation, Validation, Formal Analysis, Investigation, Writing - Original Draft. Muhammad Ali: Conceptualisation, Writing - Review & Editing, Supervision - Final Draft. D. Brett Martinson: Writing - Review & Editing, Supervision. Davide Lavorato: Writing - Review & Editing.
Funding
This research received no external funding.
Data Availability Statement
The data that support the findings of this study are available from the corresponding author upon reasonable request.
Conflicts of Interest:
The authors declare no conflict of interest.
Conflicts of Interest
The authors declare no conflict of interest.
Abbreviations
The following abbreviations are used in this manuscript:
ACS – Apparent Compressive Strength
BE – Kent Brick Earth
BFB(s) – Bast Fibre Bundle(s)
CEB(s) – Compressed Earth Block(s)
CEC(s) – Compressed Earth Cylinder(s)
CT – Computer Tomography
FRBE – Fibre Reinforced Kent Brick Earth
FRSS – Fibre Reinforced BS 8601 Subsoil
JY – Jute Yarn
KBE – Kent Brick Earth
OMC – Optimum Moisture Content
SS – BS 8601 Subsoil
UCS – Unconfined Compressive Strength
UoP-HSB - University of Portsmouth Half-Scale Block
USCS – Unified Soil Classification System
References
- Aubert, J.-E.; Faria, P.; Maillard, P.; Ouedraogo, K.A.J.; Ouellet-Plamondon, C.; Prud’homme, E.; et al. Characterization of Earth Used in Earth Construction Materials. In Testing and Characterisation of Earth-Based Building Materials and Elements; Fabbri, A., Morel, J.-C., Aubert, J.-E., Bui, Q.-B., Gallipoli, D., Reddy, B.V.V., Eds.; Springer: Cham, Switzerland, 2022; pp. 17–81. [Google Scholar] [CrossRef]
- Ouma, J.; Ongwen, N.; Ogam, E.; Auma, M.; Fellah, Z.E.A.; Mageto, M.; Ben Mansour, M.; Oduor, A. Acoustical properties of compressed earth blocks: Effect of compaction pressure, water hyacinth ash and lime. Case Stud. Constr. Mater. 2023, 18, e01828. [Google Scholar] [CrossRef]
- Cottrell, J.A.; Ali, M. Influence of Aspect Ratio on the Properties of Compressed Earth Cylinders and Compressed Earth Blocks. In 5th International Conference on Bio-Based Building Materials; Springer Science and Business Media B.V., 2023; pp. 232–248. [Google Scholar] [CrossRef]
- Cottrell, J.A.; Ali, M.; Tatari, A.; Martinson, D.B. Effects of Fibre Moisture Content on the Mechanical Properties of Jute Reinforced Compressed Earth Composites. Constr. Build. Mater. 2023, 373. [Google Scholar] [CrossRef]
- Lan, G.Q.; Wang, Y.H.; Chao, S.S. Influences of Specimen Geometry and Loading Rate on Compressive Strength of Unstabilized Compacted Earth Block. Adv. Mater. Sci. Eng. 2018, 2018, 5034256. [Google Scholar] [CrossRef]
- Silveira, D.; Varum, H.; Costa, A. Influence of the testing procedures in the mechanical characterization of adobe bricks. Constr. Build. Mater. 2013, 40, 719–728. [Google Scholar] [CrossRef]
- Ghavami, K.; Toledo Filho, R.D.; Barbosa, N.P. Behaviour of composite soil reinforced with natural fibres. Cem. Concr. Compos. 1999, 21, 39–48. [Google Scholar] [CrossRef]
- Jafari, M.; Esna-ashari, M. Effect of waste tire cord reinforcement on unconfined compressive strength of lime stabilized clayey soil under freeze-thaw condition. Cold Reg. Sci. Technol. 2012, 82, 21–29. [Google Scholar] [CrossRef]
- Bruno, A.W.; Gallipoli, D.; Perlot, C.; Mendes, J. Mechanical behaviour of hypercompacted earth for building construction. Mater. Struct./Mater. Constr. 2017, 50. [Google Scholar] [CrossRef]
- Sturm, T.; Ramos, L.F.; Lourenço, P.B. Characterization of dry-stack interlocking compressed earth blocks. Mater. Struct./Mater. Constr. 2015, 48, 3059–3074. [Google Scholar] [CrossRef]
- Zardari, M.A.; Lakho, N.A.; Amur, M.A. Structural behaviour of large size compressed earth blocks stabilized with jute fiber. J. Eng. Res. (Kuwait) 2020, 8, 60–72. [Google Scholar] [CrossRef]
- Malkanthi, S.N.; Balthazaar, N.; Perera, A.A.D.A.J. Lime stabilization for compressed stabilized earth blocks with reduced clay and silt. Case Stud. Constr. Mater. 2020, 12, e00326. [Google Scholar] [CrossRef]
- Turco, C.; Paula Junior, A.C.; Teixeira, E.R.; Mateus, R. Optimisation of Compressed Earth Blocks (CEBs) using natural origin materials: A systematic literature review. Constr. Build. Mater. 2021, 309, 125140. [Google Scholar] [CrossRef]
- Kiki, G.; Nshimiyimana, P.; Kouchadé, C.; Messan, A.; Houngan, A.; André, P. Physico–mechanical and durability performances of compressed earth blocks incorporating quackgrass straw: An alternative to fired clay. Constr. Build. Mater. 2023, 403, 133064. [Google Scholar] [CrossRef]
- Lahbabi, S.; Bouferra, R.; Saadi, L.; Khalil, A. Evaluation of the void index method on the mechanical and thermal properties of compressed earth blocks stabilized with bentonite clay. Constr. Build. Mater. 2023, 393, 132114. [Google Scholar] [CrossRef]
- Paul, S.; Islam, M.S.; Hossain, M.I. Suitability of Vetiver straw fibers in improving the engineering characteristics of compressed earth blocks. Constr. Build. Mater. 2023, 409, 134224. [Google Scholar] [CrossRef]
- Bogas, J.A.; Real, S.; Cruz, R.; Azevedo, B. Mechanical performance and shrinkage of compressed earth blocks stabilised with thermoactivated recycled cement. J. Build. Eng. 2023, 79, 107892. [Google Scholar] [CrossRef]
- Paul, S.; Islam, M.S.; Elahi, T.E. Potential of waste rice husk ash and cement in making compressed stabilized earth blocks: Strength, durability and life cycle assessment. J. Build. Eng. 2023, 73, 106727. [Google Scholar] [CrossRef]
- Morel, J.C.; Pkla, A.; Walker, P. Compressive strength testing of compressed earth blocks. Constr. Build. Mater. 2007, 21, 303–309. [Google Scholar] [CrossRef]
- Aubert, J.E.; Maillard, P.; Morel, J.C.; Al Rafii, M. Towards a simple compressive strength test for earth bricks? Mater. Struct./Mater. Constr. 2016, 49, 1641–1654. [Google Scholar] [CrossRef]
- Reddy, B.V.V.; Morel, J.-C.; Faria, P.; Fontana, P.; Oliveira, D.V.; Serclerat, I.; Walker, P.; Maillard, P. Codes and Standards on Earth Construction. In Testing and Characterisation of Earth-Based Building Materials and Elements; Springer: Cham, Switzerland, 2022; pp. 243–259. [Google Scholar] [CrossRef]
- Olivier, M.; Mesbah, A.; El Gharbi, Z.; Morel, J.C. Mode opératoire pour la réalisation d’essais de résistance sur blocs de terre comprimée. Mater. Struct. 1997, 30, 515–517. [Google Scholar] [CrossRef]
- Morel, J.; Pkla, A. A model to measure compressive strength of compressed earth blocks. Constr. Build. Mater. 2002, 16, 303–310. [Google Scholar] [CrossRef]
- Cottrell, J.A.; Ali, M.; Etienne, G. Utilisation of construction, demolition and excavation waste for the production of compressed trommel fines blocks. Constr. Build. Mater. 2024, 416, 134985. [Google Scholar] [CrossRef]
- Houben, H.; Guillaud, H. Earth Construction: A Comprehensive Guide, 1st ed.; Intermediate Technology Publications: London, UK, 1994. [Google Scholar]
- Reddy, B.V.V. Compressed Earth Block and Rammed Earth Structures, 1st ed.; Springer: Singapore, 2022. [Google Scholar] [CrossRef]
- Rigassi, V. Compressed Earth Blocks: Manual of Production; Deutsches Zentrum für Entwicklungstechnologien; Deutsche Gesellschaft für Technische Zusammenarbeit, 1985. [Google Scholar]
- Guillaud, H.; Joffroy, T.; Odul, P. Compressed Earth Blocks- Manual of Design and Construction: Volume II; Deutsches Zentrum für Entwicklungstechnologien; Deutsche Gesellschaft für Technische Zusammenarbeit, 1995. [Google Scholar]
- Walker, P.J. Strength and erosion characteristics of earth blocks and earth block masonry. J. Mater. Civ. Eng. 2004, 16, 497–506. [Google Scholar] [CrossRef]
- Cottrell, J.A.; Ali, M.; Tatari, A.; Martinson, D.B. An investigation into the influence of geometry on compressed earth building blocks using finite element analysis. Constr. Build. Mater. 2021, 273, 121997. [Google Scholar] [CrossRef]
- Standards New Zealand. NZS 4298:2020; Materials and Construction for Earth Buildings. 2020.
- Morel, J.C.; Pkla, A.; Walker, P. Compressive strength testing of compressed earth blocks. Constr. Build. Mater. 2007, 21, 303–309. [Google Scholar] [CrossRef]
- Heathcote, K.A.; Jankulovski, E. Aspect Ratio Correction Factors for Soilcrete Blocks. In Transactions of the Institution of Engineers, Australia; 1992; pp. 309–312. [Google Scholar]
- Kumar, S.; Mukhopadhyay, T.; Waseem, S.A.; Singh, B.; Iqbal, M.A. Effect of Platen Restraint on Stress–Strain Behavior of Concrete Under Uniaxial Compression: a Comparative Study. Strength Mater. 2016, 48, 592–602. [Google Scholar] [CrossRef]
- Neville, A.M. Properties of Concrete, 4th ed.; Pearson: Essex, UK, 2004. [Google Scholar]
- Van Vliet, M.R.A.; Van Mier, J.G.M. Experimental investigation of concrete fracture under uniaxial compression. Mech. Cohesive-Frict. Mater. 1996, 1, 115–127. [Google Scholar] [CrossRef]
- Bandeira, M.V.V.; La Torre, K.R.; Kosteski, L.E.; Marangon, E.; Riera, J.D. Influence of contact friction in compression tests of concrete samples. Constr. Build. Mater. 2022, 317, 125811. [Google Scholar] [CrossRef]
- Van Mier, J.G.M. Chapter 7 - Combined Tensile and Shear Fracture of Concrete. In Concrete Fracture: A Multiscale Approach; 2013. [Google Scholar]
- Van Mier, J.G.M. Strain-softening of concrete under multiaxial loading conditions; Eindhoven University of Technology, 1984. [Google Scholar] [CrossRef]
- Gerstle, K.B.; Aschl, H.; Bellotti, R.; Ko, H.Y.; Linse, D.; Newman, J.B.; et al. Behavior of Concrete Under Multiaxial Stress States. J. Eng. Mech. Div. 1980, 106, 1383–1403. [Google Scholar] [CrossRef]
- Van Mier, J.G.M. Chapter 8 - Compressive Fracture. In Concrete Fracture: A Multiscale Approach; 2013. [Google Scholar]
- Rutland, C.A.; Wangb, M.L. The Effects of Confinement on the Failure Orientation in Cementitious Materials Experimental Observations. 1997. [Google Scholar] [CrossRef]
- Strain Softening of Concrete - Test Methods for Compressive Softening. RILEM TC 148-SSC; Mater. Struct. 2000.
- Khan, M.M.; Iqbal, M.A. Impact of End Friction and Lateral Inertia Confinement on the Dynamic Compressive Performance of Standard and High-Strength Concrete. J. Fail. Anal. Prev. 2024, 24, 936–954. [Google Scholar] [CrossRef]
- Van Mier, J.G.M.; Shah, S.P.; Arnaud, M.; Balayssac, J.P.; Bascoul, A.; Choi, S.; et al. Strain-softening of concrete in uniaxial compression. Mater. Struct./Mater. Constr. 1997, 30, 195–209. [Google Scholar] [CrossRef]
- British Standards Institution. BS EN 12390-3:2019; Testing Hardened Concrete. Part 3: Compressive Strength of Test Specimens. 2019.
- Gonnerman, H.F. Effect of size and shape of test specimen on compressive strength of concrete. Proc. ASTM 1925, 25, 237–250. [Google Scholar]
- Middleton, G.F.; Schneider, L.M. Bulletin 5: Earth-wall Construction, 4th ed.; CSIRO Division of Building, Construction and Engineering: Sydney, Australia, 1987. [Google Scholar]
- Walker, P.; Standards Australia. HB 195 - The Australian Earth Building Handbook; Standards Australia International Ltd.: Sydney, Australia, 2002. [Google Scholar]
- Standards New Zealand. NZS 4298:1998; Materials and Workmanship For Earth Buildings. 1998.
- Standards New Zealand. NZS 4297:1998; Engineering Design of Earth Buildings. 1998.
- Standards New Zealand. NZS 4297:2020; Engineering Design of Earth Buildings. 2020.
- Bureau of Indian Standards. IS 4332-5:1970; Methods of Test for Stabilized Soils, Part 5: Determination of Unconfined Compressive Strength of Stabilized Soils. 1970.
- Walker, P.; Stace, T. Properties of some cement stabilised compressed earth blocks and mortars. Mater. Struct./Mater. Constr. 1997, 30, 545–551. [Google Scholar] [CrossRef]
- Sekhar, D.C.; Nayak, S. Utilization of granulated blast furnace slag and cement in the manufacture of compressed stabilized earth blocks. Constr. Build. Mater. 2018, 166, 531–536. [Google Scholar] [CrossRef]
- Danso, H.; Martinson, D.B.; Ali, M.; Williams, J.B. Physical, mechanical and durability properties of soil building blocks reinforced with natural fibres. Constr. Build. Mater. 2015, 101, 797–809. [Google Scholar] [CrossRef]
- Delgado, M.C.J.; Guerrero, I.C. Earth building in Spain. Constr. Build. Mater. 2006, 20, 679–690. [Google Scholar] [CrossRef]
- Laursen, P.T.; Herskedal, N.A.; Jansen, D.C.; Qu, B. Out-of-plane structural response of interlocking compressed earth block walls. Mater. Struct./Mater. Constr. 2015, 48, 321–336. [Google Scholar] [CrossRef]
- Morel, J.C.; Pkla, A.; Walker, P. Compressive strength testing of compressed earth blocks. Constr. Build. Mater. 2007, 21, 303–309. [Google Scholar] [CrossRef]
- Donkor, P.; Obonyo, E. Earthen construction materials: Assessing the feasibility of improving strength and deformability of compressed earth blocks using polypropylene fibers. Mater. Des. 2015, 83, 813–819. [Google Scholar] [CrossRef]
- Delgado, M.C.J.; Guerrero, I.C. Earth building in Spain. Constr. Build. Mater. 2006, 20, 679–690. [Google Scholar] [CrossRef]
- Sitton, J.D.; Zeinali, Y.; Heidarian, W.H.; Story, B.A. Effect of mix design on compressed earth block strength. Constr. Build. Mater. 2018, 158, 124–131. [Google Scholar] [CrossRef]
- Villamizar, M.C.N.; Araque, V.S.; Reyes, C.A.R.; Silva, R.S. Effect of the addition of coal-ash and cassava peels on the engineering properties of compressed earth blocks. Constr. Build. Mater. 2012, 36, 276–286. [Google Scholar] [CrossRef]
- Standards New Zealand. NZS 4299:1998; Earth Buildings Not Requiring Specific Design. 1998.
- Standards New Zealand. NZS 4299:2020; Earth Buildings Not Requiring Specific Engineering Design. 2020.
- Bureau of Indian Standards. IS 1725:2023, Stabilized Soil Blocks Used in General Building Construction - Specification. 2023.
- Krefeld, W.J. Effect of Shape of Specimens on the Apparent Compressive Strength of Brick Masonry. In Proceedings of the American Society of Materials; 1938; pp. 363–369. [Google Scholar]
- Walker, P.; Keable, R.; Martin, J.; Maniatids, V. Rammed Earth Design and Construction Guidelines; BRE Bookshop: Watford, UK, 2005. [Google Scholar] [CrossRef]
- American Society for Testing and Materials. ASTM D1633 - 00; Standard Test Methods for Compressive Strength of Molded Soil-Cement Cylinders. 2007; pp. 1–15.
- American Society for Testing and Materials. ATSM C42/C42M, Obtaining and Testing Drilled Core and Sawed Beams of Concrete. 2004, 6. [Google Scholar]
- American Society for Testing and Materials. ASTM C39/C39M, Standard Test Method for Compressive Strength of Cylindrical Concrete Specimens; 2001; pp. 1–5.
- British Standards Institution. BS EN 13791:2019; Assessment of In-Situ Compressive Strength in Structures and Precast Concrete Components. 2019.
- British Standards Institution. BS EN 12390-1:2021; British Standard. 2021; p. 18.
- Rangasamy, G.; Mani, S.; Senathipathygoundar Kolandavelu, S.K.; Alsoufi, M.S.; Mahmoud Ibrahim, A.M.; Muthusamy, S.; Panchal, H.; Sadasivuni, K.K.; Elsheikh, A.H. An extensive analysis of mechanical, thermal and physical properties of jute fiber composites with different fiber orientations. Case Stud. Therm. Eng. 2021, 28, 101612. [Google Scholar] [CrossRef]
- American Society for Testing and Materials. ASTM D7012 - 14, Standard Test Method for Compressive Strength and Elastic Moduli of Intact Rock Core Specimens under Varying States of Stress and Temperatures; 2014; pp. 1–8. [CrossRef]
- American Society for Testing and Materials. ASTM D5102 - 22; Standard Test Method for Unconfined Compressive Strength of Compacted Soil-Lime Mixtures. 2022; pp. 0–7. [CrossRef]
- British Standards Institution. BS 1377-7:1990; Soils for Civil Engineering Purposes — Part 7: Shear Strength Tests (Total Stress). 1990.
- Danso, H.; Martinson, D.B.; Ali, M.; Williams, J.B. Mechanisms by which the inclusion of natural fibres enhance the properties of soil blocks for construction. J. Compos. Mater. 2017, 51, 3835–3845. [Google Scholar] [CrossRef]
- Danso, H.; Martinson, D.B.; Ali, M.; Williams, J. Effect of fibre aspect ratio on mechanical properties of soil building blocks. Constr. Build. Mater. 2015, 83, 314–319. [Google Scholar] [CrossRef]
- Danso, H.; Martinson, B.; Ali, M.; Mant, C. Performance characteristics of enhanced soil blocks: A quantitative review. Build. Res. Inf. 2015, 43, 253–262. [Google Scholar] [CrossRef]
- British Standards Institution. BS 8601:2013; Specification for Subsoil and Requirements for Use. 2013.
- British Standards Institution. BS 1377-2:2022; Methods of Test for Soils for Civil Engineering Purposes, Part 2: Classification Tests and Determination of Geotechnical Properties. 2022.
- Mastersizer 3000+ Lab; Malvern Panalytical Ltd., 2024.
- Morton, T. Earth Masonry: Design and Construction Guidelines; IHS BRE Press: Bracknell, UK, 2008. [Google Scholar]
- Song, H.; Liu, J.; He, K.; Ahmad, W. A comprehensive overview of jute fiber reinforced cementitious composites. Case Stud. Constr. Mater. 2021, 15, e00724. [Google Scholar] [CrossRef]
- Ali, M.R.; Kozan, O.; Rahman, A.; Islam, K.; Hossain, M.I. Jute retting process: Present practice and problems in Bangladesh. Agric. Eng. Int.: CIGR J. 2015, 17, 243–247. [Google Scholar]
- Al Jubayer, A.; Sheikh, B.; Rahman, M.; Islam, J.M.M.; Thakur, V.K. Modification of Jute Fibers by Radiation-Induced Graft Copolymerization and Their Applications. In Cellulose-Based Graft Copolymers: Structure and Chemistry; CRC Press, 2015; pp. 210–232. [Google Scholar] [CrossRef]
- Majumder, A.; Stochino, F.; Farina, I.; Valdes, M.; Fraternali, F.; Martinelli, E. Physical and mechanical characteristics of raw jute fibers, threads and diatons. Constr. Build. Mater. 2022, 326, 126903. [Google Scholar] [CrossRef]
- Bui, H.; Hussain, M.; Levacher, D. Recycling of Tropical Natural Fibers in Building Materials. Nat. Fiber 2022. [Google Scholar] [CrossRef]
- Juradin, S.; Jozić, D.; Grubeša, I.N.; Pamuković, A.; Čović, A.; Mihanović, F. Influence of Spanish Broom Fibre Treatment, Fibre Length, and Amount and Harvest Year on Reinforced Cement Mortar Quality. Buildings 2023, 13, 1910. [Google Scholar] [CrossRef]
- Chandrasekaran, R.G.; Ramakrishna, G. Experimental investigation on mechanical properties of economical local natural fibre reinforced cement mortar. Mater. Today Proc. 2021, 7633–7638. [Google Scholar] [CrossRef]
- Mathavan, M.; Sakthieswaran, N.; Babu, O.G. Experimental investigation on strength and properties of natural fibre reinforced cement mortar. Mater. Today Proc. 2020, 1066–1070. [Google Scholar] [CrossRef]
- Overview of ZwickRoell Materials Testing Machines; ZwickRoell Ltd., 2023.
- Genlab Classic Ovens, Genlab Ltd, 2020.
- Danso, H.; Martinson, D.B.; Ali, M.; Williams, J.B. Effect of Sugarcane Bagasse Fibre on the Strength Properties of Soil Blocks. In 1st International Conference on Bio-Based Building Materials; 2015. [Google Scholar]
- Danso, H.; Martinson, D.B.; Ali, M.; Williams, J.B. Mechanisms by which the inclusion of natural fibres enhance the properties of soil blocks for construction. J. Compos. Mater. 2017, 51, 3835–3845. [Google Scholar] [CrossRef]
- Danso, H. Use of agricultural waste fibres as enhancement of soil blocks for low-cost housing in Ghana 2016.
- British Standards Institute. BS EN 772-1:2011+A1:2015; Methods of Test for Masonry Units. Determination of Compressive Strength. 2011.
- Ansys 2024 Product Release and Updates; ANSYS Incorporated, 2024.
- Ansys SpaceClaim 3D Modeling Software; ANSYS Incorporated, 2024.
- Yu, W.; Jin, L.; Du, X. Experiment and meso-scale modelling on combined effects of strain rate and specimen size on uniaxial-compressive failures of concrete. Int. J. Damage Mech. 2023, 32, 683–714. [Google Scholar] [CrossRef]
- Gisbert, J.I.; Bru, D.; Gonzalez, A.; Ivorra, S. Masonry micromodels using high order 3D elements. Procedia Struct. Integr. 2018, 11, 428–435. [Google Scholar] [CrossRef]
- Klabník, M.; Králik, J. Equivalent Stress and Strain of Composite Column under Fire. Procedia Eng. 2017, 190, 522–529. [Google Scholar] [CrossRef]
- Khajehdehi, R.; Panahshahi, N. Effect of openings on in-plane structural behavior of reinforced concrete floor slabs. J. Build. Eng. 2016, 7, 1–11. [Google Scholar] [CrossRef]
- Lahmar, N.; Bouziadi, F.; Boulekbache, B.; Meziane, E.; Hamrat, M. Experimental and finite element analysis of shrinkage of concrete made with recycled coarse aggregates subjected to thermal loading. Constr. Build. Mater. 2020, 247, 118564. [Google Scholar] [CrossRef]
- Martínez, M.; Atamturktur, S. Experimental and numerical evaluation of reinforced dry-stacked concrete masonry walls. J. Build. Eng. 2019, 22, 181–191. [Google Scholar] [CrossRef]
- Aydin, A.C.; Özkaya, S.G. The finite element analysis of collapse loads of single-spanned historic masonry arch bridges (Ordu, Sarpdere Bridge). Eng. Fail. Anal. 2018, 84, 131–138. [Google Scholar] [CrossRef]
- Miccoli, L.; Garofano, A.; Fontana, P.; Müller, U. Experimental testing and finite element modelling of earth block masonry. Eng. Struct. 2015, 104, 80–94. [Google Scholar] [CrossRef]
- Ben Ayed, H.; Limam, O.; Aidi, M.; Jelidi, A. Experimental and numerical study of Interlocking Stabilized Earth Blocks mechanical behavior. J. Build. Eng. 2016, 7, 207–216. [Google Scholar] [CrossRef]
- El Nabouch, R.; Bui, Q.-B.; Perrotin, P.; Plé, O.; Plassiard, J.-P. Numerical modeling of rammed earth constructions: analysis and recommendations. In 1st International Conference on Bio-Based Building Materials; 2015; pp. 21–24. [Google Scholar] [CrossRef]
- Parisi, F.; Balestrieri, C.; Varum, H. Nonlinear finite element model for traditional adobe masonry. Constr. Build. Mater. 2019, 223, 450–462. [Google Scholar] [CrossRef]
- Nikon Metrology NV. XT H 225 and XT H 320. 2023.
- Reddy, B.V.; Jagadish, K.S. The static compaction of soils. Geotechnique 1993, 43, 337–341. [Google Scholar] [CrossRef]
- Selescadevi, T.S.; Thanjavur Varshini, S.V. Earth Building Blocks Reinforced with Jute and Banana Fiber; 2018; pp. 1–4. [Google Scholar]
- Karmaker, A.C.; Hinrichsen, G. Effect of water uptake on some physical properties of jute fibres. J. Text. Inst. 1994, 85, 288–290. [Google Scholar] [CrossRef]
- Khan, R.A.; Khan, M.A.; Zaman, H.U.; Pervin, S.; Khan, N.; Sultana, S.; et al. Comparative studies of mechanical and interfacial properties between jute and e-glass fiber-reinforced polypropylene composites. J. Reinf. Plast. Compos. 2010, 29, 1078–1088. [Google Scholar] [CrossRef]
- Minitab Inc. Minitab 17.3.1 2024.
- Bouhicha, M.; Aouissi, F.; Kenai, S. Performance of composite soil reinforced with barley straw. Cem. Concr. Compos. 2005, 27, 617–621. [Google Scholar] [CrossRef]
- Cai, Y.; Shi, B.; Ng, C.W.W.; Tang, C.s. Effect of polypropylene fibre and lime admixture on engineering properties of clayey soil. Eng. Geol. 2006, 87, 230–240. [Google Scholar] [CrossRef]
- Readle, D.; Coghlan, S.; Smith, J.C.; Corbin, A.; Augarde, C.E. Fibre reinforcement in earthen construction materials. Proc. Inst. Civ. Eng.: Constr. Mater. 2016, 169, 252–260. [Google Scholar] [CrossRef]
- Araya-Letelier, G.; Antico, F.C.; Burbano-Garcia, C.; Concha-Riedel, J.; Norambuena-Contreras, J.; Concha, J.; Saavedra Flores, E.I. Experimental evaluation of adobe mixtures reinforced with jute fibers. Constr. Build. Mater. 2021, 276, 122127. [Google Scholar] [CrossRef]
Figure 1.
Illustration of the direct compression test (A), the RILEM 164 method (B), and indirect testing (C).
Figure 1.
Illustration of the direct compression test (A), the RILEM 164 method (B), and indirect testing (C).
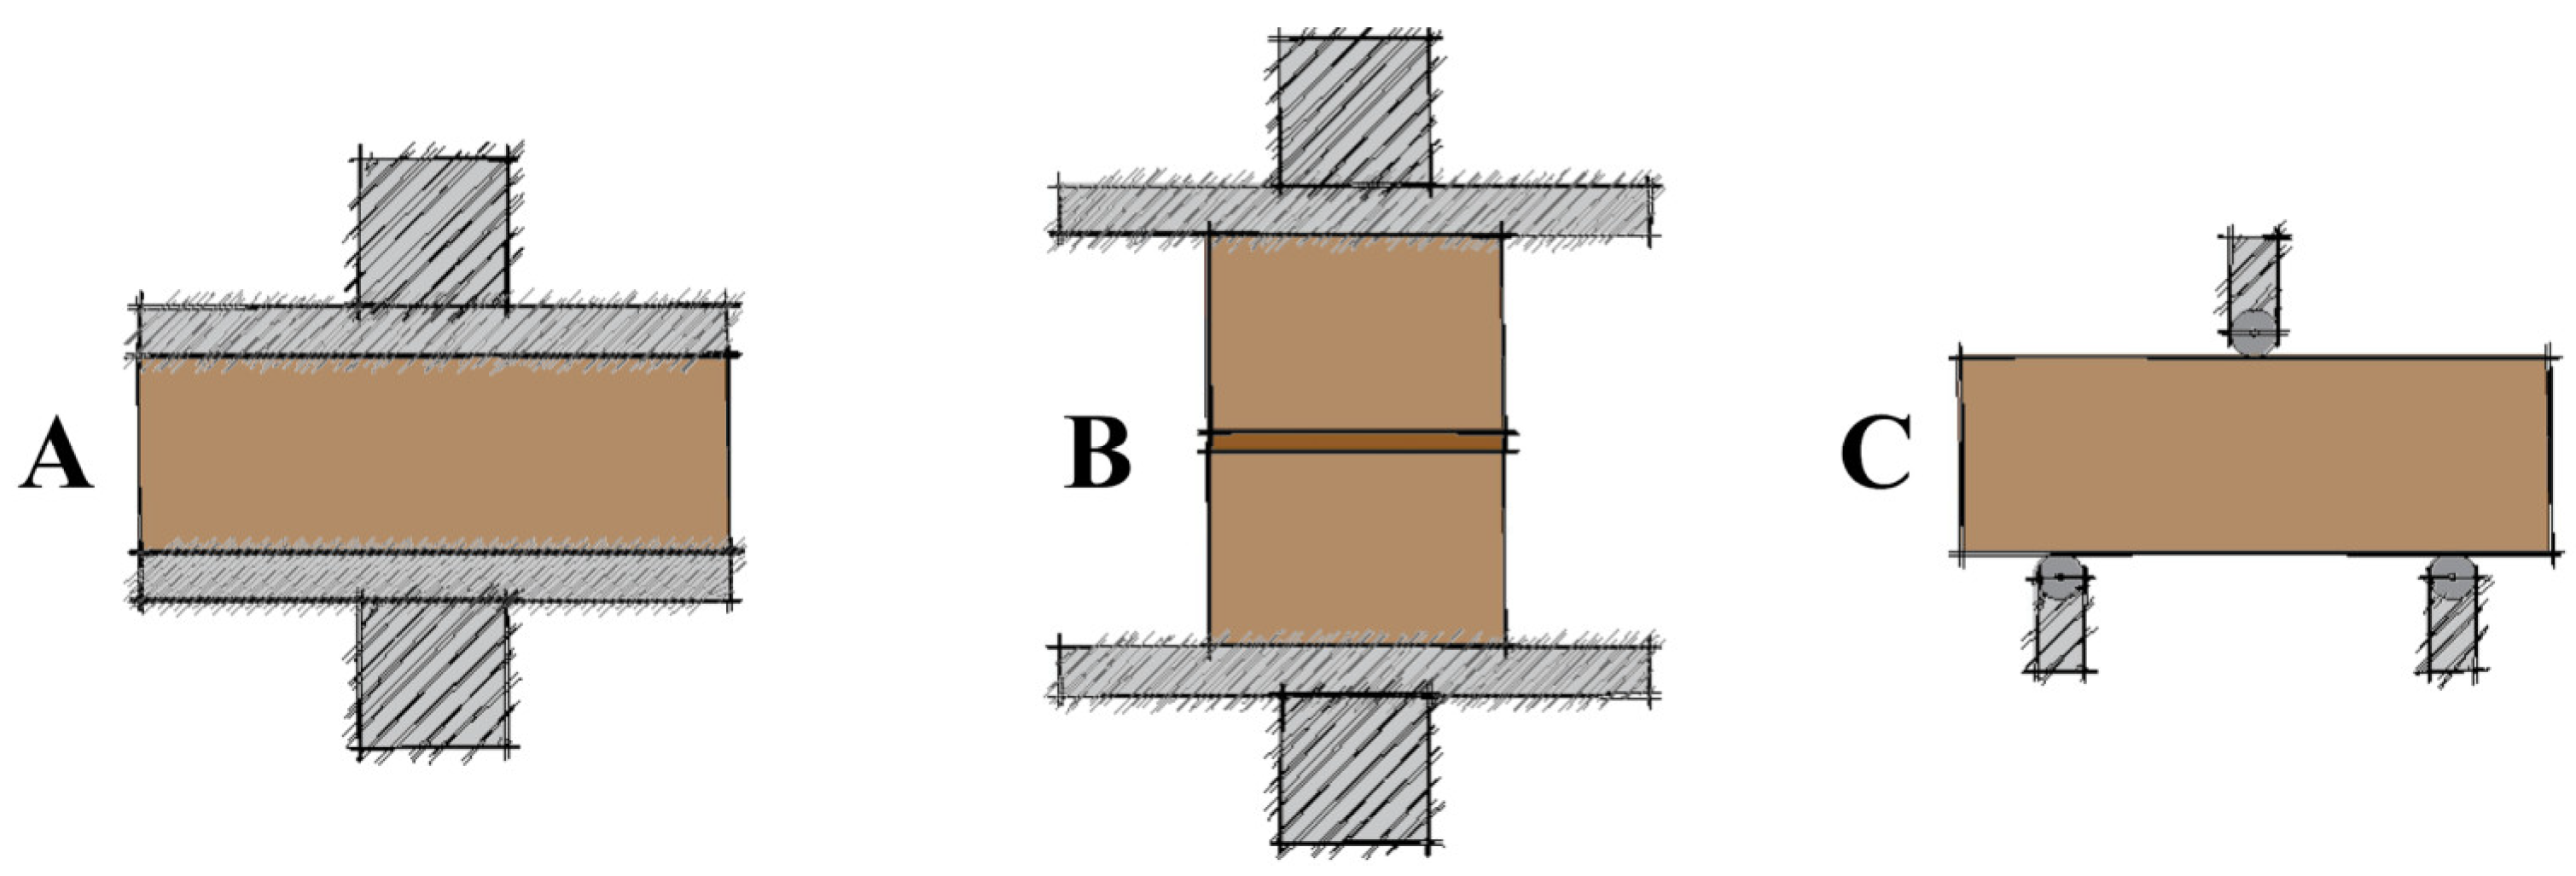
Figure 2.
Illustration of Confinement caused by Platen Restraint.
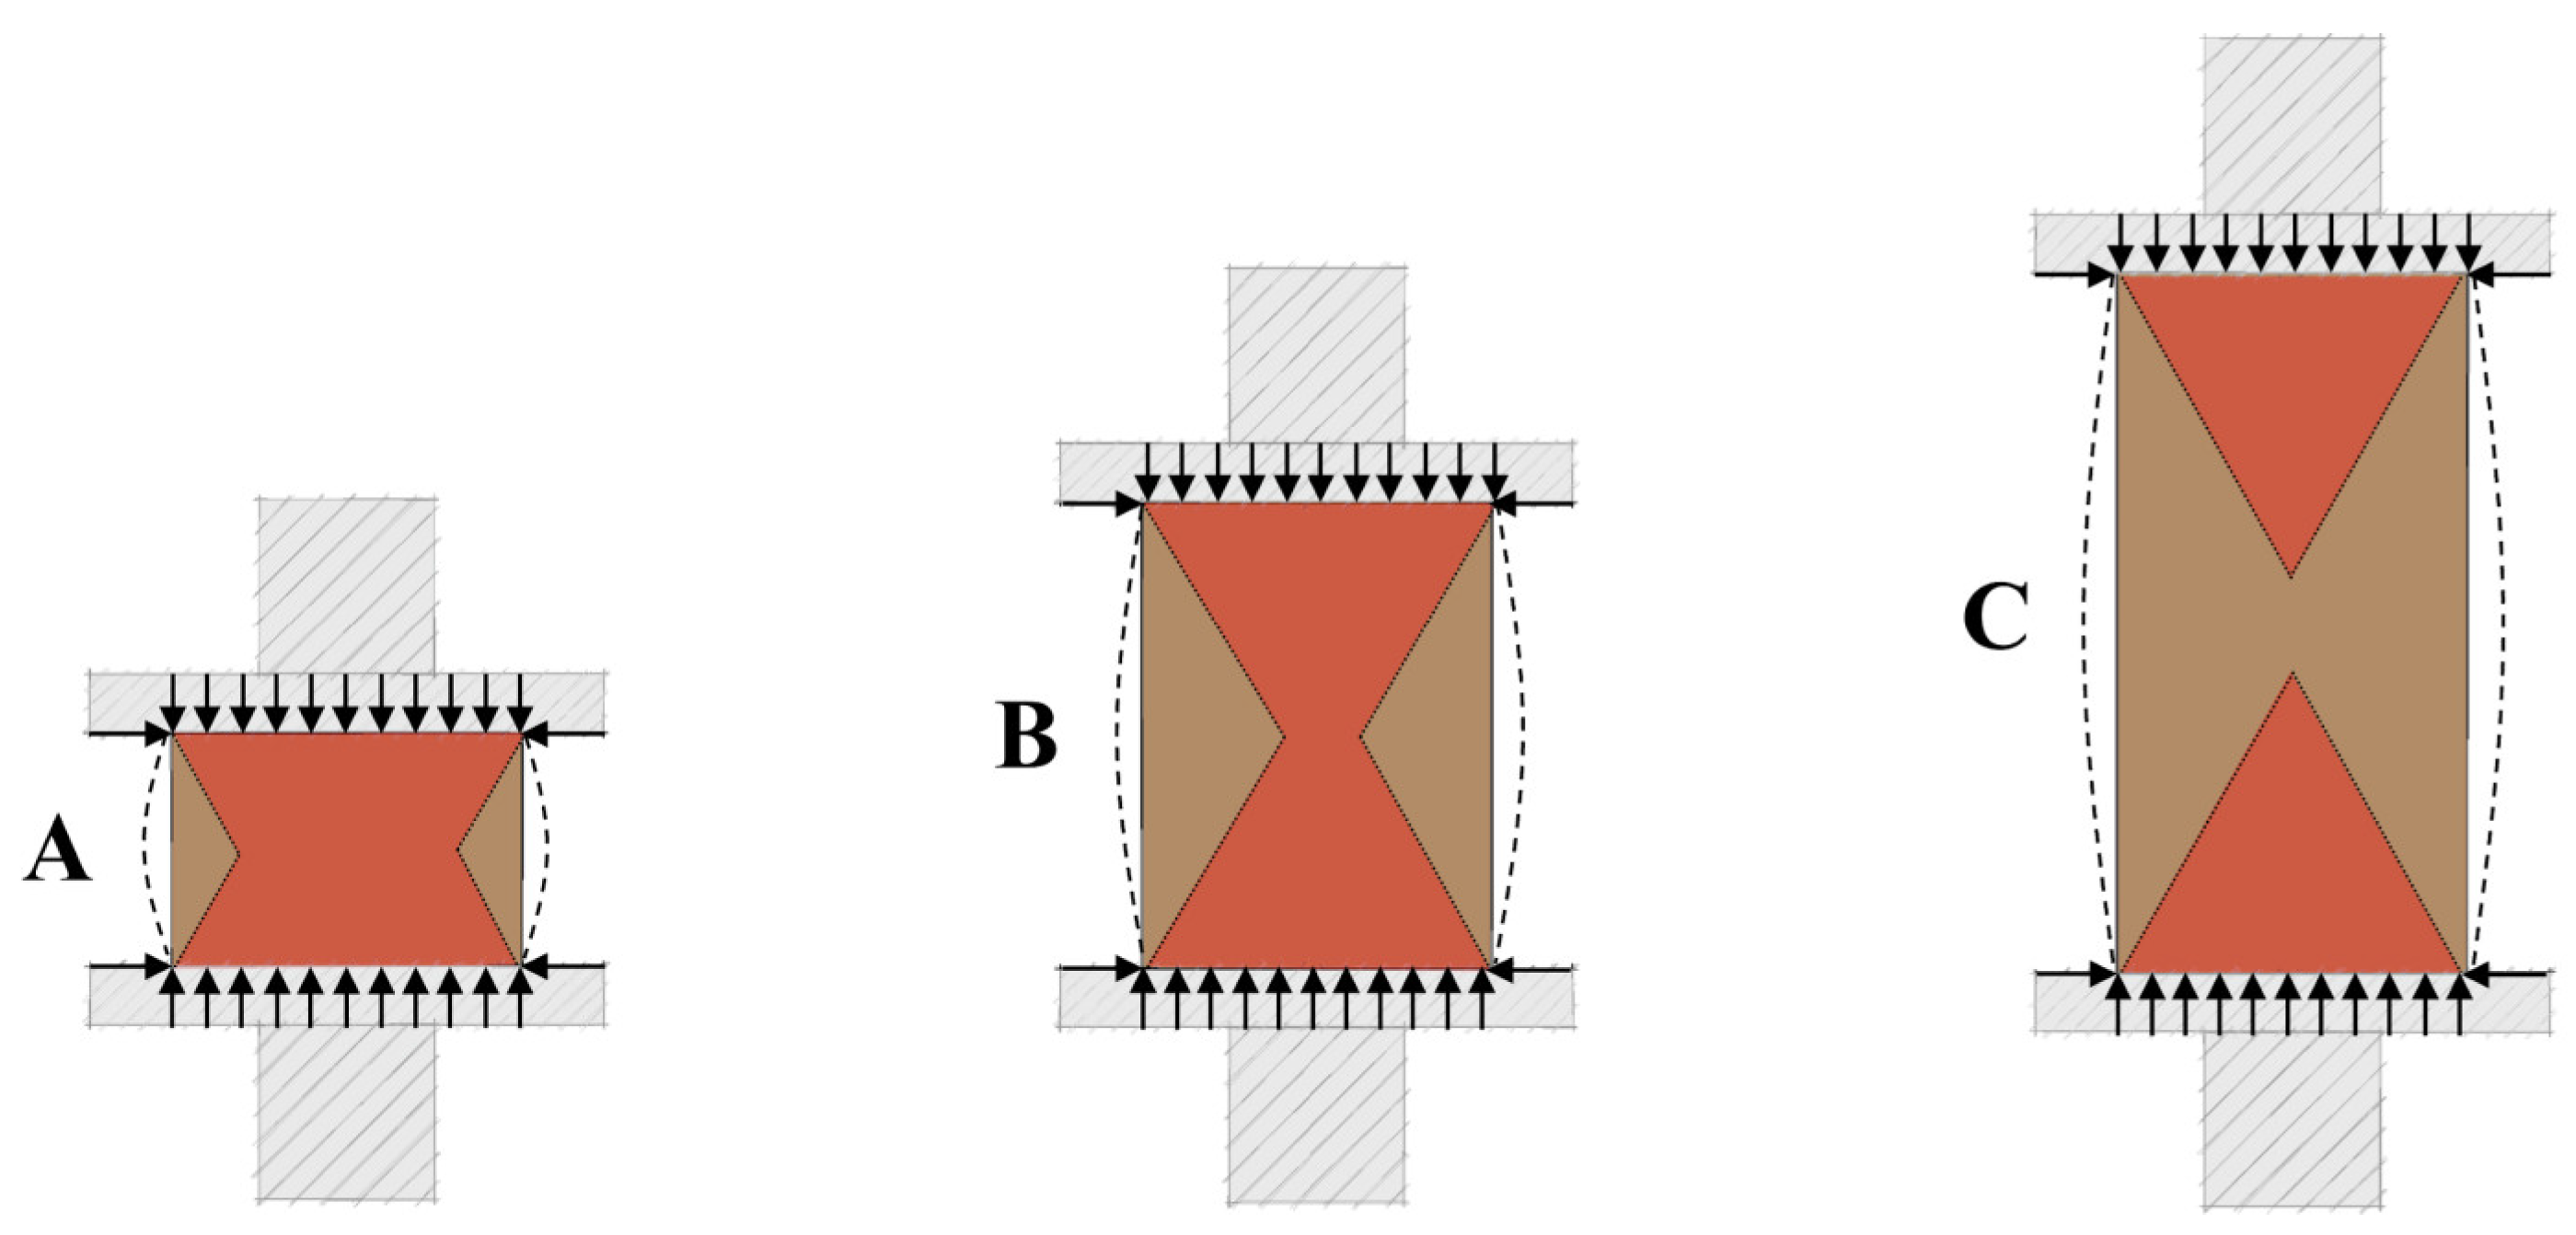
Figure 3.
Existing aspect ratio correction factors (NZS 4298:1998 vs NZS 4298:2020).
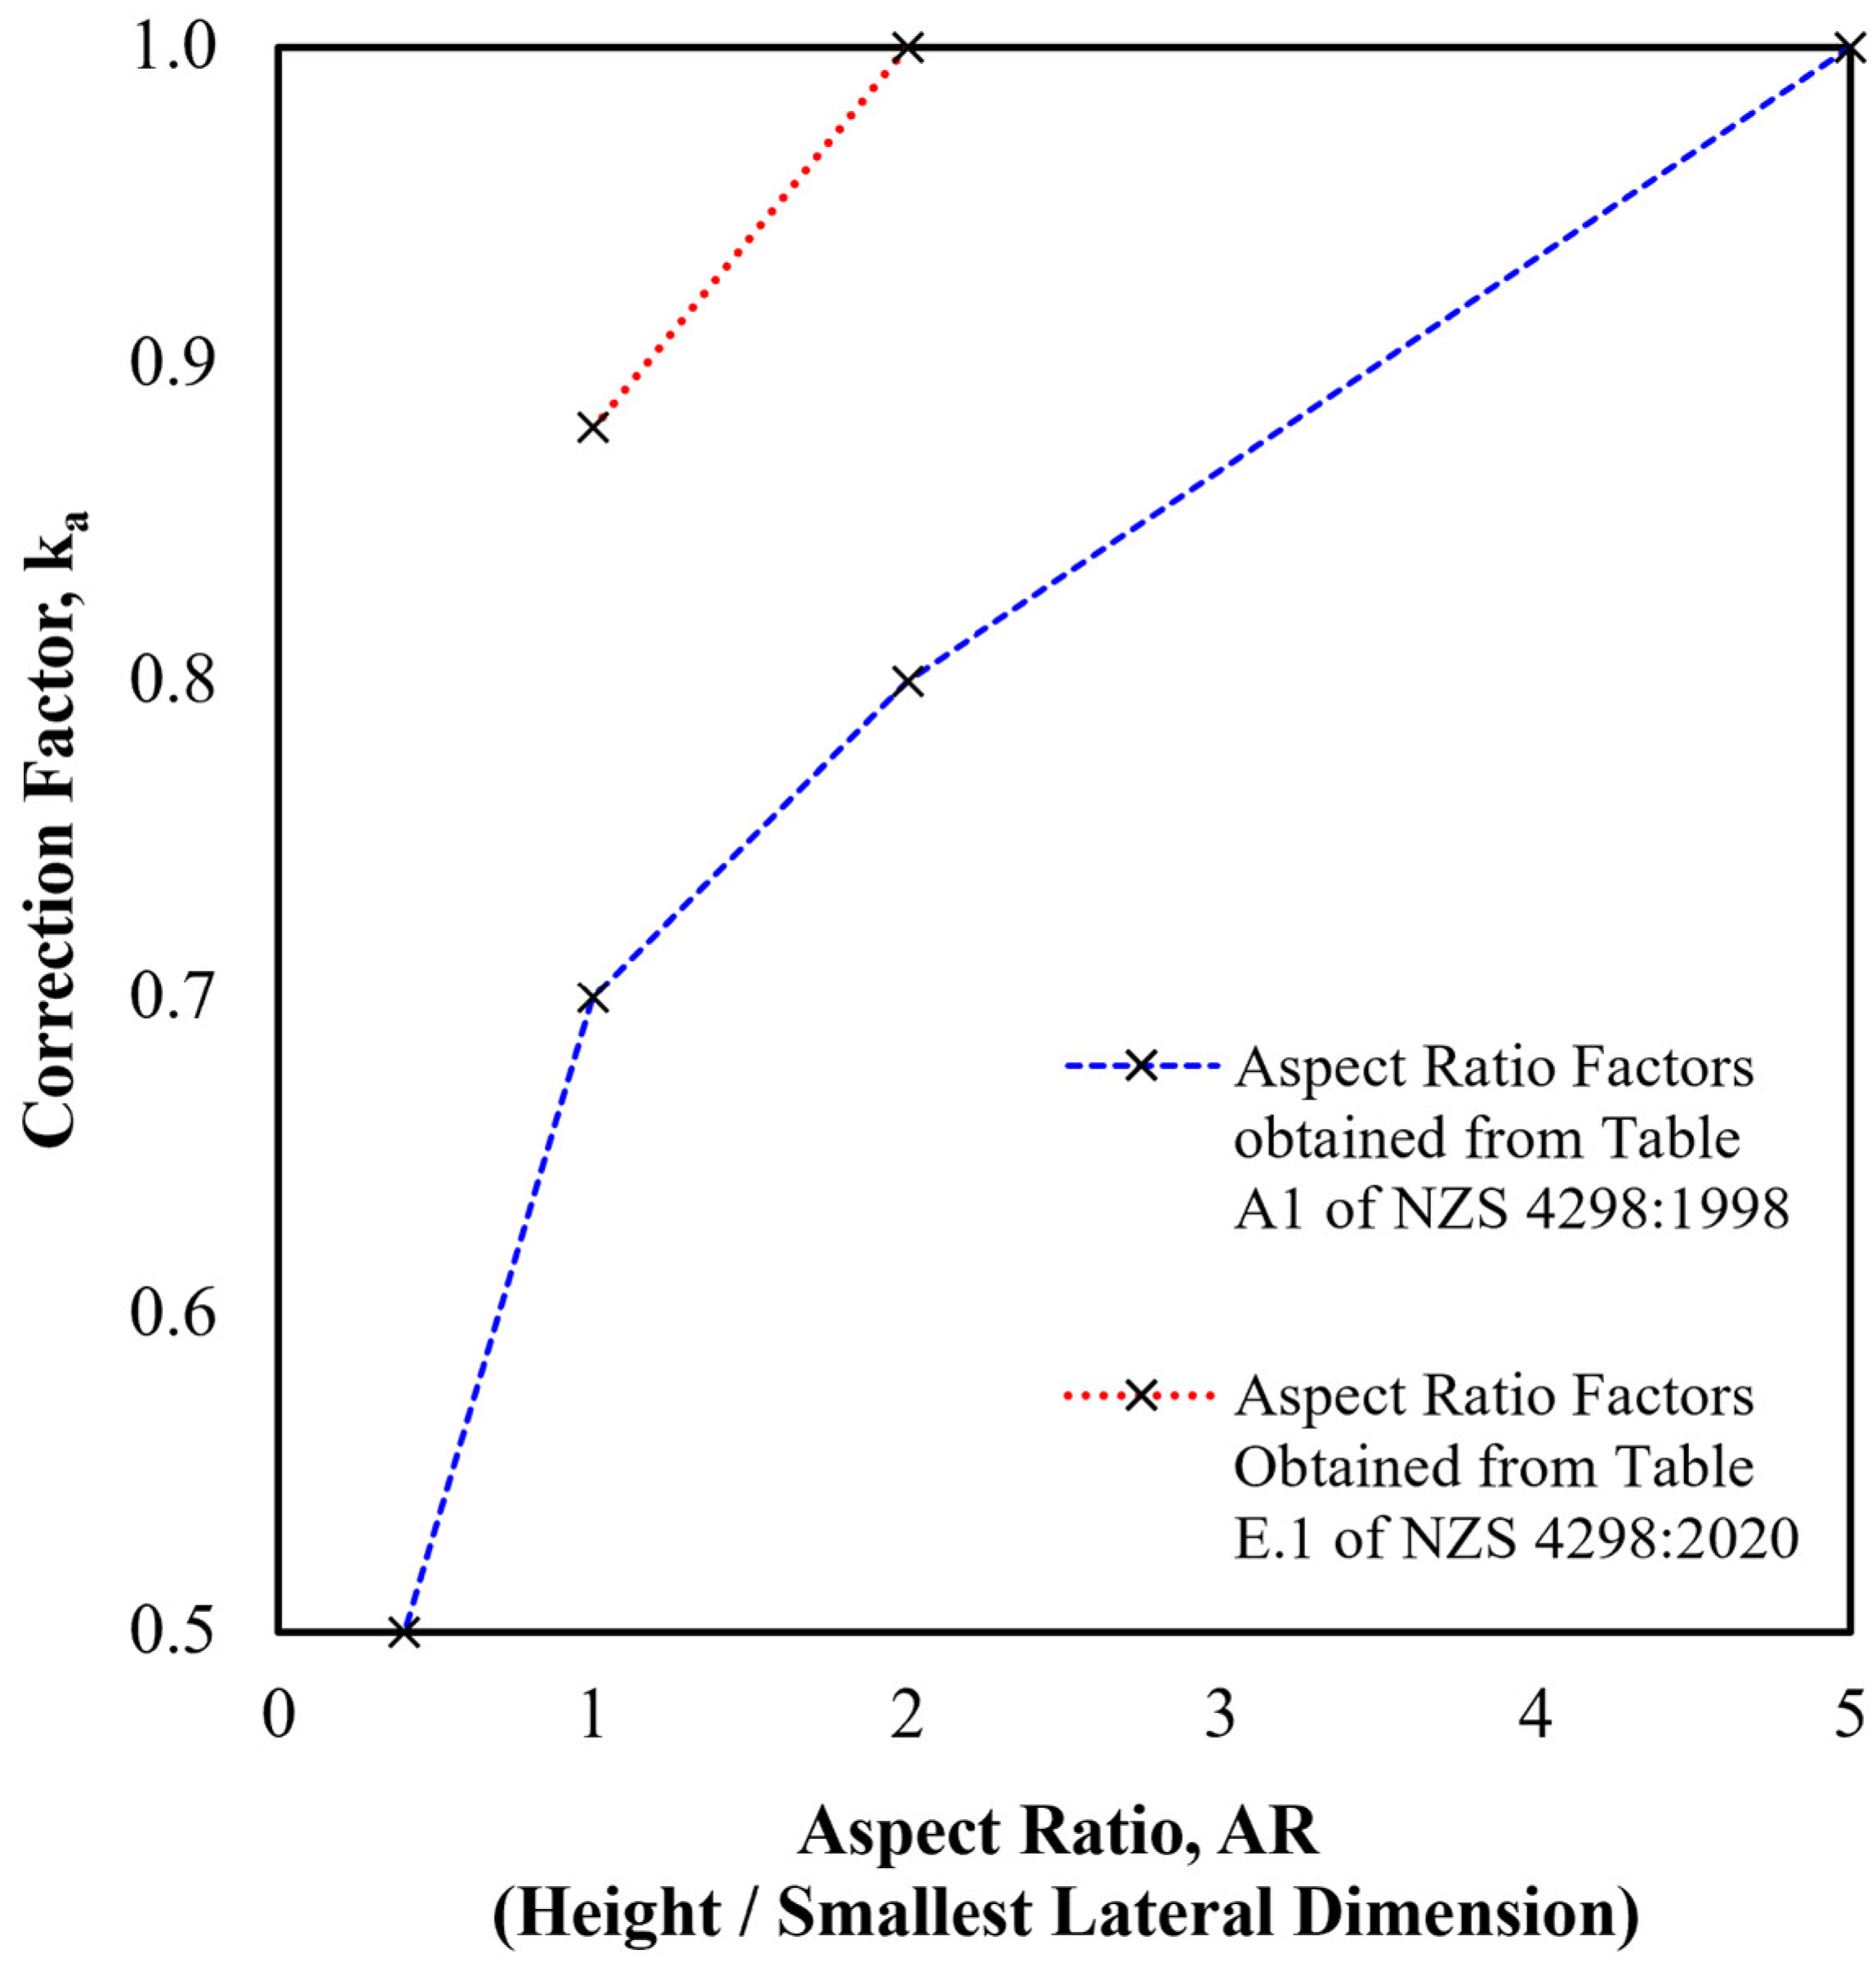
Figure 4.
Illustration of equipment used to manufacture CECs (A), photo of CEC samples (B), illustration of equipment used to manufacture CEBs (C), illustration of CEB (D) [3,24].
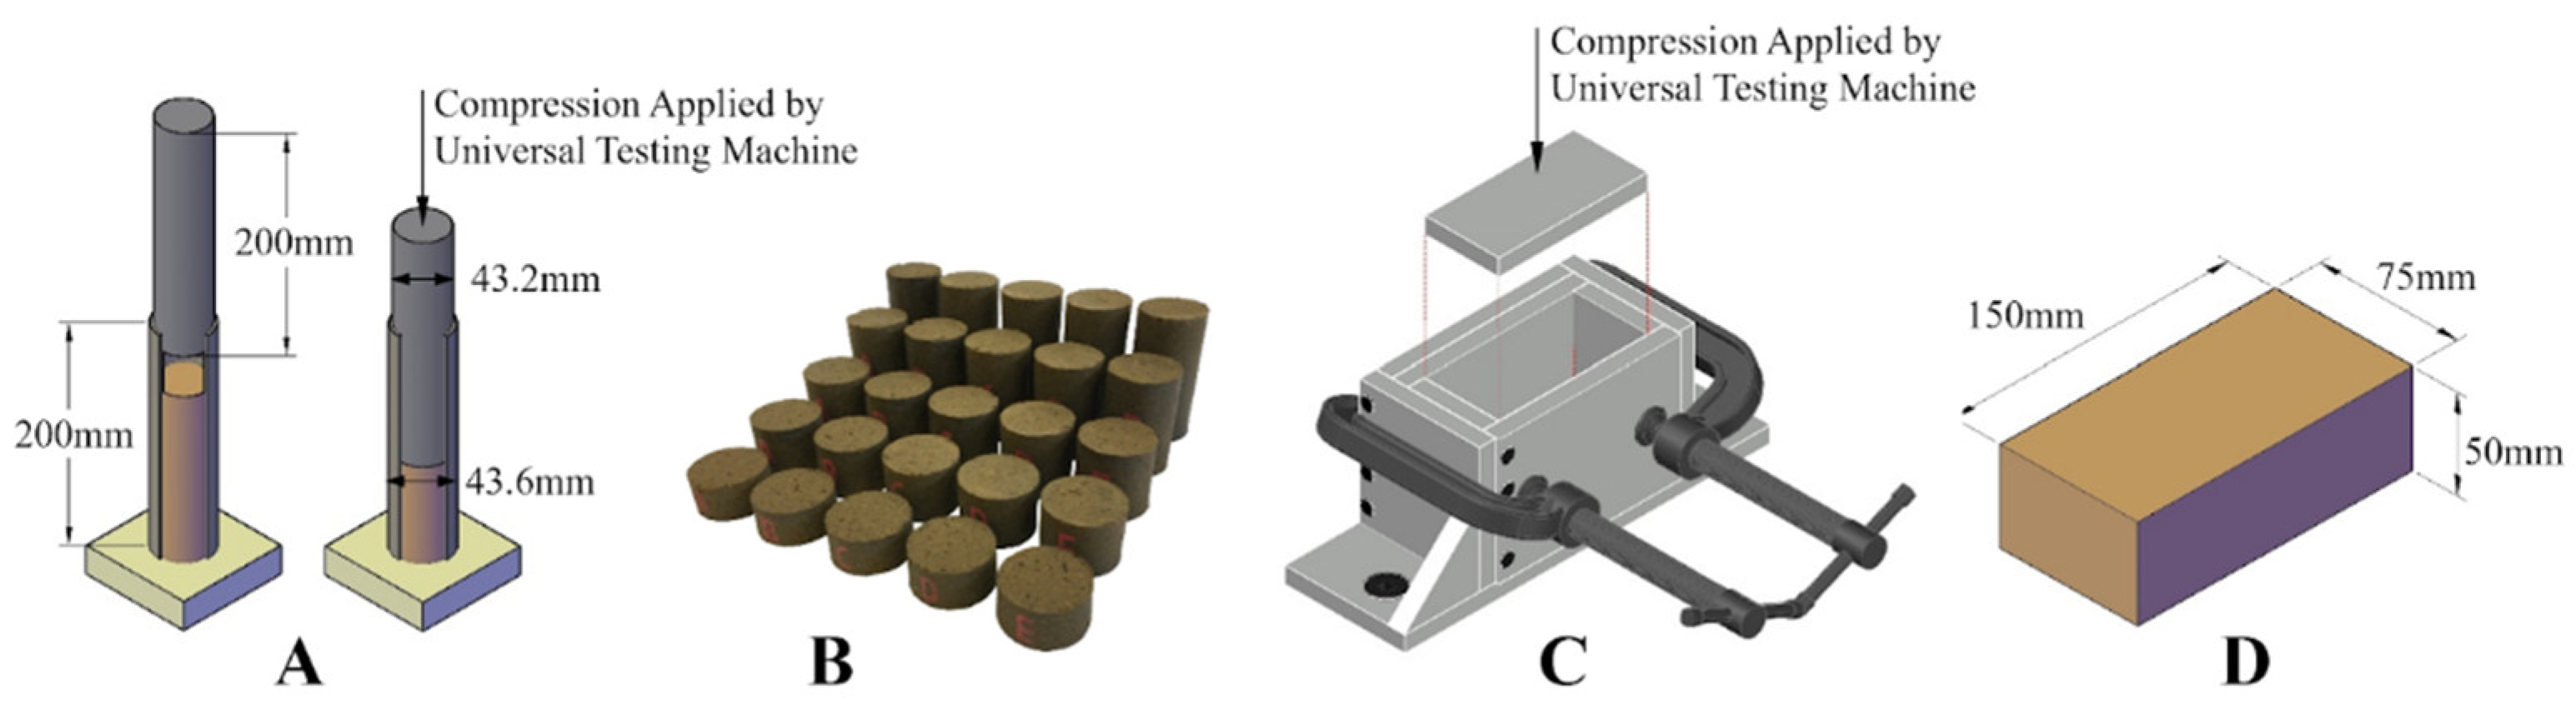
Figure 5.
Stress-Strain Curve Obtained from Testing (A), Simplified Stress-Strain Curve used in FEA (B). Example Dataset from Compression Testing of FRBE-2.00.
Figure 5.
Stress-Strain Curve Obtained from Testing (A), Simplified Stress-Strain Curve used in FEA (B). Example Dataset from Compression Testing of FRBE-2.00.
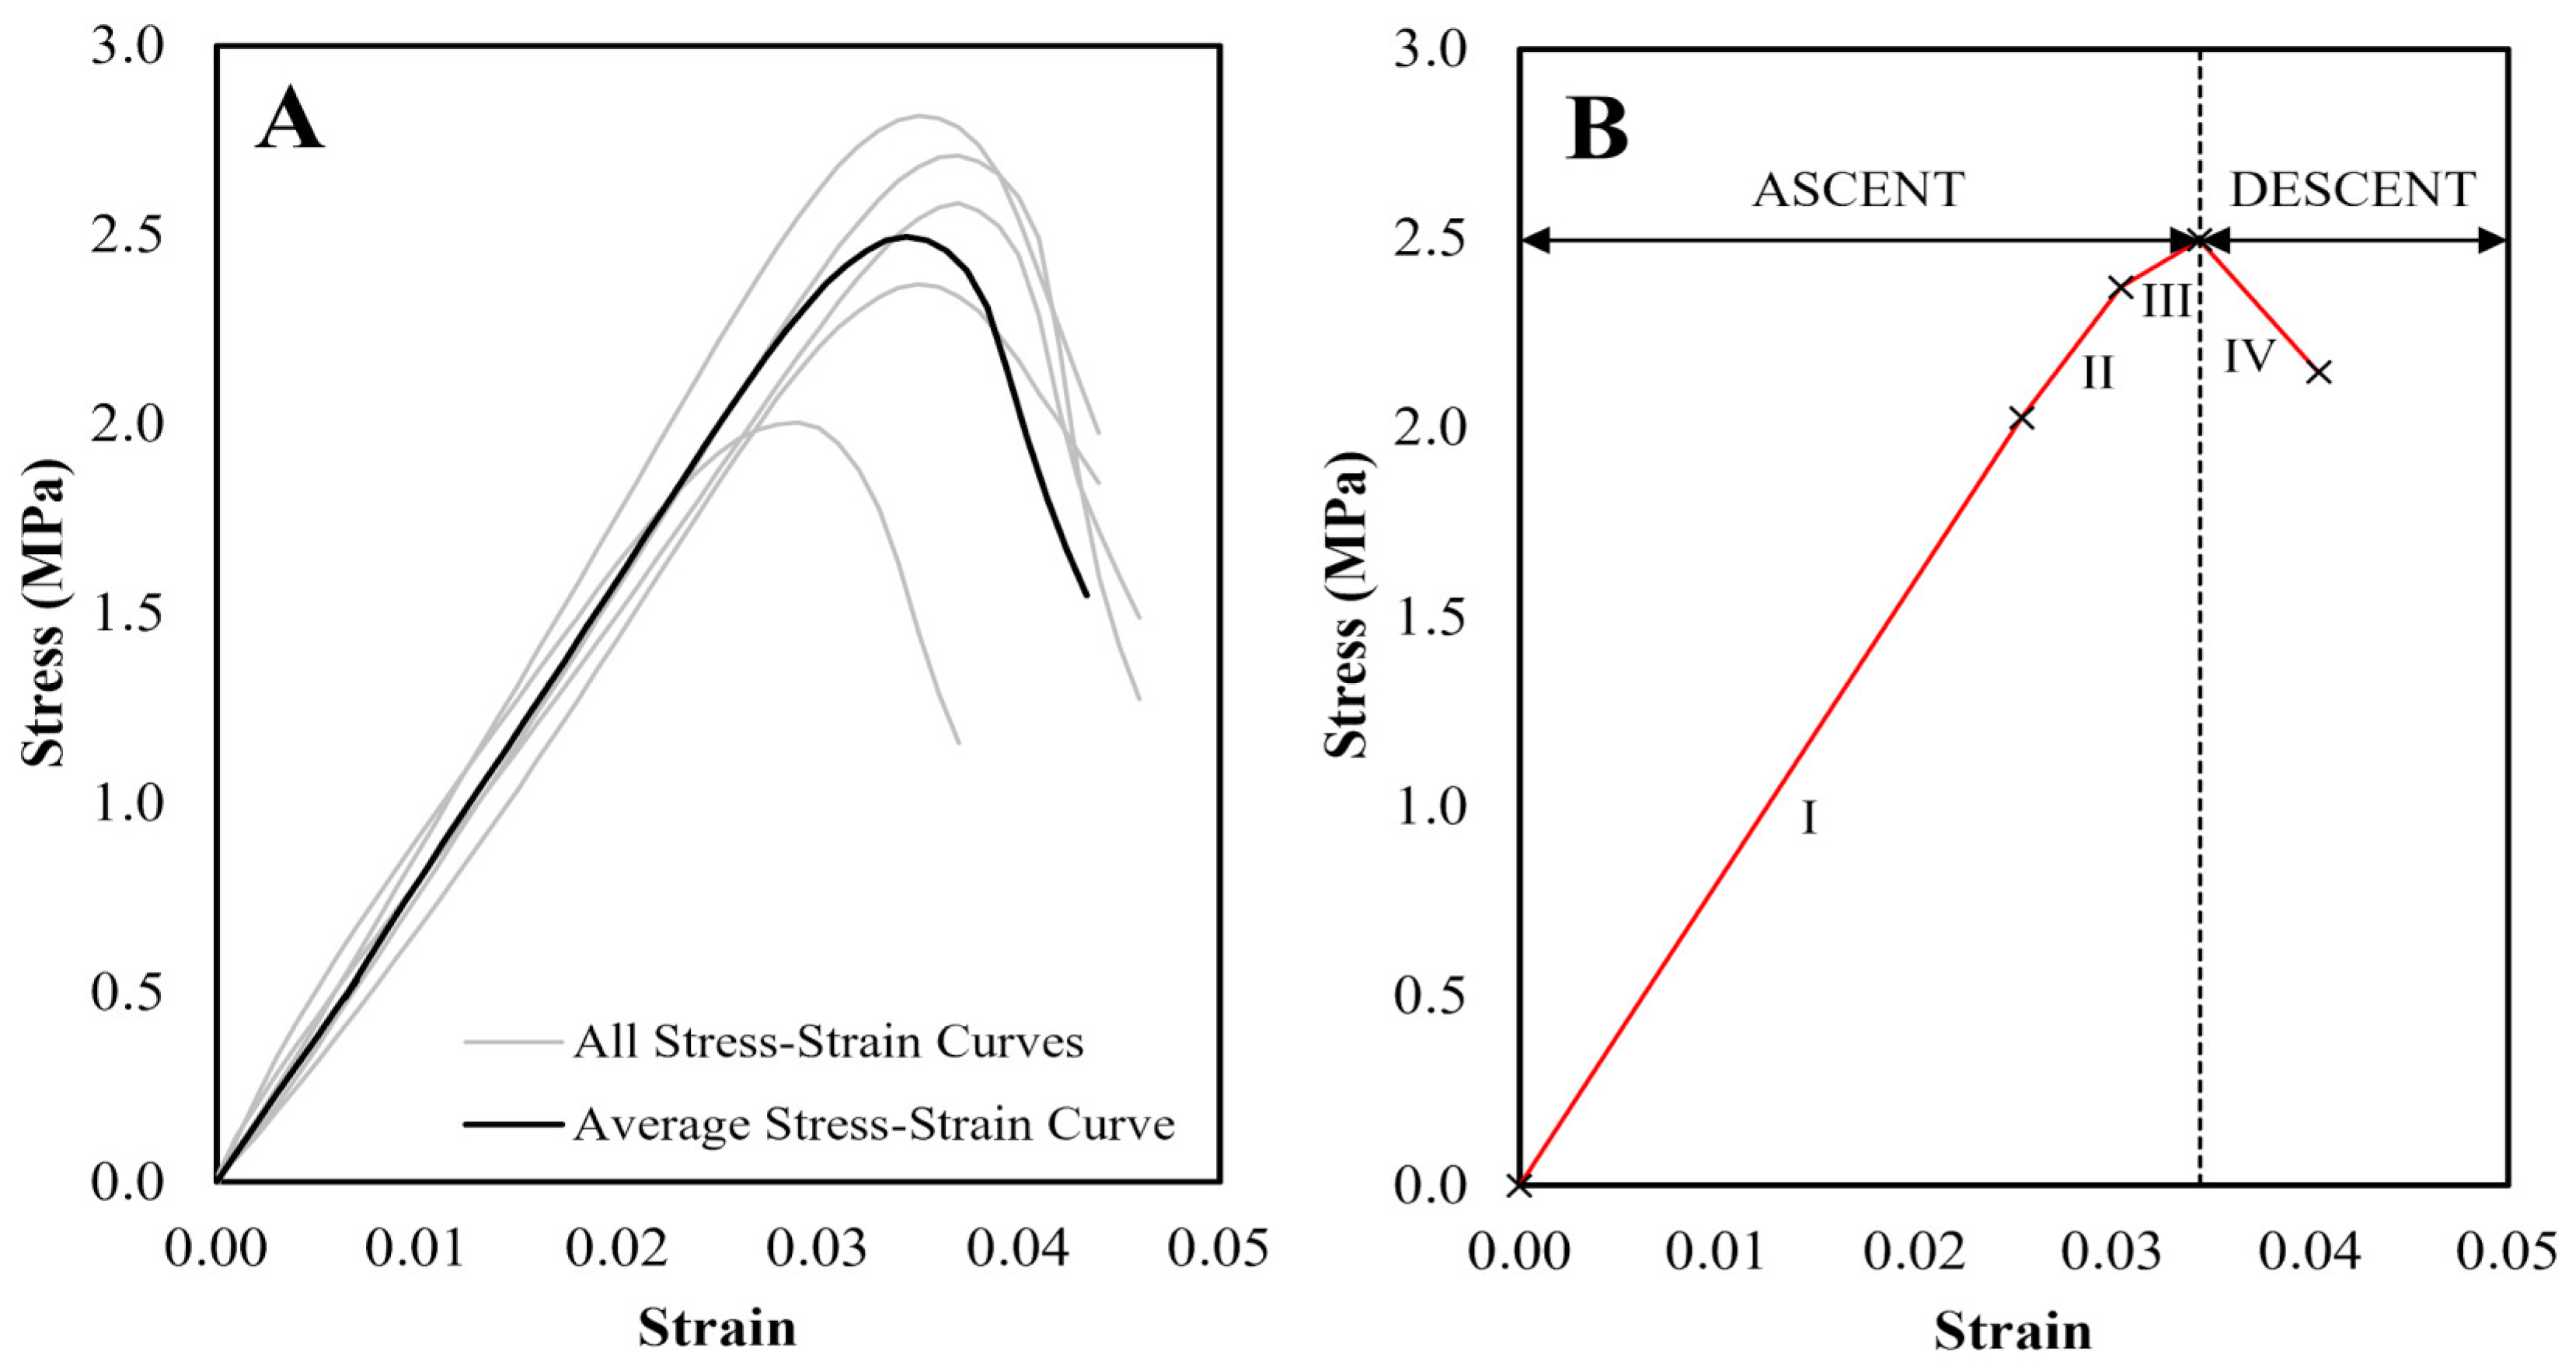
Figure 6.
Hypothesis of Intersecting Cones.
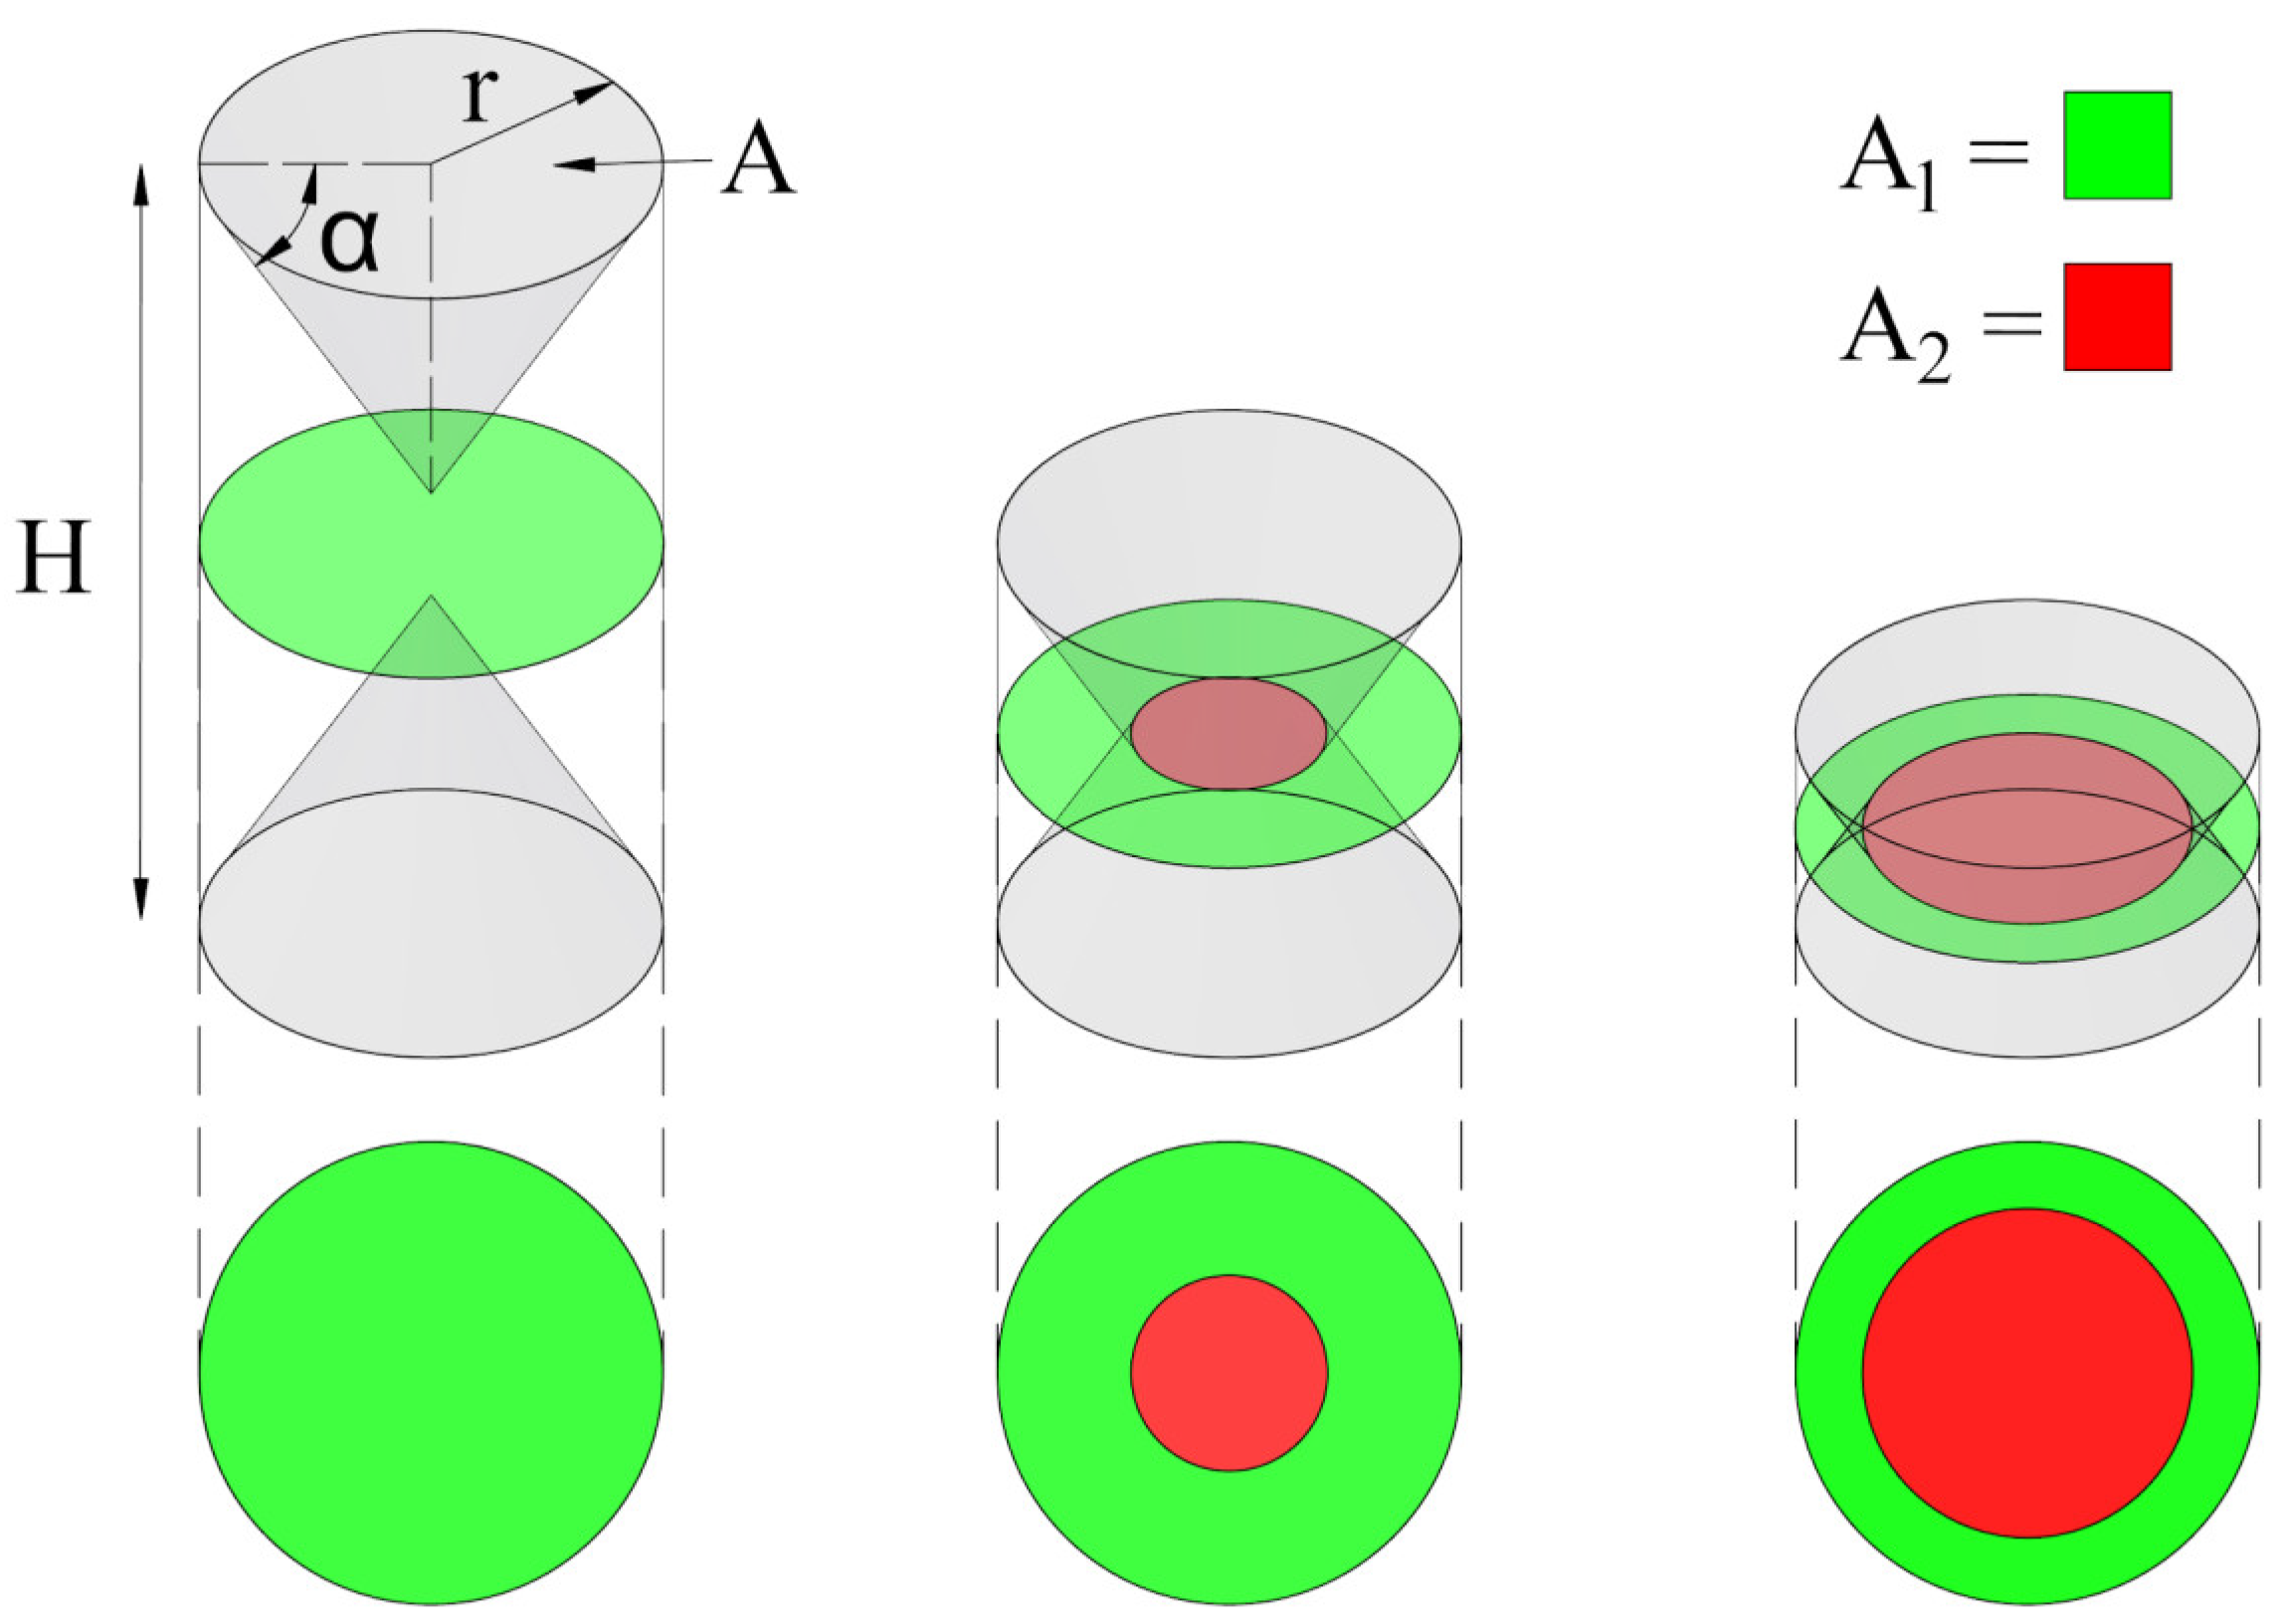
Figure 7.
Peak compaction pressure during the manufacture of CEC samples vs aspect ratio. Data for Kent Brick Earth (BE), Fibre Reinforced Kent Brick Earth (FRBE), BS8601 Subsoil (SS), and Fibre Reinforced BS8601 Subsoil (FRSS) are shown separately. Error bars represent standard deviation.
Figure 7.
Peak compaction pressure during the manufacture of CEC samples vs aspect ratio. Data for Kent Brick Earth (BE), Fibre Reinforced Kent Brick Earth (FRBE), BS8601 Subsoil (SS), and Fibre Reinforced BS8601 Subsoil (FRSS) are shown separately. Error bars represent standard deviation.
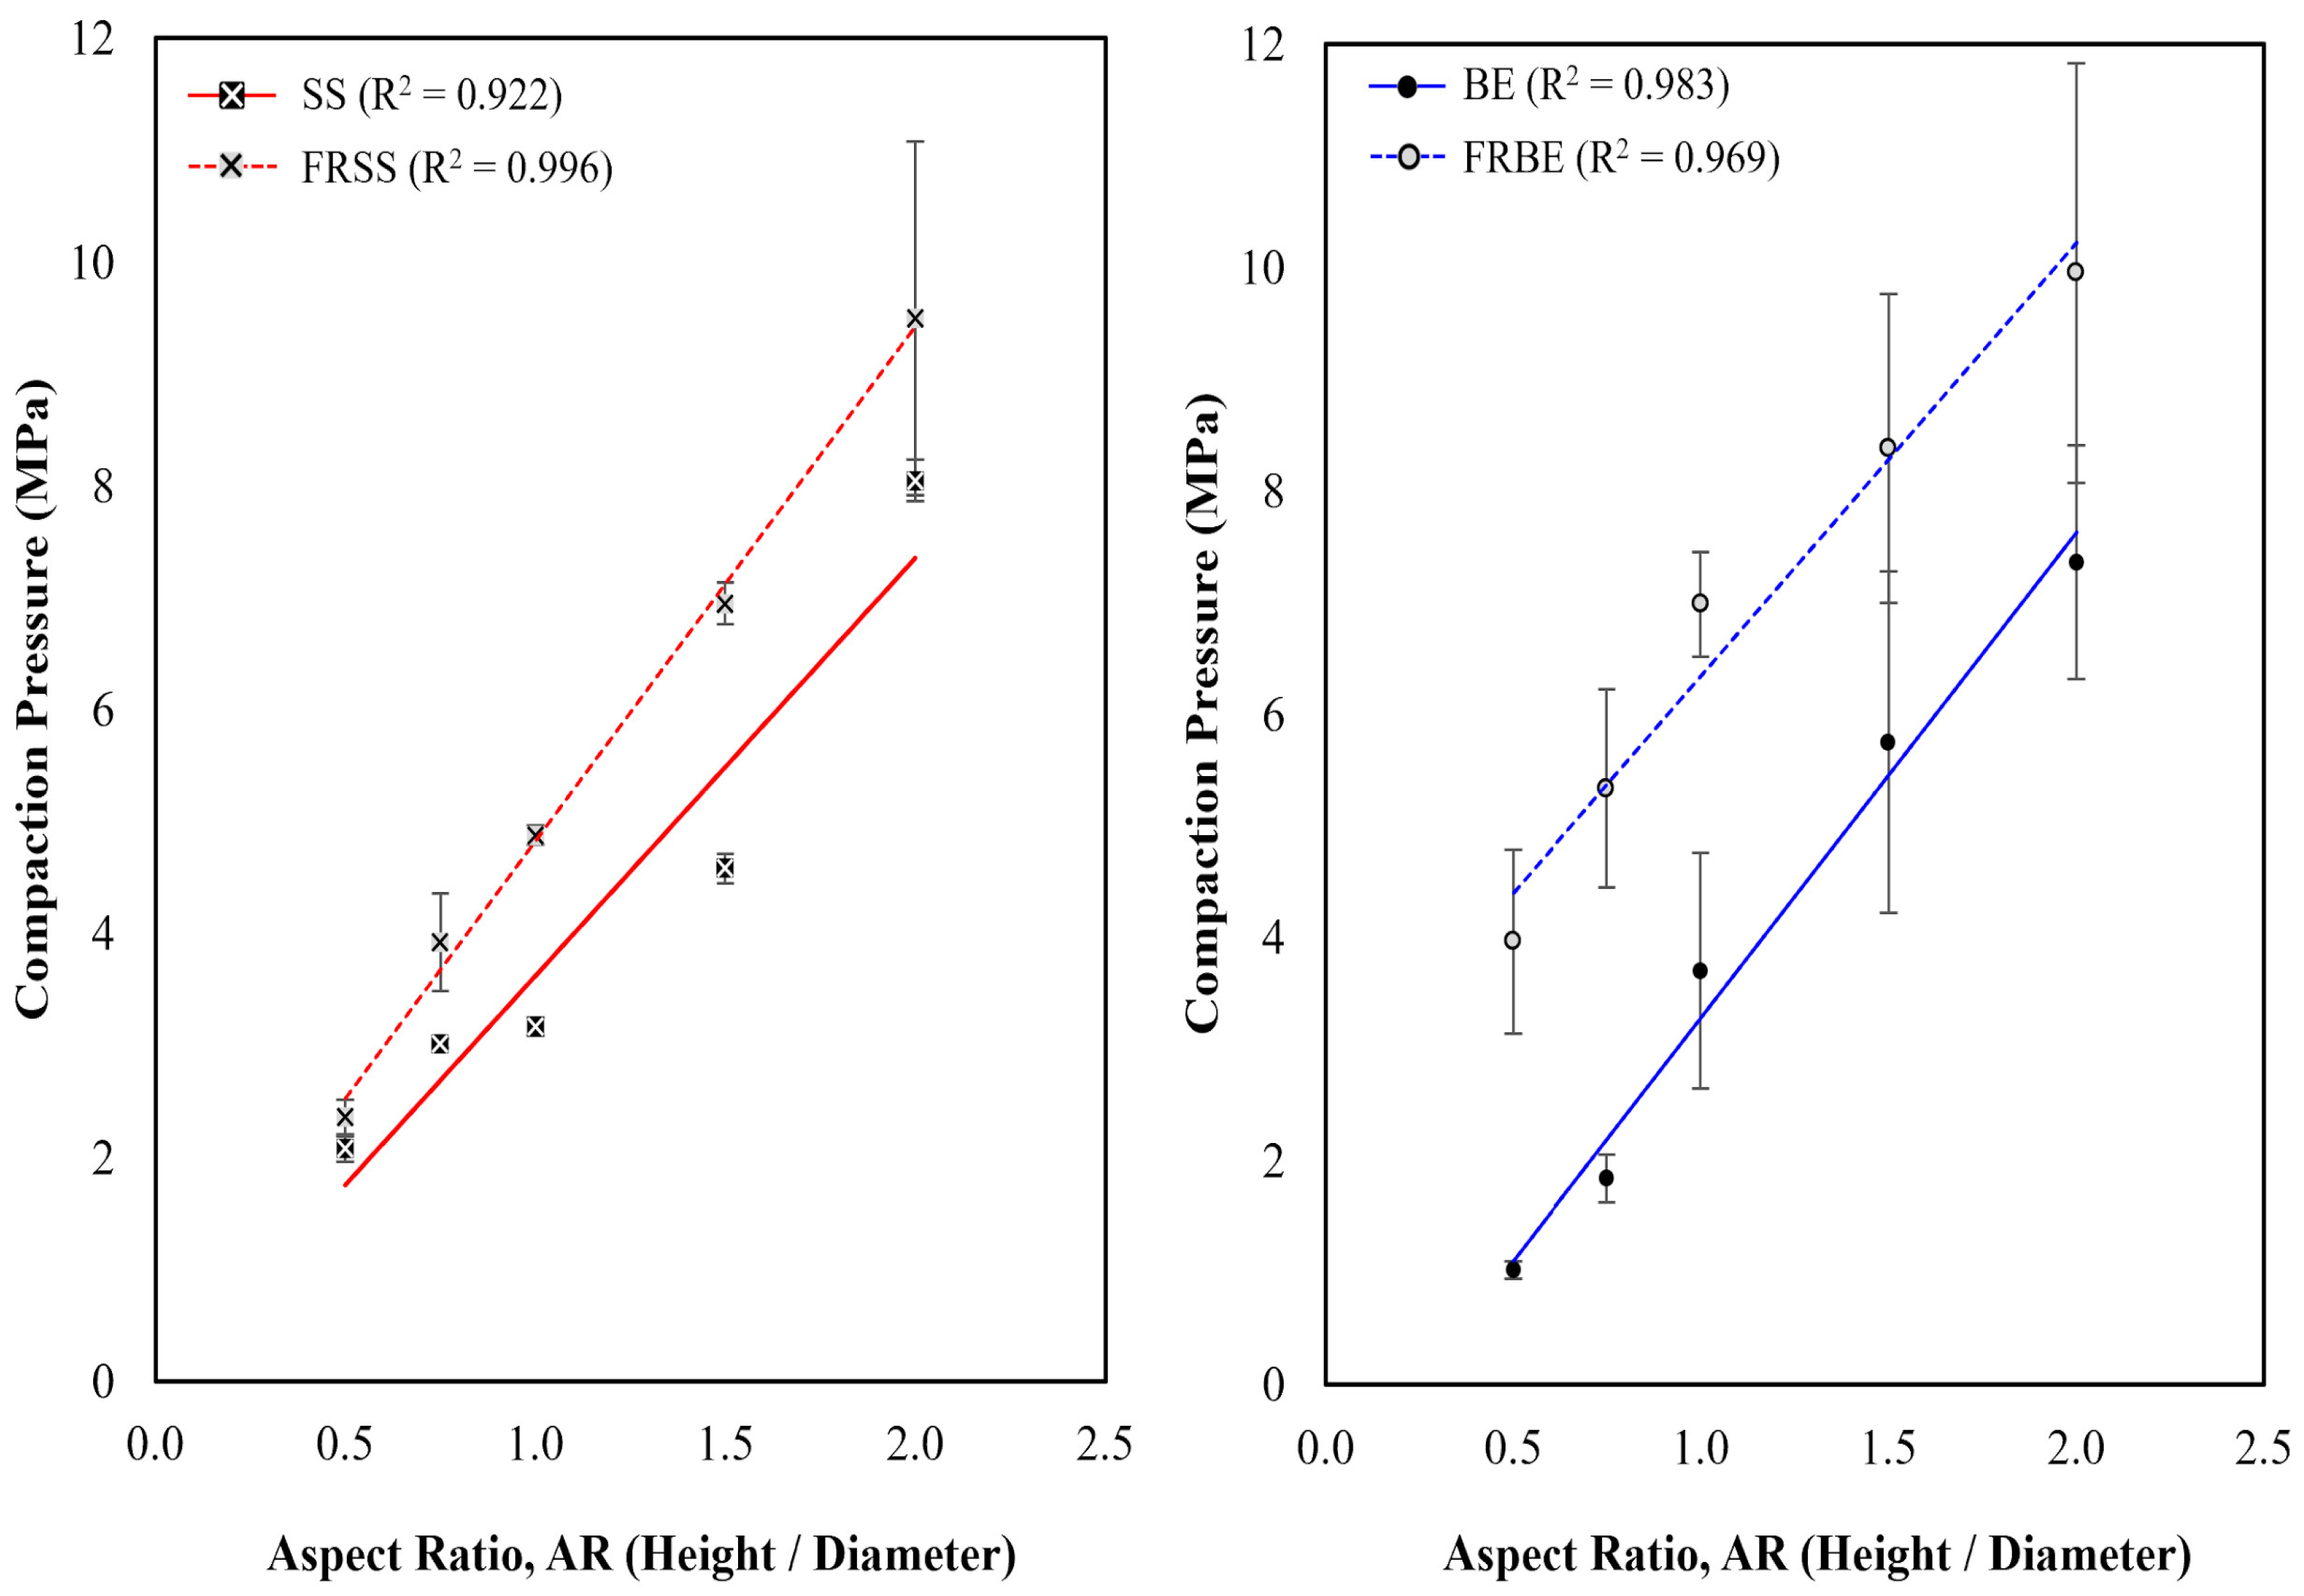
Figure 8.
Compressive Strength vs Aspect Ratio of CECs: Comparison of Experimental Results and Asymptotic Regression Models. Datapoints show the average (mean) value obtained from experimental analysis. Error bars show ± standard deviation (n = 5).
Figure 8.
Compressive Strength vs Aspect Ratio of CECs: Comparison of Experimental Results and Asymptotic Regression Models. Datapoints show the average (mean) value obtained from experimental analysis. Error bars show ± standard deviation (n = 5).
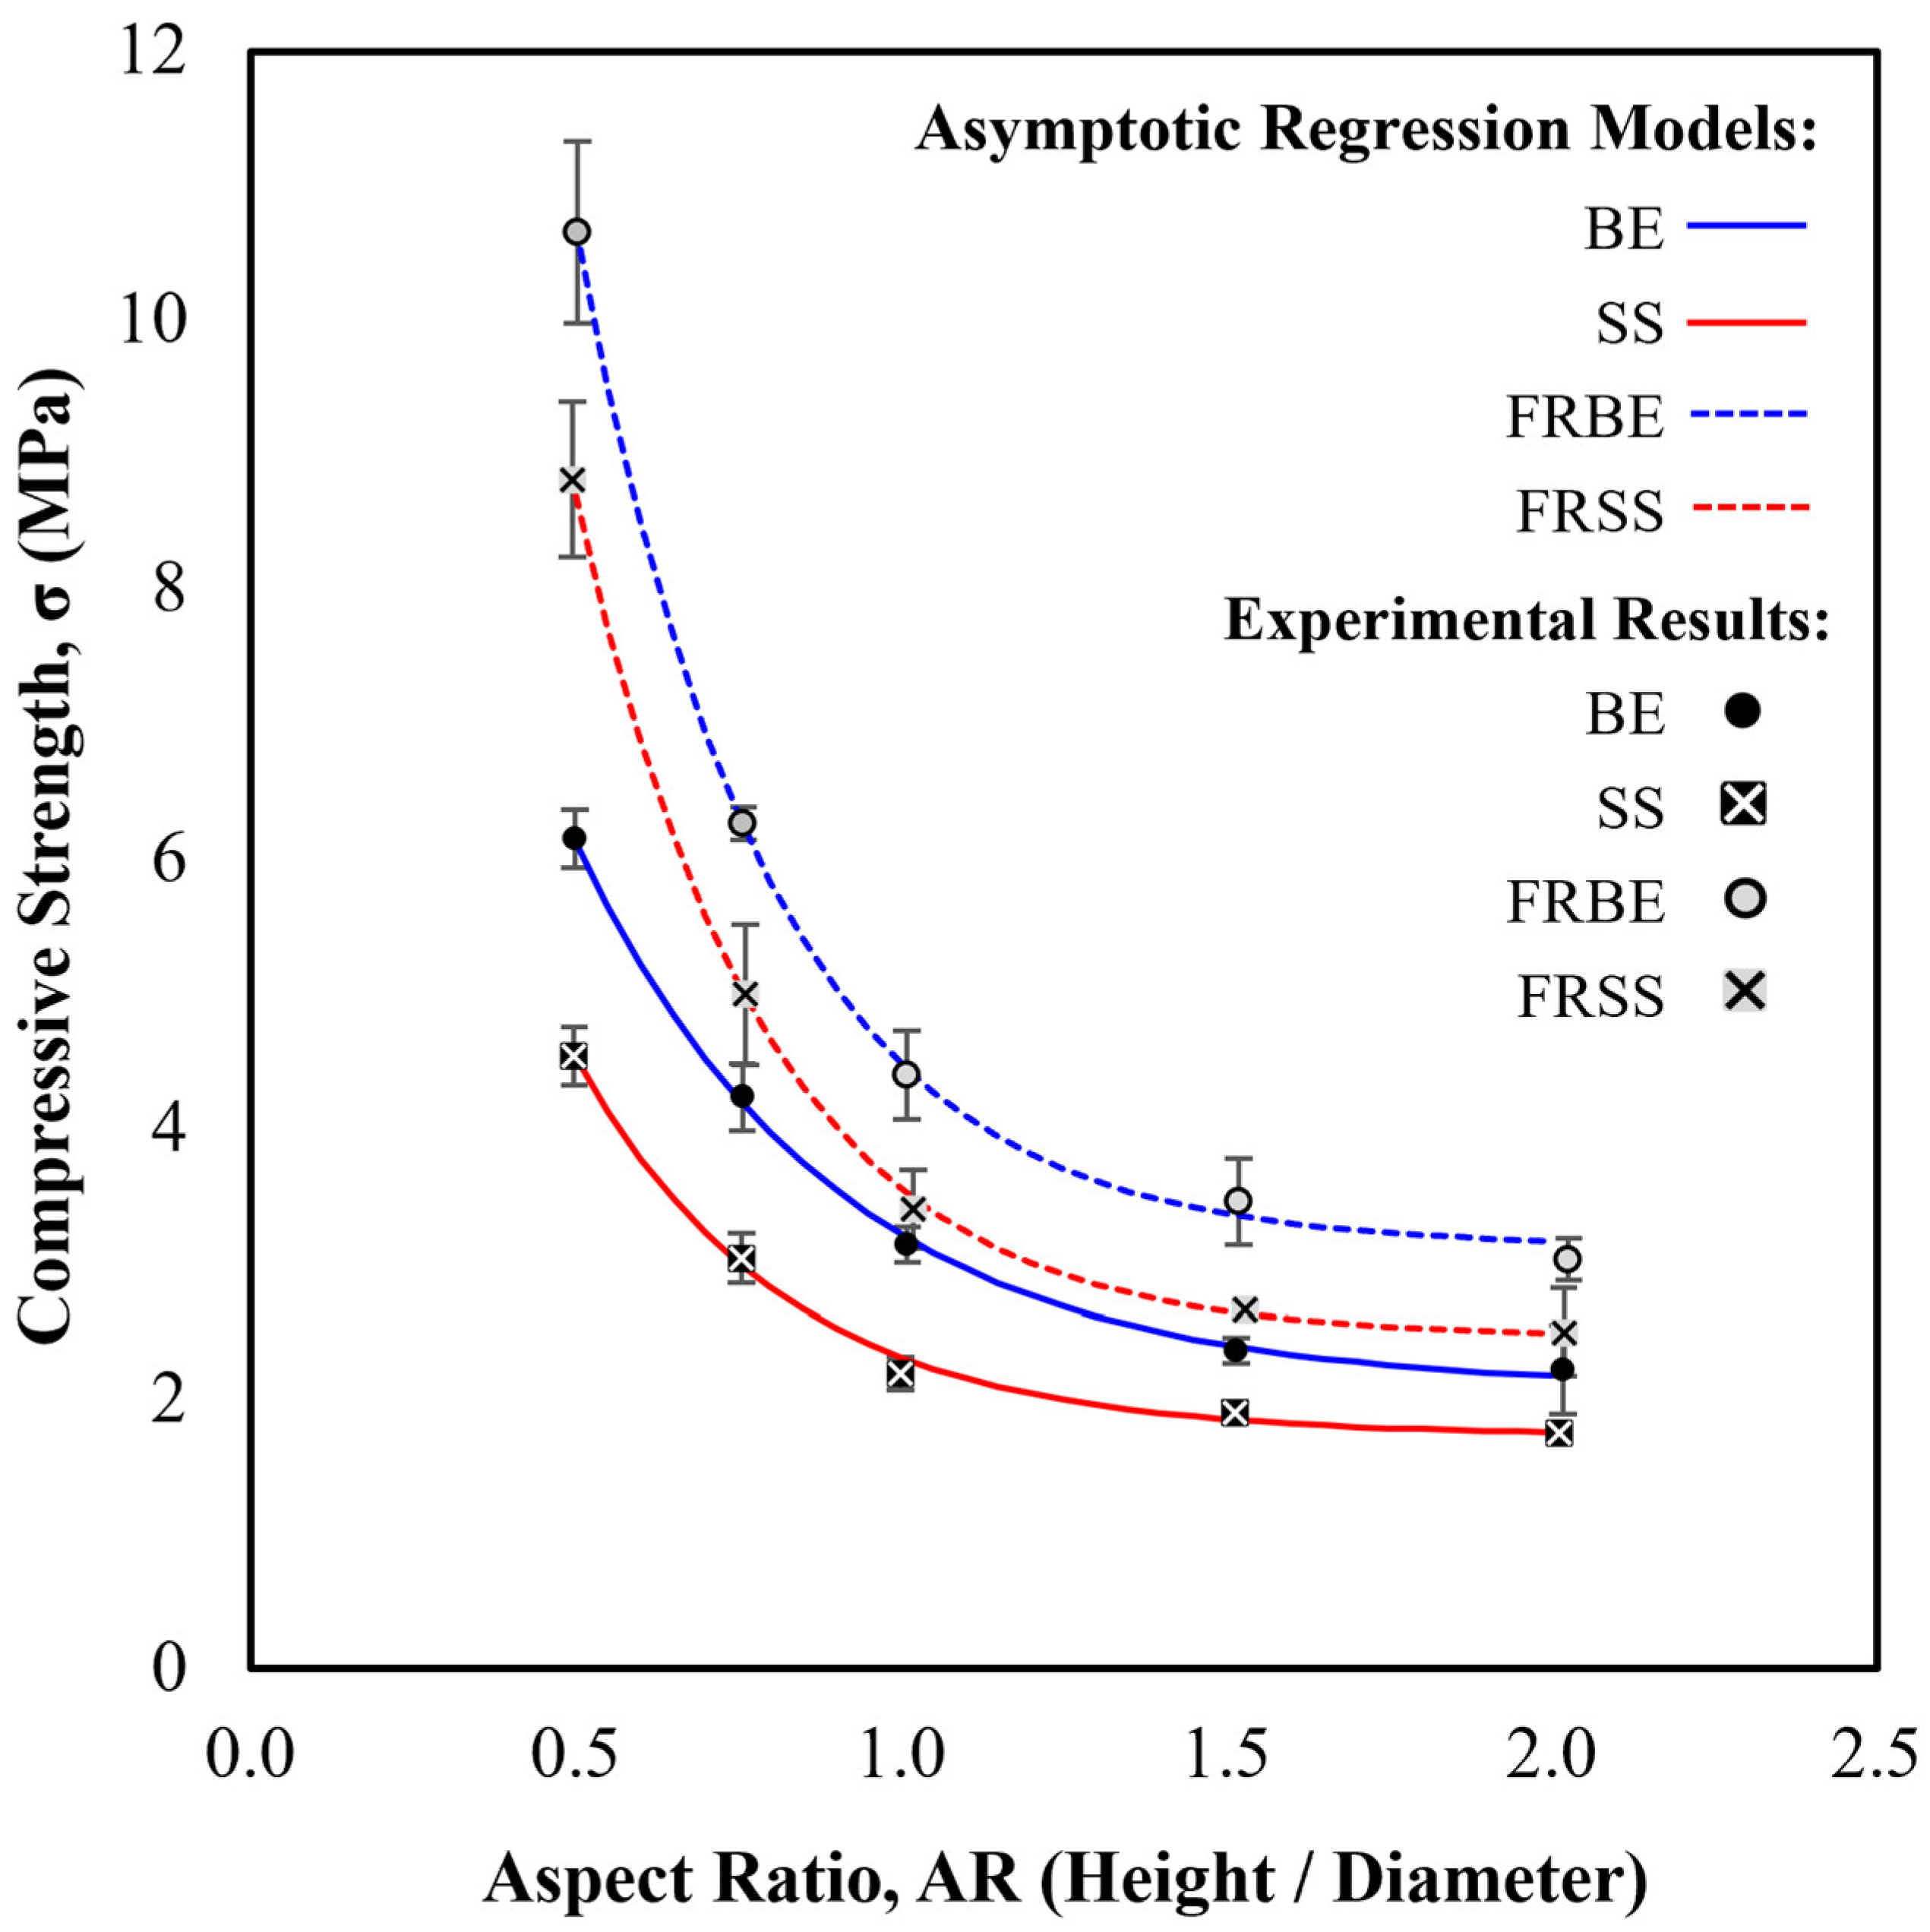
Figure 9.
Photos showing the failure of cylindrical samples at different aspect ratios. Illustrations of satisfactory failure modes obtained from BS EN 12390-3:2019 [46].
Figure 9.
Photos showing the failure of cylindrical samples at different aspect ratios. Illustrations of satisfactory failure modes obtained from BS EN 12390-3:2019 [46].
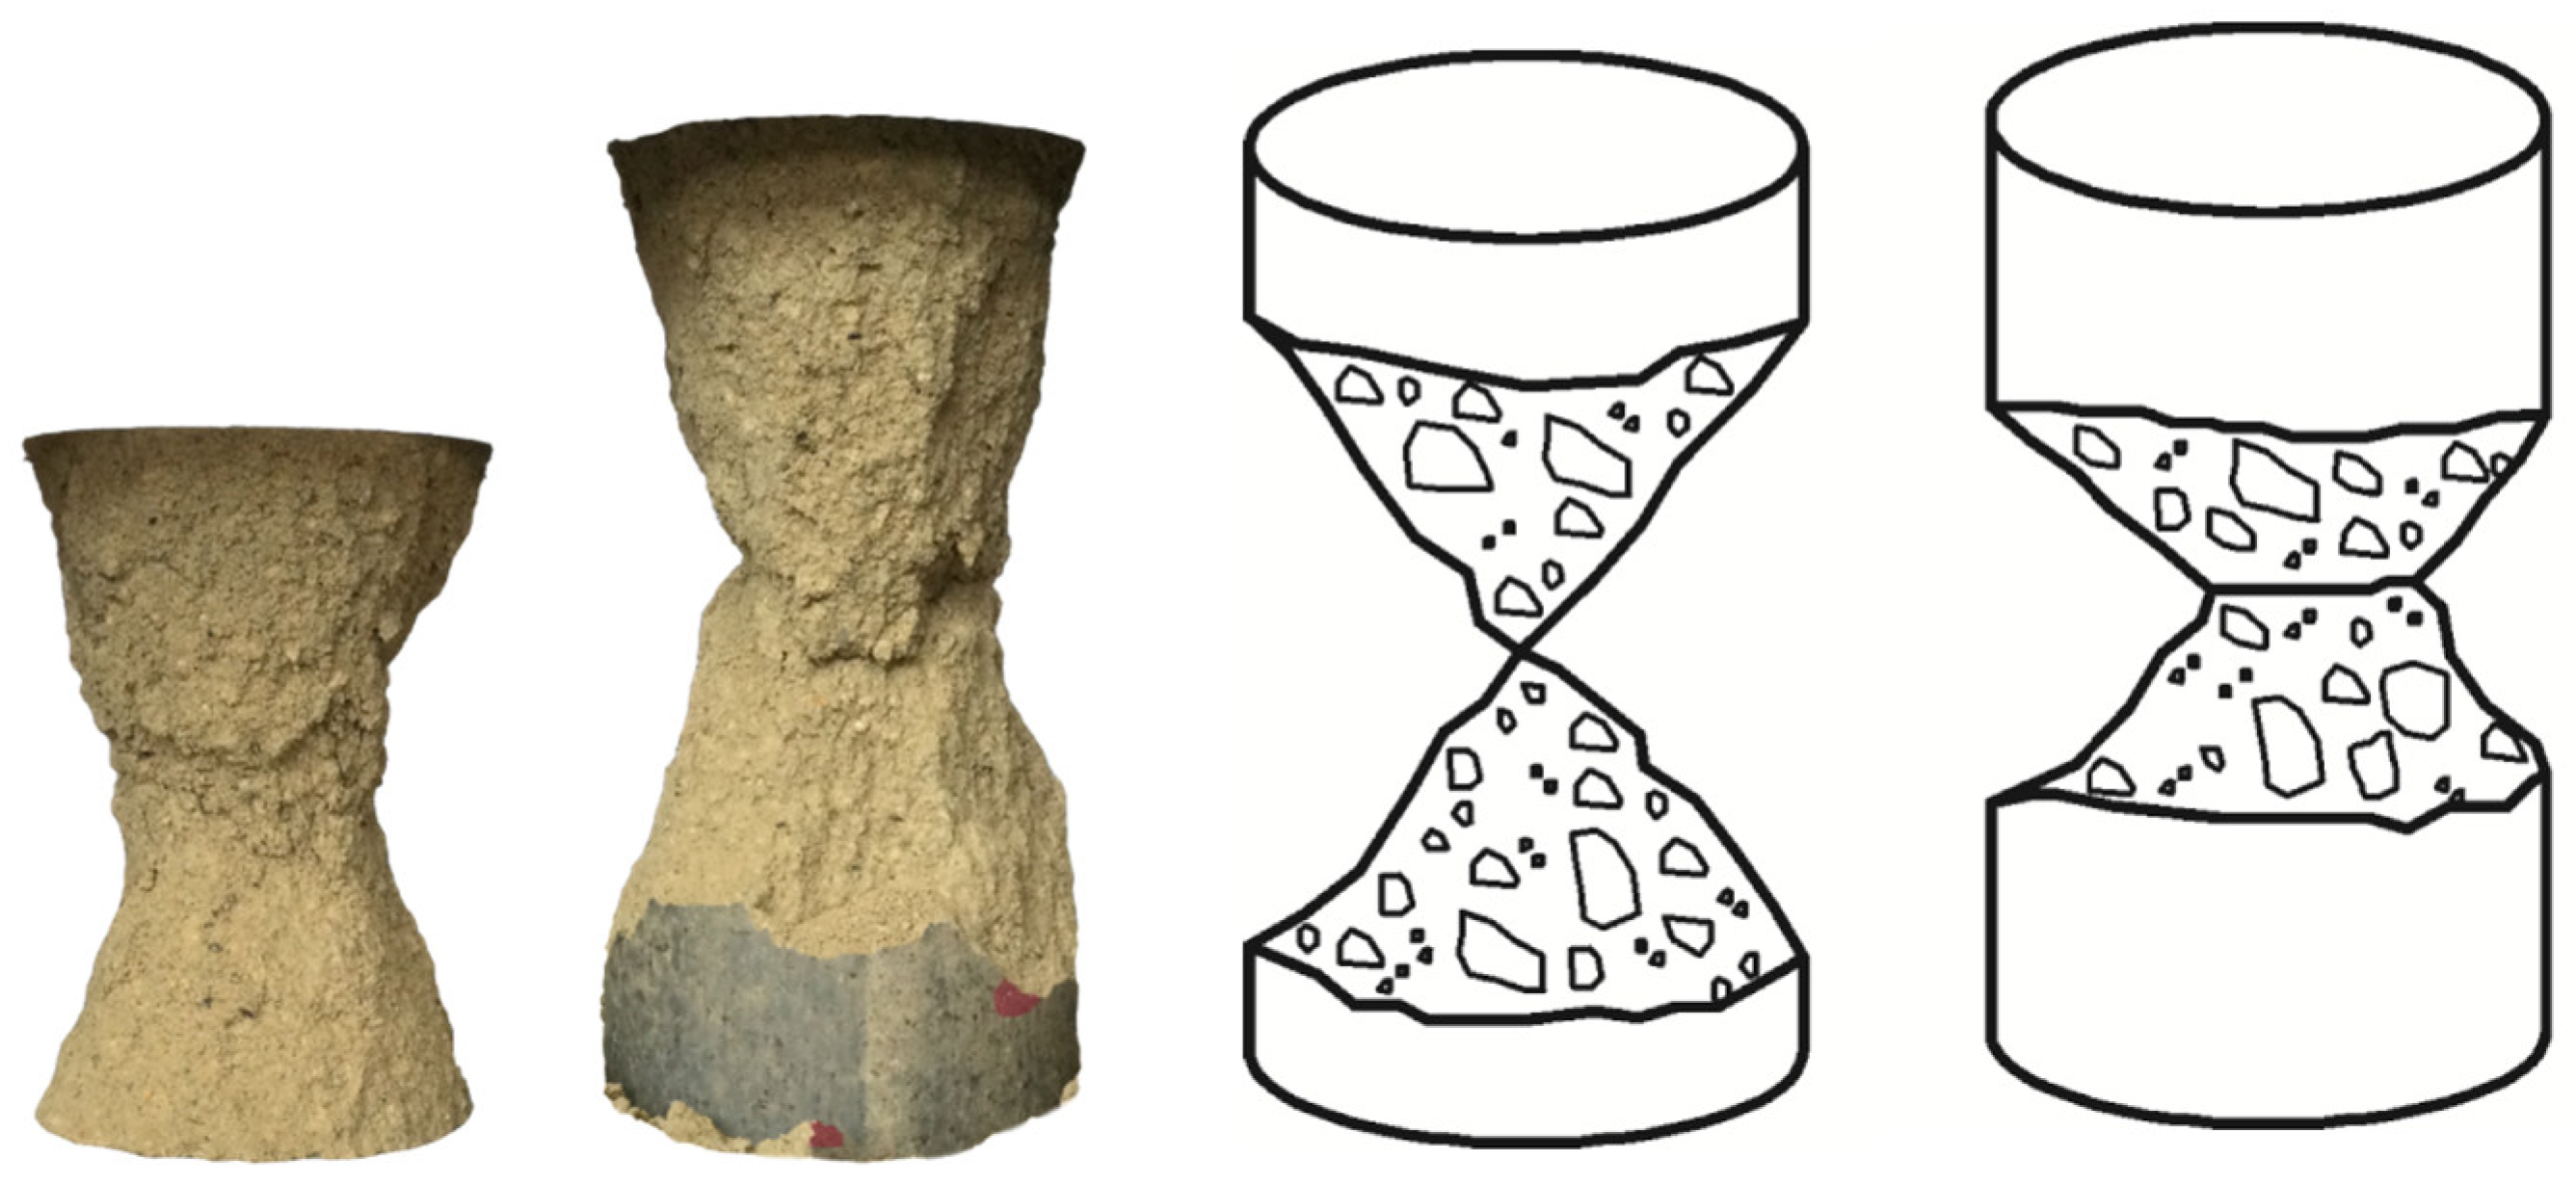
Figure 11.
Compressive Strength vs Aspect Ratio of CECs: Comparison of Experimental Results and Hypothesis of Intersecting Cones. Datapoints show the average (mean) value obtained from experimental analysis. Error bars show ± standard deviation (n = 5).
Figure 11.
Compressive Strength vs Aspect Ratio of CECs: Comparison of Experimental Results and Hypothesis of Intersecting Cones. Datapoints show the average (mean) value obtained from experimental analysis. Error bars show ± standard deviation (n = 5).
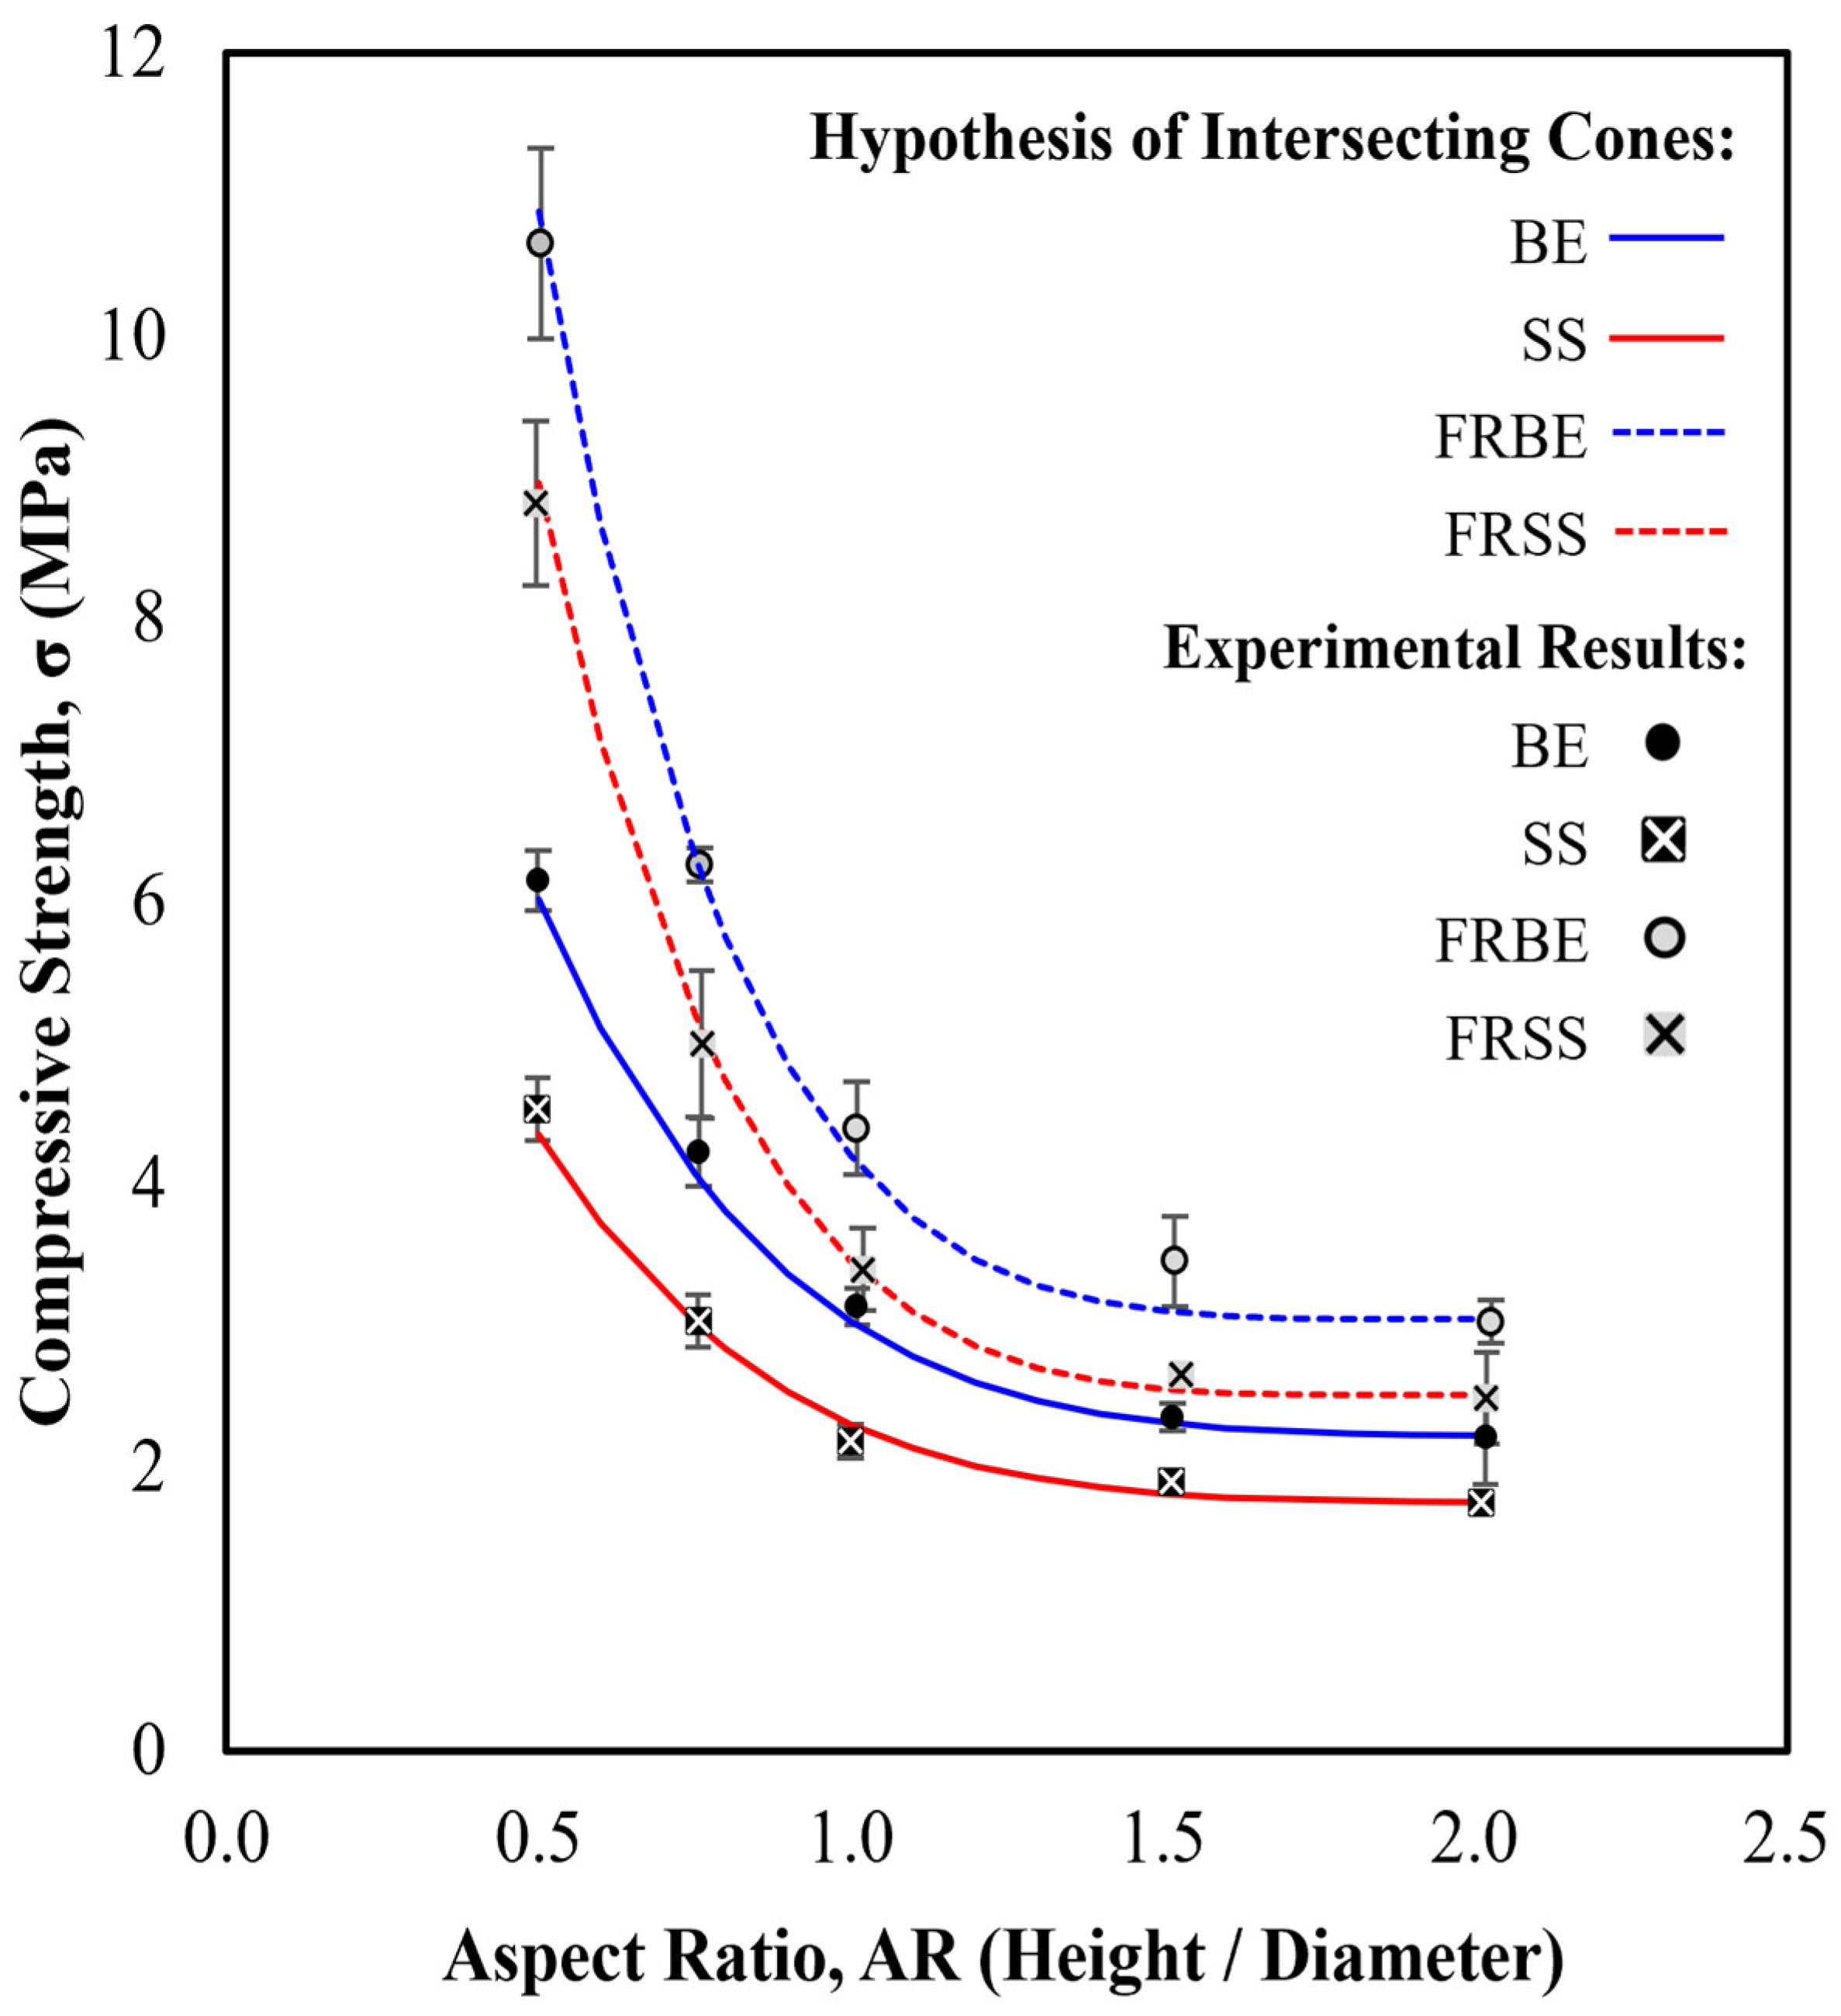
Figure 12.
Mean Compressive Strength from Experimental Analysis vs Predicted Compressive Strength from Asymptotic Regression Models (A) and Hypothesis of Intersecting Cones (B).
Figure 12.
Mean Compressive Strength from Experimental Analysis vs Predicted Compressive Strength from Asymptotic Regression Models (A) and Hypothesis of Intersecting Cones (B).
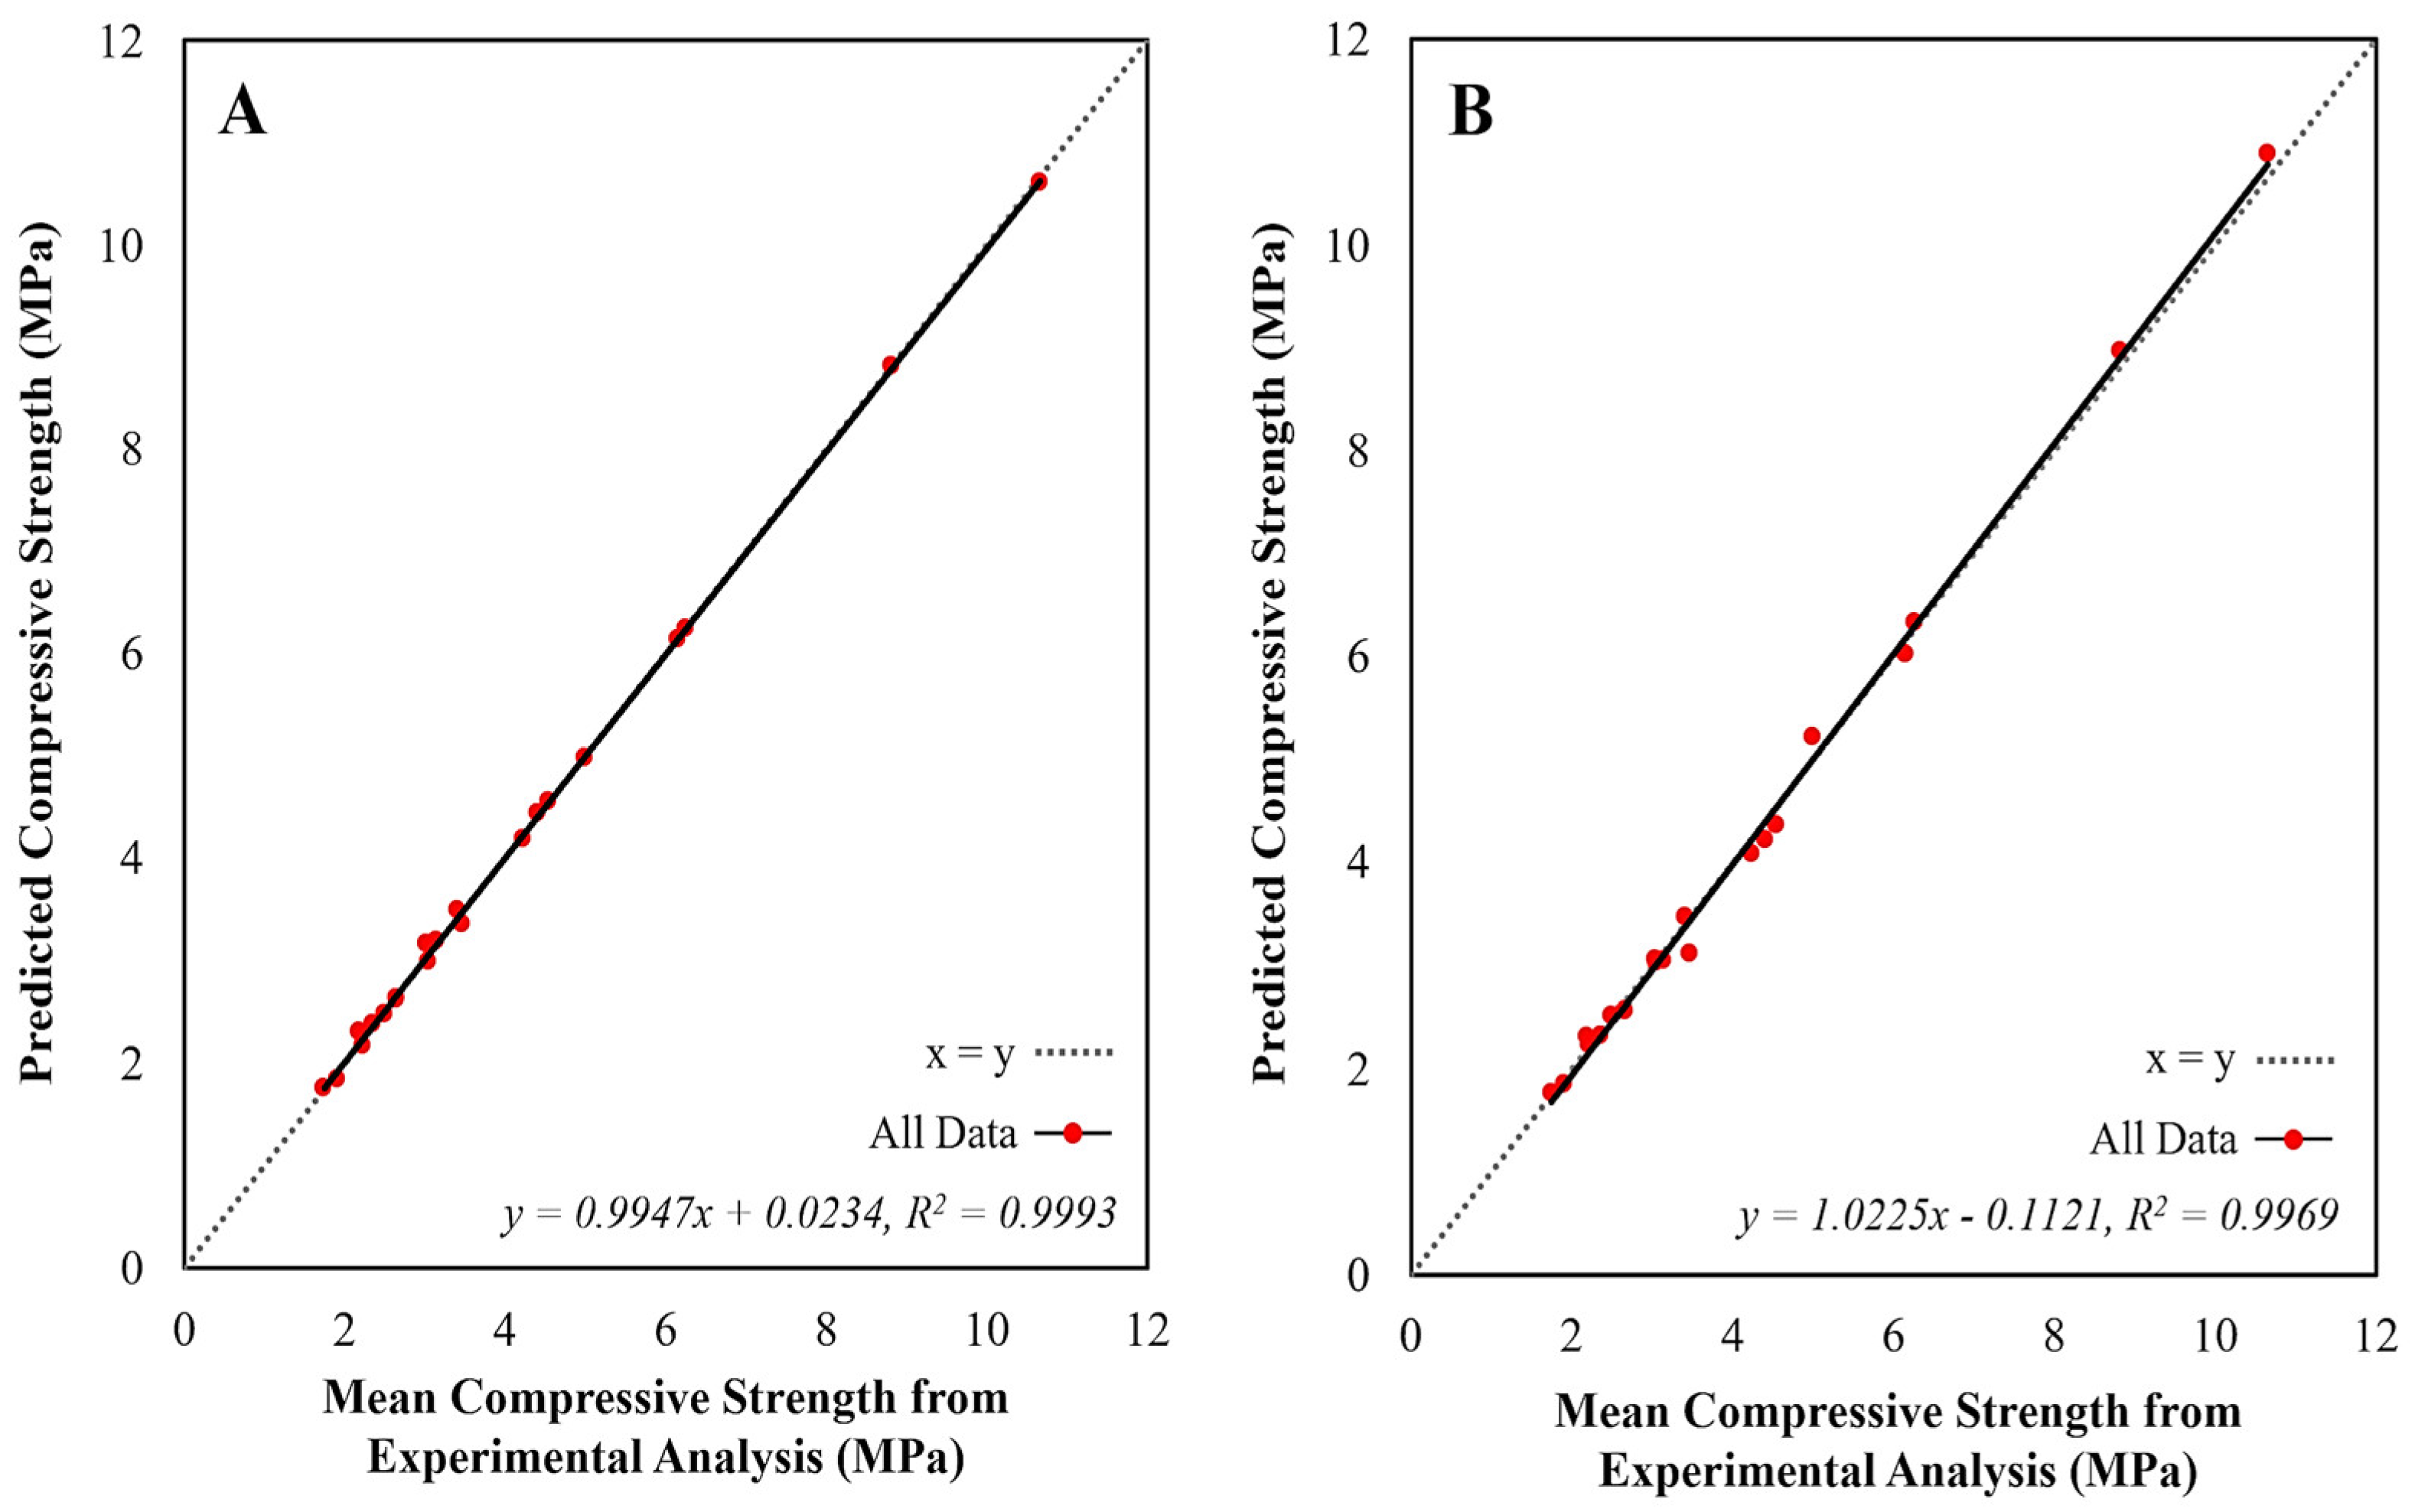
Figure 13.
Correction factor vs aspect ratio of BE and SS specimens (A), FRBE and FRSS specimens (B), and comparison with existing correction factors (C). References: [i] stabilised compressed earth blocks [50], [ii] stabilised compressed earth blocks [31], [iii] rammed earth cylinders [68], [iv] concrete cylinders [72] and [v] concrete cylinders [70].
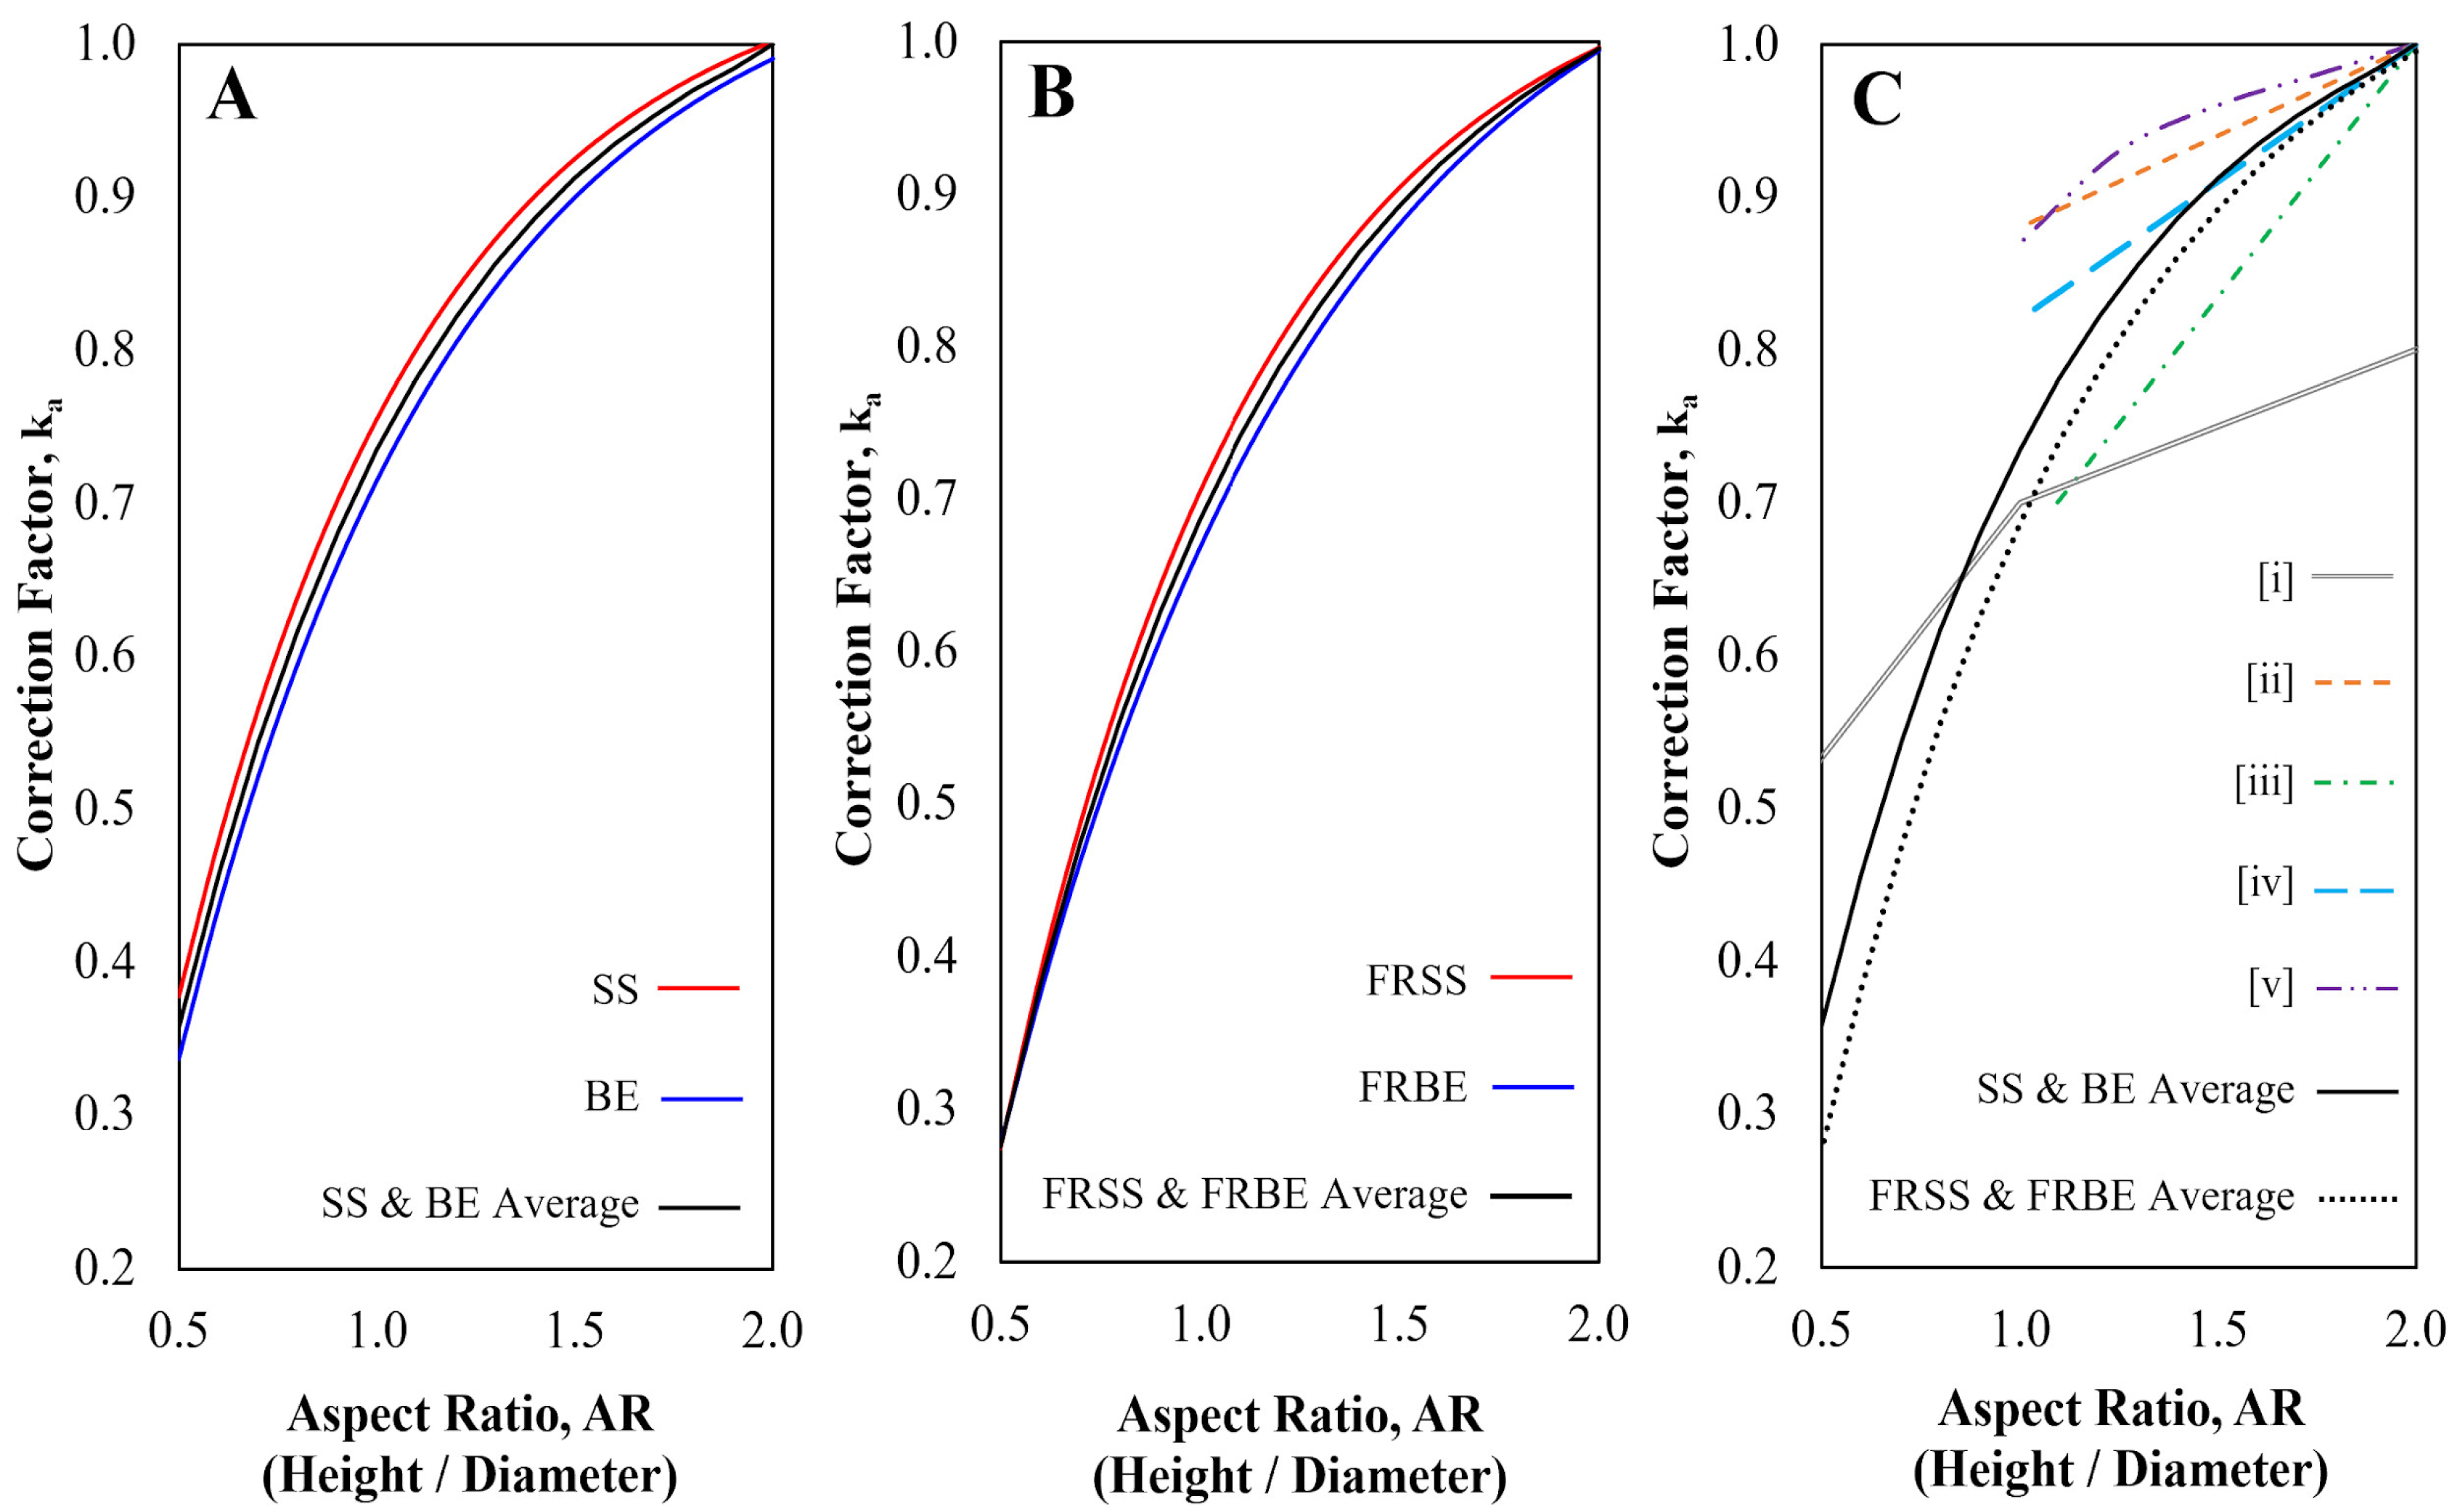
Figure 14.
Mean compressive strength of CECs and CEBs vs aspect ratio. Each line represents the statistically validated Mean Regression Model for the CECs, which exhibited a Coefficient of Determination (R2) greater than 0.999 and an RMSE of <0.0039. The horizontal line for each CEB represents its measured mean strength, used to determine the point of intersection for the conversion factor.
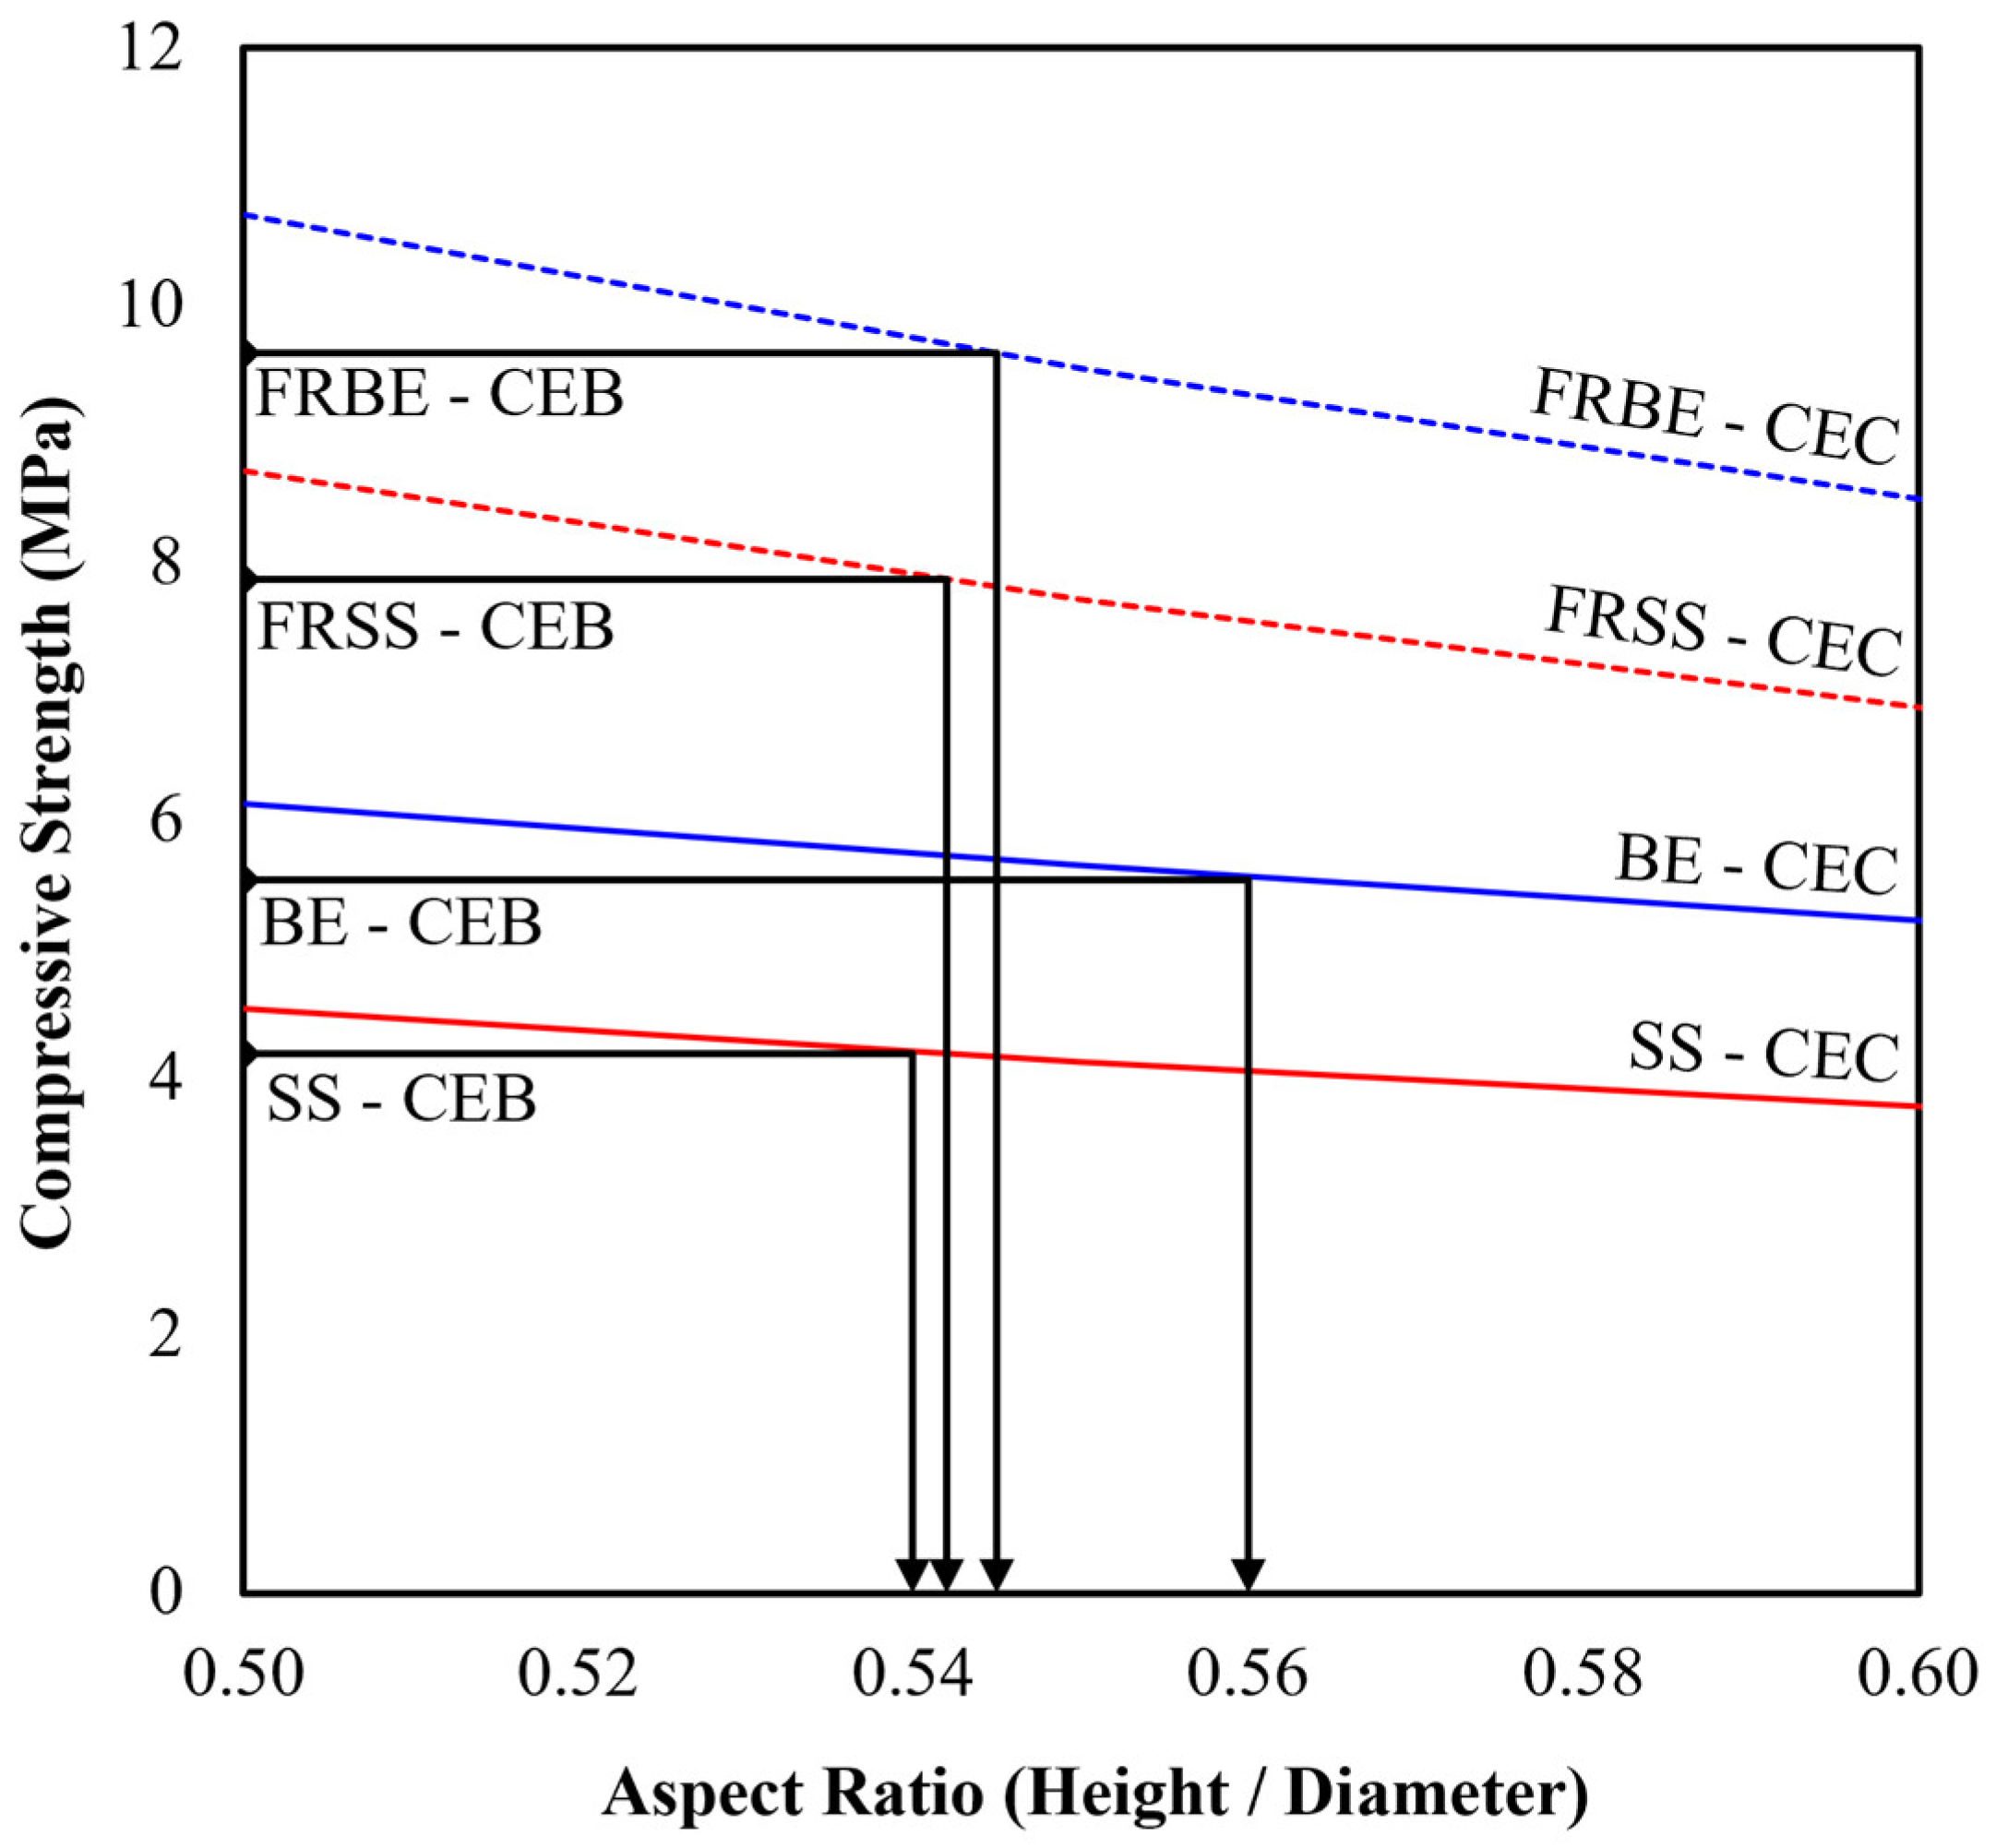

Table 1.
Common Dimensions of Compressed Earth Blocks [adapted from 3].
| Block Dimensions (mm) | Aspect Ratio (H/W) | Reference | ||
| Length (L) | Width (W) | Height (H) | ||
| 295 | 140 | 125 | 0.89 | [54] |
| 305 | 143 | 105 | 0.73 | [55] |
| 290 | 140 | 100 | 0.71 | [56] |
| 300 | 140 | 100 | 0.71 | [57] |
| 300 | 150 | 100 | 0.67 | [58] |
| 295 | 140 | 90 | 0.64 | [59] |
| 300 | 150 | 95 | 0.63 | [30] |
| 203 | 191 | 121 | 0.63 | [60] |
| 295 | 145 | 90 | 0.62 | [61] |
| 305 | 152 | 89 | 0.59 | [62] |
| 320 | 150 | 80 | 0.53 | [63] |
Table 2.
Aspect ratio correction factors for cylindrical test samples obtained from [3].
Table 2.
Aspect ratio correction factors for cylindrical test samples obtained from [3].
| Material | Diameter (mm) | Aspect Ratio (H/D) | Correction Factor | Reference |
| Rammed Earth | 150 | 2.00 | - | [68] |
| 100 | 2.00 | - | ||
| 105 | 1.10 | 0.70 | ||
| Soil-Cement Cylinders | 71.1 | 2.00 | - | [69] |
| 101.6 | 1.15 | 0.91 | ||
| ASTM: Cylindrical Concrete Specimens | 150 | 1.80 | - | [70] |
| 1.75 | 0.98 | |||
| 1.50 | 0.96 | |||
| 1.25 | 0.93 | |||
| 1.00 | 0.87 | |||
| ASTM: Concrete Core Samples | ≥ 94 | 1.80 | - | [71] |
| 1.75 | 0.98 | |||
| 1.50 | 0.96 | |||
| 1.25 | 0.93 | |||
| 1.00 | 0.87 | |||
| British Standards Institution: Concrete Core Samples | 75 | 2.00 | - | [72] |
| 1.00 | 0.82 |
Table 3.
Properties of Kent Brick Earth and British Standard BS8601 Subsoil [3].
Table 3.
Properties of Kent Brick Earth and British Standard BS8601 Subsoil [3].
| Properties | Soil Type | |
|
Soil A: Kent Brick Earth with Marine Sand |
Soil B: BS 8601 Subsoil |
|
| Proctor Test | ||
| Optimum Moisture Content (%) | 13.6 | 17.5 |
| Maximum Dry Density (kg/m3) | 1900 | 1680 |
| Atterberg Limits | ||
| Liquid Limit LL (%) | 26.3 | 33.7 |
| Plastic Limit PL (%) | 15.3 | 25.9 |
| Soil Classification | ||
| Unified Soil Classification System | CL | ML |
| Particle Size Distribution | ||
| Gravel (> 2.0 mm) (%) | 0.0 | 0.0 |
| Sand (2.0 – 0.063 mm) (%) | 38.8 | 68.0 |
| Silt (0.063 – 0.002 mm) (%) | 50.1 | 15.0 |
| Clay (<0.002 mm) (%) | 11.1 | 17.0 |
Table 4.
Average Properties of Jute Yarn [4].
Table 4.
Average Properties of Jute Yarn [4].
| Property: | Value: |
| Number of Bast Fibre Bundles Per Yarn | 119 |
| Density (kg/m3) | 1122 |
| Cross-Sectional Area (mm2) | 0.2 |
| Tensile Strength (N/mm2) | 248 |
| Natural Moisture Content Under Ambient Conditions (20 oC, 58 % Relative Humidity) |
13 |
| Time to Reach Fibre Saturation (Minutes) | 50 |
| Moisture Absorption at Saturation (%) | 205 |
| Cross-Sectional Swelling at Saturation (%) | 19 |
Table 5.
Mix design sample references and dimensions.
|
Sample Dimensions |
Illustration | Aspect Ratio* | Mix Design Sample Reference | |||
| BE | FRBE | SS | FRSS | |||
|
Kent Brick Earth |
Fibre Reinforced Kent Brick Earth |
BS8601 Subsoil |
Fibre Reinforced BS8601 Subsoil | |||
| 150 mm (L) × 75 mm (W) × 50 mm (H) |  |
0.67 | BE-CEB | FRBE-CEB | SS-CEB | FRSS-CEB |
| 21.8 mm (H) × 43.6 mm (ø) |  |
0.50 | BE-0.50 | FRBE-0.50 | SS-0.50 | FRSS-0.50 |
| 32.7 mm (H) × 43.6 mm (ø) |  |
0.75 | BE-0.75 | FRBE-0.75 | SS-0.75 | FRSS-0.75 |
| 43.6 mm (H) × 43.6 mm (ø) |  |
1.00 | BE-1.00 | FRBE-1.00 | SS-1.00 | FRSS-1.00 |
| 65.4 mm (H) × 43.6 mm (ø) |  |
1.50 | BE-1.50 | FRBE-1.50 | SS-1.50 | FRSS-1.50 |
| 87.2 mm (H) × 43.6 mm (ø) |  |
2.00 | BE-2.00 | FRBE-2.00 | SS-2.00 | FRSS-2.00 |
*Aspect Ratio = Height / Smallest Lateral Dimension (Width of Block or Diameter of Cylinder)
Table 6.
Aspect Ratio and Dry Density of Compressed Earth Cylinders.
| Sample Reference | Aspect Ratio (Target vs Actual) |
Dry Density (kg/m3) |
||||
| 0.50 | 0.75 | 1.00 | 1.50 | 2.00 | ||
| BE | 0.50 | 0.76 | 1.01 | 1.52 | 2.02 | 1926 ± 18 |
| FRBE | 0.50 | 0.76 | 1.01 | 1.52 | 2.02 | 1911 ± 13 |
| SS | 0.50 | 0.76 | 1.00 | 1.51 | 2.01 | 1718 ± 22 |
| FRSS | 0.50 | 0.76 | 1.02 | 1.53 | 2.02 | 1685 ± 28 |
| Average (mean) value ± standard deviation n = 25 (Dry Density). | ||||||
Table 7.
Statistical analysis of correction factors. Columns with different letters (A&B) are significantly different from each other at p-value < 0.05 (5%).
Table 7.
Statistical analysis of correction factors. Columns with different letters (A&B) are significantly different from each other at p-value < 0.05 (5%).
| Aspect Ratio | Sample Reference | |||
| SS | BE | FRSS | FRBE | |
| 0.50 | A | A | B | B |
| 0.75 | A | A | B | B |
| 1.00 | A | A | B | B |
| 1.50 | A | A | A | A |
| 2.00 | A | A | A | A |
Table 8.
Properties of Compressed Earth Blocks.
| Sample Reference | Aspect Ratio | Dry Density (kg/m3) | Compressive Failure Stress (MPa) |
| BE | 0.63 | 1951.9 ± 15.4 | 5.53 ± 0.33 |
| FRBE | 0.62 ± 0.01 | 1934.0 ± 14.2 | 9.64 ± 0.74 |
| SS | 0.64 | 1701.3 ± 10.3 | 4.19 ± 0.21 |
| FRSS | 0.65 | 1658.3 ± 8.8 | 7.87 ± 0.46 |
| Average (mean) value ± standard deviation, whereby n = 3. | |||
Disclaimer/Publisher’s Note: The statements, opinions and data contained in all publications are solely those of the individual author(s) and contributor(s) and not of MDPI and/or the editor(s). MDPI and/or the editor(s) disclaim responsibility for any injury to people or property resulting from any ideas, methods, instructions or products referred to in the content. |
© 2025 by the authors. Licensee MDPI, Basel, Switzerland. This article is an open access article distributed under the terms and conditions of the Creative Commons Attribution (CC BY) license (http://creativecommons.org/licenses/by/4.0/).
Copyright: This open access article is published under a Creative Commons CC BY 4.0 license, which permit the free download, distribution, and reuse, provided that the author and preprint are cited in any reuse.


