
Submitted:
02 December 2025
Posted:
04 December 2025
You are already at the latest version
Abstract
This paper assesses the steady-state voltage impact of ultra-fast electric vehicle (EV) charging on the IEEE 33-bus radial distribution feeder. Four practical scenarios are examined by combining two penetration levels (6 and 12 charging points, representing approximately 20% and 40% of PQ buses) with two charger ratings (1 MW and 350 kW per point). Candidate buses for EV station integration are selected through a nodal voltage–reactive sensitivity ranking (∂V/∂Q), prioritizing electrically robust locations. To capture realistic operating uncertainty, a 24-hour quasi-static time-series power-flow study is performed using Monte Carlo sampling, which jointly models residential-demand variability and stochastic EV charging activation. Whenever the expected minimum-hourly voltage violates the 0.95 p.u. threshold, a closed-form sensitivity-guided reactive compensation is computed and injected at the critical bus, and the power flow is re-solved. Results show that ultra-fast charging can produce sustained under-voltage even under robust siting, particularly at high penetration and 1 MW ratings; however, the proposed compensation consistently raises the minimum-voltage trajectory by about 0.03–0.12 p.u., substantially reducing the depth and duration of violations. The cross-case comparison confirms that lowering unit charger power mitigates voltage degradation and reactive-support requirements, while charger clustering accelerates stability-margin depletion. Overall, the Monte Carlo V–Q sensitivity framework provides a lightweight and reproducible tool for probabilistic voltage-stability assessment and targeted mitigation in EV-rich distribution networks.
Keywords:
electric vehicles
; V–Q sensitivity
; reactive power compensation
; Monte Carlo simulation
; voltage stability
1. Introduction
In recent decades, the adoption of climate-friendly technologies—particularly in the transportation sector—has accelerated due to growing concerns about climate change and the need to reduce greenhouse-gas emissions [1]. In this context, electric vehicles (EVs) have emerged as an effective and practical alternative to decrease fossil-fuel dependence and associated pollution [2]. Nevertheless, large-scale EV integration also introduces significant operational challenges for distribution grids, especially regarding voltage stability [3].
EV charging represents a highly volatile and time-dependent demand. When deployed at scale, this additional load may distort nodal voltage profiles and increase the risk of sustained under-voltage conditions, particularly during peak hours [4]. These effects are exacerbated in urban distribution systems with aged infrastructure and limited resilience to rapid demand variations [5]. Therefore, robust planning strategies are required to ensure that EV charging expansion does not compromise service quality and system security.
Probabilistic simulation has become a key tool to quantify the impact of uncertain and stochastic EV charging behavior on distribution-system voltage stability. Among these approaches, the Monte Carlo method has been widely adopted to model demand uncertainty and to evaluate EV integration under multiple operating scenarios [6]. By sampling realistic variations in load and charging activation, Monte Carlo-based assessments provide a more representative picture of voltage-risk exposure over daily operation.
1.1. Literature Review
A substantial body of research has investigated the effects of EV penetration on voltage stability in distribution networks. In [7], the authors show that uncontrolled EV charging can trigger significant voltage fluctuations and may lead to critical voltage collapse in weak buses if mitigation strategies are not implemented. Similarly, the study in [8] analyzes EV penetration under different demand levels and demand-side management strategies, concluding that controlled load shifting and demand response can mitigate voltage deviations and improve system stability.
Other works emphasize the relevance of probabilistic tools. The authors of [9] analyze EV integration using Monte Carlo-based patterns and demonstrate that voltage regulation improves when dynamic reactive power compensation and load-management schemes are included. Likewise, [10] highlights the need for stochastic approaches to capture uncertainty in EV charging profiles and to build robust multi-scenario evaluations. The Monte Carlo formulation proposed in [11] accounts for EV location, charging demand, and time-of-use patterns, showing that charging uncertainty introduces notable voltage volatility that requires appropriate mitigation techniques.
Monte Carlo-based evaluations have also been applied to both rural and urban networks. In [12], the authors conclude that distribution systems with higher operational flexibility and storage capability are inherently more resilient to EV integration. The work in [13] studies IEEE benchmark feeders under 30%, 50%, and 70% EV penetration, reporting increased power losses and significant voltage-profile degradation as penetration grows, while also estimating associated CO2 benefits. Analytical approaches have further explored voltage stability enhancement with EV support. For instance, [14] derives analytical relationships between EVs and microgrids and applies eigenvalue-based stability monitoring in MATPOWER, revealing that coordinated EV integration can improve voltage profiles in certain operating conditions.
Comprehensive reviews in [15] summarize power-quality issues linked to EV charging, including voltage imbalance, harmonic distortion, and transformer thermal stress, and propose mitigation measures such as active filters and FACTS devices. Advances in modeling the spatio-temporal distribution of EV demand are discussed in [16], where a coupled “vehicle–load–road” framework shows that high charging-density areas may cause localized voltage drops. Real-network studies such as [17] confirm that penetration levels around 40% can produce under-voltage violations and line overloads, motivating sensitivity-based reactive compensation. Additional probabilistic and coordinated-charging studies, including [18,19,20,21,22], consistently show that voltage risks rise with penetration, while mitigation through smart charging and reactive support becomes increasingly necessary.
Despite these contributions, two practical gaps remain: (i) many studies quantify voltage degradation under EV penetration but do not explicitly guide the robust placement of ultra-fast charging stations, and (ii) reactive support is often optimized through iterative or heuristic techniques rather than computed directly from voltage–reactive sensitivity. This motivates a probabilistic, sensitivity-guided methodology that simultaneously addresses charging uncertainty, placement robustness, and targeted voltage support.
1.2. Problem Statement and Contributions
The growing penetration of EV charging stations in distribution grids poses a technical challenge for maintaining voltage stability in steady state [23]. In particular, simultaneous operation of multiple ultra-fast chargers may produce significant voltage drops at specific buses, jeopardizing compliance with typical operational limits (e.g., p.u.).
In this study, steady-state voltage stability is assessed through minimum-voltage behavior over a 24-hour operation horizon, considering both residential demand uncertainty and stochastic EV charging activation. To capture such uncertainty, the Monte Carlo method is employed to generate multiple hourly operating scenarios and to compute statistical voltage indicators. Additionally, a V–Q sensitivity analysis based on coefficients is used to identify robust buses for charger installation and to compute the reactive power required to restore voltages toward 1 p.u. when under-voltage is detected.
The main contributions of this work are summarized as follows:
- A probabilistic hourly assessment of voltage stability in an IEEE 33-bus distribution system under uncertain residential load and stochastic EV ultra-fast charging.
- A sensitivity-based criterion to locate EV charging points at the most robust buses using the auto-sensitivity values of .
- A direct reactive power compensation scheme computed from V–Q sensitivity to support the most critical buses and mitigate under-voltage conditions.
- A comparative evaluation of two penetration levels (6 and 12 charging points) and two charging-power ratings (1 MW and 350 kW), quantifying how these practical configurations affect voltage stability and compensation needs.
The remainder of the paper is organized as follows. Section 2 describes the Monte Carlo formulation adopted for uncertainty modeling. Section 3 presents the proposed methodology, including sensitivity analysis and compensation strategy. Section 4 discusses the results for all penetration and power scenarios. Finally, Section 5 concludes the paper and outlines future research directions.
2. Monte Carlo–Based Uncertainty Modeling
Monte Carlo (MC) simulation is a stochastic computational technique that relies on random sampling to estimate numerical outcomes in complex systems [24]. It is especially suitable for power-distribution studies where both load demand and EV charging behavior are uncertain and time-varying. In this work, MC is used to generate multiple plausible hourly operating scenarios, allowing the statistical characterization of voltage stability under EV ultra-fast charging [13].
2.1. Basic Monte Carlo Procedure
In general terms, a Monte Carlo assessment follows four main steps [13]:
- Problem-domain definition: Establish the set of system parameters, operating constraints, and uncertainty sources to be represented.
- Random sampling: Generate random inputs according to prescribed probability distributions that reflect realistic variability.
- Scenario simulation: For each random realization, solve the system model (here, power flow) to obtain the corresponding outputs.
- Statistical post-processing: Aggregate all simulations to compute mean values, variances, confidence intervals, and risk indicators.
2.2. Mathematical Formulation
Let X be a random vector representing uncertain system inputs (e.g., hourly residential demand scaling factors and EV charging activation). For a given hour, Monte Carlo generates N independent samples , . Each sample is mapped through the power-flow operator to yield the output vector , i.e.,
For any scalar performance metric Y (e.g., minimum system voltage ), the MC estimator of the expected value is [13]:
The sample variance is computed as:
Assuming approximately normal sampling behavior for when N is sufficiently large, a two-sided confidence interval at confidence level is given by:
where is the Student-t critical value for degrees of freedom.
2.3. Monte Carlo Modeling of EV Penetration
EV charging penetration introduces uncertainty not only in magnitude but also in the temporal coincidence of charging events. Monte Carlo methods are therefore appropriate to represent: (i) variability of background residential demand, and (ii) stochastic EV charger activation. By sampling both processes, the method quantifies the probability of under-voltage violations and the statistical dispersion of nodal voltages, enabling robust stability assessment under realistic EV growth scenarios [13].
3. Methodology
This section details the complete methodological framework adopted to quantify voltage-stability degradation caused by ultra-fast EV charging and to mitigate it through sensitivity-guided reactive support. The approach integrates (i) hourly steady-state power-flow simulation, (ii) stochastic uncertainty modeling via Monte Carlo sampling, and (iii) a nodal V–Q sensitivity analysis to both locate charging stations at robust buses and compute the reactive compensation required at the most critical buses.
3.1. Overview of the Study Framework
The IEEE 33-bus distribution system is analyzed over a 24-hour horizon. For each hour, multiple stochastic operating scenarios are generated, capturing the variability of residential demand and EV charging activation. Each scenario is solved by a power-flow calculation in MATPOWER, producing a distribution of nodal voltages. The methodology then identifies the weakest (most critical) bus and applies a local reactive power compensation computed directly from the V–Q auto-sensitivity. The compensated power flow is re-solved and compared with the uncompensated profile.
To reflect realistic deployment conditions, four representative scenarios are examined, combining two EV charging penetration levels and two ultra-fast charging power ratings:
- Case 1: 6 charging points at the 6 most robust buses (2, 19, 3, 4, 23, 5), each rated at 1 MW, consistent with emerging ultra-fast charging platforms (e.g., BYD Super e-Platform up to 1000 kW).
- Case 2: 12 charging points at the 12 most robust buses (2, 19, 3, 4, 23, 5, 24, 6, 20, 26, 27, 21), each rated at 1 MW.
- Case 3: 6 charging points at buses (2, 19, 3, 4, 23, 5), each rated at 350 kW, following ABB Terra HP specifications [25].
- Case 4: 12 charging points at buses (2, 19, 3, 4, 23, 5, 24, 6, 20, 26, 27, 21), each rated at 350 kW.
The 12-node scenarios correspond to penetration of load buses (12 out of 32 PQ buses), whereas the 6-node scenarios represent . This design enables a consistent comparison of moderate versus high EV charging density under two realistic charger power ratings.
3.2. Uncertainty Modeling with Monte Carlo
At each hour , two independent stochastic processes are modeled: hourly uncertainty in background residential demand and stochastic activation of EV ultra-fast chargers. This probabilistic representation avoids deterministic bias and yields statistical voltage-risk indicators.
1) Residential demand uncertainty. Let and denote the baseline active and reactive residential demands at hour h. A random scaling factor is applied to represent demand variability:
where, in Monte Carlo run k,
The uniform bounds are selected to emulate typical short-term residential load deviations around a nominal hourly curve.
2) Stochastic EV charging activation. Each charger located at an EV bus m is modeled by a Bernoulli random variable , which indicates whether the charger is active at hour h:
where is the empirical probability of EV charging usage at hour h. The corresponding active EV demand at bus m is:
and its reactive component is represented through a fixed charger power factor :
Thus, the total net load at bus m for sample k and hour h becomes:
For each hour, N Monte Carlo runs are performed ( in this study), producing a distribution of nodal voltages. The minimum system voltage in run k is denoted , and its hourly mean and variance are computed using (2)–(3). These statistics provide a probabilistic measure of voltage-stability risk over daily operation.
3.3. Nodal V–Q Sensitivity Analysis
To guide charger placement and to compute reactive support, a voltage–reactive sensitivity matrix is obtained through perturbation. Let be the steady-state voltage magnitude at bus i when the reactive injection at bus j is . Applying a small perturbation at bus j yields:
The diagonal term represents the auto-sensitivity of bus i, i.e., the voltage response at the same bus to its own reactive perturbation. Buses with smaller auto-sensitivity are more robust to reactive disturbances and are therefore preferred for installing ultra-fast EV charging points.
3.4. Sensitivity-Guided Reactive Compensation
For each hour h, the bus with the smallest mean voltage is identified as
If p.u., a corrective reactive injection is computed directly from the auto-sensitivity:
This expression provides a closed-form estimate of the reactive power required to restore the critical-bus voltage toward 1 p.u. The compensation is implemented in MATPOWER as a shunt susceptance added at bus , after which the power flow is re-solved to obtain the compensated voltage profile.
3.5. Algorithmic Workflow
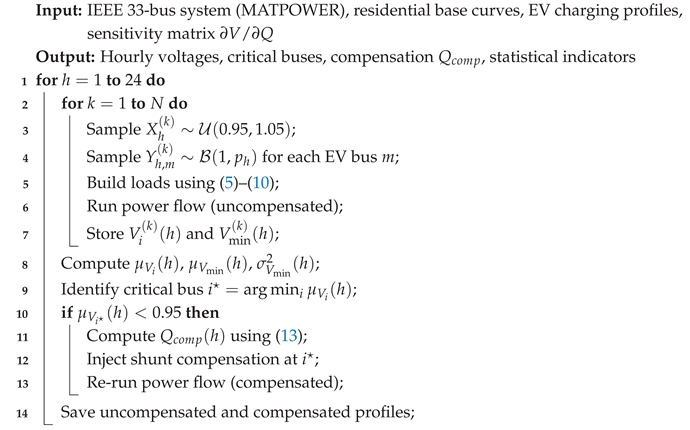
Algorithm 1 summarizes the hourly Monte Carlo simulation and the subsequent sensitivity-based compensation. The algorithm is executed sequentially for all 24 hours, producing uncompensated and compensated voltage trajectories as well as the hourly reactive support required to preserve voltage stability.
| Algorithm 1: Probabilistic voltage assessment with sensitivity-based compensation |
 |
3.6. Illustrative Flowchart
For clarity and reproducibility, Figure 1 depicts the same workflow in a compact flowchart. The diagram highlights the sequential structure: Monte Carlo sampling, uncompensated power-flow solution, statistical aggregation, detection of under-voltage, computation of , and compensated re-solution.
4. Results
This section summarizes the numerical results of the proposed probabilistic voltage-assessment framework. First, the V–Q nodal sensitivity ranking is reported to justify charger siting. Next, the four charging scenarios are analyzed in terms of minimum-hourly voltage, critical buses, and the required sensitivity-guided reactive compensation. Finally, a compact cross-case summary is provided to highlight the influence of charger rating and penetration level on voltage stability.
4.1. Nodal Sensitivity Analysis
Nodal V–Q sensitivity indicates how strongly each PQ bus voltage responds to incremental reactive-power changes. The auto-sensitivity index measures the voltage variation at a bus when reactive power is injected at that same bus. Hence, smaller values denote higher robustness, because the bus experiences weaker voltage deviations for a given reactive perturbation. This property makes low-sensitivity buses technically preferable for connecting large EV charging loads.
Figure 2 shows the auto-sensitivity values for all PQ buses of the IEEE 33-bus feeder. The lowest sensitivities are concentrated in the central–southern portion of the network, identifying electrically strong locations.
From this ranking, the robust buses selected for EV charger placement are:
- Cases 1 and 3 (6 chargers): buses 2, 19, 3, 4, 23, 5.
- Cases 2 and 4 (12 chargers): buses 2, 19, 3, 4, 23, 5, 24, 6, 20, 26, 27, 21.
Table 1 provides the full sorted list of buses by auto-sensitivity. This classification substantiates the siting strategy for the subsequent probabilistic simulations.
Overall, the sensitivity study confirms that robust-bus siting reduces the intrinsic vulnerability of the feeder to EV charging, but it does not by itself guarantee immunity to under-voltage under high-power, high-penetration conditions. This motivates the compensation analysis below.
4.2. Case 1: 6 Robust Buses, 1 MW Chargers
Case 1 evaluates moderate EV penetration using six ultra-fast chargers located at the most robust buses (2, 19, 3, 4, 23, 5). Each charger is rated at 1 MW. The objective is to quantify the resulting minimum-voltage degradation and test the proposed sensitivity-based compensation.
Hourly Minimum-Voltage Behavior
Figure 3 compares the hourly minimum system voltage before and after applying nodal compensation. Without compensation, the minimum voltage violates the 0.95 p.u. limit from hour 7 to hour 22, reaching a nadir of 0.881 p.u. at hour 11. Such a sustained infravoltage interval reflects the strong aggregated demand imposed by simultaneous 1 MW charging, even when chargers are connected to robust buses.
After injecting reactive support at the critical bus of each hour, the minimum-voltage profile improves substantially. Although the system does not recover to exactly 1 p.u., the compensated minimum remains in an acceptable range (above ≈0.926 p.u. at the most stressed hours), demonstrating effective mitigation.
Reactive Compensation Summary
Table 2 reports the stressed hours and the reactive injection required to restore voltage. Bus 18 is consistently the critical location. The required ranges from 1.56 to 2.61 Mvar, with the highest demand aligned with the daytime load peak. Negative values correspond to capacitive support in MATPOWER convention.
This case confirms that robust placement reduces but does not eliminate voltage violations under 1 MW ultra-fast charging; however, the proposed local compensation restores feasibility efficiently.
4.3. Case 2: 12 Robust Buses, 1 MW Chargers
Case 2 represents high penetration (12 ultra-fast chargers) at the most robust buses. Each unit is rated at 1 MW. This scenario stresses the feeder under dense ultra-fast charging.
Figure 4 shows that uncompensated minimum voltages collapse below 0.85 p.u. at peak hours (9–11), reaching about 0.803 p.u. Such values are close to a static voltage-collapse regime for radial feeders. With compensation, the minimum profile is lifted above 0.90 p.u. across the critical interval, validating the mitigation principle, although full recovery to 1 p.u. is limited by the magnitude of the aggregated load and network topology.
Table 3 shows that the critical bus shifts between buses 18 and 33. Under dense charging, the feeder-end bus (33) becomes dominant during the most stressed hours, requiring up to 6.35 Mvar of capacitive support.
Therefore, Case 2 evidences that high ultra-fast charging density can drive severe under-voltage and relocate weakness toward the feeder tail.
4.4. Case 3: 6 Robust Buses, 350 kW Chargers
Case 3 keeps the same moderate penetration (6 chargers) but reduces unit power to 350 kW. This isolates the effect of charger rating on voltage stability.
Figure 5 indicates that uncompensated voltages still fall below 0.95 p.u. during daytime peaks, but the valley is shallower than in Case 1 (minimum around 0.902 p.u.). Compensation restores the minimum to roughly 0.93–0.94 p.u. in the stressed interval, confirming improved resilience at lower ratings.
As reported in Table 4, the critical bus remains bus 18, yet the reactive support needed decreases, peaking at 2.29 Mvar.
4.5. Case 4: 12 Robust Buses, 350 kW Chargers
Case 4 combines high penetration (12 chargers) with the reduced unit rating of 350 kW.
Figure 6 shows sustained under-voltage from hours 6 to 22 in the uncompensated profile, with the minimum reaching 0.878 p.u. at hour 10. Although the violation is less severe than Case 2, it confirms that high penetration alone is sufficient to drive instability even at moderate power levels. Compensation lifts the valley to about 0.90–0.94 p.u.
Table 5 indicates that bus 18 remains the critical location and requires up to 2.66 Mvar, clearly below the peak need observed for 1 MW chargers.
4.6. Cross-Case Summary and Discussion
To provide a compact view of the main system-level effects, Table 6 compares the four scenarios using three stability indicators: (i) the minimum uncompensated voltage across the day, (ii) the minimum compensated voltage across the day, and (iii) the maximum reactive support required in any hour. These indicators are consistent with the profiles and hourly compensation tables reported above.
Two consistent trends emerge:
- Effect of penetration: Increasing the number of chargers from 6 to 12 deepens the voltage valley and increases the required reactive support. Under 1 MW charging, this shift is particularly severe (Case 2), and the weakest bus migrates toward the feeder end (bus 33).
- Effect of charger rating: Reducing the unit rating from 1 MW to 350 kW mitigates under-voltage and lowers compensation needs at both penetration levels. The improvement is evident when comparing Case 1 vs. Case 3 (moderate penetration) and Case 2 vs. Case 4 (high penetration).
These results confirm that robust-bus siting and sensitivity-guided local reactive compensation are complementary: siting reduces baseline vulnerability, while compensation ensures operational feasibility under stochastic high-demand charging. Moreover, limiting ultra-fast charger ratings (or enforcing smart charging profiles) appears as a practical planning lever to preserve voltage stability in distribution feeders with increasing EV adoption.
4.7. Comparison of Case 1 vs. Case 3 (6 Chargers)
Figure 7 contrasts moderate-penetration scenarios. Both cases exhibit their deepest drop around hours 9–11, but Case 3 (350 kW) increases the uncompensated minimum from 0.881 p.u. to 0.902 p.u. and yields a higher compensated minimum. Therefore, lowering unit charger power reduces both the intensity and duration of voltage violations.
4.8. Comparison of Case 2 vs. Case 4 (12 Chargers)
Figure 8 compares high-penetration scenarios. Case 2 (1 MW) produces a minimum of ∼0.80 p.u., whereas Case 4 limits the minimum to 0.878 p.u. With compensation, Case 4 sustains higher voltages and requires substantially less reactive support, reinforcing the benefit of moderate-power charging under dense deployment.
5. Discussion
This section interprets the main findings obtained from the probabilistic power-flow assessment and the sensitivity-guided reactive compensation. The discussion is organized around three central aspects: (i) the physical meaning of the V–Q sensitivity ranking and its role in charger placement, (ii) the impact of EV charging power and penetration on the minimum-voltage trajectory, and (iii) the effectiveness and operational interpretation of the proposed compensation strategy under uncertainty.
5.1. Interpretation of V–Q Sensitivity and Charger Placement
The nodal sensitivity analysis based on provides a physically grounded indicator of how robust each bus is to reactive-power perturbations. Buses exhibiting low auto-sensitivity correspond to locations where a given reactive-power change produces a relatively small voltage deviation. In radial distribution systems, these buses are typically closer to the slack/substation or embedded within stronger lateral branches with lower equivalent impedance. Therefore, selecting the least sensitive buses for charger installation is consistent with conventional planning logic: new high-power loads should be allocated on electrically stiff nodes to limit voltage deterioration.
The ordered sensitivity values in Table 1 confirm a clear stratification between robust and weak buses. Importantly, even though chargers are installed only on the most robust buses, the system minimum voltage still drops below the operational threshold in all scenarios. This highlights two practical messages. First, V–Q robustness is a necessary but not sufficient condition to guarantee voltage compliance under ultra-fast charging; the cumulative loading level and feeder characteristics remain dominant. Second, the sensitivity ranking is still valuable because it delays the onset of under-voltage and reduces its depth compared to what would occur under random placement, thus providing a rational baseline for high-power infrastructure planning.
5.2. Impact of EV Charging Power and Penetration Level
A key result across the four scenarios is the systematic relationship between charging power, penetration level, and the severity of voltage violations. For a fixed number of charging points, reducing the unit charging power from 1 MW to 350 kW mitigates both the depth and duration of the minimum-voltage sag. This behavior is evident when comparing Case 1 versus Case 3 and Case 2 versus Case 4, where the lowest voltages shift upward and the under-voltage interval becomes shorter under the 350 kW rating. Physically, this is expected because voltage drops in radial feeders are proportional to the line impedance weighted by active and reactive current. Lower charging power implies lower current injection into the feeder, alleviating voltage stress.
Penetration level plays an equally strong role. The 12-charger cases (Cases 2 and 4) represent high-density EV charging, and their minimum-voltage valleys are noticeably more severe than in the 6-charger cases, even when chargers are placed on robust buses. This confirms that distribution networks can tolerate moderate ultra-fast charging only up to a certain density; beyond that, voltage compliance becomes contingent on additional control or compensation. In this sense, the 12-node cases can be interpreted as stress-test scenarios that emulate future high-adoption conditions or urban charging corridors, while the 6-node cases resemble intermediate adoption phases. The contrast between these levels provides a practical planning insight: voltage-stability margins shrink rapidly with EV clustering, and infrastructure roll-out should be coordinated with voltage-support measures.
5.3. Role of Load Uncertainty and Monte Carlo Assessment
The Monte Carlo framework clarifies that voltage stability in EV-rich feeders is not governed by a single deterministic trajectory, but rather by a distribution of possible operating states driven by residential demand variability and stochastic charger activation. The resulting minimum-voltage profiles therefore represent expected behavior under uncertainty, which is more informative for planning than a single worst-case snapshot.
Two important implications follow. First, the hours identified as critical are consistent across Monte Carlo realizations, indicating that the network has structurally vulnerable time windows where the combination of residential peak and EV coincidence is recurrent. Second, the probabilistic aggregation yields smoother and more reliable indicators of operational risk. In practice, this means that the compensation strategy is not reacting to accidental outliers but to statistically persistent under-voltage trends, which strengthens its relevance for real operation and planning.
5.4. Effectiveness of Sensitivity-Guided Reactive Compensation
The proposed compensation method uses auto-sensitivity to estimate the reactive injection required to restore voltages. Across all scenarios, the compensated profiles show a clear upward shift of the minimum-voltage curve, reducing the violation depth by several hundredths of p.u. and raising the worst-hour voltages close to, or above, the admissible band. This demonstrates that a local reactive correction, even when computed with a lightweight sensitivity-based rule, can meaningfully improve stability under ultra-fast charging stress.
A notable and consistent pattern is that the same buses emerge as critical (particularly bus 18, and bus 33 in the most stressed scenario). This is not an artifact of the algorithm, but rather a structural feature of the IEEE 33-bus feeder: weak buses tend to be electrically distant from the slack, with high cumulative impedance and heavy downstream loading. The compensation results therefore align with physical intuition: reactive power is most needed at the farthest and most voltage-sensitive ends of the feeder. From a planning perspective, this indicates that voltage-support resources (such as switched capacitors, SVCs, or inverter-based VAR support) should be prioritized at those locations when ultra-fast charging is introduced.
It is also relevant that compensation does not always restore the minimum voltage to 1 p.u., especially in the 12-charger, 1 MW case. This underscores a realistic operational interpretation: when active-power stress is high, reactive support alone can elevate voltages into an acceptable band but may not fully eliminate deviations without complementary measures such as coordinated charging, feeder reinforcement, or distributed generation support. The method therefore should be viewed as an efficient and practical corrective layer within a broader voltage-control toolkit.
5.5. Engineering Implications
Taken together, the findings provide three actionable implications for distribution operators facing large-scale EV integration:
- Placement on robust buses is beneficial but insufficient under high penetration. Sensitivity-based siting reduces risk, but feeder-wide voltage limits can still be violated if ultra-fast chargers cluster too densely.
- Limiting unit charging power eases voltage stress substantially. Switching from 1 MW to 350 kW chargers offers measurable stability gains, suggesting that mixed charging hierarchies (ultra-fast in strong nodes and fast elsewhere) can be a practical compromise.
- Reactive compensation can serve as a low-complexity stability enhancer. Sensitivity-guided VAR support improves voltage profiles without iterative optimization, enabling scalable deployment for hourly operational planning or preliminary infrastructure studies.
Overall, the proposed Monte Carlo–sensitivity framework captures both the probabilistic nature of EV demand and the physics of voltage-support needs, providing a consistent basis for assessing and mitigating voltage-stability risks in distribution systems undergoing rapid transportation electrification.
6. Conclusions
This work investigated the steady–state voltage stability of an IEEE 33-bus distribution feeder under different levels of ultra-fast EV charging, incorporating demand uncertainty and a sensitivity-driven reactive compensation scheme. The main conclusions, explicitly linked to the research objectives, are summarized as follows:
- Fulfillment of Objective 1: Probabilistic modeling of EV-demand uncertainty. The uncertainty associated with both residential demand and EV charging activation was successfully represented through an hourly Monte Carlo framework. Modeling charger usage with a binomial (Bernoulli) process and scaling residential demand via random hourly factors enabled the generation of statistically consistent operating scenarios. This approach captured the inherent variability of user behavior and load coincidence, yielding realistic distributions of nodal voltages rather than single deterministic trajectories. Consequently, the resulting voltage profiles provide a robust basis for planning and operational assessment in EV-rich distribution systems.
- Fulfillment of Objective 2: Identification of voltage-instability patterns and critical buses. By evaluating four charging scenarios with different penetration levels (6 vs. 12 chargers) and power ratings (1 MW vs. 350 kW), the study quantified how ultra-fast EV loads degrade the feeder voltage profile even when chargers are placed on robust buses. The V–Q sensitivity analysis consistently revealed bus 18 as the most critical node across all cases, and bus 33 in the most stressed scenario, confirming that voltage weakness is structurally tied to electrically remote and heavily loaded sections of the feeder. This objective was therefore met by providing a clear, physics-based localization of vulnerability and a justified selection of candidate buses for EV infrastructure.
- Fulfillment of Objective 3: Sensitivity-guided reactive compensation and voltage recovery. The proposed compensation strategy, computed directly from the auto-sensitivity terms of the matrix, was implemented hour-by-hour in MATPOWER whenever under-voltage conditions emerged. The compensated results demonstrated systematic voltage recovery: in the most critical periods, the minimum system voltage increased by approximately 0.03 p.u. to 0.12 p.u., substantially shrinking or eliminating operation below the 0.95 p.u. threshold. This confirms that a lightweight, non-iterative sensitivity rule can provide effective local VAR support under uncertainty, improving stability without the computational burden of full optimization-based methods.
- Global technical insight: Effect of charger power and penetration density. Across all scenarios, two dominant trends were verified. First, higher charging density (12 points) produces deeper and longer voltage valleys than moderate density (6 points), indicating that feeder voltage margins decrease rapidly with EV clustering. Second, reducing the unit charging power from 1 MW to 350 kW noticeably mitigates the severity and duration of infra-voltages and lowers the reactive support required for correction. Therefore, combining (i) sensitivity-based siting, (ii) controlled charger power levels, and (iii) targeted reactive compensation constitutes a technically viable pathway to preserve acceptable voltage stability in distribution networks experiencing high EV penetration.
Overall, the proposed Monte Carlo–sensitivity methodology provides a consistent and reproducible framework to quantify voltage-stability risks and to design practical mitigation actions for future distribution systems with widespread ultra-fast EV charging.
Author Contributions
All authors contributed equally to this work. All authors have read and agreed to the published version of the manuscript.
Funding
This research received no external funding. The APC was funded by the Universidad Politécnica Salesiana.
Institutional Review Board Statement
Not applicable. The study did not involve humans or animals.
Informed Consent Statement
Not applicable. The study did not involve humans.
Data Availability Statement
No new data were created or analyzed in this study. Data sharing is not applicable to this article. Simulation scripts and synthetic scenario generators used to produce the figures are available from the corresponding author on reasonable request.
Acknowledgments
Not applicable.
Conflicts of Interest
The authors declare no conflicts of interest.
Appendix A
Appendix A.1. IEEE 33-Bus Test System Description
The distribution feeder adopted in this study is the IEEE 33-bus test system, a widely used benchmark for assessing voltage-control strategies, optimization techniques, and sensitivity-based planning in radial distribution networks. The system consists of 33 buses, 32 distribution lines, and a slack bus (Bus 1) representing the main substation with regulated voltage.
Before presenting the numerical data, it is important to note that all loads are modeled as constant PQ demands. Bus 1 operates as the reference (slack) bus, while the remaining buses correspond to PQ nodes. The bus data in Table A1 include active and reactive demands, nominal voltage level, and operational voltage limits. Likewise, the line parameters in Table A3 provide the per-branch resistance and reactance used for the power-flow simulations.
Bus Data

Table A1.
Load data of the IEEE 33-bus distribution system.
| Bus | [kW] | [kVAr] | baseKV | [p.u.] | [p.u.] |
|---|---|---|---|---|---|
| 1 | 0 | 0 | 12.66 | 1.00 | 1.00 |
| 2 | 100 | 60 | 12.66 | 1.10 | 0.90 |
| 3 | 90 | 40 | 12.66 | 1.10 | 0.90 |
| 4 | 120 | 80 | 12.66 | 1.10 | 0.90 |
| 5 | 60 | 30 | 12.66 | 1.10 | 0.90 |
| 6 | 60 | 20 | 12.66 | 1.10 | 0.90 |
| 7 | 200 | 100 | 12.66 | 1.10 | 0.90 |
| 8 | 200 | 100 | 12.66 | 1.10 | 0.90 |
| 9 | 60 | 20 | 12.66 | 1.10 | 0.90 |
| 10 | 60 | 20 | 12.66 | 1.10 | 0.90 |
| 11 | 45 | 30 | 12.66 | 1.10 | 0.90 |
| 12 | 60 | 35 | 12.66 | 1.10 | 0.90 |
| 13 | 60 | 35 | 12.66 | 1.10 | 0.90 |
| 14 | 120 | 80 | 12.66 | 1.10 | 0.90 |
| 15 | 60 | 10 | 12.66 | 1.10 | 0.90 |
| 16 | 60 | 20 | 12.66 | 1.10 | 0.90 |
| 17 | 60 | 20 | 12.66 | 1.10 | 0.90 |
| 18 | 90 | 40 | 12.66 | 1.10 | 0.90 |
| 19 | 90 | 40 | 12.66 | 1.10 | 0.90 |
| 20 | 90 | 40 | 12.66 | 1.10 | 0.90 |
| 21 | 90 | 40 | 12.66 | 1.10 | 0.90 |
| 22 | 90 | 40 | 12.66 | 1.10 | 0.90 |
| 23 | 90 | 50 | 12.66 | 1.10 | 0.90 |
| 24 | 420 | 200 | 12.66 | 1.10 | 0.90 |
| 25 | 420 | 200 | 12.66 | 1.10 | 0.90 |
| 26 | 60 | 25 | 12.66 | 1.10 | 0.90 |
| 27 | 60 | 25 | 12.66 | 1.10 | 0.90 |
| 28 | 60 | 20 | 12.66 | 1.10 | 0.90 |
| 29 | 120 | 70 | 12.66 | 1.10 | 0.90 |
| 30 | 200 | 600 | 12.66 | 1.10 | 0.90 |
| 31 | 150 | 70 | 12.66 | 1.10 | 0.90 |
| 32 | 210 | 100 | 12.66 | 1.10 | 0.90 |
| 33 | 60 | 40 | 12.66 | 1.10 | 0.90 |
Slack Generator Data
The system contains a single slack generator at Bus 1. Its active and reactive power outputs are determined by the power-flow solution, subject to the reactive limits given in Table A2.
Table A2.
Slack generator limits.
| Bus | [MW] | [Mvar] | [Mvar] | [Mvar] |
|---|---|---|---|---|
| 1 | 0 | 0 | 10 | -10 |
Line Data
Table A3 lists the distribution-line parameters. Values correspond to the standard IEEE 33-bus feeder data set.
Table A3.
Electrical parameters of the IEEE 33-bus distribution lines.
| From | To | r [] | x [] |
|---|---|---|---|
| 1 | 2 | 0.0922 | 0.0470 |
| 2 | 3 | 0.4930 | 0.2511 |
| 3 | 4 | 0.3660 | 0.1864 |
| 4 | 5 | 0.3811 | 0.1941 |
| 5 | 6 | 0.8190 | 0.7070 |
| 6 | 7 | 0.1872 | 0.6188 |
| 7 | 8 | 0.7114 | 0.2351 |
| 8 | 9 | 1.0300 | 0.7400 |
| 9 | 10 | 1.0440 | 0.7400 |
| 10 | 11 | 0.1966 | 0.0650 |
| 11 | 12 | 0.3744 | 0.1238 |
| 12 | 13 | 1.4680 | 1.1550 |
| 13 | 14 | 0.5416 | 0.7129 |
| 14 | 15 | 0.5910 | 0.5260 |
| 15 | 16 | 0.7463 | 0.5450 |
| 16 | 17 | 1.2890 | 1.7210 |
| 17 | 18 | 0.7320 | 0.5740 |
| 2 | 19 | 0.1640 | 0.1565 |
| 19 | 20 | 1.5042 | 1.3554 |
| 20 | 21 | 0.4095 | 0.4784 |
| 21 | 22 | 0.7089 | 0.9373 |
| 3 | 23 | 0.4512 | 0.3083 |
| 23 | 24 | 0.8980 | 0.7091 |
| 24 | 25 | 0.8960 | 0.7011 |
| 6 | 26 | 0.2030 | 0.1034 |
| 26 | 27 | 0.2842 | 0.1447 |
| 27 | 28 | 1.0590 | 0.9337 |
| 28 | 29 | 0.8042 | 0.7006 |
| 29 | 30 | 0.5075 | 0.2585 |
| 30 | 31 | 0.9744 | 0.9630 |
| 31 | 32 | 0.3105 | 0.3619 |
| 32 | 33 | 0.3410 | 0.5302 |
| 21 | 8 | 2.0000 | 2.0000 |
| 9 | 15 | 2.0000 | 2.0000 |
| 12 | 22 | 2.0000 | 2.0000 |
| 18 | 33 | 0.5000 | 0.5000 |
| 25 | 29 | 0.5000 | 0.5000 |
References
- Ruiz-Tipán, F.; Valenzuela, A. Despacho económico en centrales de generación térmicas considerando restricciones económicas y ambientales para la operación en isla de una red eléctrica industrial / Despacho econômico em usinas térmicas considerando restrições econômicas e ambientais para a operação insular de uma rede elétrica industrial. BRAZILIAN APPLIED SCIENCE REVIEW 2022, 6, 851–871. [Google Scholar] [CrossRef]
- Carey, J. The other benefit of electric vehicles. Proceedings of the National Academy of Sciences of the United States of America 2023, 120. [Google Scholar] [CrossRef] [PubMed]
- Alanazi, F. Electric Vehicles: Benefits, Challenges, and Potential Solutions for Widespread Adaptation. Applied Sciences (Switzerland) 2023, 13. [Google Scholar] [CrossRef]
- Niri, A.J.; Poelzer, G.A.; Zhang, S.E.; Rosenkranz, J.; Pettersson, M.; Ghorbani, Y. Sustainability challenges throughout the electric vehicle battery value chain. 2024. [CrossRef]
- Ali, W.A.; Fanti, M.P.; Roccotelli, M.; Ranieri, L. A Review of Digital Twin Technology for Electric and Autonomous Vehicles. Applied Sciences 2023. [Google Scholar] [CrossRef]
- Alsharif, A.; Tan, C.W.; Ayop, R.; Smin, A.A.; Ahmed, A.A.; Kuwil, F.H.; Khaleel, M.M. Impact of Electric Vehicle on Residential Power Distribution Considering Energy Management Strategy and Stochastic Monte Carlo Algorithm. Energies 2023, 16. [Google Scholar] [CrossRef]
- Venegas, F.G.; Petit, M.; Perez, Y. Plug-in behavior of electric vehicles users: Insights from a large-scale trial and impacts for grid integration studies. eTransportation 2021, 10. [Google Scholar] [CrossRef]
- Yuvaraj, T.; Devabalaji, K.R.; Kumar, J.A.; Thanikanti, S.B.; Nwulu, N.I. A Comprehensive Review and Analysis of the Allocation of Electric Vehicle Charging Stations in Distribution Networks. IEEE Access 2024, 12, 5404–5461. [Google Scholar] [CrossRef]
- Shahbazi, A.; Beigi, H.M.C.; Abdi, H.; Shahbazitabar, M. Probabilistic Optimal Allocation of Electric Vehicle Charging Stations Considering the Uncertain Loads by Using the Monte Carlo Simulation Method. Journal of Operation and Automation in Power Engineering 2023, 11, 277–284. [Google Scholar] [CrossRef]
- Sadhukhan, A.; Ahmad, M.S.; Sivasubramani, S. Optimal Allocation of EV Charging Stations in a Radial Distribution Network Using Probabilistic Load Modeling. IEEE Transactions on Intelligent Transportation Systems 2022, 23, 11376–11385. [Google Scholar] [CrossRef]
- Jomah, O.S.; Ahmed, A.A.; Alsharif, A.; Nassar, Y.F.; Mohamed, N.; Imbayah, I. Assessing Random Power Flow for Vehicle-to-Grid Operation Based on Monte Carlo Simulation. In Proceedings of the 2024 IEEE 4th International Maghreb Meeting of the Conference on Sciences and Techniques of Automatic Control and Computer Engineering, MI-STA 2024 - Proceeding. Institute of Electrical and Electronics Engineers Inc., 2024, pp. 285–289. 285–289. [CrossRef]
- Li, T.; Wu, H.; Chen, H.; Wang, J.; Liu, T. Impact Analysis of Distribution Network Integrated Electric Vehicles Based on Monte Carlo Algorithm. In Proceedings of the 2023 IEEE Sustainable Power and Energy Conference, iSPEC 2023. Institute of Electrical and Electronics Engineers Inc., 2023. [CrossRef]
- Deeum, S.; Bhumkittipich, P.; Janjamraj, N.; Romphochai, S.; Kongjeen, Y.; Bhumkittipich, K. Impact of Electric Vehicle Penetration on Power Distribution System Using Stochastic Monte Carlo Algorithm. In Proceedings of the ICPEI 2024 - Proceedings of the 6th International Conference on Power, Energy and Innovations. Institute of Electrical and Electronics Engineers Inc., 2024, pp. 87–92. 87–92. [CrossRef]
- Alkhafaji, M.H.; Luk, P.; Bati, A. Integration of electric vehicles within microgrid. IEEE 2016. [Google Scholar] [CrossRef]
- Srivastava, A.; Manas, M.; Dubey, R.K. Electric vehicle integration’s impacts on power quality in distribution network and associated mitigation measures: a review. Journal of Engineering and Applied Science 2023, 70, 32. [Google Scholar] [CrossRef]
- Wang, G.; Yuan, X.; Wang, M.; Yan, G.; Liao, C.; Wang, L. Impact of Electric Vehicle Charging Loads on Distribution Networks. In Frontier Academic Forum of Electrical Engineering (FAFEE 2024); Lecture Notes in Electrical Engineering; Springer, 2024; Volume 1292, pp. 477–485. [Google Scholar] [CrossRef]
- Betancur, D.; Duarte, L.F.; Revollo, J.; Restrepo, C.; Diez, A.E.; Isaac, I.A.; López, G.J.; González, J.W. Methodology to Evaluate the Impact of Electric Vehicles on Electrical Networks Using Monte Carlo. Energies 2021, 14, 1300. [Google Scholar] [CrossRef]
- Polat, Ö.; Eyüboğlu, O.H.; Gül, Ö. Monte Carlo simulation of electric vehicle loads respect to return home from work and impacts to the low voltage side of distribution network. Electrical Engineering 2021, 103, 439–445. [Google Scholar] [CrossRef]
- Zhang, S.; et al. Static voltage stability influence evaluation method of distribution network with EV charging load. Journal of Modern Power Systems and Clean Energy 2023. [Google Scholar] [CrossRef]
- Sirisumrannukul, S. Charging Management of Electric Vehicles on Loading Capability of Distribution System Equipment, Voltage Quality, and Energy Loss by Monte Carlo Simulation and Linear Programming. Journal of Renewable Energy 2023, 2023, 1195648. [Google Scholar] [CrossRef]
- Chen, X.; Parisio, A. Optimal Coordination of Electric Vehicles for Voltage Support in Distribution Networks. Proceedings of the ISGT-Asia 2022, 2023, 650–654. [Google Scholar] [CrossRef]
- Zheng, Z.; Zhang, S.; Zhang, X.; Yang, B.; Yan, F.; Ge, X. Stability Analysis and Control of DC Distribution System with Electric Vehicles. Energy Engineering 2023, 120, 633–647. [Google Scholar] [CrossRef]
- Sivakumar, S.; Gunaseelan, S.B.R.; Krishnakumar, M.V.R.; Krishnan, N.; Sharma, A.; Aguila Téllez, A. Analysis of distribution systems in the presence of electric vehicles and optimal allocation of distributed generations considering power loss and voltage stability index. IET Generation, Transmission & Distribution 2023, 18, 1114–1132. [Google Scholar] [CrossRef]
- Aguila Téllez, A.; Ortiz, L.; Ruiz, M.; Narayanan, K.; Varela, S. Optimal Location of Reclosers in Electrical Distribution Systems Considering Multicriteria Decision Through the Generation of Scenarios Using the Monte Carlo Method. IEEE Access 2023, 11, 68853–68871. [Google Scholar] [CrossRef]
- ABB. Terra HP High Power Charging System, 2023. Datasheet de cargador rápido Terra HP con capacidad continua de 350 kW.
Figure 1.
Workflow of the proposed Monte Carlo voltage assessment with sensitivity-based reactive compensation.
Figure 1.
Workflow of the proposed Monte Carlo voltage assessment with sensitivity-based reactive compensation.
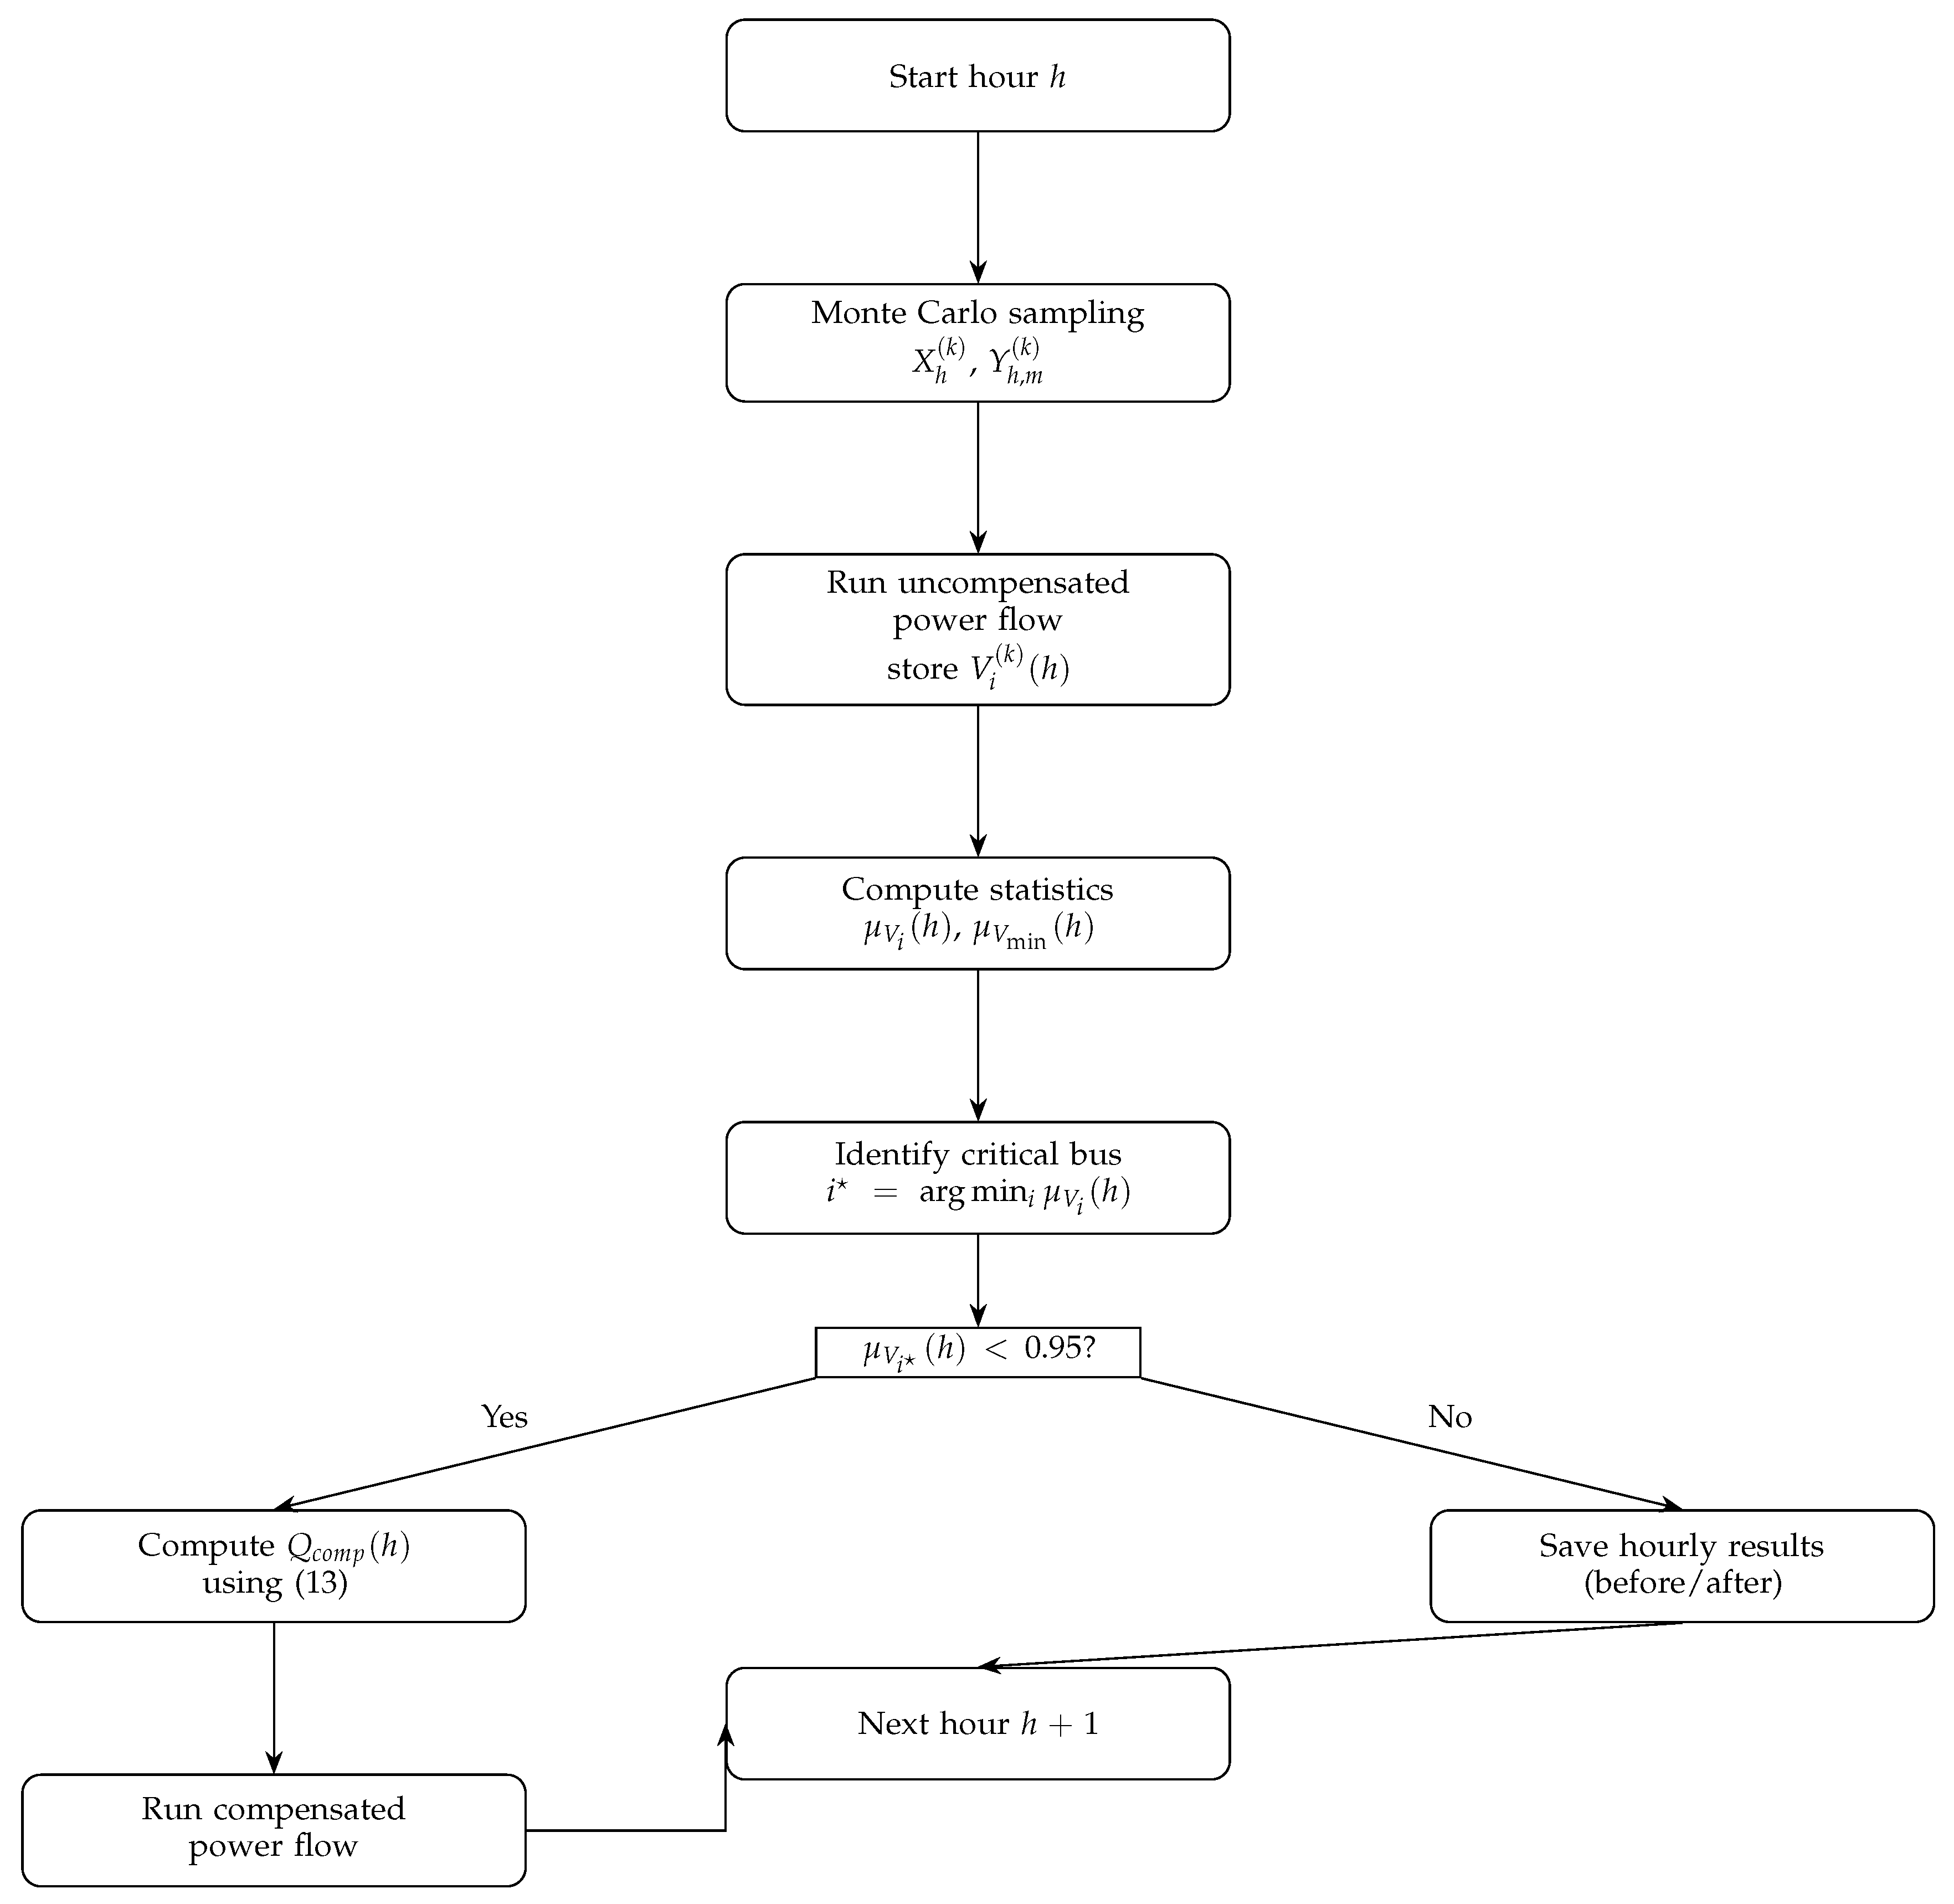
Figure 2.
Nodal auto-sensitivity of PQ buses in the IEEE 33-bus system.
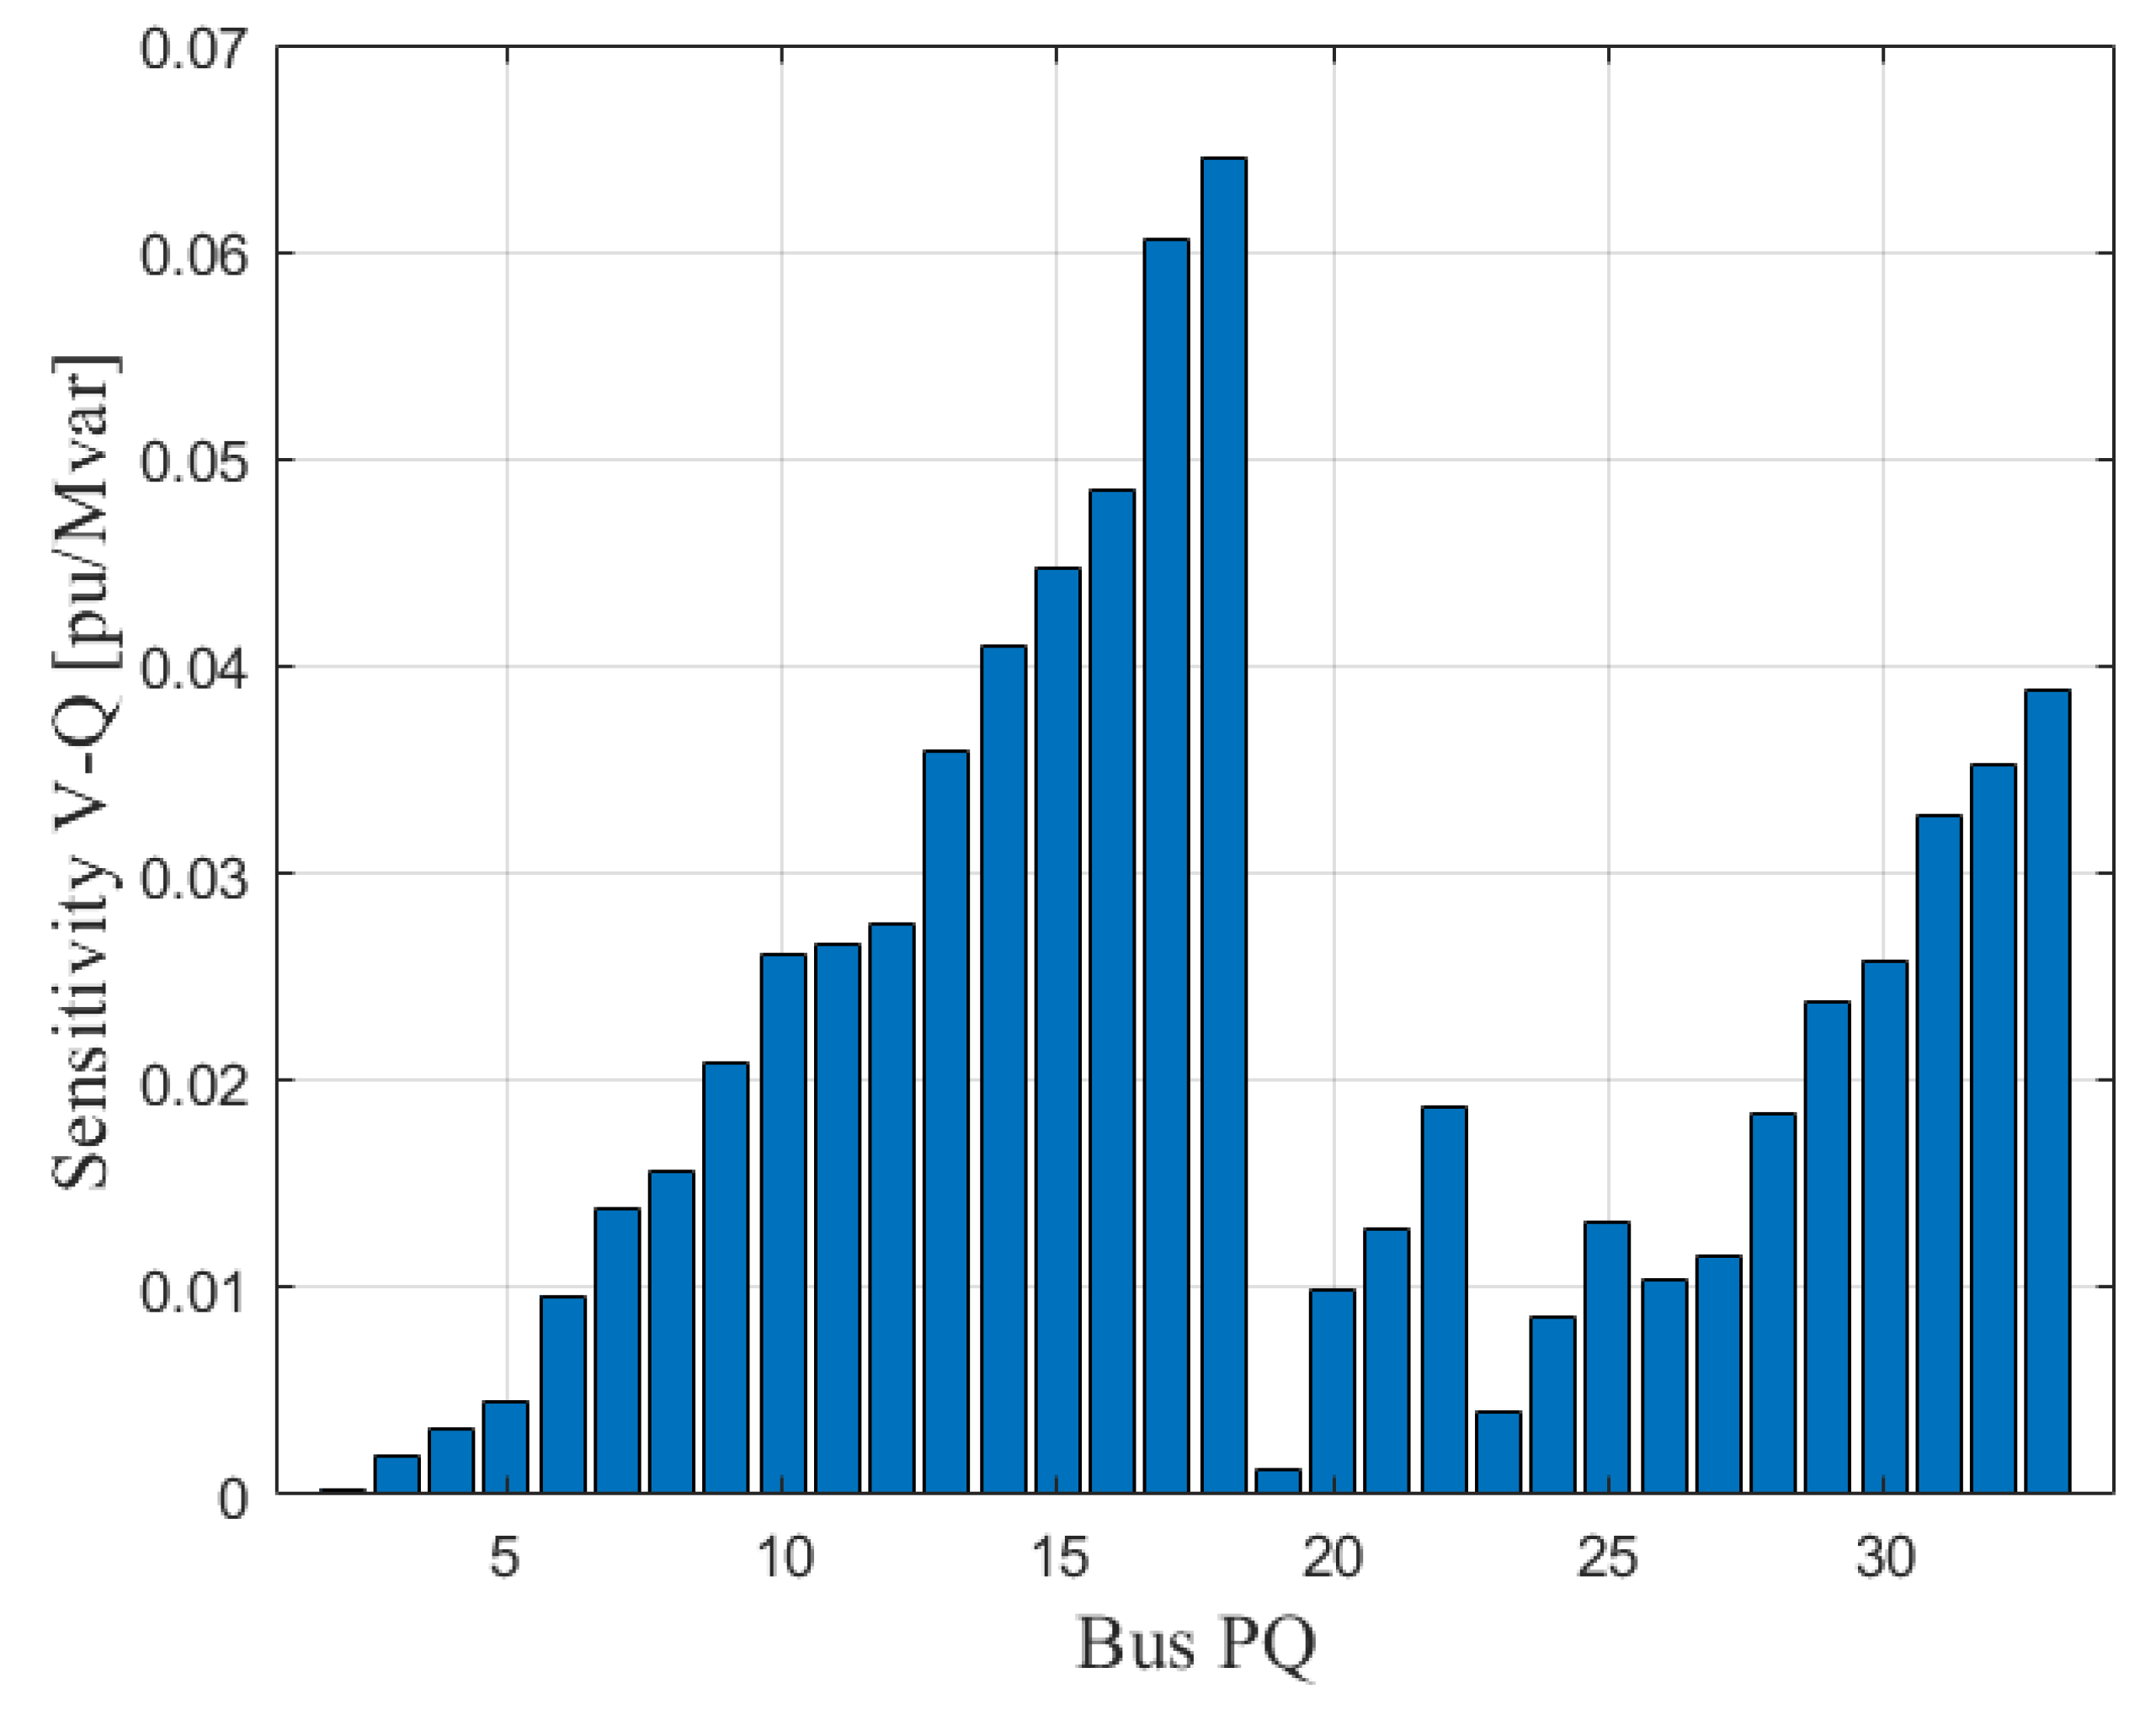
Figure 3.
Hourly minimum-voltage profile before and after compensation (Case 1).
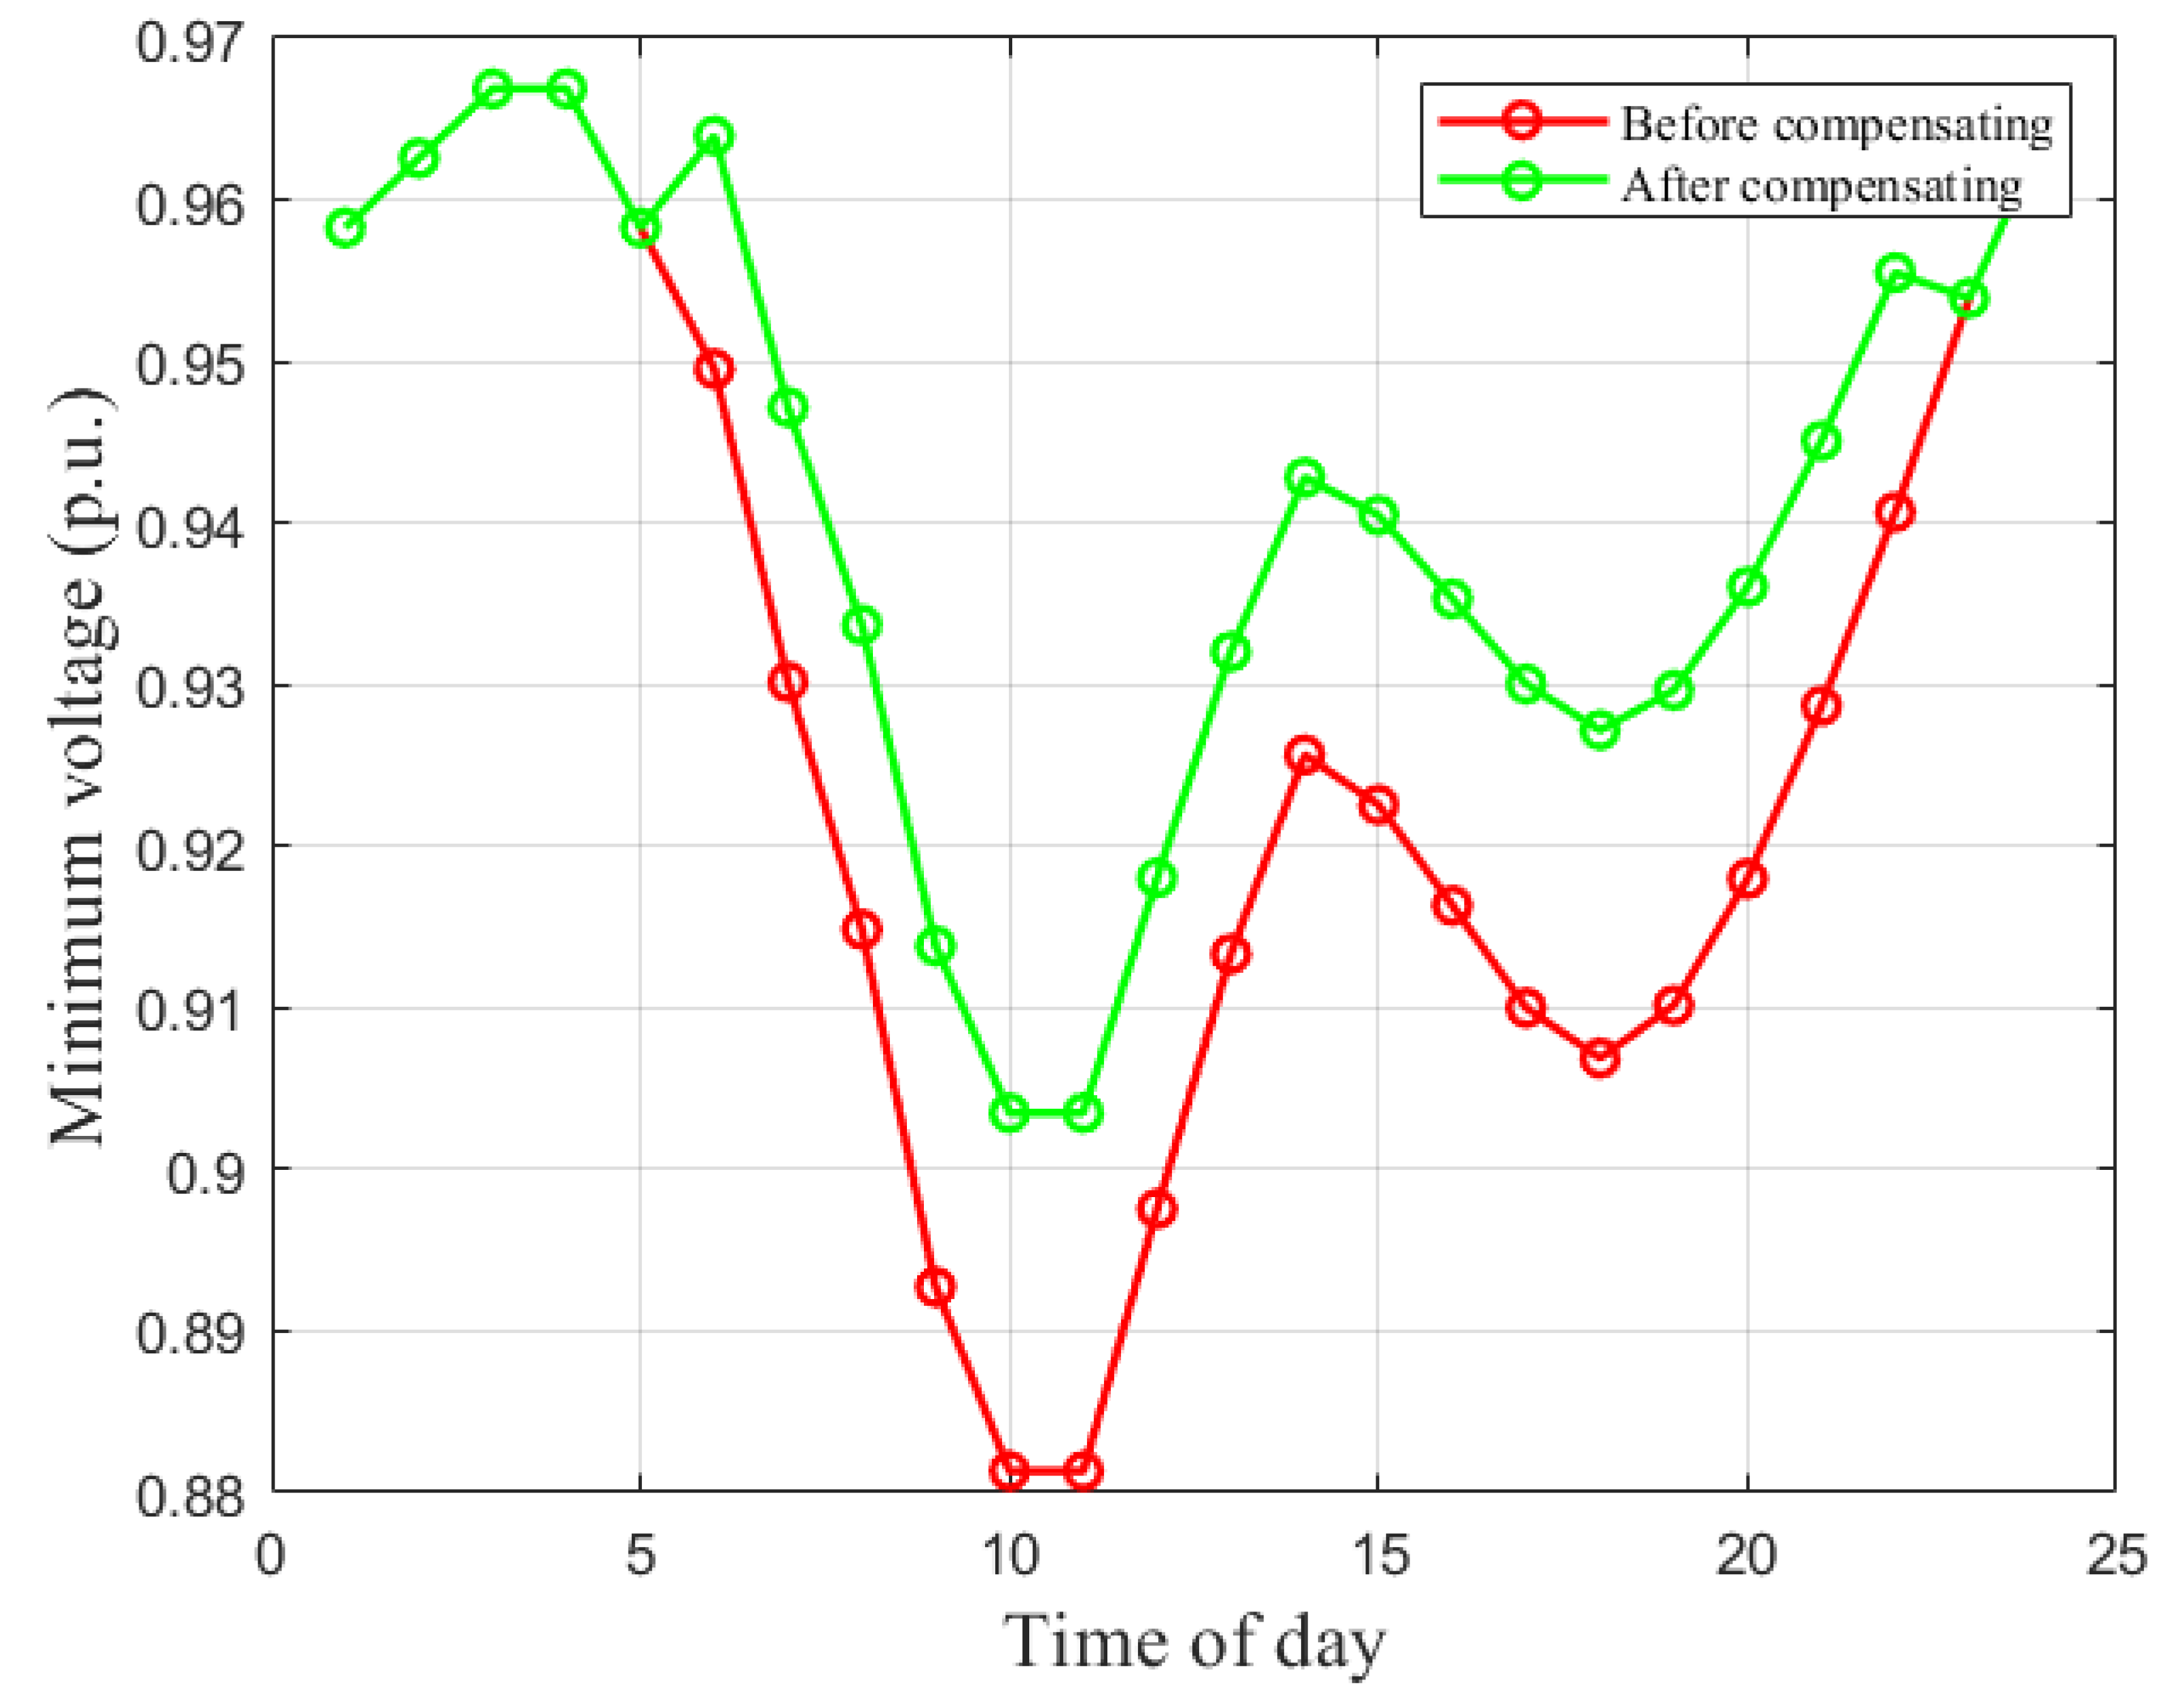
Figure 4.
Hourly minimum-voltage profile before and after compensation (Case 2).
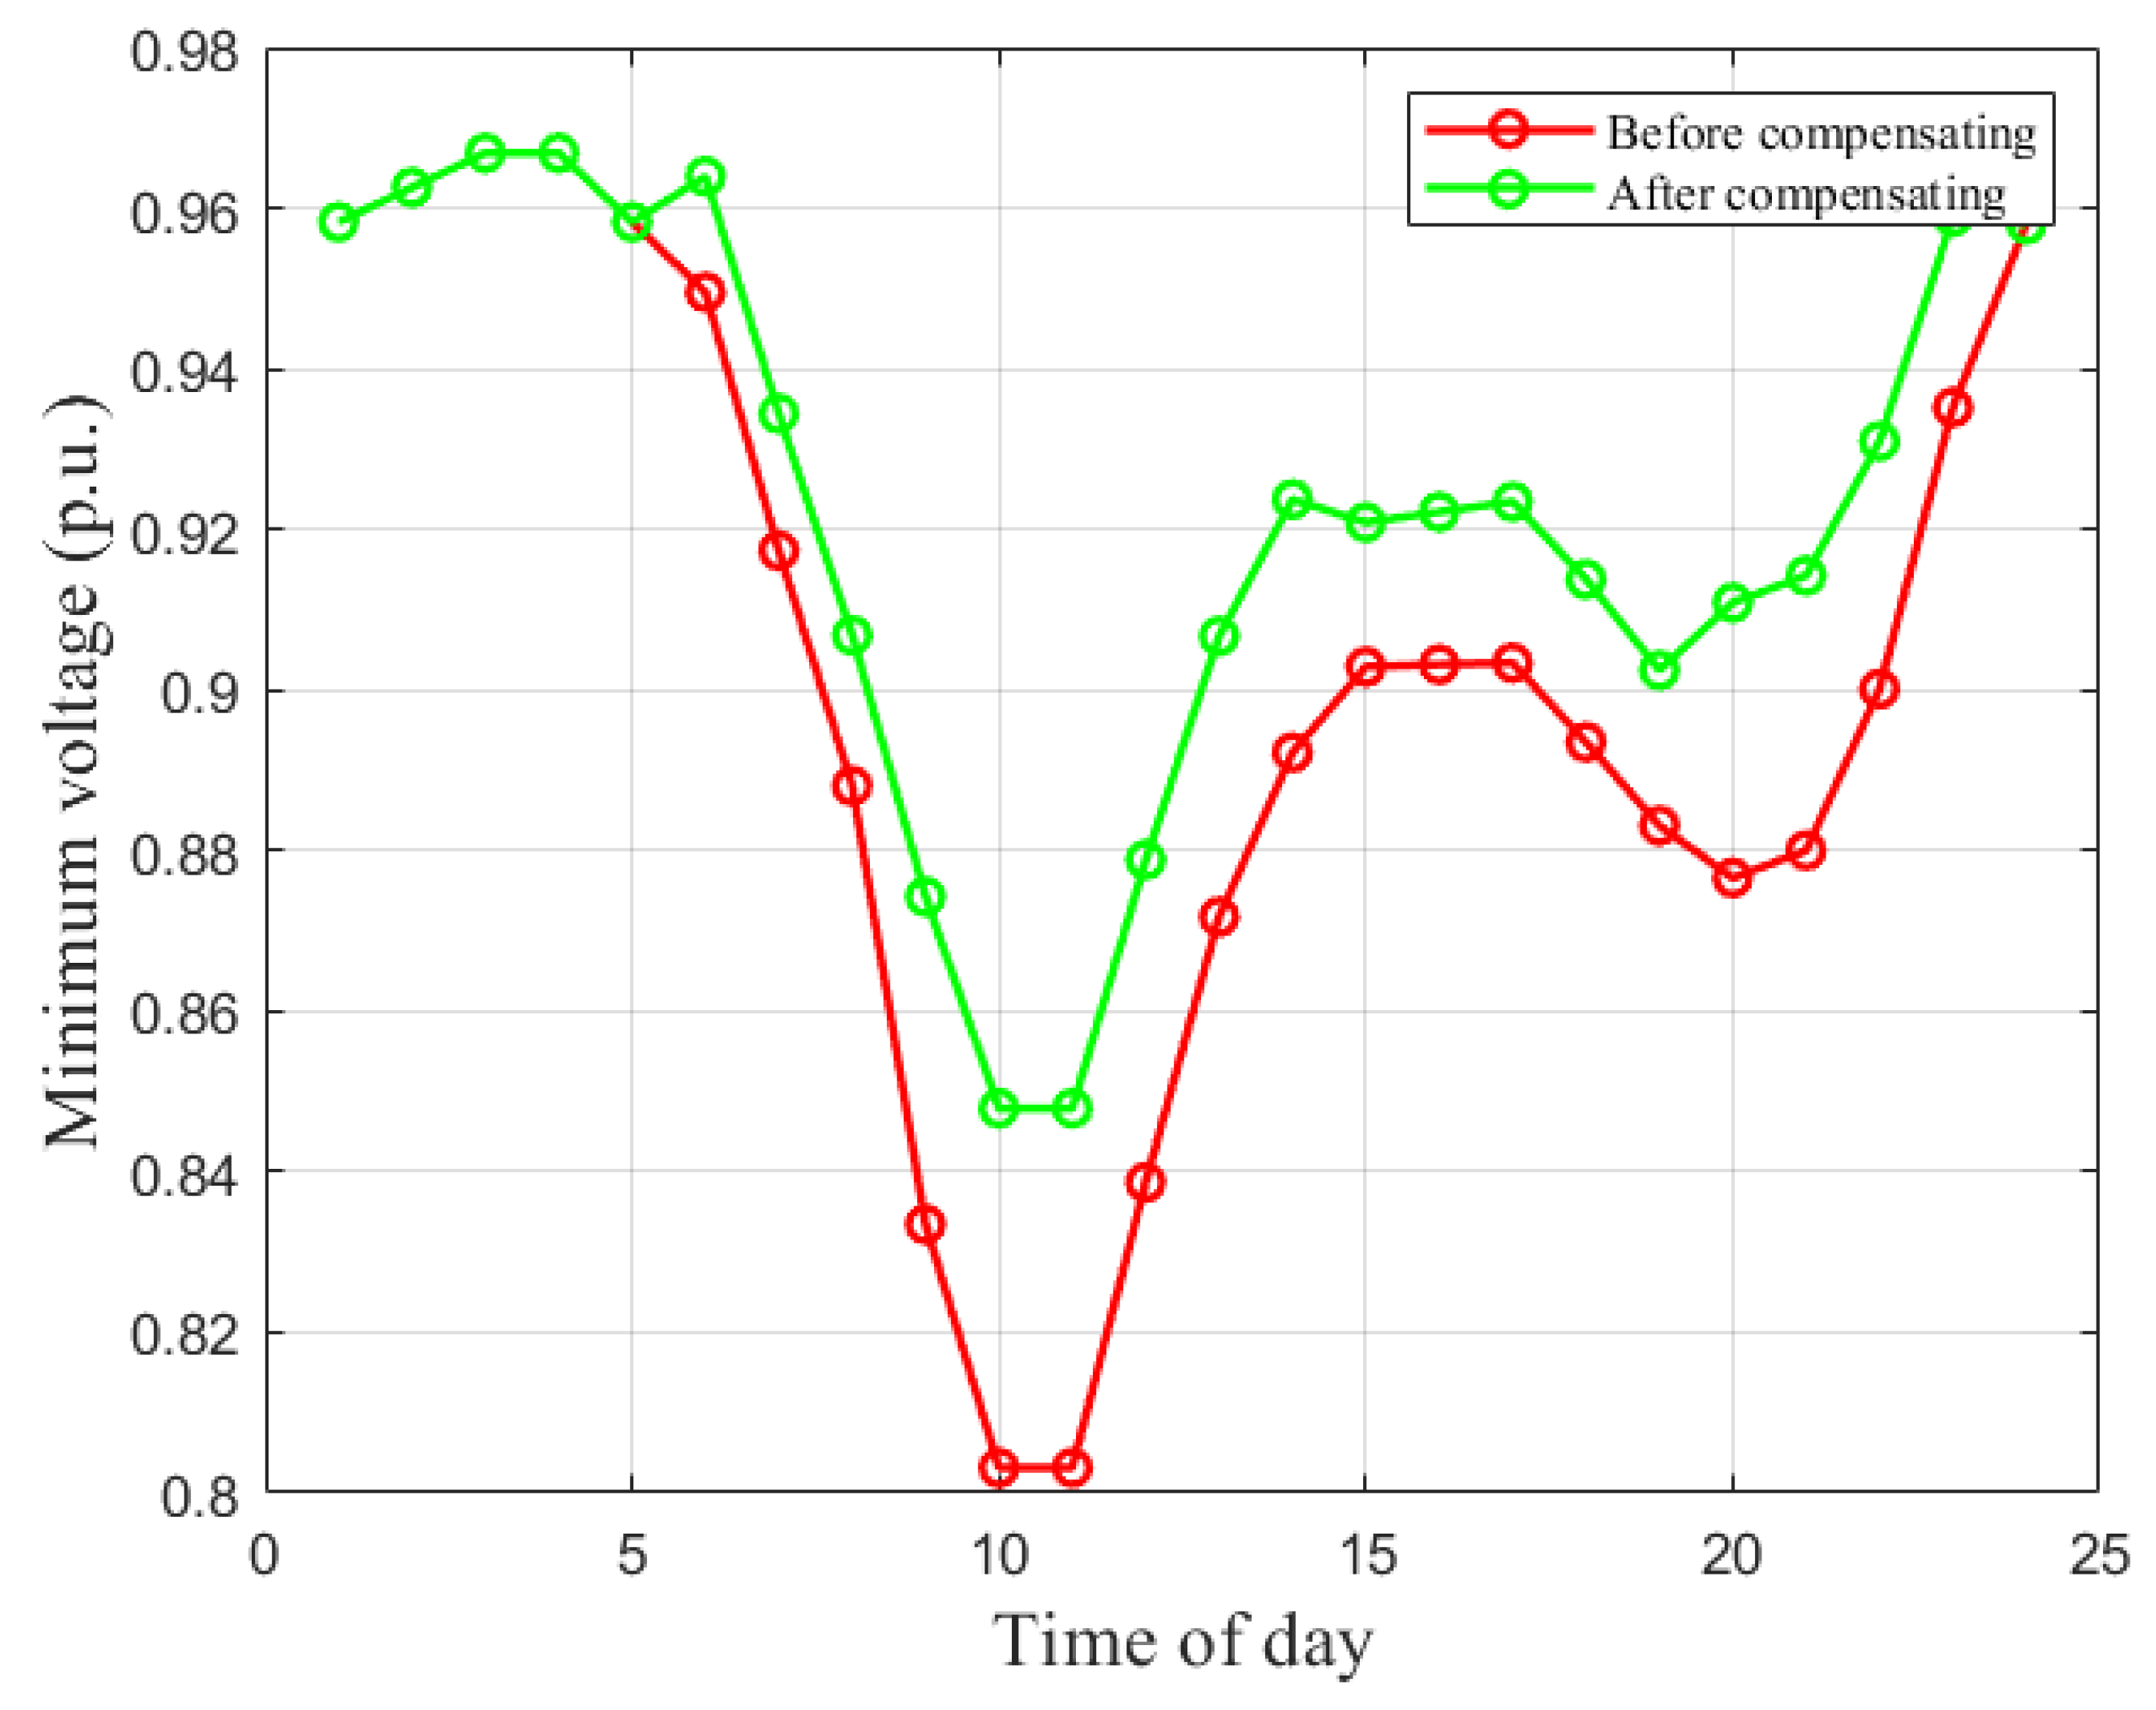
Figure 5.
Hourly minimum-voltage profile before and after compensation (Case 3).
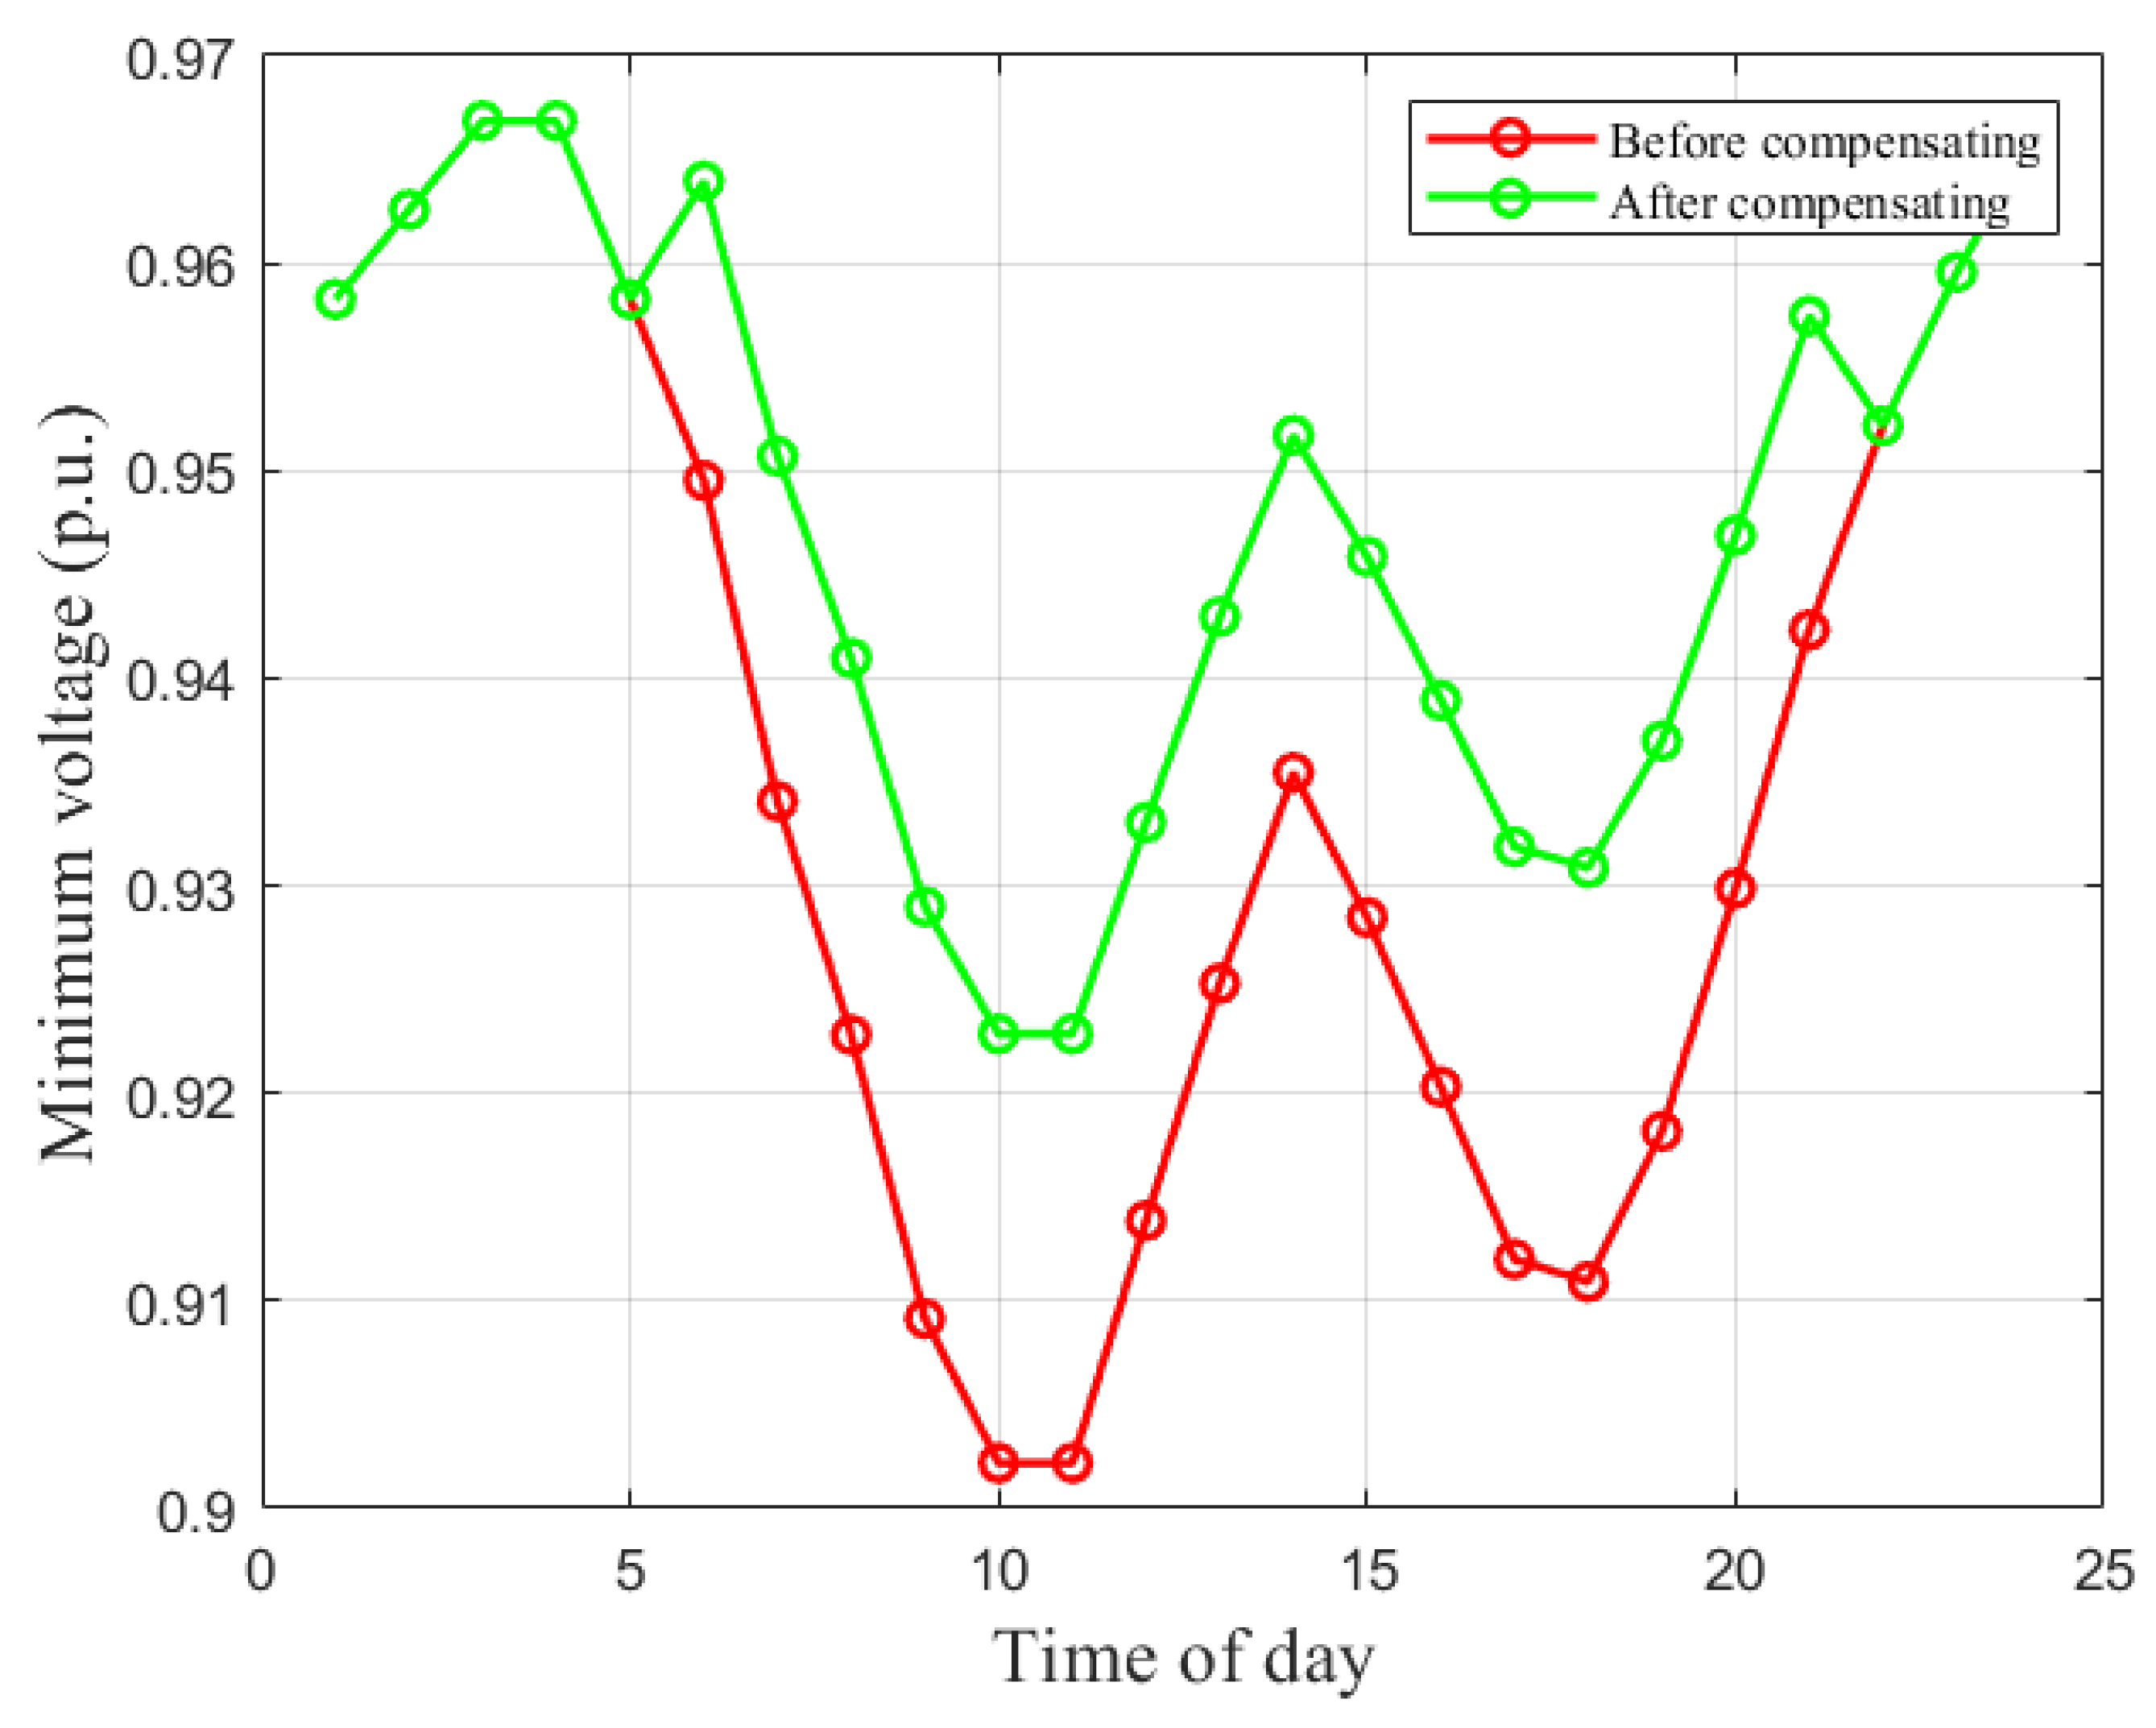
Figure 6.
Hourly minimum-voltage profile before and after compensation (Case 4).
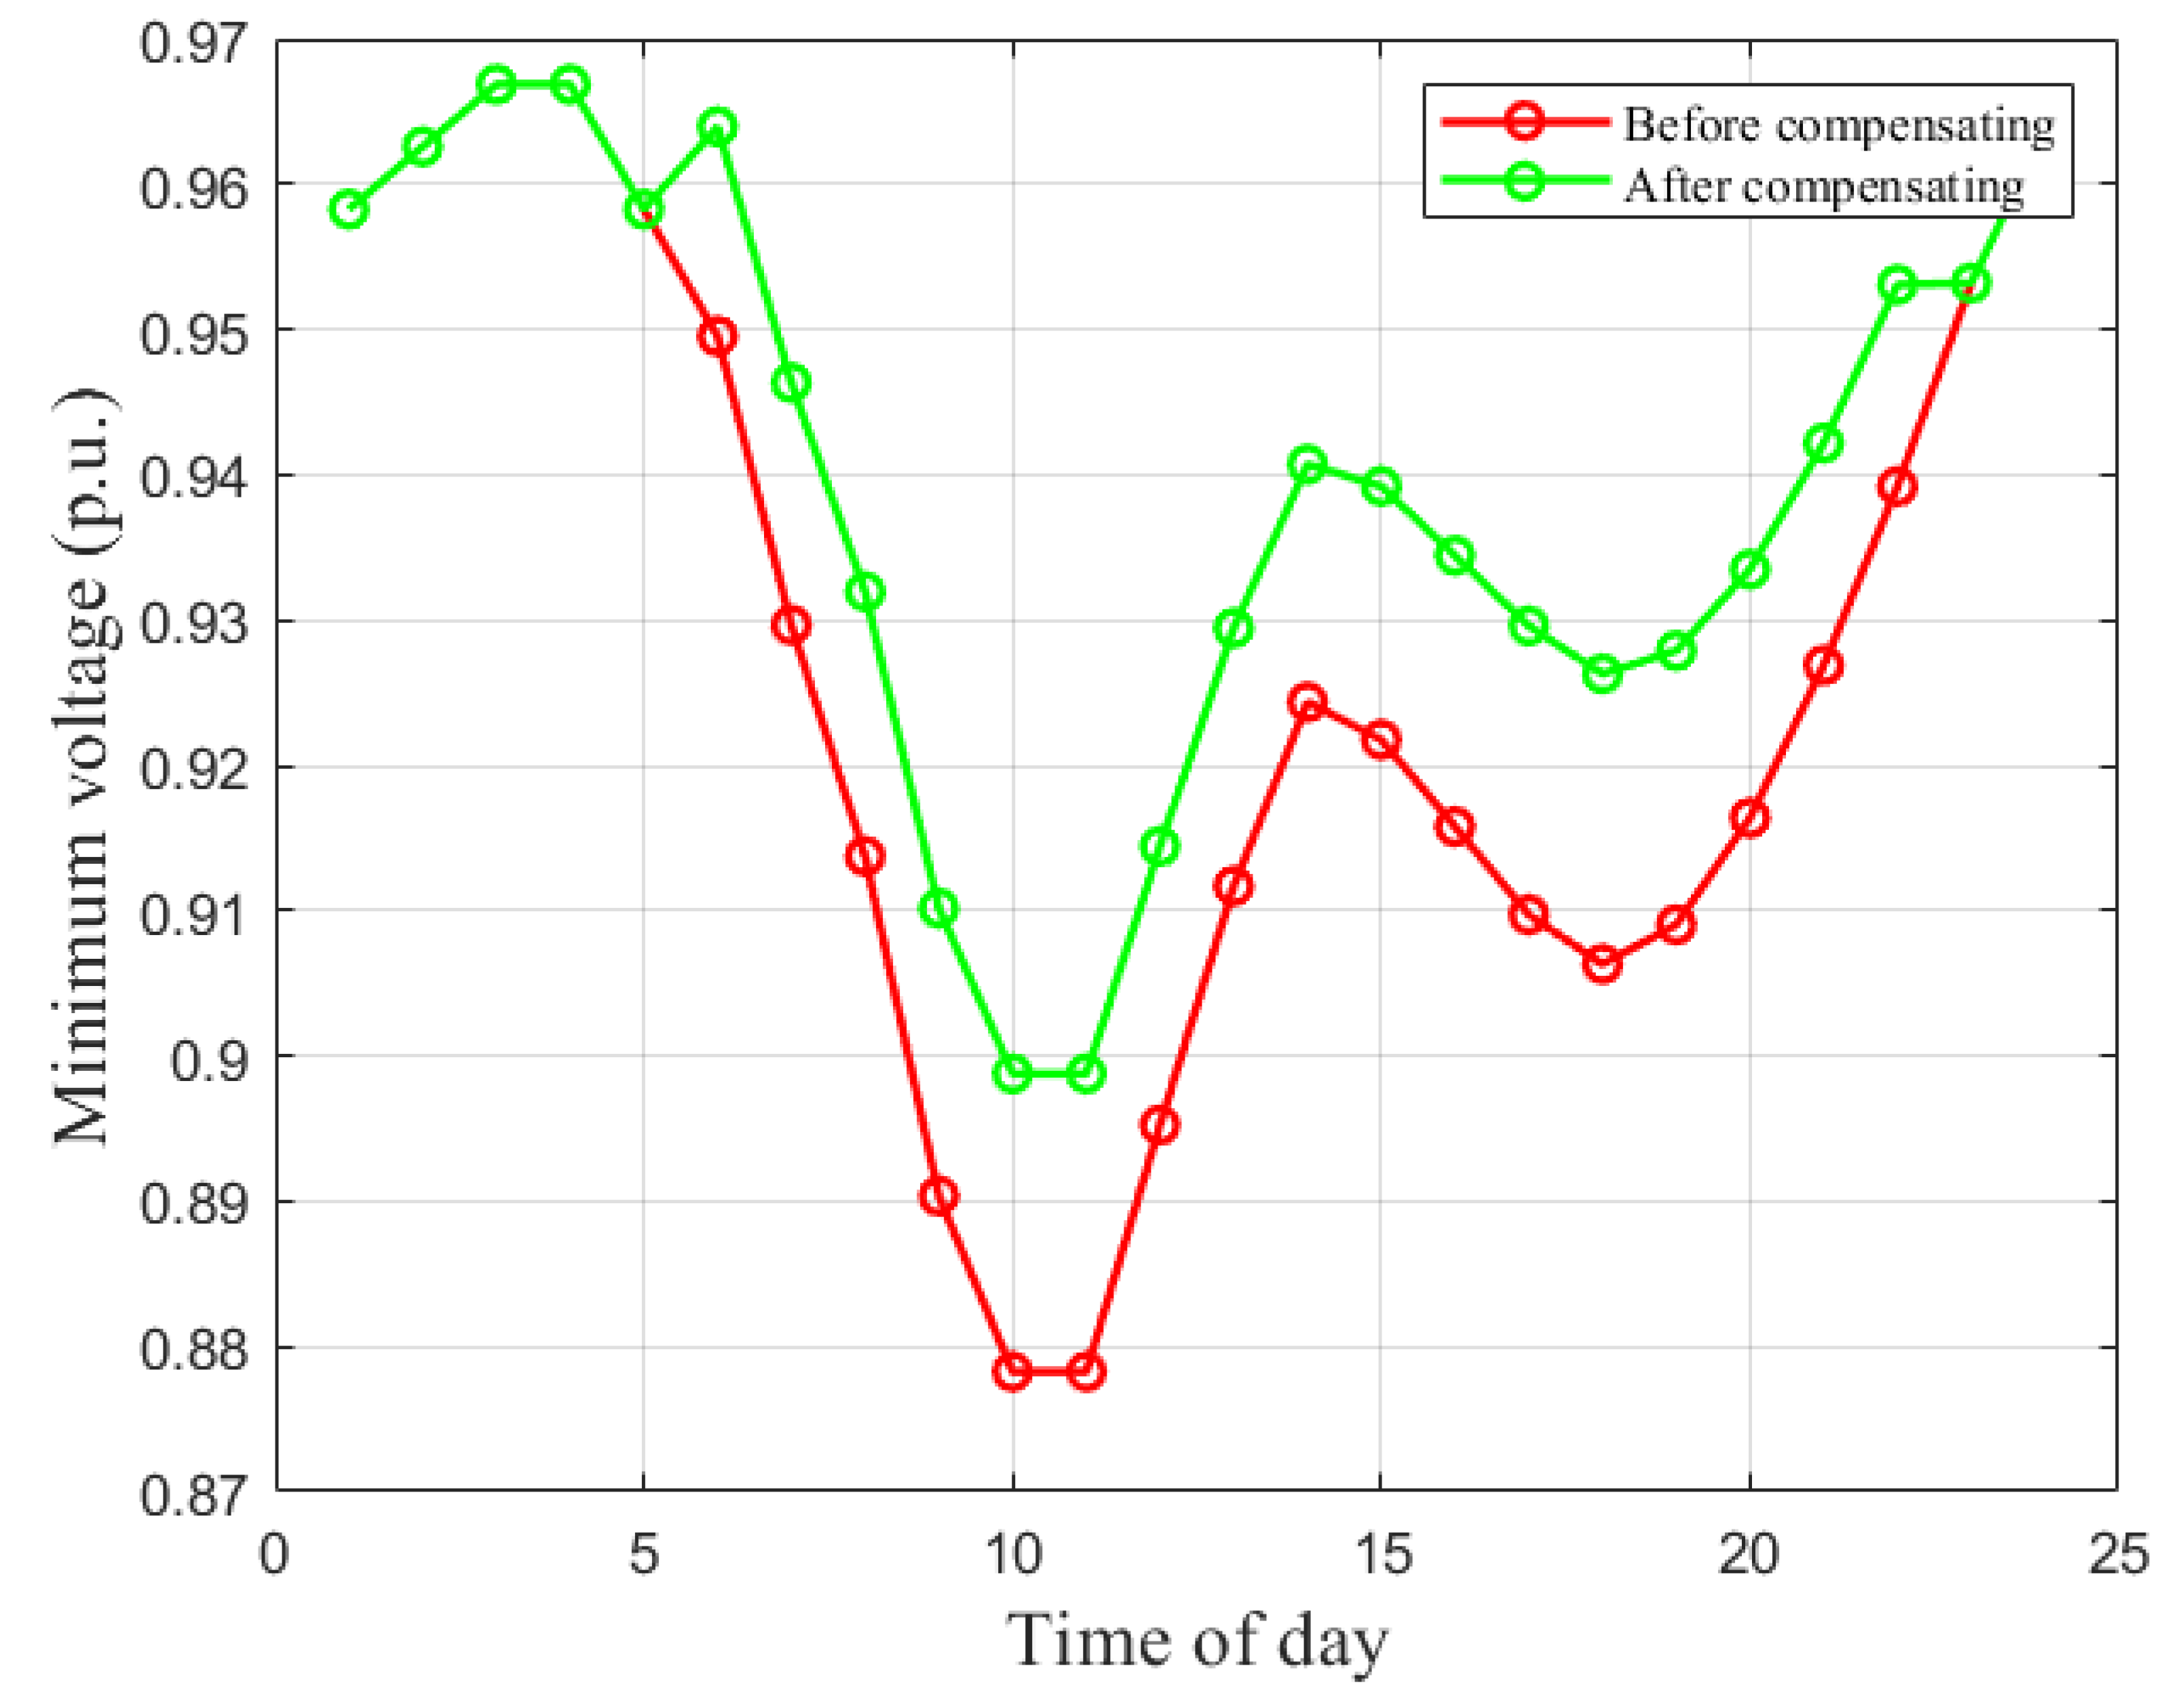
Figure 7.
Minimum-voltage comparison before and after compensation (Cases 1 and 3).
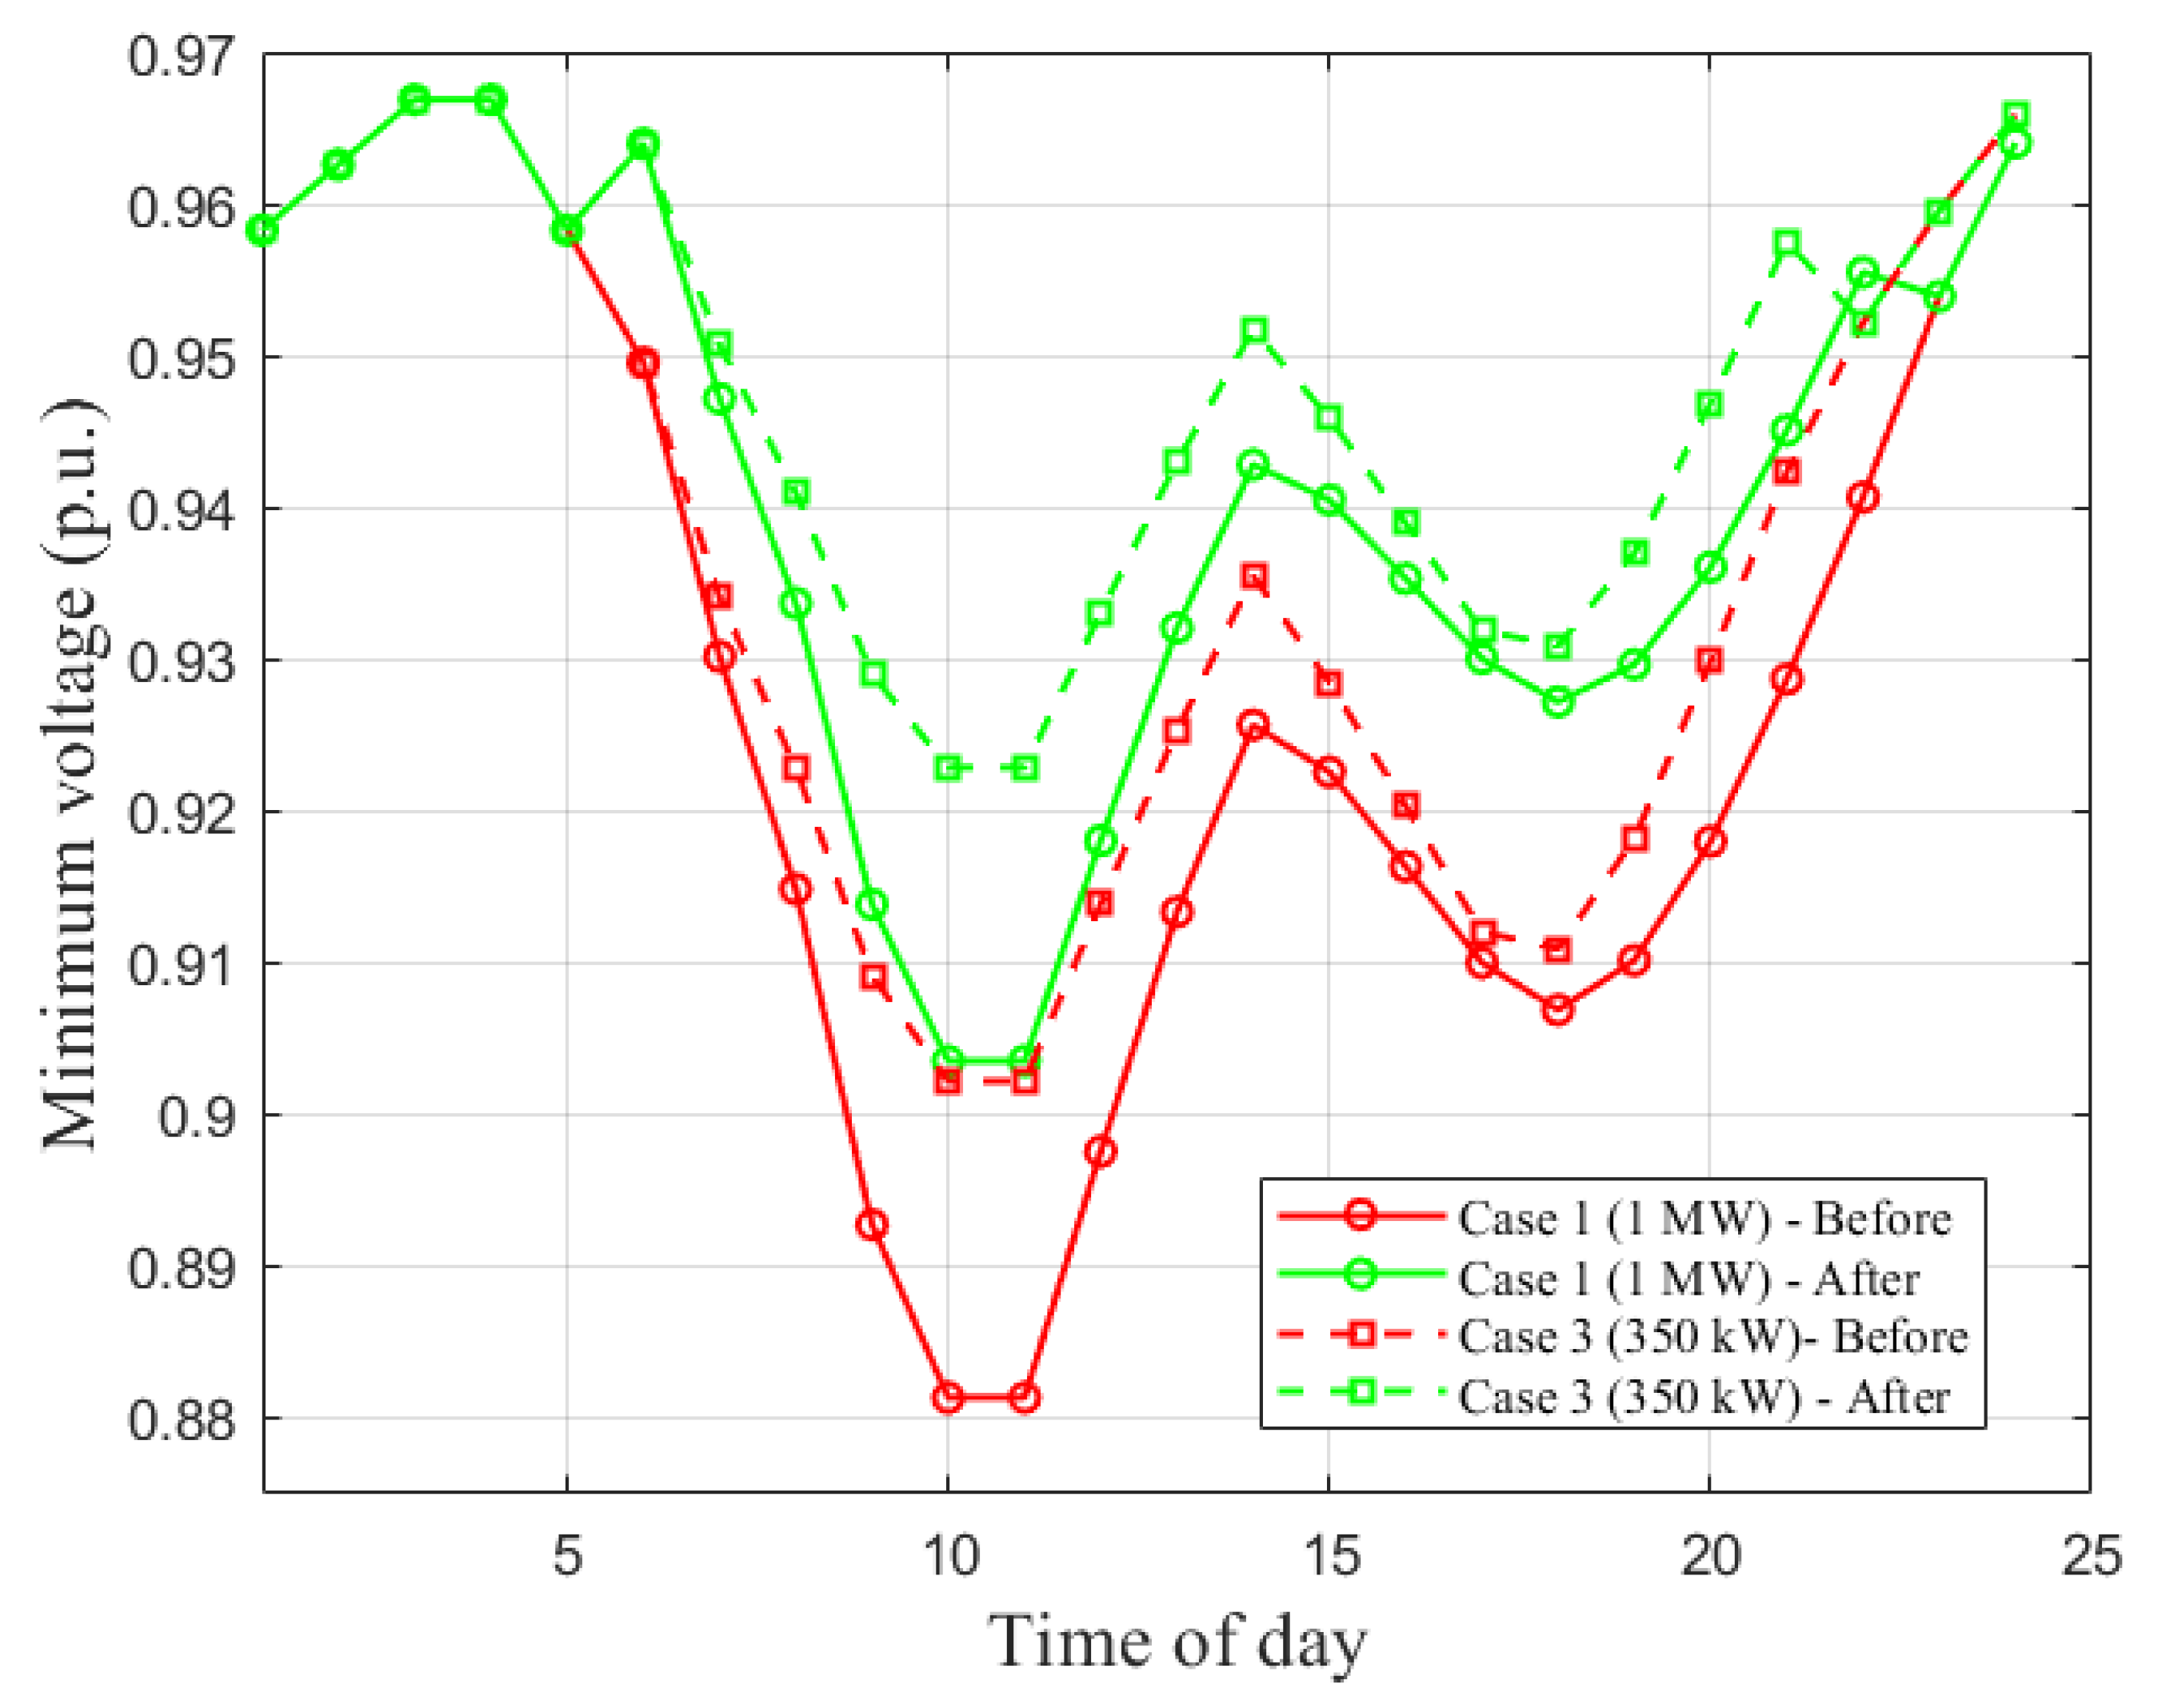
Figure 8.
Minimum-voltage comparison before and after compensation (Cases 2 and 4).
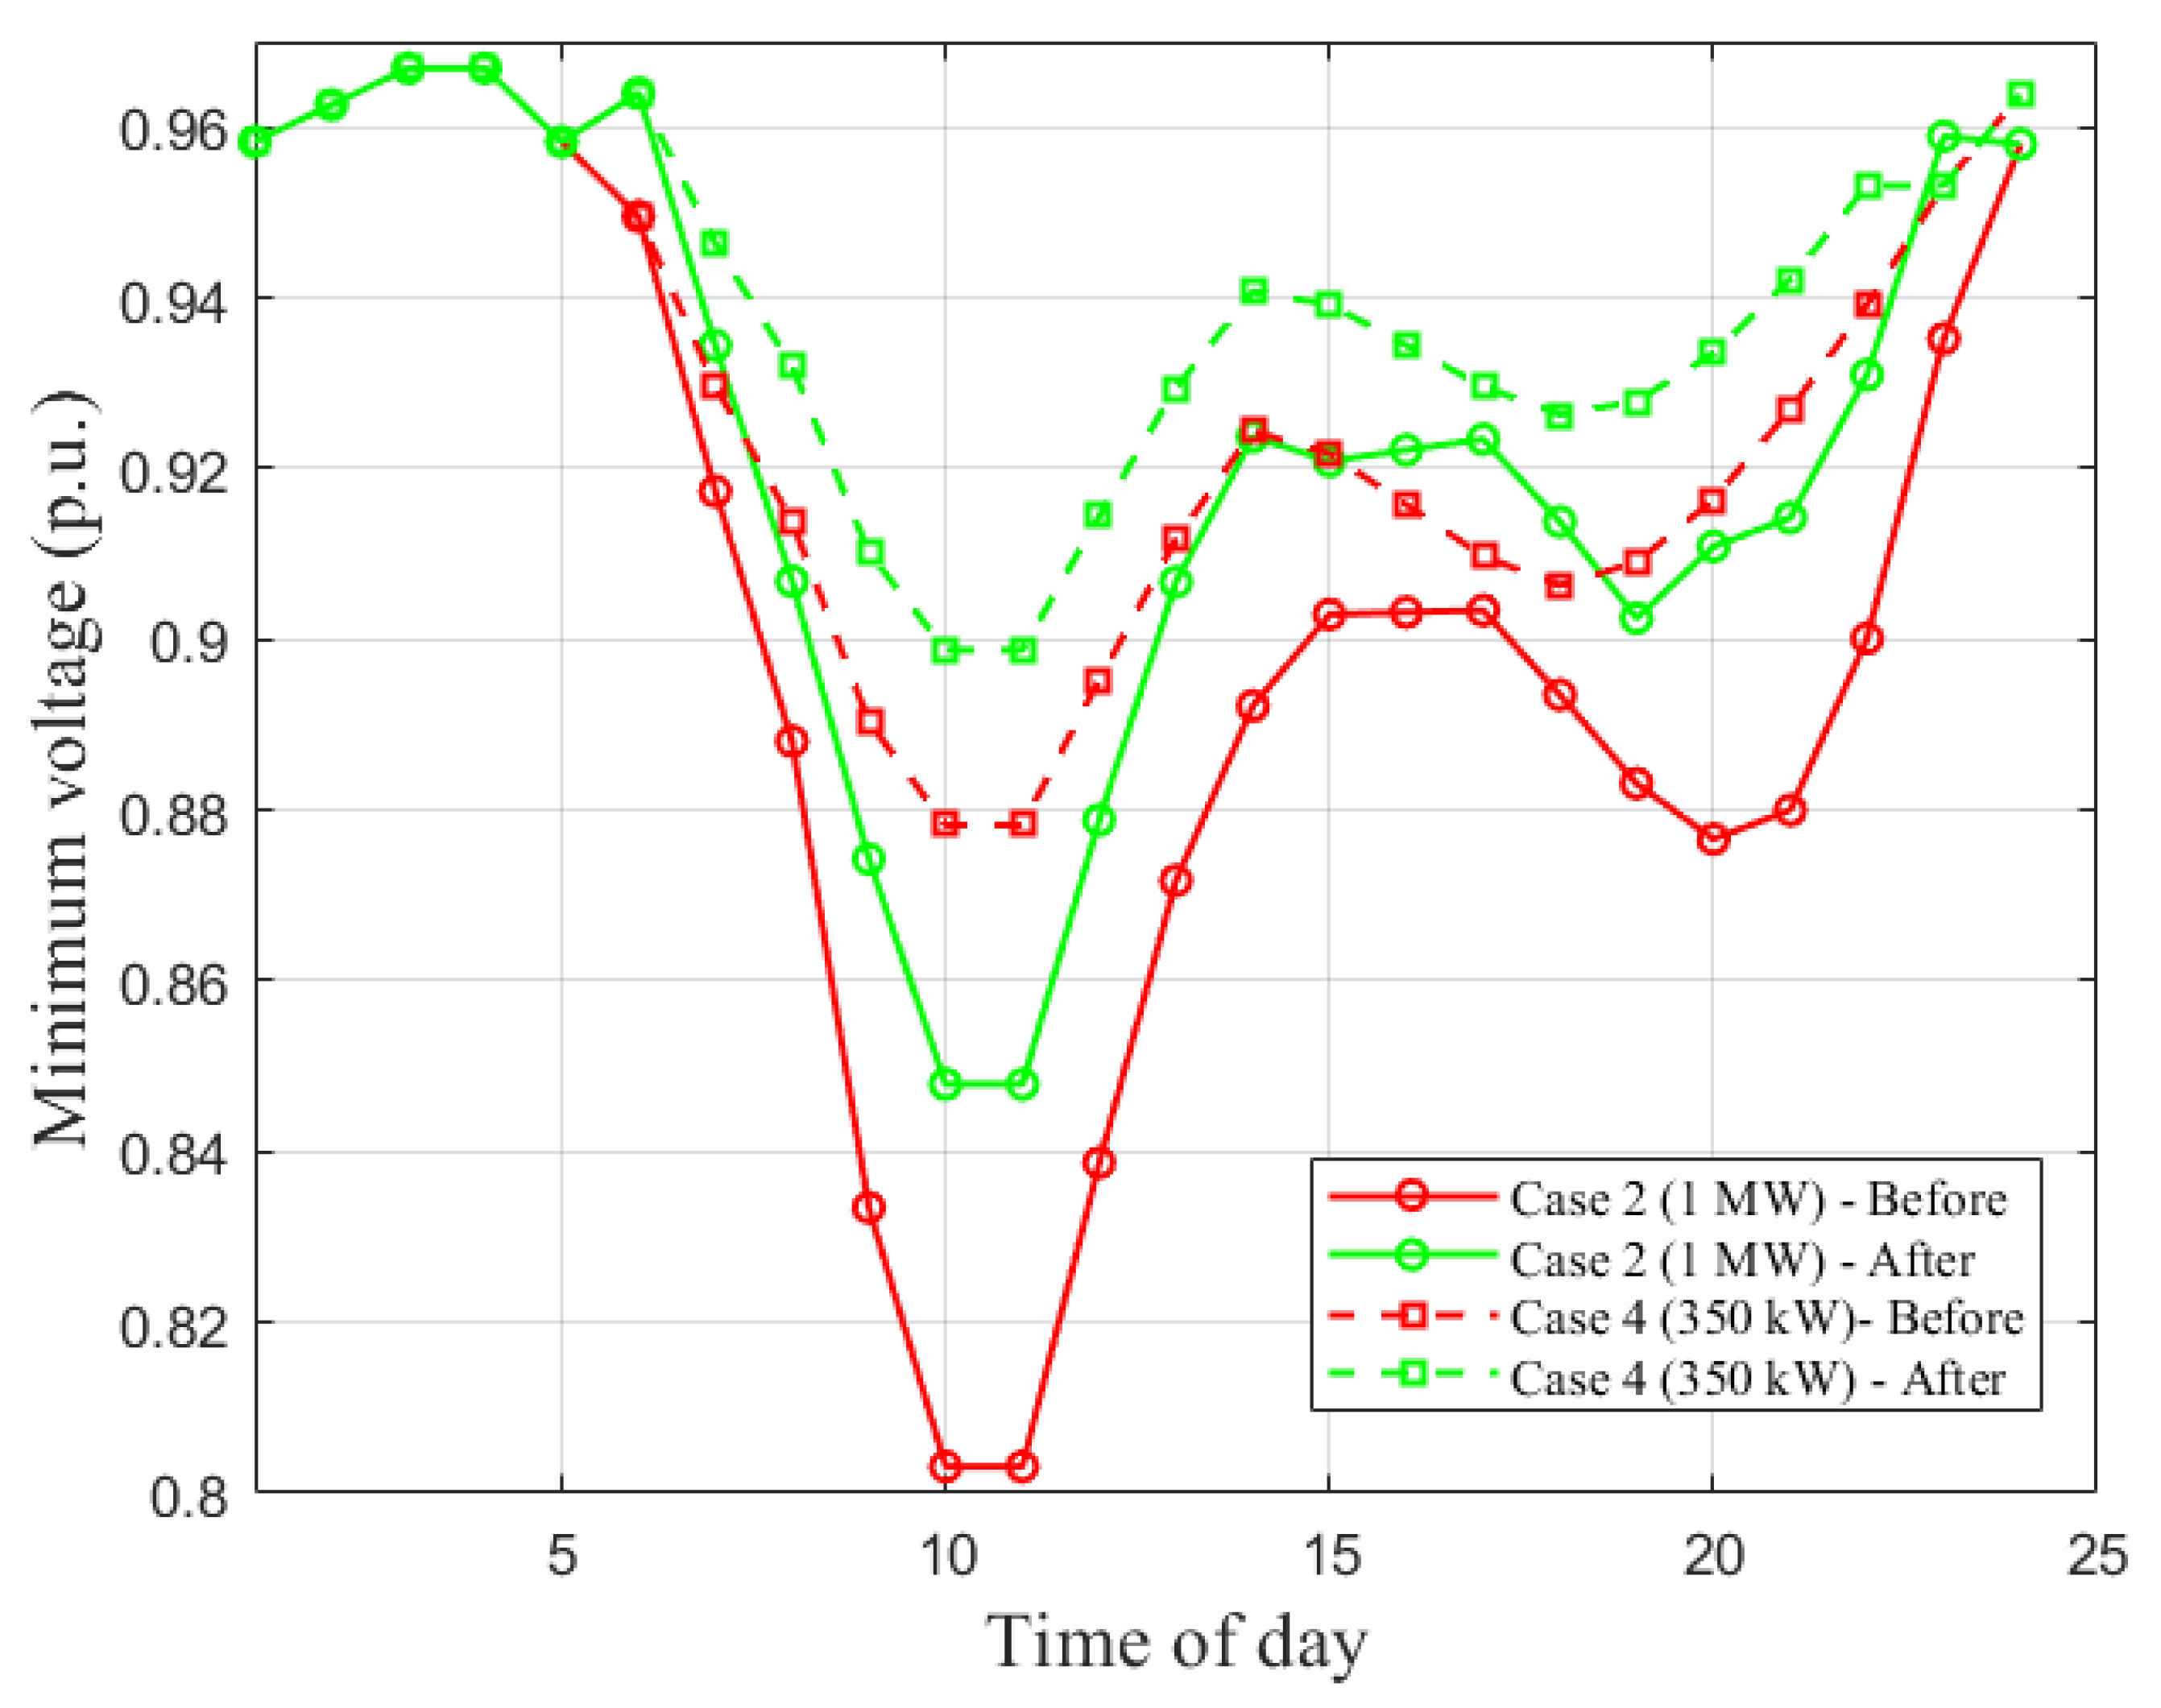
Table 1.
Ranking of PQ buses by nodal auto-sensitivity .
| Bus | Sensitivity [pu/Mvar] |
|---|---|
| 2 | 0.00025 |
| 19 | 0.00176 |
| 3 | 0.00193 |
| 4 | 0.00320 |
| 23 | 0.00353 |
| 5 | 0.00545 |
| 24 | 0.00571 |
| 6 | 0.00966 |
| 20 | 0.00983 |
| 26 | 0.01037 |
| 27 | 0.01145 |
| 21 | 0.01265 |
| 25 | 0.01317 |
| 7 | 0.01816 |
| 8 | 0.01858 |
| 22 | 0.01876 |
| 9 | 0.02078 |
| 29 | 0.02372 |
| 30 | 0.02584 |
| 10 | 0.02610 |
| 11 | 0.02660 |
| 12 | 0.02754 |
| 31 | 0.02713 |
| 32 | 0.03527 |
| 13 | 0.03586 |
| 14 | 0.03904 |
| 33 | 0.04051 |
| 16 | 0.04476 |
| 17 | 0.04857 |
| 18 | 0.06458 |
Table 2.
Hourly reactive compensation summary (Case 1).
| Hour | Critical bus | [p.u.] | [Mvar] |
|---|---|---|---|
| 6 | 18 | 0.950 | -1.56 |
| 7 | 18 | 0.930 | -1.86 |
| 8 | 18 | 0.915 | -2.09 |
| 9 | 18 | 0.893 | -2.44 |
| 10 | 18 | 0.884 | -2.61 |
| 11 | 18 | 0.881 | -2.61 |
| 12 | 18 | 0.896 | -2.36 |
| 13 | 18 | 0.913 | -2.12 |
| 14 | 18 | 0.926 | -1.93 |
| 15 | 18 | 0.923 | -1.97 |
| 16 | 18 | 0.910 | -2.17 |
| 17 | 18 | 0.907 | -2.22 |
| 18 | 18 | 0.919 | -2.04 |
| 19 | 18 | 0.918 | -2.02 |
| 20 | 18 | 0.919 | -2.04 |
| 21 | 18 | 0.929 | -1.88 |
| 22 | 18 | 0.941 | -1.69 |
Table 3.
Hourly reactive compensation summary (Case 2).
| Hour | Critical bus | [p.u.] | [Mvar] |
|---|---|---|---|
| 6 | 18 | 0.950 | -1.56 |
| 7 | 18 | 0.917 | -2.05 |
| 8 | 18 | 0.888 | -2.51 |
| 9 | 33 | 0.833 | -5.57 |
| 10 | 33 | 0.803 | -6.35 |
| 11 | 33 | 0.803 | -6.35 |
| 12 | 33 | 0.859 | -5.43 |
| 13 | 33 | 0.872 | -4.58 |
| 14 | 33 | 0.892 | -4.06 |
| 15 | 18 | 0.903 | -2.28 |
| 16 | 18 | 0.903 | -2.27 |
| 17 | 18 | 0.893 | -2.42 |
| 18 | 18 | 0.887 | -2.47 |
| 20 | 33 | 0.877 | -4.46 |
| 21 | 33 | 0.880 | -4.37 |
| 22 | 33 | 0.900 | -3.85 |
| 23 | 33 | 0.935 | -2.95 |
Table 4.
Hourly reactive compensation summary (Case 3).
| Hour | Critical bus | [p.u.] | [Mvar] |
|---|---|---|---|
| 6 | 18 | 0.950 | -1.56 |
| 7 | 18 | 0.934 | -1.80 |
| 8 | 18 | 0.923 | -1.97 |
| 9 | 18 | 0.909 | -2.18 |
| 10 | 18 | 0.902 | -2.29 |
| 11 | 18 | 0.902 | -2.29 |
| 12 | 18 | 0.914 | -2.11 |
| 13 | 18 | 0.925 | -1.93 |
| 14 | 18 | 0.931 | -1.85 |
| 15 | 18 | 0.928 | -1.88 |
| 16 | 18 | 0.922 | -1.97 |
| 17 | 18 | 0.912 | -2.14 |
| 18 | 18 | 0.918 | -2.08 |
| 19 | 18 | 0.918 | -2.04 |
| 20 | 18 | 0.930 | -1.86 |
| 21 | 18 | 0.942 | -1.67 |
Table 5.
Hourly reactive compensation summary (Case 4).
| Hour | Critical bus | [p.u.] | [Mvar] |
|---|---|---|---|
| 6 | 18 | 0.950 | -1.56 |
| 7 | 18 | 0.930 | -1.86 |
| 8 | 18 | 0.914 | -2.11 |
| 9 | 18 | 0.890 | -2.47 |
| 10 | 18 | 0.878 | -2.66 |
| 11 | 18 | 0.878 | -2.66 |
| 12 | 18 | 0.895 | -2.40 |
| 13 | 18 | 0.912 | -2.14 |
| 14 | 18 | 0.924 | -1.99 |
| 15 | 18 | 0.920 | -2.04 |
| 16 | 18 | 0.916 | -2.07 |
| 17 | 18 | 0.910 | -2.17 |
| 18 | 18 | 0.909 | -2.18 |
| 19 | 18 | 0.910 | -2.18 |
| 20 | 18 | 0.916 | -2.07 |
| 21 | 18 | 0.927 | -1.91 |
| 22 | 18 | 0.939 | -1.72 |
Table 6.
Cross-case stability indicators.
| Case | (uncomp.) | (comp.) | [Mvar] |
|---|---|---|---|
| 1: 6 buses, 1 MW | 0.881 | 2.61 | |
| 2: 12 buses, 1 MW | 0.803 | 6.35 | |
| 3: 6 buses, 350 kW | 0.902 | 2.29 | |
| 4: 12 buses, 350 kW | 0.878 | –0.94 | 2.66 |
Disclaimer/Publisher’s Note: The statements, opinions and data contained in all publications are solely those of the individual author(s) and contributor(s) and not of MDPI and/or the editor(s). MDPI and/or the editor(s) disclaim responsibility for any injury to people or property resulting from any ideas, methods, instructions or products referred to in the content. |
© 2025 by the authors. Licensee MDPI, Basel, Switzerland. This article is an open access article distributed under the terms and conditions of the Creative Commons Attribution (CC BY) license (http://creativecommons.org/licenses/by/4.0/).
Copyright: This open access article is published under a Creative Commons CC BY 4.0 license, which permit the free download, distribution, and reuse, provided that the author and preprint are cited in any reuse.


