
Submitted:
02 December 2025
Posted:
03 December 2025
You are already at the latest version
Abstract
With respect to safety-critical infrastructure such as nuclear power plants, offshore wind turbine platforms, and cross-sea bridges, the coupled effects of carbonation, corrosion, and fatigue may lead to catastrophic failures. In this study, an experiment involving 14 reinforced concrete beams was conducted to investigate the indirect coupling effect of fatigue damage and a carbonation environment. On the basis of the results of the fatigue damage tests, porosity was selected as the damage variable. Finally, based on the electrochemical principles of reinforcement corrosion and considering the impact of fatigue damage on oxygen diffusion, a corrosion-based electrochemical model for reinforced concrete under the coupled effects of fatigue damage and carbonation was established, along with a numerical simulation. The key factors influencing the reinforcement corrosion behavior were also analyzed. (1) The oxygen concentration distribution at any position on the steel reinforcement surface within the concrete increased with increasing damage, whereas the lowest oxygen concentration occurred at the interface between the anode and cathode. The corrosion current density on the steel reinforcement surface reached its maximum value at the anode–cathode interface, and the average corrosion rate increased with increasing damage. The corrosion rate of steel reinforcement in concrete with 82.5% damage was up to 18% higher than that observed in undamaged concrete. (2) When the saturation rate s < 0.7, the corrosion of the reinforcing steel in concrete was mainly controlled by its resistivity, and the corrosion current density increased with increasing saturation; when the saturation rate S > 0.7, the corrosion process was controlled by cathodic oxygen diffusion, and the corrosion current density decreased with increasing saturation. (3) Compared with the effect of temperature, the influence of fatigue damage on the corrosion potential was weaker. The average corrosion current density increased with both temperature and fatigue damage. For concrete with 82.5% damage, the average corrosion current density was 0.00265 A/m² at a certain temperature and increased to 0.00315 A/m² at a higher temperature, representing an increase of approximately 20%. (4) When the concrete was undamaged, the average corrosion current density of the reinforcing steel anode continuously decreased as the thickness of the concrete cover increased. However, after the damage level increased, the average corrosion current density of the anode initially increased but then decreased with increasing cover thickness. The results of this study provide a theoretical basis and a reference for the safe operation and maintenance of major engineering projects.
Keywords:
steel reinforcement corrosion
; fatigue-damaged concrete
; carbonation environment
; reinforcement corrosion rate model
; fatigue damage test
; corrosion test
1. Introduction
Fatigue loading can cause damage and cracking in concrete, allowing carbon dioxide to diffuse more rapidly into the interior of the concrete along these cracks. This accelerates the carbonation process, leading to cracking and spalling of the concrete cover, which in turn causes the onset of reinforcement corrosion to occur earlier. Based on the degree of concrete corrosion and changes in the cover layer, the corrosion process of the reinforcement mechanism can be divided into four stages: the initiation stage of corrosion, the propagation stage of corrosion, the initial cracking stage of the cover due to corrosion, and the crack propagation stage [1]. During the initiation stage, although the internal environment of the concrete deteriorates continuously because of fatigue-induced damage and carbonation, the passive film on the surface of the reinforcement has not yet been depassivated; thus, corrosion does not occur. Once the carbonation front reaches the surface of the reinforcement, corrosion begins, marking the entry into the propagation stage of corrosion, which involves the generation and accumulation of corrosion products. In the context of heavy-haul railway bridge engineering, from the perspectives of safety, serviceability, and durability, engineers are particularly concerned with the durations of the first two stages. Therefore, for the propagation stage of corrosion, establishing an accurate and practical corrosion rate model that can predict the corrosion rate of reinforcement is critically important.
Scholar Igsor [2] first proposed a model for predicting the corrosion rate of reinforcing steel in concrete structures on the basis of the electrochemical principles of corrosion. By solving the electrochemical potential of Laplace's equation under appropriate boundary conditions, the corrosion rate on the surface of the reinforcing steel can be calculated. This type of electrochemical model can fully reflect the influences of the electrochemical parameters of corrosion, which is conducive to further research on electrode reactions and other influencing factors. Bastidas et al. [3] reported that the combined effects of corrosion and fatigue strongly influence the structural performance of reinforced concrete structures. Corrosion leads to a reduction in the cross-sectional area of the reinforcing steel, whereas fatigue causes crack initiation and propagation in the steel. When considered together, fatigue loading initiates cracks, whereas environmental factors affect the crack propagation trend, resulting in a significant reduction in the expected service life.
Currently, conducting research on the coupled effects of environmental factors and fatigue damage on concrete reinforcement corrosion is challenging because of the complexity of coupled experiments, their long durations, and the difficulty of developing numerical solutions. To address this, an experiment involving 14 reinforced concrete beams was conducted in this study to investigate the indirect coupling effect between fatigue damage and a carbonation environment. On the basis of the results of the fatigue damage tests, porosity was selected as the damage variable. Finally, based on the electrochemical principles of reinforcement corrosion and considering the impact of fatigue damage on oxygen diffusion, a corrosion-based electrochemical model for reinforced concrete under the coupled effects of fatigue damage and carbonation was established, along with a numerical simulation. The key factors influencing the reinforcement corrosion behavior were also analyzed.
2. Test Procedure
2.1. Materials and Specimens
This test involved the design of 14 reinforced concrete model beams with dimensions of 150 mm × 200 mm × 1500 mm. Among them, one beam was employed for static testing, two beams were undamaged control beams, three beams were used for fatigue failure testing, and eight beams were utilized for fatigue damage testing. The specimen grouping design and loading overview are presented in Table 1. The concrete used in the test beams was made with 52.5R-grade ordinary Portland cement. The fine aggregate was natural river sand, and the coarse aggregate was crushed limestone with a maximum particle size not exceeding 20 mm. Tap water acquired from the laboratory was used. The specific mixing proportions, mineral compositions, and chemical components of the concrete are detailed in Table 2. The strength of the designed concrete was C50, and the reinforcement layout is shown in Figure 1. To facilitate the measurement of steel corrosion and the installation/removal of reinforced concrete beams, the reinforcing bars extended 50 mm beyond both sides of the beam. Wires were welded along the bottom of the bars and led out from one side. Strain gauges were attached to the reinforcing bars before the concrete samples were cast. The areas with strain gauges and the ends of the reinforcing bars were sealed with epoxy resin and then numbered and grouped to ensure that the markings would not be lost because of concrete casting or wear during use.
2.2. Bend Fatigue Test
The concrete samples were standard-cured for 28 days and then subjected to fatigue tests using a PMS-500 hydraulic pulsation testing machine with a loading frequency of 4 Hz. The loading process consisted of three stages: static load testing, fatigue failure testing, and repeated loading testing. Among them, A1 underwent a static failure test to obtain static test results (the cracking load, yield load, and ultimate load were 28 kN, 79 kN, and 90 kN, respectively); A2, A3, and A4 were subjected to fatigue failure tests under different load levels. The upper and lower limits of the fatigue load for each test beam were determined by multiplying the ultimate load by the expected load level. The beams in group B underwent fatigue-carbonation-corrosion tests, whereas the beams in group C were subjected to fatigue-corrosion tests (still exposed to carbonation but without measuring the carbonation depth), forming constant-load groups corresponding to group B. The specific number of load cycles is shown in Table 1. Corrosion tests were conducted in situ using nondestructive testing methods before drilling for carbonation depth measurement purposes. The details of the carbonation tests and their results will be presented in other articles and are not elaborated here. The concrete mix proportions, mineral compositions and chemical compositions are shown in Table 2.
2.3. Hg Pressure Test
To investigate the effect of fatigue damage on pore structures, mercury intrusion tests were conducted on samples taken from each pure bending segment of specimens B0, B1, B2, B3, and B4 in group B (which had already been damaged) before carbonation tests were performed on the test beams in an environmental simulation chamber. This was done to analyze the changes exhibited by the internal pore structure of the concrete during the fatigue loading process. Notably, owing to the limitations of the testing equipment, the samples mainly consisted of mortar parts without aggregates. However, in general, changes in the pore volumes of concrete are primarily attributed to the volume changes exhibited by the mortar part, and further discussion is needed regarding the contributions of other components to pore volume changes.
2.4. Rust Test
1. Specimen Preparation
After the fatigue damage test, a four-point bending, self-anchoring loading method was used to apply bending stress to the samples via a specifically designed tension bolt loading device, simulating the stress condition of the fatigue damage test. A schematic diagram of the loading device is shown in Figure 2. Pressure was applied synchronously at both ends through a jack and a load cell. When the load reached the target level, the bolts on the four rods were tightened to create a pretension force in the rods. To reduce the influence of stress relaxation on the rods themselves, an overtensioning method was employed in this test. The overtensioning load was set to 1.05–1.1 times the design load, held for 3–5 minutes, and then released. Afterward, the tension force was reapplied to the design load, and the bolts were tightened using a wrench. The target design load for the test was a test beam cracking load of 28 kN, and groups B and C formed a pair of holding groups.
This experiment assumed that carbon dioxide erosion is a one-dimensional transport process. Therefore, before the load was applied to the sample, epoxy resin was used to seal all five surfaces of the test beam except for the tension zone on the bottom surface, which was affected by fatigue damage. The load was then applied to the test beam according to the aforementioned method to form the test sample. Markings were made on the sides of the test beam, and a temperature and humidity meter was placed on the steel plate surface of the concrete to calibrate the temperature and humidity environment inside the simulation chamber.
2. Artificial accelerated simulation method for environmental test chambers
The environmental simulation chamber is shown in Figure 3. In this paper, the natural climate conditions of a certain region are taken as an example. The annual natural environmental factors and the environmental factors of the accelerated simulation test are listed in Table 2 and Table 3. The monthly average temperature in this region ranges from 0 to 30 °C, the relative humidity ranges from 70 to 75%, and the atmospheric carbon dioxide concentration generally does not exceed 0.05% regardless of seasonal changes. On the basis of the similarity, acceleration, and repeatability characteristics of the carbonation environment-based simulation chamber method combined with accelerated testing, the following test regime for the environmental simulation chamber was established.
(1) Carbon dioxide concentration: Based on the test objectives and the acceleration requirements of the environmental simulation test, the carbon dioxide concentration in this test was controlled at approximately (%).
(2) The relative humidity, which was the same as that of the natural environment, was controlled at ()% in this test;
(3) The temperature was divided into a low-temperature phase (November to March), a medium-temperature phase (April and October), and a high-temperature phase (May to September). The time ratio corresponding to these three phases was 5:2:5. Considering the acceleration of the test, a temperature acceleration factor of 1.5 was selected. That is, the accelerated simulated test adopted the temperature values shown below for the three phases, with the corresponding time ratio still being 5:2:5. (4) The test followed a cyclic period system, with each cycle lasting 6 days, i.e., 144 hours. According to the aforementioned time ratio of 5:2:5, the durations at which low, medium, and high temperatures were observed in each test cycle were 60 hours, 24 hours, and 60 hours, respectively.

3. Corrosion testing determination
The CST700 steel reinforcement corrosion tester was used to measure the corrosion current density of the steel bars embedded in the concrete. This instrument is based on the principle of AC impedance and employs interchangeable electrode technology to confine the polarization current to a specific area while automatically compensating for the current to improve the accuracy of the corrosion rate measurement process. The test could produce data such as the corrosion current density and corrosion potential of the steel reinforcement.
The specific operation was as follows. Before the drilling step of the carbonation test, the surface of the concrete area to be tested was first moistened for more than half an hour. Afterward, a wet cloth flat was placed on the concrete, and the disc probe was laid flat on the wet cloth, ensuring close contact between the disc probe and the saturated wet cloth. One end of the instrument was connected to the probe electrode through an interface, while one working electrode wire was connected to the wire extending from one end of the reinforcing bar in the concrete. The measurement process was conducted twice, and one reinforcing bar (the one connected to the working electrode wire) was measured each time from left to right until it passed through the pure bending section, after which it returned from right to left for measurement purposes. Since the crack spacing is generally 50–100 mm, during the measurement process, the measurement positions were the same as the previously mentioned drilling positions, with each interval being 50 mm. The measurement procedure was continued only after the data stabilized. Before the exposed reinforcing bar wire was connected to the working wire, it needed to be sanded with sandpaper to prevent rust at the wire end from affecting the measurement results. A schematic diagram and a photograph of the process used to measure the corrosion suffered by the steel bars are shown in Figure 4 and Figure 5, respectively.
3. Results and Analysis of the Experiment
3.1. Fatigue Damage Test Results
On the basis of the literature [4,5,6,7] and the above fatigue test beam loading results, the S-N curve of the concrete beam is fitted as follows (Equation 1):
On the basis of the above formula, the estimated fatigue life of the normal fatigue test beam is approximately 8 million cycles, with a fitting coefficient of 0.9772, indicating that this formula provides a good match and strong guidance for estimating the fatigue life in this test. To select an appropriate damage index for quantifying the effect of damage on concrete carbonation, different levels of damaged concrete beams are obtained by observing the residual strain suffered by the steel bars, the residual strain of the concrete, the flexural stiffness, the crack development trend, and the pore structure evolution process. The development patterns of the maximum crack width, relative flexural stiffness, compressive residual strain of the concrete at the top of the beam, tensile residual strain of the steel bars, and porosity of the fatigue test beams are shown in Figures 6 to 11, respectively.
1. Crack propagation
As shown in Figure 6, the crack development process follows a “three-stage” pattern: a crack initiation stage, a stable propagation stage, and a fatigue failure stage. The boundaries between these stages correspond to fatigue life ratios of 0–0.1 and 0.7–0.8, respectively. In the first stage, the crack width is approximately 0–0.15 mm; in the second stage, it ranges from approximately 0.15 to 0.25 mm. When the maximum crack width exceeds 0.25 mm, the test beam enters the fatigue failure stage, where the crack width increases rapidly, eventually leading to a fatigue failure. Unlike those caused by static load failures, cracks caused by fatigue loading stabilize in terms of spacing once they enter the stable propagation stage. As the number of fatigue cycles increases, new cracks do not form significantly, and the existing cracks continue to propagate.
Cracks propagate into finer secondary cracks; additionally, when the applied load is removed, the generated cracks tend to close, and upon experiencing continued loading, they reopen. From the analysis of the experimental observations, it can be concluded that under the same number of fatigue cycles, a higher loading level results in a greater maximum crack width in the beam. Even though the proportion of the first stage of the fatigue life is very small, under high loading levels, the maximum crack width in the first stage can still reach 0.2 mm. The threshold crack width for inducing a fatigue failure is approximately 0.7 mm.
2. Relative flexural stiffness
The relationship between the relative flexural stiffness of the test beams and the fatigue life ratio is shown in Figure 7. In group A, the initial stiffness of beam A2 is significantly lower than those of A3 and A4 because the differences between their loading levels cause variations in the initial stiffness of the beams. Moreover, the higher the applied load is, the faster and more pronounced the stiffness degradation becomes. In groups B and C, since the loading levels are similar, the initial stiffness differences are not significant. For group A, the final residual relative flexural stiffness decreases as the loading level increases, whereas for groups B and C, the residual relative flexural stiffness continuously decreases as the number of fatigue cycles increases.
The test results indicate that the degradation exhibited by the relative flexural stiffness of the test beam clearly follows a “three-stage” pattern. In the first stage, the relative stiffness of the test beam declines rapidly, with the corresponding relative flexural stiffness ranging from approximately 0.7 to 1 and the corresponding fatigue life ratio ranging from 0 to 0.1. In this stage, the flexural stiffness of the beam decreases by approximately 30% compared with the initial stiffness. After experiencing the first 10% to 15% of the fatigue life cycle, the beam enters the second stage of fatigue development, during which the flexural stiffness gradually stabilizes, with the corresponding relative flexural stiffness ranging from approximately 0.6 to 0.7 and the corresponding fatigue life cycle spanning from 10% to 75%. By the end of the second stage, the flexural stiffness of the beam has degraded by approximately 40% compared with its initial stiffness. When the relative flexural stiffness of the test beam drops sharply below 0.6, the concrete beam enters the third stage until a fatigue failure occurs, with the flexural stiffness of the test beam at failure generally ranging between 45% and 60% of its initial stiffness.
3. Residual strain of the concrete in the compressed zone
As shown in Figure 8, the residual strain experienced by the concrete in the compressed zone at the top edge of the beam increases with the number of fatigue cycles and follows a two-stage development pattern. In the initial stage, which corresponds to the first 10% of the fatigue life cycle, the residual strain increases rapidly but then continues to develop steadily thereafter.
The test results indicate that the relationship between the mid-span load and the strain increase is approximately linear. As the number of fatigue loading cycles increases, the slope of the relationship curve continuously decreases. Initially, the rate of decrease is relatively rapid, as manifested by a larger spacing between the curves within the same cycle interval. Later, the relationship gradually stabilizes, and the maximum stress at the edge of the compressed zone of the beam does not exceed 1000 με, which is much lower than the static load capacity and remains in the linear stage.
4. Residual strain of tension reinforcement
As shown in Figure 9, the development process of the residual strain in the tension reinforcement follows a three-stage pattern in the fatigue life curve. In the first stage, the residual strain ranges from approximately 0 to 600, corresponding to a life cycle percentage of 0 to 10%. In the second stage, the residual strain ranges from approximately 600 to 1100, corresponding to a life cycle percentage of 10% to 75%. After the residual strain in the reinforcement exceeds 1100, the concrete beam enters the third stage, where the residual strain increases rapidly until a fatigue failure occurs. This stage occurs within the last 10% to 20% of the fatigue life cycle.
The test results indicate that during the initial loading phase, the relationship between the load and the strain experienced by the reinforcing steel is approximately linear. As the number of repeated load cycles increases, the slope of the load–strain curve continuously decreases and gradually becomes convex, approximately forming a two-segment linear shape. Initially, the slope reduction rate is relatively fast, resulting in greater spacing between the curves within the same cycle interval; however, it gradually stabilizes later, resulting in a three-stage pattern that is characterized by sparse–dense–sparse spacing. As the upper limit of the fatigue load increases and as the number of repeated load applications increases, one of the tensioned reinforcing bars first experiences a fatigue fracture and exits service, causing an abrupt increase in the stress imposed on the remaining bars and leading to a distinct stress redistribution phenomenon.
for reinforcing steel.
5. Porosity rate
As shown in Figure 10 and Figure 11, the most likely pore diameter mainly peaks at approximately 75 nm. With increasing fatigue damage, the pore size distribution gradually changes: the number of pores within the range from 500 nm to 1000 nm decreases, whereas the number of pores within the range from 10 nm to 125 nm increases significantly. This is primarily because fatigue damage mainly affects the microstructure of the concrete. As damage accumulates continuously, new defects and microcracks constantly appear inside the material, leading to an increase in the number of smaller pores, whereas larger pores gradually evolve into cracks, resulting in a reduction in their quantity.
The fatigue cycles of the test beams used as samples are distributed mainly in the first and second stages of the entire fatigue life cycle, i.e., within the first 80 to 90% of the fatigue life ratio. The change in porosity observed during the third stage is not significant from the perspective of durability life because the concrete members are close to failure at this point and would no longer be used. Therefore, this study focuses mainly on the changes in the test beams during the first two stages of the fatigue life cycle. The test results reveal that during the first and second stages of the fatigue life cycle, the porosity of the concrete increases linearly with increasing number of fatigue load cycles. The porosities of B1, B2, B3, and B4 increase by up to 69% to 8.4000%, 8.8822%, 10.6148%, and 14.2011%, respectively.
On the basis of the above experimental results, the regression expression relating the porosity to the fatigue life ratio is fitted as follows:
In this paper, porosity is selected as the damage variable to investigate the effect of concrete fatigue damage on carbonation from the perspective of microstructural pore mechanisms; that is, the degree of damage D is defined as follows:
where D represents the damage variable defined by porosity; denotes the porosity of the concrete in the undamaged state; denotes the porosity of the concrete after n fatigue cycles; and denotes the porosity of the concrete at the end of the second beam development stage.
The damage variable is generally a function of the fatigue life ratio n/N. Substituting Equation (3) into Equation (2) yields
The porosity in the first and second fatigue life stages is proportional to the fatigue life ratio n/N; thus, the degree of damage D is approximately equal to the fatigue life ratio. To quantify the effect of damage on the carbonation level, a fatigue load influence factor is introduced here, which can be expressed by the following equation:
where represents the porosity of undamaged concrete, represents the porosity after the concrete suffers fatigue damage, and represents the factor for the influence of fatigue loading on porosity, for which > 1. Combining the fitting results derived from the experiments, the fitted porosity relationship under different degrees of fatigue damage can be obtained as follows:
3.2. Corrosion Test Results
On the basis of the results of the previous carbonation tests and concurrent corrosion tests, it is known that reinforcement corrosion in the test beams began approximately 96 days after they were placed in the simulated environmental chamber. Therefore, the reinforcement corrosion test results obtained after 120 days are adopted here to ensure that all the damaged beam samples have started to corrode. However, numerous complex factors influence the corrosion current density, and currently, there is no definitive criterion for relating the corrosion current density to the corrosion status. On the basis of extensive experiments, Scholar Millard [8] provided criteria for determining corrosion rates under different corrosion conditions, as shown in Table 4.
The results of the corrosion current density test conducted on the reinforcing steel in damaged concrete are shown in Figure 12. As shown in the figure, the corrosion current density of the reinforcing steel in groups B and C generally increases with increasing damage level. Moreover, owing to the presence of cracks, the corrosion current density varies significantly depending on the position on the steel surface, resulting in a “sawtooth” distribution. However, compared with that of group B, the corrosion current density distribution of Group C becomes “smoother” with increasing damage. This is because group B underwent carbonation drilling tests, which can be considered equivalent to creating very large cracks that provide major pathways for oxygen and water to penetrate the steel surface, resulting in more intense corrosion of the reinforcing steel in group B.
The test results concerning the corrosion potential of the reinforcing steel in damaged concrete are shown in Figure 13. Referring to the “Technical Standard for Building Structure Inspection” [9], “When the corrosion potential of reinforcing steel is between -350 and -500 mV, the probability of rusting is 95%; when it is between -200 and -350 mV, the probability is 50%; and when it is at or above -200 mV, the probability is 5%." The reinforcing steel in groups B and C are essentially corroded, and the corrosion potential becomes more negative as the degree of damage increases. Additionally, owing to the presence of cracks, the corrosion potential varies continuously across different positions on the surface of the reinforcing steel. The corrosion potential of group B is slightly lower than that of group C; combined with the previous analysis, this may be due to the drilling of holes in the concrete beams of group B, which made the reinforcing steel more susceptible to corrosion.
The results calculated for the average corrosion current density of the reinforced concrete rebars are shown in Figure 13. The average corrosion current density increases with increasing damage, but the increase is relatively small. This is because a constant humidity condition of RH = 70% is adopted in this experiment, which is a low-humidity environment. Under such conditions, rebar corrosion is mainly controlled by the resistivity of the surrounding environment; thus, the promoting effect of damage on the current density is relatively suppressed. The carbonation drilling test conducted in group B leads to an increase in the corrosion current density, but the difference is not significant, indicating that the drilling process has a limited impact on rebar corrosion. As shown in Table 4, the average corrosion current densities of the test beams range from approximately 0.0025 to 0.0035 A/m², which corresponds to a moderate corrosion level. The average corrosion current density of the reinforcement in the different damaged concrete groups is shown in Figure 14.
4. Model of the Reinforcing Steel Corrosion Rate in Fatigue-Damaged Concrete in a Carbonation Environment
4.1. Reinforcement Corrosion Rate Model
In accordance with the distribution range of the corrosion zones, the corrosion forms of reinforcing steel can be classified as “uniform corrosion” and “localized corrosion”. Corrosion caused by concrete carbonation is usually referred to as uniform corrosion, which can be considered the case in which numerous microscopic corrosion cells occur chemically on the steel surface with equal probability. However, the experimental results show that fatigue loading causes damage cracks to form on the surface of the concrete beams, allowing water and oxygen to reach the steel surface more quickly through these cracks. As a result, the corrosion rate near the cracks is significantly accelerated, leading to a localized corrosion effect similar to a “small anode–large cathode” phenomenon on the surface of steel. In this paper, the corrosion rate of reinforcing steel in fatigue-damaged concrete is investigated by establishing a macrocell model of steel corrosion. Assuming that the concrete is a homogeneous material, on the basis of the theory of electrical neutrality, the internal concrete forms a constant electric field during the steel corrosion reaction. The current density and electric potential are in a steady-state field and do not change with time. The electric potential distribution in the concrete satisfies the following Laplace equation:
where E is the corrosion potential and σ is the electrical conductivity, which is the reciprocal of the resistivity.
The corrosion potentials of the cathode and anode are as follows:
where and are the equilibrium potentials of the anode and cathode, respectively (in V); and 

and are the Tafel slopes of the anode and cathode, respectively; and are the exchange current densities of the anode and cathode (in A/m²), respectively; and is the limiting current density, as defined as [10]:
where z is the number of electrons transferred during the cathodic reaction, which is 4; F is the Faraday constant, which is taken as 96485 C/mol; d is the effective thickness of the oxygen diffusion layer, which is usually taken as the thickness of the concrete cover; is the oxygen gas concentration at the concrete surface, which is typically 8.67 mol/m³; and is the diffusion coefficient of oxygen in fatigue-damaged concrete.
The corrosion current density inside the concrete is derived from Ohm's law:
In the above equation, E is the corrosion potential, ρ is the resistivity of concrete (), and n is the normal direction of the equipotential lines.
Generally, the corrosion rate of reinforcing steel is more representative when expressed in terms of the average anodic corrosion current density:
where is the corrosion current density and is the length of the anodic area on the reinforcing steel surface.
4.2. Parameters of the Reinforcement Corrosion Rate Model
4.2.1. Electrochemical Parameters
There are numerous electrochemical parameters, and owing to the uncertainty of their effects, studying these parameters will provide valuable information for researchers and engineers who wish to model reinforcement corrosion in concrete. Both domestic and international studies have discussed the parameter values. Igsor [11,12] summarized various studies and provided basic ranges for electrochemical parameters: the cathodic equilibrium potential ranged from 120 to 200 mV, while the anodic equilibrium potential ranged from -820 to -640 mV; the cathodic exchange current density ranged from 0.1 to 12.4, and the anodic exchange current density ranged from 1 to 374; and the cathodic Tafel slope ranged from, and the anodic Tafel slope ranged from. Table 5 presents some of the values for the electrochemical parameters in the corrosion models proposed by both domestic and international scholars.
4.2.2. Temperature
Changes in the conditions of the external environmental significantly affect the corrosion of reinforcing steel, and the effect of temperature is particularly complex. This complexity mainly arises from the influence of temperature on corrosion kinetic parameters, such as the Tafel slope, exchange current density, equilibrium potential, and oxygen diffusion rate.
From the Nernst equation, on the basis of the steel reinforcement corrosion reaction, the equilibrium potentials at different temperatures can be obtained as follows:
where and represent the anode and cathode equilibrium potentials, respectively, at temperature T (in V); and correspond to the anode and cathode equilibrium potentials, respectively, at temperature T0 (in V), with T0 taken as the standard room temperature of 298 K; denotes the concentration of (mol/m³); represents the concentration of (mol/m³); and represents the oxygen concentration.
At an ambient temperature of 298 K, setting the anode equilibrium potential and the cathode equilibrium potential , the expressions for the anode and cathode equilibrium potentials at temperature T are as follows:
The exchange current density of a metal is influenced by the surrounding temperature and the properties of the substrate, as temperature changes inevitably affect the chemical reaction constant as well as the concentration of the reactants. When the electrode is in equilibrium, its net current density is zero, at which point the anodic and cathodic current densities are equal. The exchange current density at any temperature can be expressed as follows:
where and correspond to the exchange current densities observed at temperatures T1 and T2, respectively, in . At room temperature (298 K), the exchange current densities for the anode and cathode are and 6, respectively. Substituting Equations (15) and (16) into Equation (17), we obtain the exchange current density at any temperature as follows:
4.2.3. Saturation and Resistivity
The internal pores in concrete serve as critical pathways for various corrosive media to react and cause reinforcement corrosion. Xu Chen [18] proposed the notion that the changes exhibited by the temperature and humidity within concrete lag behind those of the external environment, with humidity showing a more pronounced lag. Therefore, using pore saturation as a humidity parameter for research purposes is a more accurate and stable strategy than using relative humidity. Moreover, the pore saturation of concrete not only affects the oxygen diffusion coefficient but also influences matrix properties such as electrical conductivity. Since numerous factors affect both electrical conductivity and saturation, it is assumed for simplifying the calculations that saturation influences only the oxygen diffusion coefficient and electrical conductivity. By combining experimental data, Muehlenkamp [19] studied the corrosion rate observed at different moisture contents and proposed a relationship curve between pore saturation and electrical conductivity in porous concrete (Figure 15).
When the internal environment of the concrete is extremely dry, the electrical conductivity approaches zero at this time, and the ability of ions and electrons to migrate within the concrete is very limited. The corrosion control mechanism can be considered a resistance-controlled scheme. However, when the saturation level exceeds 0.70 (corresponding to a relative humidity of approximately 90–95%), the corrosion control mechanism gradually shifts to cathodic oxygen diffusion control. The specific type of corrosion control employed for reinforcing steel within concrete components depends on the material properties of the concrete itself and the surrounding environment. As external environmental conditions change, the control mechanism also changes accordingly. According to reference [20], the water content of concrete influences the corrosion rate control mechanism of reinforcing steel. Under high-humidity conditions where the water content exceeds 75% (corresponding to a relative humidity in the air above 90%), the corrosion rate is controlled by cathodic oxygen diffusion. In general, in environmental conditions where the water content is less than 75% (corresponding to a relative humidity level below 90% in the air), the corrosion rate is controlled by anodic ionization. As the relative humidity further decreases and the concrete gradually dries out, the control mechanism becomes a combined effect of concrete resistance control and anodic control.
4.2.4. Oxygen Diffusion Coefficient Under Fatigue Damage
This article assumes that all oxygen is consumed by the cathodic reaction, without considering the oxygen consumed when converting divalent iron to trivalent iron, as this transformation process may be quite prolonged and its simulation is extremely difficult. Therefore, oxygen does not participate in any chemical reactions within the concrete during transportation, and the oxygen consumption level in the cathodic region on the steel surface can be considered an internal boundary condition for oxygen diffusion.
Under steady-state conditions, the diffusion process of oxygen from the concrete surface to the cathode surface of the reinforcing steel reaches equilibrium with the oxygen consumption process at the interface between the steel and the concrete. The distribution of the dissolved oxygen in the concrete is determined by solving the following differential equation:
where represents the dissolved oxygen concentration in the pore solution and is the effective diffusion coefficient of oxygen in fatigue-damaged concrete. The oxygen gas concentration on the surface of concrete is generally 8.67 mol/m³, while the solubility of oxygen typically ranges from 0.025 to 0.028. Therefore, under normal temperature conditions, the dissolved oxygen concentration on the surface of the concrete is approximately 0.22 mol/m³.
Papadakis[21] reported that the diffusion rate of a gas is related to its own molar mass and that the effective diffusion coefficient of a gas is inversely proportional to the square root of its molar mass. Therefore, the effective diffusion coefficient of oxygen can be determined through that of carbon dioxide.
The correlation coefficient is calculated as follows:
The effective diffusion coefficient of oxygen in fatigue-damaged concrete is as follows:
where is the effective diffusion coefficient of oxygen in fatigue-damaged concrete and is the diffusion coefficient of carbon dioxide in fatigue-damaged concrete.
4.3. Fatigue Damage and Reinforcement Corrosion Simulations in Concrete
4.3.1. Initial Conditions and Boundary Conditions
The macrocell corrosion model of the reinforcing steel is shown in Figure 16. A concrete length of L and a cover thickness of d are selected. L0, La, and Lc represent different regions under various boundary conditions, with the x-direction aligned along the reinforcing bar.
For the electrochemical field of reinforcement corrosion, the following properties hold.
(1) As the interface between the concrete and the external environment, L0 is subject to Neumann boundary conditions:
(2) There are multiple ways to select boundary conditions for La and Lc as the anode and cathode, respectively. In this paper, the corrosion current density is adopted as the boundary condition, which falls under the category of Neumann boundary conditions for La and Lc.
Among them, the anode and cathode current densities are as follows:
For the coupled oxygen diffusion field in the steady-state diffusion scheme, oxygen is consumed as soon as it reaches the cathode surface, and its boundary conditions are as follows.
(1) L0 and La boundary conditions:
(2) Lc boundary condition:
4.3.2. Numerical Calculation of the Corrosion Rate Model
The calculation process of this numerical model is presented in Figure 17, with the main computational steps listed as follows.
Step 1: Calculate the anode equilibrium potential, cathode equilibrium potential, anode exchange current density, and cathode exchange current density separately based on Equations (15), (16), (18), and (19) under different temperature and humidity conditions, and determine the effective diffusion coefficient of oxygen in damaged concrete, the limiting current density, and the resistivity.
Step II: Assign initial values to the corrosion current densities of the anode and cathode, substitute them into Equations (8) and (9) to calculate the corrosion potentials of the anode and cathode, and then determine the initial boundary conditions using Equations (25), (26), and (28).
Step III: Utilizing the boundary conditions obtained in Step II, solve Equation (7) to determine the concrete corrosion potential distribution, and solve Equation (20) to obtain the oxygen concentration distribution on the steel surface; subsequently, solve Equation (11) to determine the corrosion current density of the anode and cathode.
Step IV: Determine whether the cathode corrosion current density is less than the limiting current density. If not, adjust the corrosion current density, recalculate the anode and cathode corrosion potentials, and establish the boundary conditions for the anode–cathode region.
Step IV: Repeat the above steps and determine whether the relative errors of the corrosion potential and corrosion current density between the two consecutive calculations satisfy the imposed convergence criteria and regularity requirements; if so, stop the iterative process.
4.3.3. Validation of the Reinforcement Corrosion Model
Precisely controlling the test setup and environmental conditions is a major challenge in corrosion research, particularly in studies on reinforcement corrosion in concrete. The rusting model involves multiple electrochemical parameters, and the reasonable selection of these parameters is crucial to the accuracy of the model. These include , , , , and . Moreover, the rusting process is significantly influenced by variations in the external corrosion conditions, such as changes in the porosity caused by fatigue damage, the ambient temperature and humidity, the saturation level, and resistivity variations. After comprehensively considering the effects of cover thickness, temperature, kinetic parameters, the resistivity of concrete, and the limiting current density on the corrosion mechanism of reinforcing steel, the baseline electrochemical parameter values adopted in this study are as presented in Table 6.
The benchmark parameters for the simulation are as follows: the model length L is selected as 500 mm, which represents the mid-span section of the test beam. The corrosion characteristics representing nonuniform corrosion are chosen on the basis of the experimental results. The temperature follows a cyclic regime (see Section 2.4 for details), with a relative humidity (RH) level of 70% (the saturation rate s = 0.45). The cover thickness d is 35 mm, and the corresponding damage levels for B0(C0), B1(C1), B2(C2), B3(C3), and B4(C4) are 0%, 7%, 14%, 27.5%, and 82.5%, respectively. Under these experimental conditions, a sufficient oxygen supply is ensured; therefore, despite temperature variations, the effect on oxygen solubility is minimal, and the dissolved oxygen concentration at the concrete surface is approximately 0.22 mol/m³.
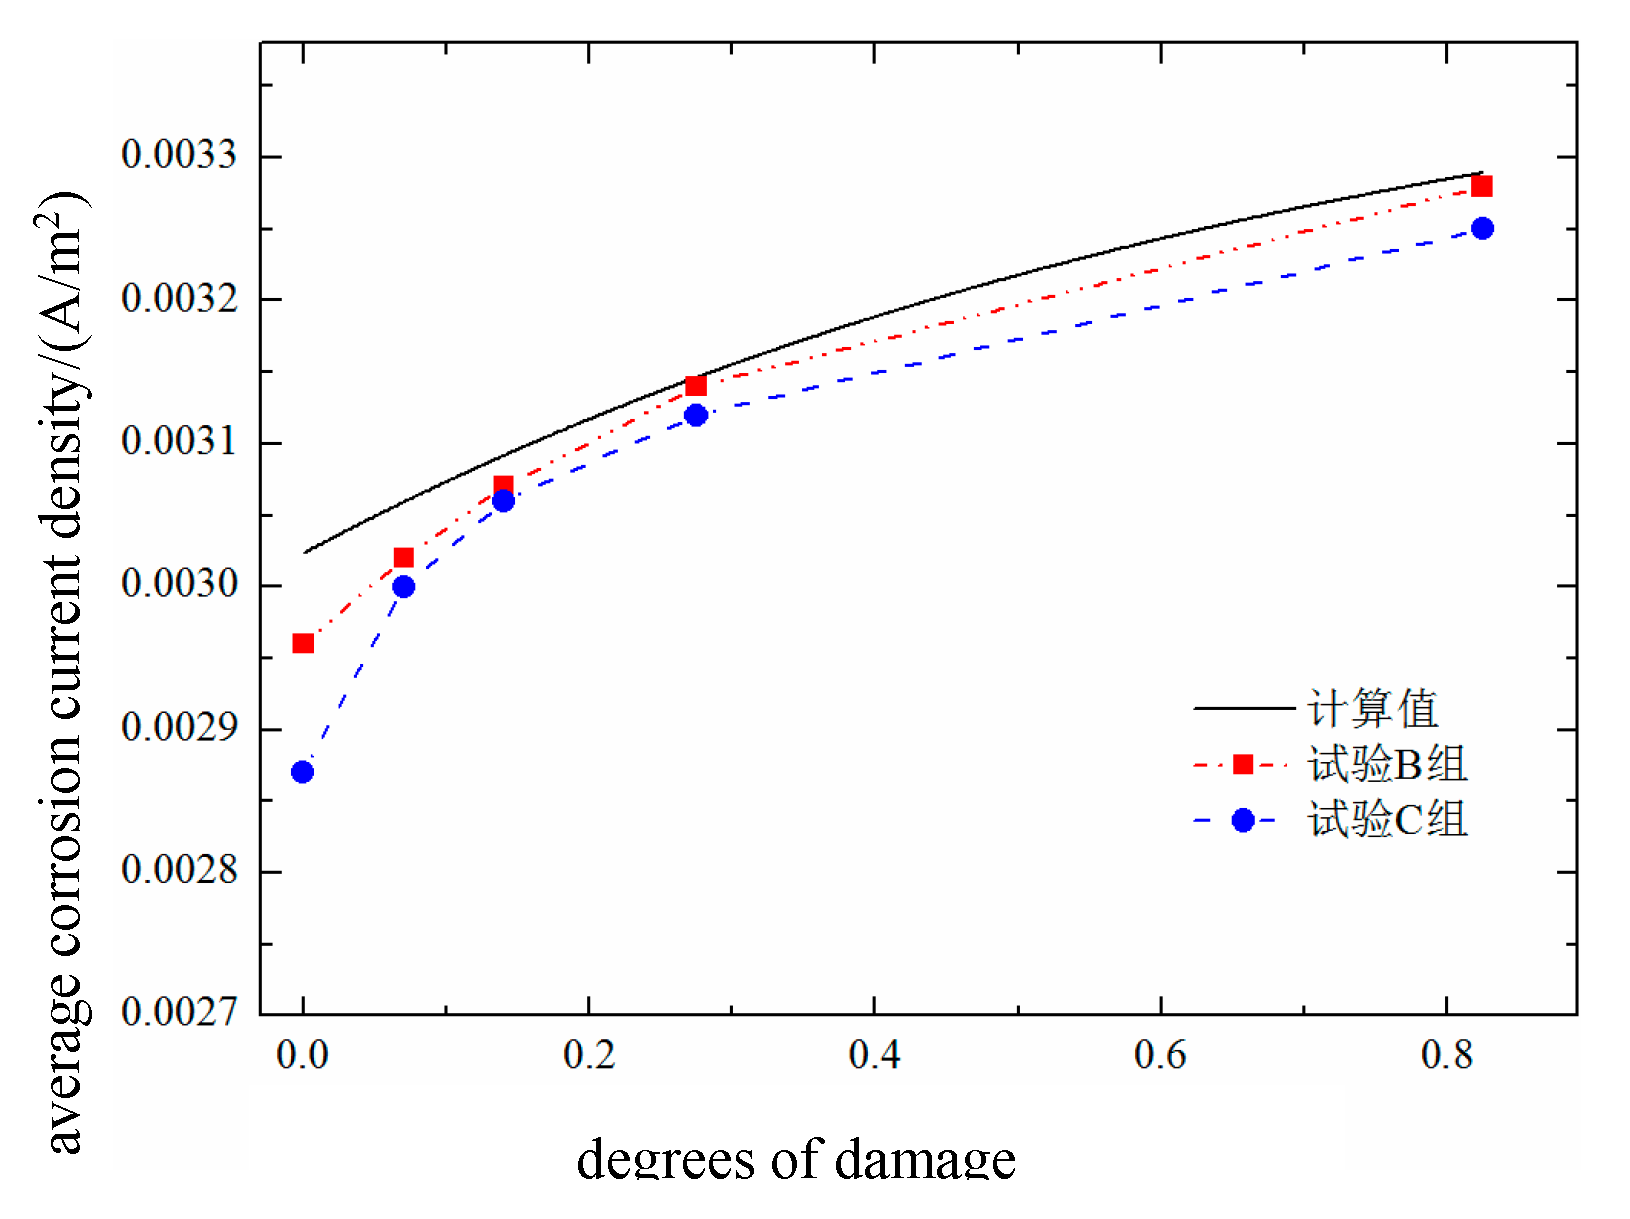
The variation curves produced for the average corrosion current density under the simulated and experimental results for reinforcing steel corrosion with different degrees of fatigue damage are shown in Figure 18, Figure 19, Figure 20 and Figure 21. As shown in the figure, the simulated values generally agree well with the experimental values, indicating that the established electrochemical corrosion model coupled with damage is applicable. It can also be observed that in a low-humidity controlled environment, damage still significantly promotes the corrosion of reinforcing steel. Compared with that of undamaged reinforced concrete, the corrosion rate of reinforced concrete with a damage level of 82.5% reaches a maximum increase of 18%.
4.4. Parametric Analysis
4.4.1. Effect of Saturation on Reinforcement Corrosion in Damaged Concrete
The relative humidity level of the natural environment typically ranges from 50% to 100%, so according to Figure 15, the simulated saturation range is selected as 0.3 to 0.8. Concrete samples with damage degrees of 0% and 82.5%, corresponding to B0 and B4, respectively, are chosen as examples, while all other conditions remain at their baseline parameter values. The effects of saturation on reinforcement corrosion in concrete with different degrees of fatigue damage are shown in Figure 22.
The oxygen concentration on the surface of the reinforcing steel is shown in Figures 22a and 22b. The oxygen concentration along the length of the steel bar is concave, reaching its minimum at the interface between the anode and cathode. Since oxygen is primarily consumed during the cathode reaction, the dissolved oxygen concentration on the cathode surface continuously decreases with increasing saturation, whereas the dissolved oxygen concentration on the anode surface remains largely unaffected by saturation changes. Moreover, the surface oxygen concentration at the interface between the reinforcing steel and concrete with a saturation rate of 0.3 is approximately 0.2 mol/m³, whereas for the concrete with a saturation of 0.8, the surface oxygen concentration is only approximately 0.05 mol/m³, indicating a fourfold difference. On the one hand, under low-saturation conditions, the dissolved oxygen concentration on the steel surface eventually reaches equilibrium with the external environment. On the other hand, the increase in pore water caused by higher saturation levels not only promotes the corrosion process involving oxygen but also significantly slows the inward diffusion rate of oxygen, thus leading to a decrease in the dissolved oxygen concentration as the degree of saturation increases. Fatigue loading causes internal micropores and cracks to expand, increasing the inward transport rate of oxygen. In this case, the oxygen concentration is jointly controlled by the fatigue damage and saturation levels.
The corrosion potential on the surface of the reinforcing steel is shown in Figures 22c to 22d. The corrosion potential of the anode progressively increases in the positive direction from the steel surface toward the anode–cathode interface, whereas the corrosion potential of the cathode also progressively increases in the positive direction along the steel surface toward the interface. Moreover, an increase in the saturation rate intensifies this phenomenon, with the cathode corrosion potential being more significantly affected by saturation. This is because the corrosion activity is more pronounced at the anode and cathode surfaces, enhancing the electrode activations of both electrodes. Additionally, the cathode potential is influenced by concentration polarization. When the degree of saturation increases, the concentration polarization at the cathode becomes stronger, resulting in a greater overpotential, which causes the cathode corrosion potential to shift more rapidly in the negative direction. Under different damage conditions, this trend still holds true; however, under high damage levels, the increased oxygen diffusion capacity caused by fatigue loading leads to higher oxygen concentrations, thereby reducing the concentration polarization overpotential and decreasing the rate at which the cathode corrosion potential shifts in the negative direction.
The corrosion current density on the surface of the reinforcing steel is shown in Figures 22e to 22f. The corrosion current densities of both the anode and the cathode gradually increase along the steel surface toward the anode–cathode interface. Furthermore, when the saturation rate exceeds 0.7, the corrosion current densities of both electrodes decrease. The cathode corrosion current density is constrained by the limiting current density, which increases with decreasing saturation rate and increasing damage. This is because both the reduction in pore water and the expansion of pores increase the oxygen diffusion coefficient, thereby increasing the limiting current density.
The effects of different saturation levels on the average corrosion current density of the reinforced steel in damaged concrete are shown in Figure 23. The average anodic corrosion current density initially increases but then decreases with increasing saturation rate, whereas this trend gradually changes as the damage increases. When the damage increases, the average anodic corrosion current density continuously increases with increasing saturation rate. This is because greater fatigue damage leads to more pores and cracks, which enhance the oxygen diffusion capacity of the concrete and gradually offset or even exceed the reduction in oxygen diffusion caused by increased saturation, resulting in a continuous increase in the average anodic corrosion current density. The results indicate that when the saturation level s < 0.7, the corrosion suffered by the reinforcing steel in the concrete is mainly controlled by the resistivity, so the average corrosion current density increases with increasing saturation; when the saturation rate S > 0.7, the corrosion process is controlled by cathodic oxygen diffusion, where higher saturation rates lead to a lower oxygen diffusion coefficients and thus lower average corrosion current densities.

4.4.2. Effect of Temperature on the Corrosion of Reinforced Steel in Damaged Concrete
The parameters involved in the corrosion of reinforcing steel, such as the equilibrium potential, exchange current density, limiting current density, and oxygen diffusion coefficient, are affected by temperature. On the basis of the temperature parameters used in laboratory tests and the typical temperature range observed in natural environments, a simulation temperature range of 278 K to 328 K () is selected. Concrete samples with damage degrees of 0% and 82.5%, corresponding to B0 and B4, respectively, are chosen as examples, while all other conditions are set to their baseline parameter values. The effects of temperature on the corrosion of reinforcing steel in concrete with different degrees of fatigue damage are shown in Figure 23.
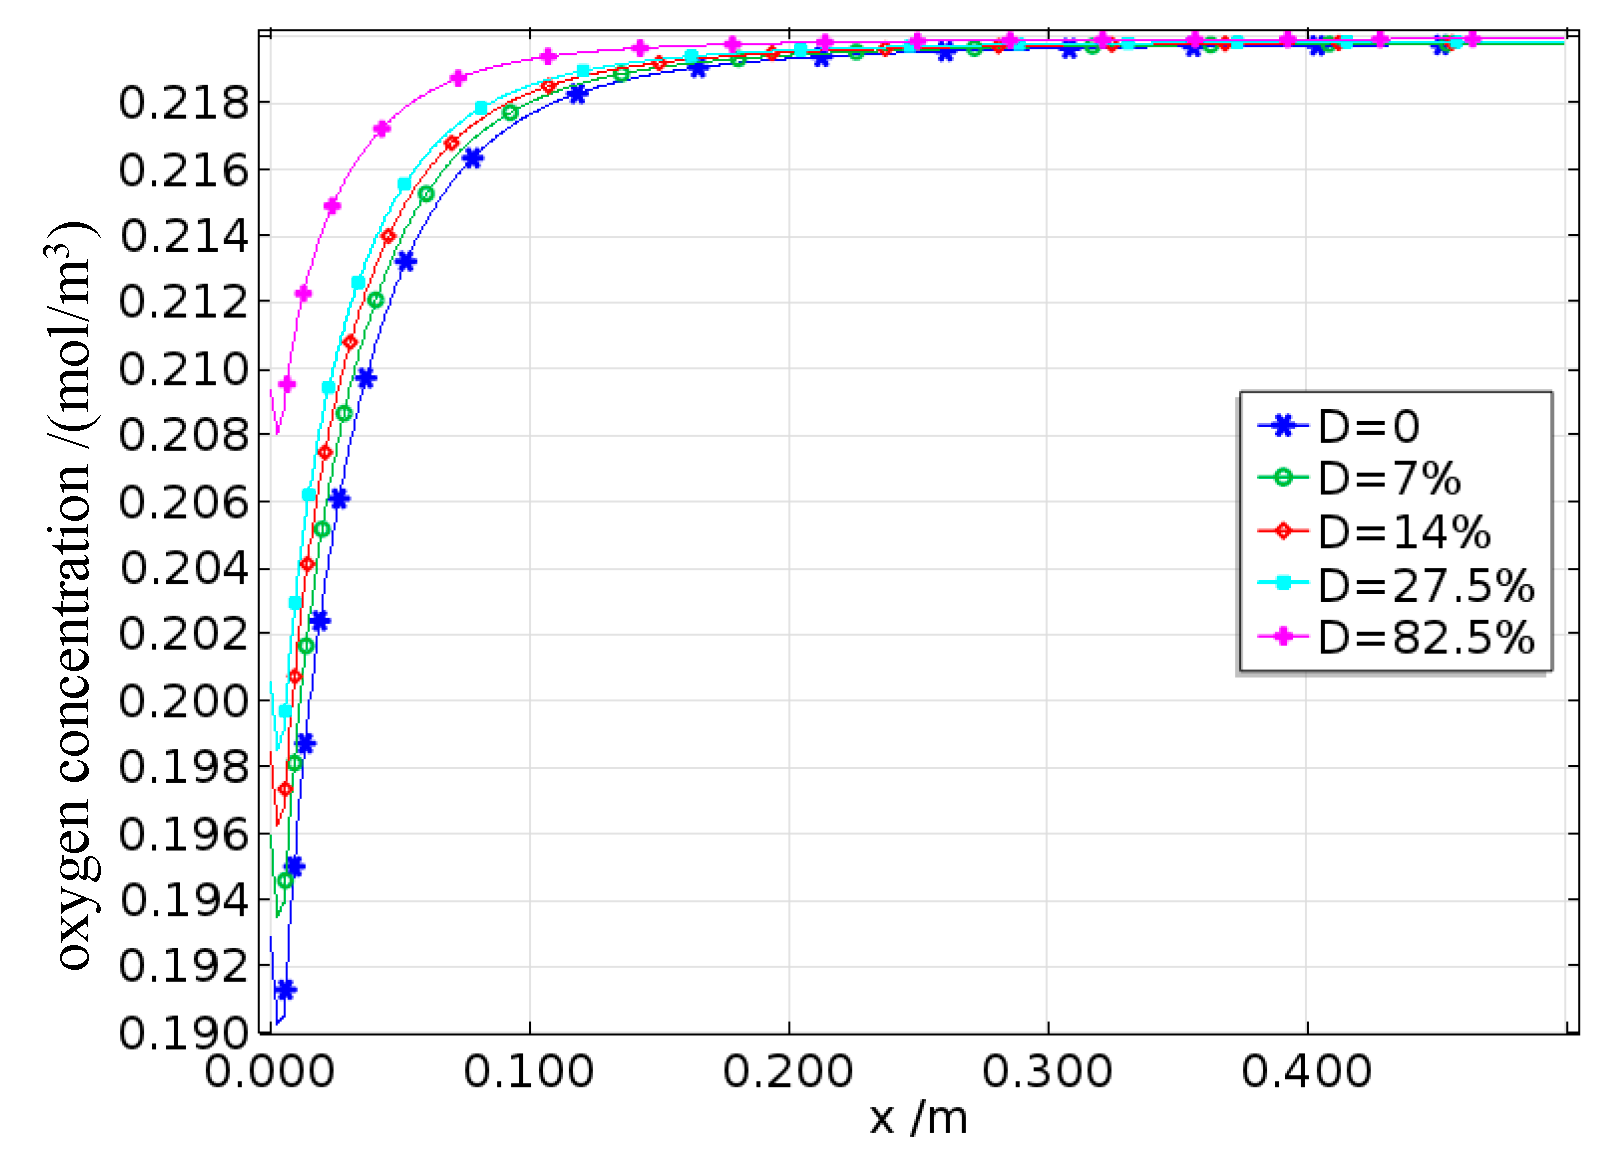
The oxygen concentration on the surface of the reinforcing steel is shown in Figure 24a to 24b. The oxygen concentration along the length of the reinforcing bar is concave, reaching its minimum at the interface between the anode and cathode. The dissolved oxygen concentration on the cathode surface decreases with increasing temperature, whereas that on the anode surface remains largely unaffected by temperature changes. This is partly because oxygen is mainly consumed at the cathode and partly because the increases in the temperature and fatigue damage level not only increases the diffusion rate of oxygen but also promotes corrosion reactions involving oxygen, thus accelerating its consumption. However, the results show that the dissolved oxygen concentration on the surface of the reinforcing steel increases with increasing temperature and damage, indicating that the promoting effects of temperature and fatigue damage on oxygen diffusion significantly outweigh their effects on oxygen consumption.
The corrosion potential observed on the surface of the reinforcing steel is shown in Figure 24c to 24d. Once corrosion occurs, both the anode and the cathode begin to polarize. The corrosion potentials increase progressively in the positive and negative directions along the steel surface toward the anode–cathode interface. With increasing temperature, the corrosion potentials of both the anode and cathode shift in the negative direction. Specifically, when the temperature increases from one level to another, the corrosion potential shifts negatively by approximately 100 mV. The reason for this phenomenon is that temperature acts as a catalyst, promoting electrochemical reactions, and theoretically, the anode and cathode corrosion potentials should shift in the positive and negative directions, respectively. However, according to Equations (15)–(16) and (18)–(19), the effect of temperature on increasing the anodic exchange current density is much greater than its effect on the anodic equilibrium potential. As a result, on the basis of Equation (9), the anodic corrosion potential shifts in the negative direction. In comparison with the effect of temperature, the influence of fatigue damage on the corrosion potentials is weaker.
The corrosion current density observed on the surface of the reinforcing steel is shown in Figure 24e to 24f. The corrosion current densities of both the anode and the cathode gradually increase along the steel surface toward the anode–cathode interface. Additionally, the limiting current density of the cathode increases with increasing temperature and damage. This is because an increase in temperature enhances the diffusion coefficient of oxygen, thereby increasing the limiting current density.
The effects of different temperatures T on the average corrosion current density of the reinforcing steel in damaged concrete are shown in Figure 25. The results indicate that the average corrosion current density on the steel surface increases with both the temperature and fatigue damage level. For concrete with 82.5% damage, the average corrosion current density is 0.00265 A/m² at a certain temperature and increases to 0.00315 A/m² at a higher temperature, representing an increase of approximately 20%.
4.4.3. Effect of Cover Thickness on the Reinforcement Corrosion Suffered by Damaged Concrete
On the basis of the concrete structure design code and the range of cover thicknesses used in the laboratory, the simulated cover thickness d ranges from 15 to 65 mm. Concrete samples with damage degrees of 0% and 82.5%, corresponding to B0 and B4, respectively, are selected as examples, while all other conditions remain at their baseline parameter values. The effects of different cover thicknesses on the degree of reinforcement corrosion in fatigue-damaged concrete are shown in Figure 26.
The oxygen concentration on the steel bar surface is shown in Figure 26a and 26b. The oxygen concentration still exhibits a concave distribution along the steel bar, reaching its minimum at the interface between the anode and cathode. Owing to insufficient saturation levels, the diffusive oxygen supply cannot compensate for the oxygen consumed by the reactions occurring on the cathode surface; therefore, even with a very thin protective layer, the dissolved oxygen concentration on the cathode surface ultimately fails to reach equilibrium with the external environment. An increase in the thickness of the protective layer results in a longer distance for oxygen to travel to the steel bar surface, thereby reducing the dissolved oxygen concentration on the steel surface. After damage is inflicted, the influence pattern of the thickness of the protective layer on the dissolved oxygen concentration remains consistent, with greater damage leading to higher dissolved oxygen concentrations on the steel surface. This effect is particularly pronounced when the protective layer is thicker. When the thickness of the protective layer is 65 mm, the dissolved oxygen concentration on the steel surface in concrete with 82.5% damage is approximately 20% greater than that in undamaged concrete. The corrosion potentials on the steel surface are shown in Figure 26c to 26d. The corrosion potentials of the anode and cathode along the steel surface toward their interface continuously increase in the positive and negative directions, respectively. As the thickness of the protective layer increases, the cathodic corrosion potential shifts more significantly in the negative direction, whereas the anodic corrosion potential shifts slightly in the positive direction, but the overall change is small. This is mainly due to cathodic concentration polarization, where the cathodic corrosion potential is more strongly affected by the thickness of the protective layer. Similar to the mechanism of saturation effects, the extent to which the cathodic corrosion potential shifts in the negative direction decreases as the damage increases. The corrosion current densities on the steel surface are shown in Figure 26e to 26f. The corrosion current densities of both the anode and the cathode gradually increase along the steel surface toward the interface. Additionally, the corrosion current densities of both the anode and the cathode on the steel surface decrease with increasing protective layer thickness but increase with increasing damage.
The effects of different concrete cover thicknesses d on the average corrosion current density of the reinforced steel in damaged concrete are shown in Figure 27. When the concrete is undamaged, the average anodic corrosion current density of the reinforcing steel decreases as the concrete cover thickness decreases. However, with increasing damage, the average anodic corrosion current density initially increases but then decreases as the cover thickness increases. This is because a thicker cover layer originally reduces the corrosion rate because of reduced oxygen diffusion. However, with increasing damage, the number of internal pores in the concrete increases, leading to more pathways for the migration of reactants and ions, thereby increasing the conductivity of the concrete and initially accelerating the corrosion rate. As the cover thickness continues to increase, this effect gradually diminishes, resulting in an overall trend where the average corrosion current density first increases but then decreases with increasing cover thickness.

4.4.4. Effect of the Anode-to-Cathode Area Ratio on Reinforcement Corrosion in Damaged Concrete
The simulated anode-to-cathode area ratio ranges from 0.1 to 1, where b = 0.1 represents pitting corrosion of the reinforcing steel (e.g., chloride-induced corrosion) and b = 1 represents uniform corrosion (e.g., carbonation-induced corrosion). Concrete samples with damage degrees of 0% and 82.5%, corresponding to B0 and B4, respectively, are selected as examples, while all other conditions are set to their baseline parameter values.
The oxygen concentration on the surface of the reinforcing steel is shown in Figure 28a to 28b. Regardless of whether uniform corrosion or localized pitting is observed, the oxygen concentration on the steel surface still exhibits a concave distribution along the length of the bar, reaching its minimum at the interface between the anode and cathode. As the anode-to-cathode area ratio b decreases, this concave curve gradually shifts downward with the change in the position of the anode–cathode interface. The dissolved oxygen concentration on the anode surface begins to increase, whereas that on the cathode surface decreases. This is because when the total length of the anodic and cathodic regions on the steel surface remains constant, a decrease in the anode-to-cathode area ratio b leads to slower anodic and cathodic reactions, resulting in reduced overall oxygen consumption levels. Since oxygen is primarily consumed at the cathode surface, the oxygen concentration on the anode surface increases, whereas that on the cathode surface decreases. Moreover, the dissolved oxygen concentration on the steel surface increases with the extent of the damage.
The corrosion potentials of the steel surface are shown in Figure 28c to 28d. The corrosion potentials of the anode and cathode along the steel surface increase in the positive and negative directions, respectively, up to the anode–cathode interface. When the cover thickness increases, the corrosion potential on the steel surface shifts overall toward the negative direction as the anode-to-cathode area ratio decreases, which is due to the slowing of the corrosion process caused by the reduction in the anode-to-cathode area ratio. Compared with the anode-to-cathode area ratio, fatigue has a minimal effect on the corrosion potentials.
The corrosion current densities on the steel surface are shown in Figure 28e to 28f. As shown in the figures, as the anode-to-cathode area ratio b increases, the anodic corrosion current density gradually increases, whereas the cathodic corrosion current density gradually decreases, eventually stabilizing at the anode-cathode interface.
The effects of different anode-to-cathode area ratios b on the average corrosion current density of the reinforcing steel in damaged concrete are shown in Figure 29. As shown in the figure, as b increases, the average corrosion current density of the anode gradually decreases. When b is fixed, an increase in damage increases the average corrosion current density of the anode, but its influence is smaller than that of b. When b changes from 0.1 to 1, the average corrosion current density of the anode under a damage level of 82.5% decreases from approximately 0.018 A/m² to approximately 0.003 A/m², representing a reduction of 80%. The results indicate that the average corrosion current density induced under pitting corrosion (such as that caused by chloride-induced corrosion) is 5–6 times greater than that observed under uniform corrosion (such as that caused by carbonation-induced corrosion). Moreover, when the anode-to-cathode area ratio b < 0.5, the effect of b on the corrosion rate becomes particularly significant.


5. Conclusions
This article considers the effect of fatigue damage on oxygen diffusion, establishes an electrochemical corrosion model for reinforced concrete under the coupled action of fatigue damage and carbonation, and analyzes the key factors that influence the reinforcement corrosion behavior observed under the combined effects of fatigue damage and carbonation. The main conclusions are as follows.
(1) The oxygen concentration distribution at any position on the steel reinforcement surface within the concrete increases with increasing damage, whereas the lowest oxygen concentration occurs at the interface between the anode and cathode. The corrosion current density on the steel reinforcement surface reaches its maximum value at the anode–cathode interface, and the average corrosion rate increases with increasing damage. Among these results, the corrosion rate of steel reinforcement in concrete with 82.5% damage is up to 18% higher than that in undamaged concrete.
(2) When the saturation rate s < 0.7, the corrosion of the reinforcing steel in the concrete is mainly controlled by the resistivity, and the corrosion current density increases with increasing saturation; when the saturation rate S > 0.7, the corrosion process is controlled by cathodic oxygen diffusion, and the corrosion current density decreases with increasing saturation.
(3) Because the promoting effects of temperature and fatigue damage on oxygen diffusion are much greater than their effects on oxygen consumption, the dissolved oxygen concentration on the cathode surface decreases with increasing temperature. In comparison with the effect of temperature, the influence of fatigue damage on the corrosion potential is weaker. The average corrosion current density increases with both the temperature and fatigue damage level. For concrete with 82.5% damage, the average corrosion current density is 0.00265 A/m² at a certain temperature and increases to 0.00315 A/m² at a higher temperature , representing an increase of approximately 20%.
(4) When the concrete is undamaged, the average corrosion current density of the reinforcing steel anode continuously decreases as the thickness of the concrete cover increases. However, after the damage level increases, the average corrosion current density of the anode initially increases but then decreases with increasing cover thickness. This is because the increased degree of damage leads to more internal pores in the concrete, resulting in more pathways for the migration of reactants and ions, thereby increasing the electrical conductivity of the concrete and initially accelerating the corrosion rate. As the cover thickness continues to increase, this effect is gradually mitigated.
(5) Macrocracks formed by fatigue loading can increase the uniform corrosion rate of reinforcing steel in concrete by up to 4 to 5 times; moreover, when the anode-to-cathode area ratio b < 0.5 , the effect of b on the corrosion rate is particularly significant. An increase in damage increases the average corrosion current density of the anode, but its influence is smaller than that of b.
Author Contributions
Conceptualization, L.S.; methodology, Z.F.; software, Z.F.; validation, Y.W.; formal analysis, Y.W.; investigation, Z.F.; resources, L.S.; data curation, Y.W.; writing—original draft preparation, Y.W.; writing—review and editing, L.S.; visualization, Y.W.; supervision, L.S.; project administration, Z.F.; funding acquisition, L.S. and Y.W. All the authors have read and agreed to the published version of the manuscript.
Funding
Financial support provided by the National Natural Science Foundation of China (Grant No.51778631, 51378506, and U1934217), the Research Project of the Shanghai Municipal Housing Authority (no.: FG2024-16 and FG2024-17).
Institutional Review Board Statement
Not applicable.
Informed Consent Statement
Not applicable.
Data Availability Statement
Not applicable.
Acknowledgments
China Railway Science and technology research and development plan project are greatly appreciated.
Conflicts of Interest
The authors declare that they have no conflicts of interest.
References
- SHJ, Sun Wei. Research Progress on Reinforcement Corrosion Rate Models in Concrete[J]. Journal of the Chinese Ceramic Society, 2012(04):620-630.
- Isgor O B, Razaqpur A G. Modelling steel corrosion in concrete structures[J]. Materials & Structures, 2006, 39(3): 291-302.
- Bastidas-Arteaga E, Bressolette P, Chateauneuf A, et al. Probabilistic lifetime assessment of RC structures under coupled corrosion–fatigue deterioration processes[J]. Structural Safety, 2009, 31(1): 84-96.
- Zhu Hongbing. Study on Fatigue Testing and Remaining Life Prediction of Reinforced Concrete Simply Supported Girder Bridges [D]. Central South University, 2011.
- Haojun Chen, Yibin Peng, Qisen Zhang. Experimental study on fatigue performance of concrete flexural members with cold-rolled ribbed steel bars. Journal of Southeast University (Natural Science Edition), 2002(05):737-740.
- Zeng Zhibin, Li Zhirong. Study on Fatigue S-N Curves of Reinforcing Steel for Ordinary Concrete Beams[J]. China Civil Engineering Journal, 1999(05):10-14.
- Li Xiufen, Wu Peigang, Zhao Guangyi. Experimental study on flexural fatigue performance of high-strength concrete beams. China Civil Engineering Journal, 1997(05):37-42.
- Millard S G, Law D, Bungey J H, et al. Environmental influences on linear polarisation corrosion rate measurement in reinforced concrete[J]. Ndt & E International, 2001,34(6):409-417.
- Ministry of Construction of the People's Republic of China. Standard for Building Structure Testing Technology [M]. China Architecture & Building Press, 2004.
- Cao Cunan. Principles of Corrosion Electrochemistry (3rd Edition). Corrosion Science and Protection Technology, 2008(3):165.
- Ge J, Isgor O B. Effects of Tafel slope, exchange current density and electrode potential on the corrosion of steel in concrete[J]. Materials & Corrosion, 2015,58(8):573-582.
- Pour-Ghaz M, Isgor O B, Ghods P. The effect of temperature on the corrosion of steel in concrete. Part 1: Simulated polarization resistance tests and model development[J]. Corrosion Science, 2009, 51(2): 415-425.
- Kranc S C, Sagüés A A. Detailed modeling of corrosion macrocells on steel reinforcing in concrete[J]. Corrosion Science, 2001,43(7):1355-1372.
- Hassanein A M, Glass G K, Buenfeld N R. Protection current distribution in reinforced concrete cathodic protection systems[J]. Cement & Concrete Composites, 2002,24(1):159-167.
- Gulikers J, Raupach M. Numerical models for the propagation period of reinforcement corrosion - Comparison of a case study calculated by different researchers[J]. Materials & Corrosion, 2015, 57(8):618-627.
- Kim C Y, Kim J K. Numerical analysis of localized steel corrosion in concrete[J]. Construction and Building Materials, 2008, 22(6): 1129-1136.
- Yu B, Yang L F, Wu M, et al. A practical model for predicting the corrosion rate of steel reinforcement in concrete structures[J]. Construction & Building Materials, 2014, 54(54): 385-401.
- Xu Chen, Yue Zengguo, Jin Weiliang, et al. Study on monitoring the corrosion rate of reinforcing steel in concrete in carbonation environments. Journal of Building Materials, 2012(04):527-532.
- Muehlenkamp E B, Koretsky M D, Westall J C. Effect of Moisture on the Spatial Uniformity of Cathodic Protection of Steel in Reinforced Concrete[J]. Corrosion: Journal of Science and Engineering, 2005, 61(6): 519-533.
- Xiao Congzhen. Study on the Mechanism of Reinforcement Corrosion in Concrete and Numerical Simulation Methods [D]. Tsinghua University, 1995.
- Papadakis, V. Physical and Chemical Characteristics Affecting the Durability of Concrete[J]. ACI Materials Journal, 1991.
Figure 1.
Reinforcement and loading diagram of the test beam.
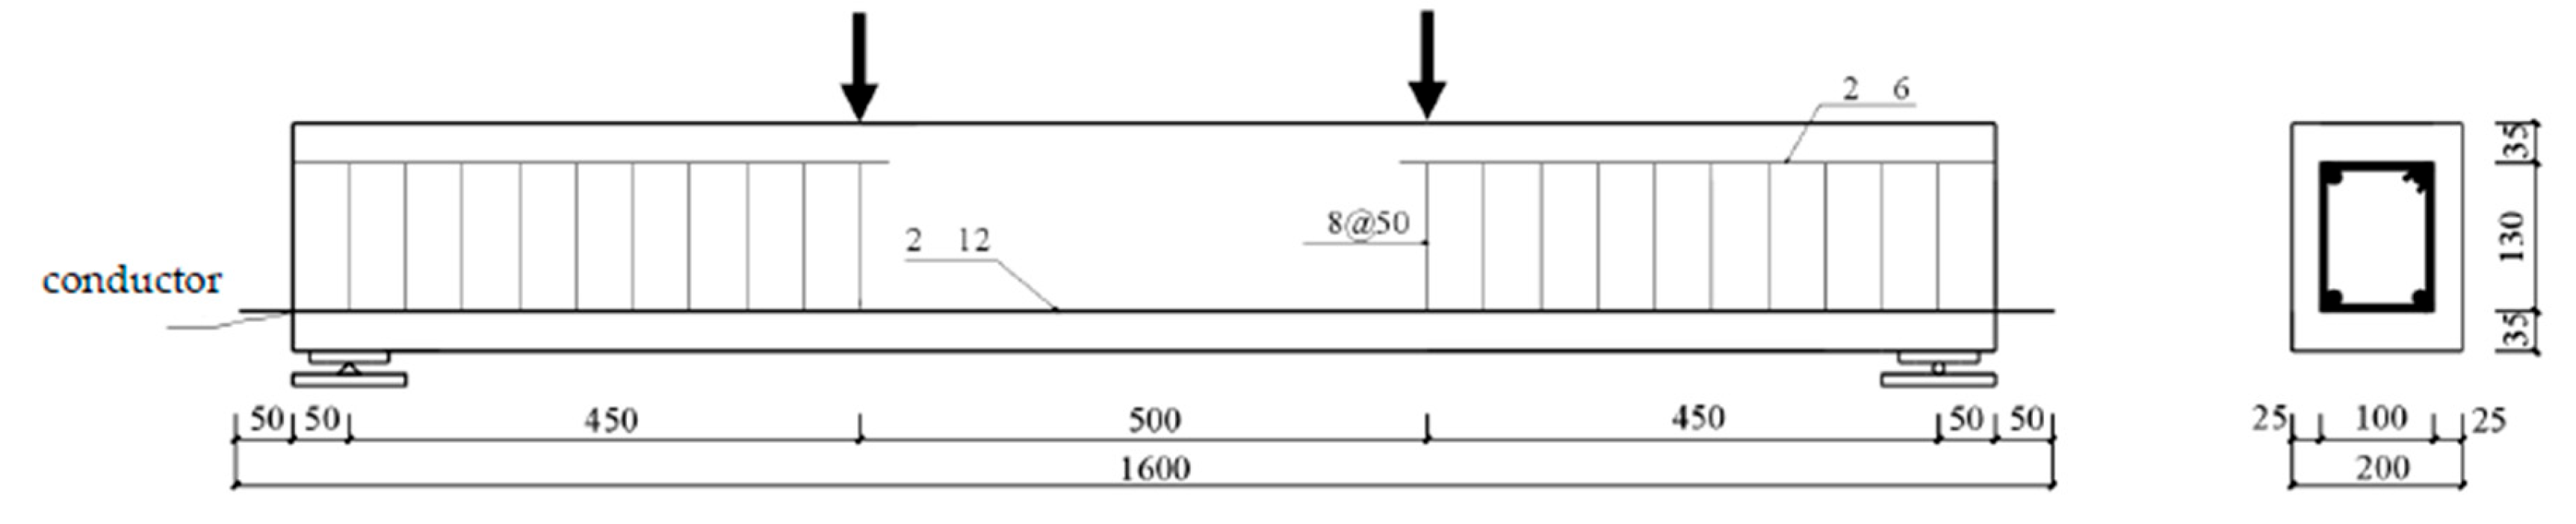
Figure 2.
Schematic of the holding device.
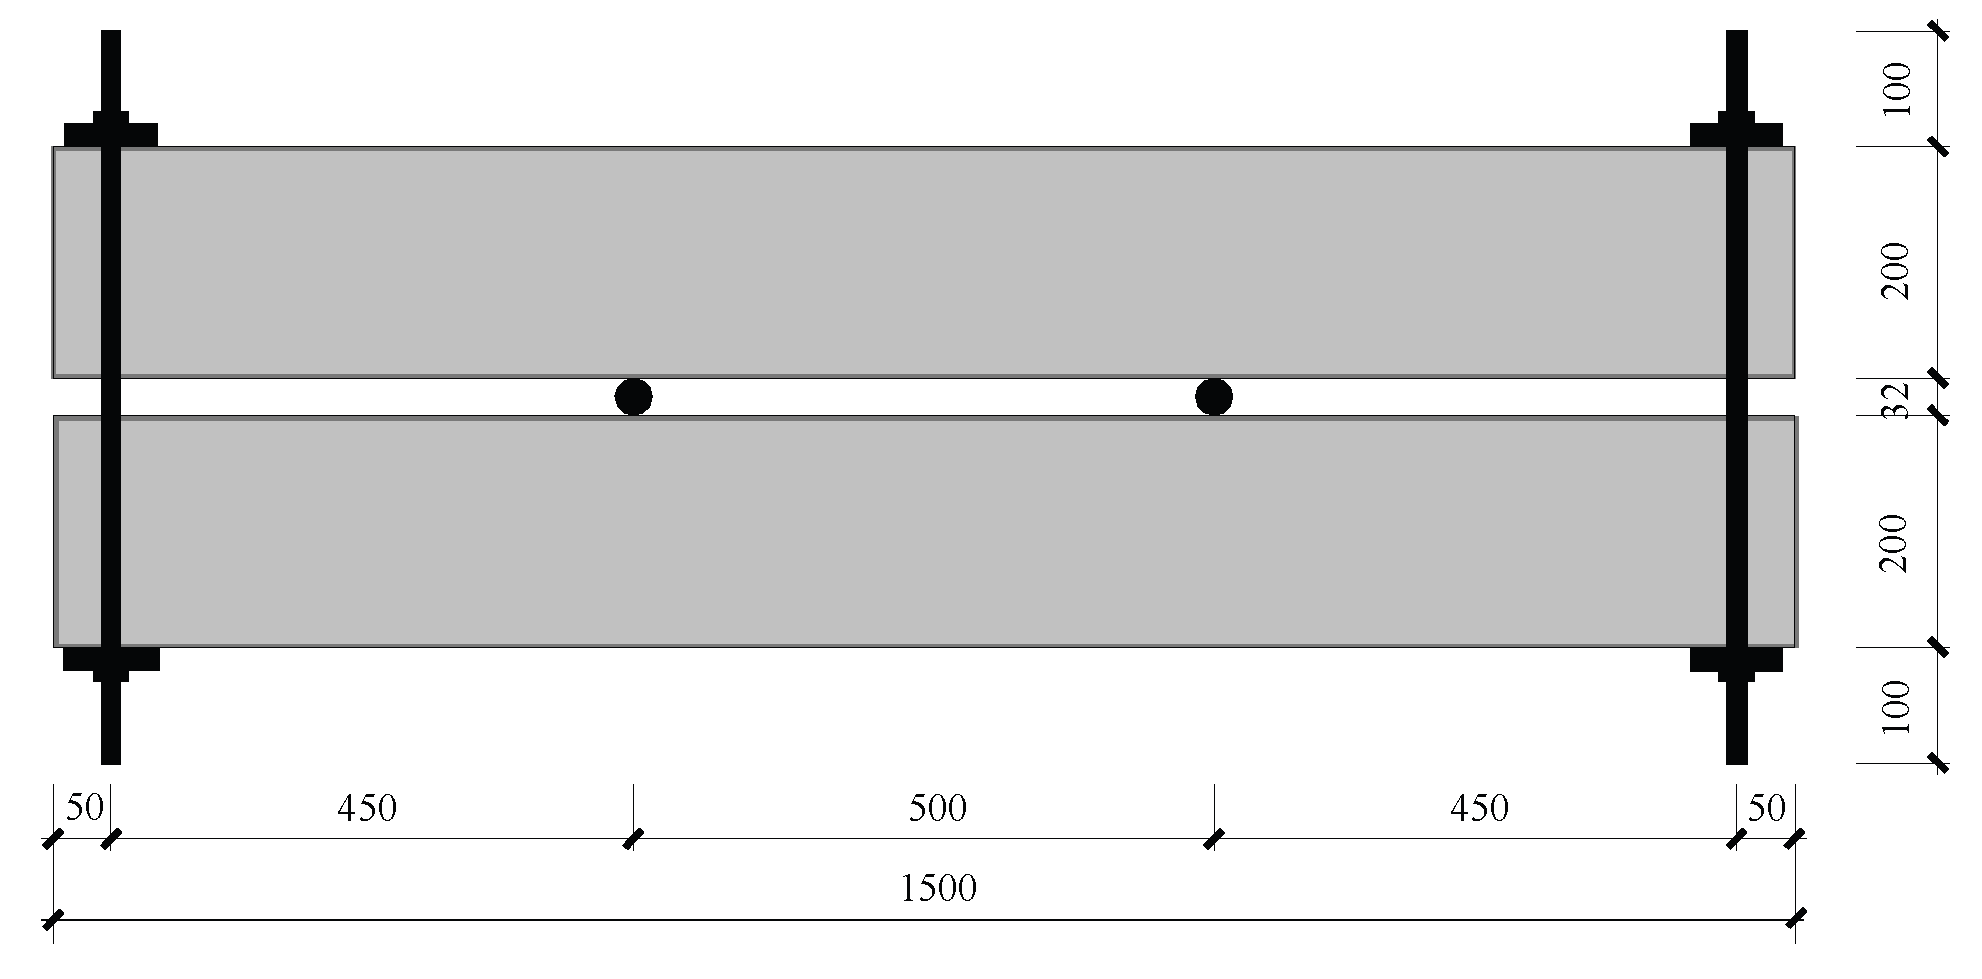
Figure 3.
Environmental simulation chamber.
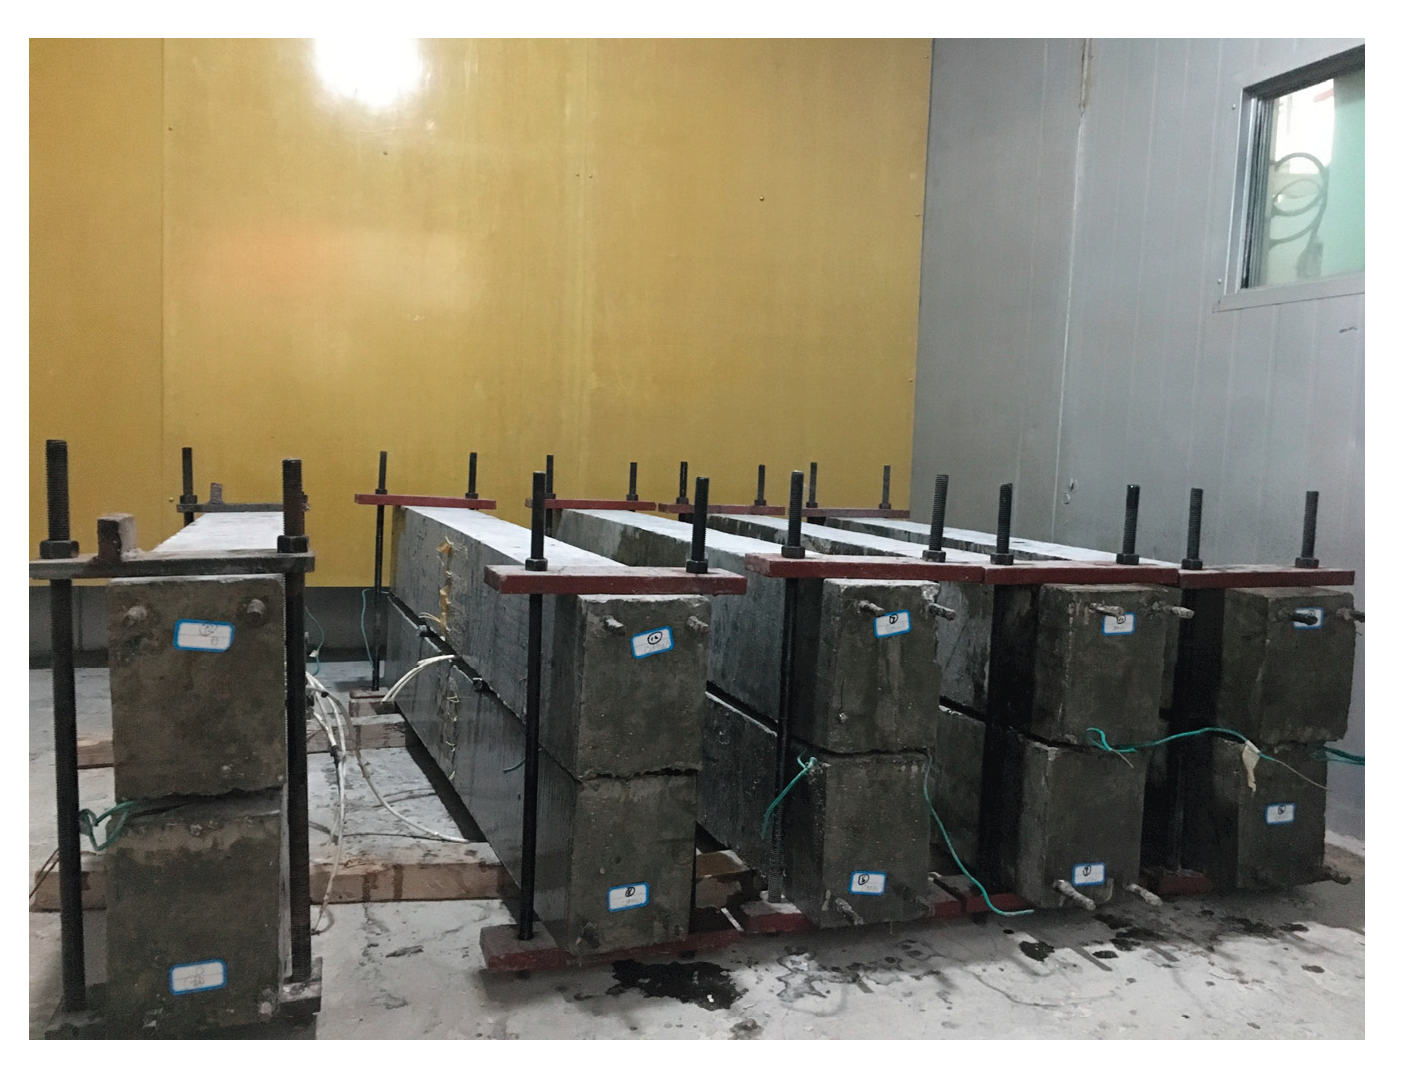
Figure 4.
Schematic diagram of the rebar corrosion measurement process.
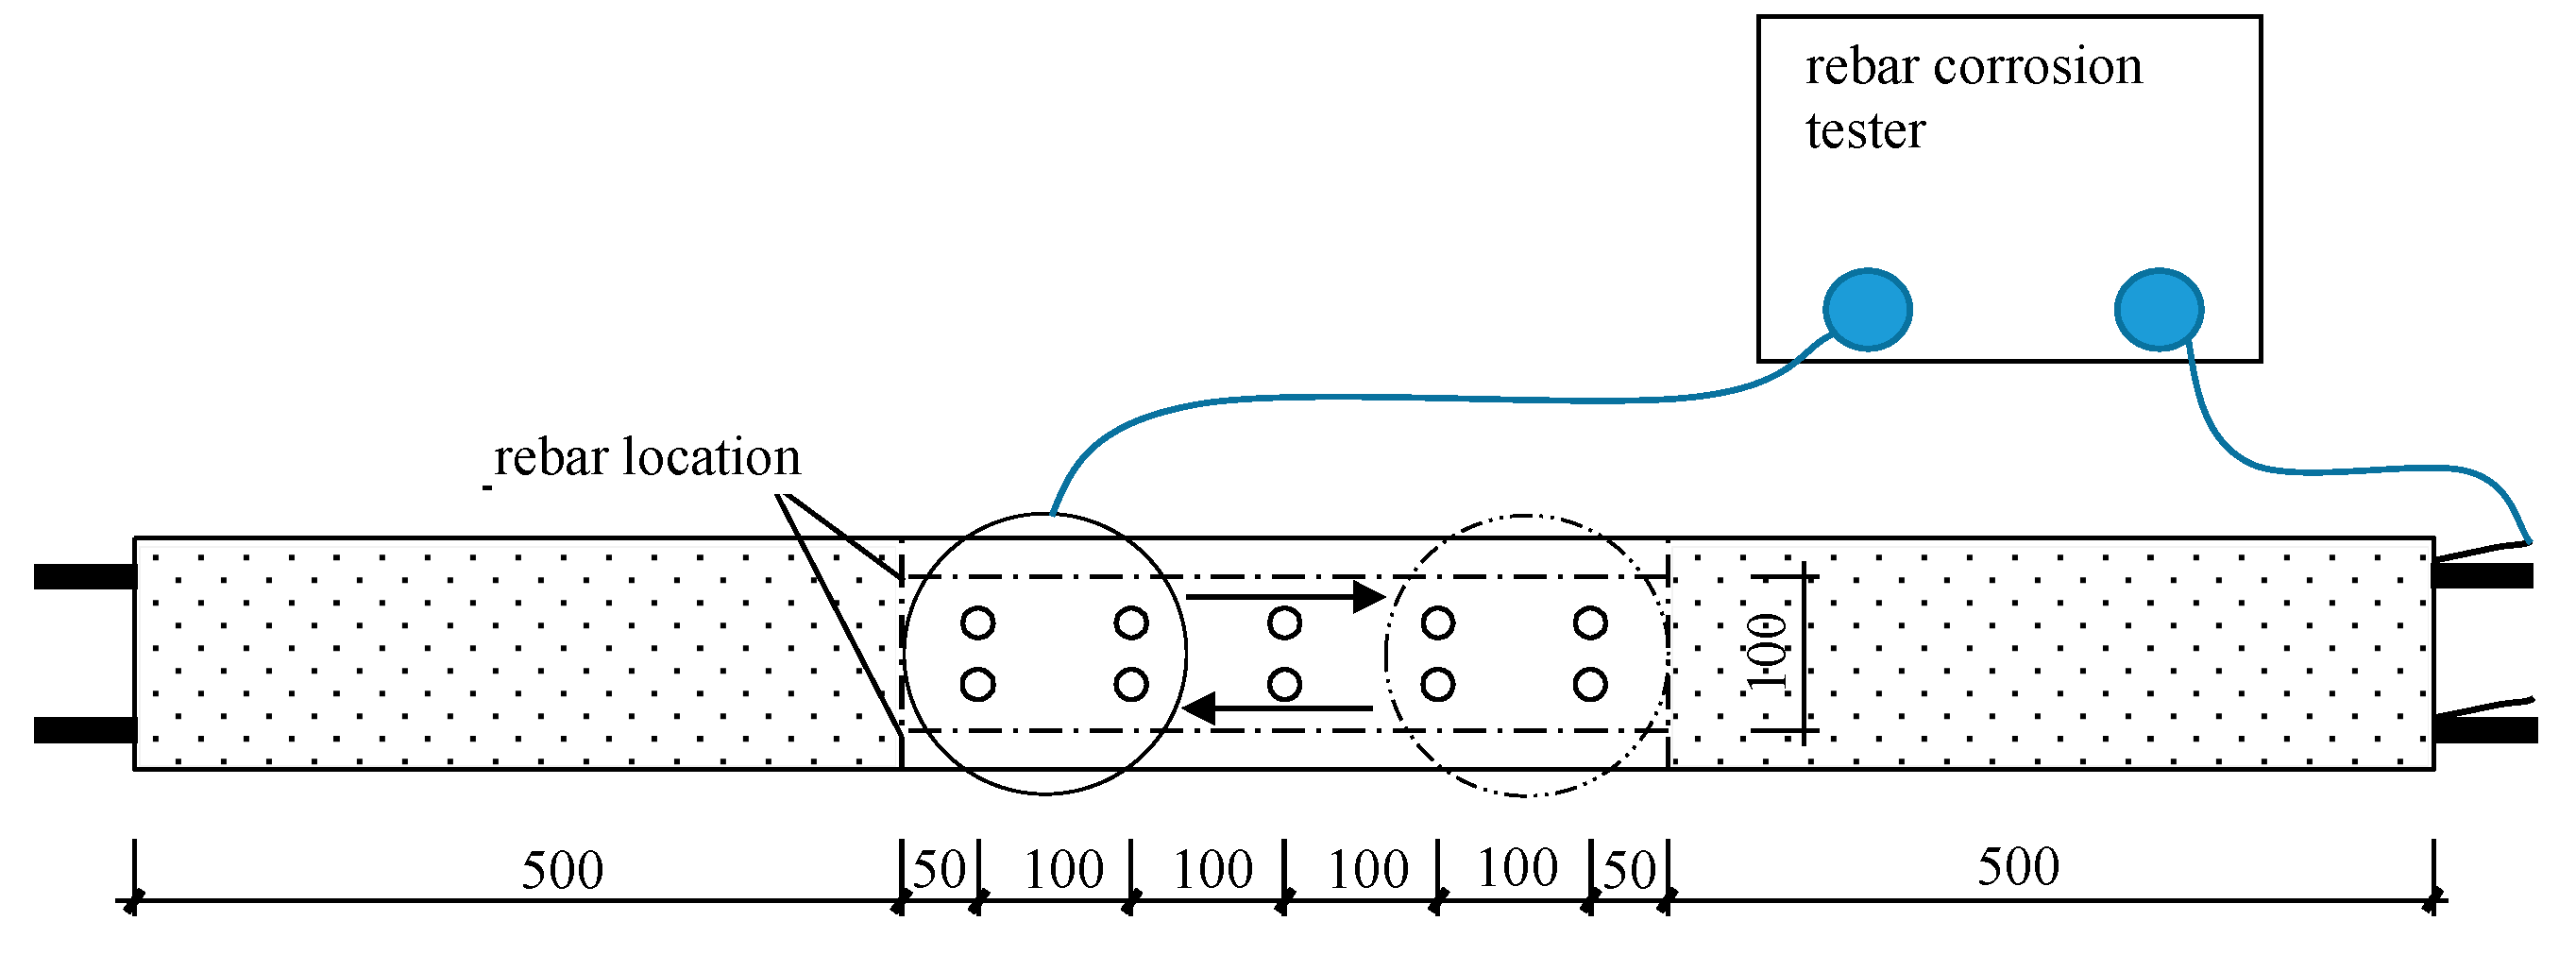
Figure 5.
Photo of the corrosion measurement system for the steel bars.
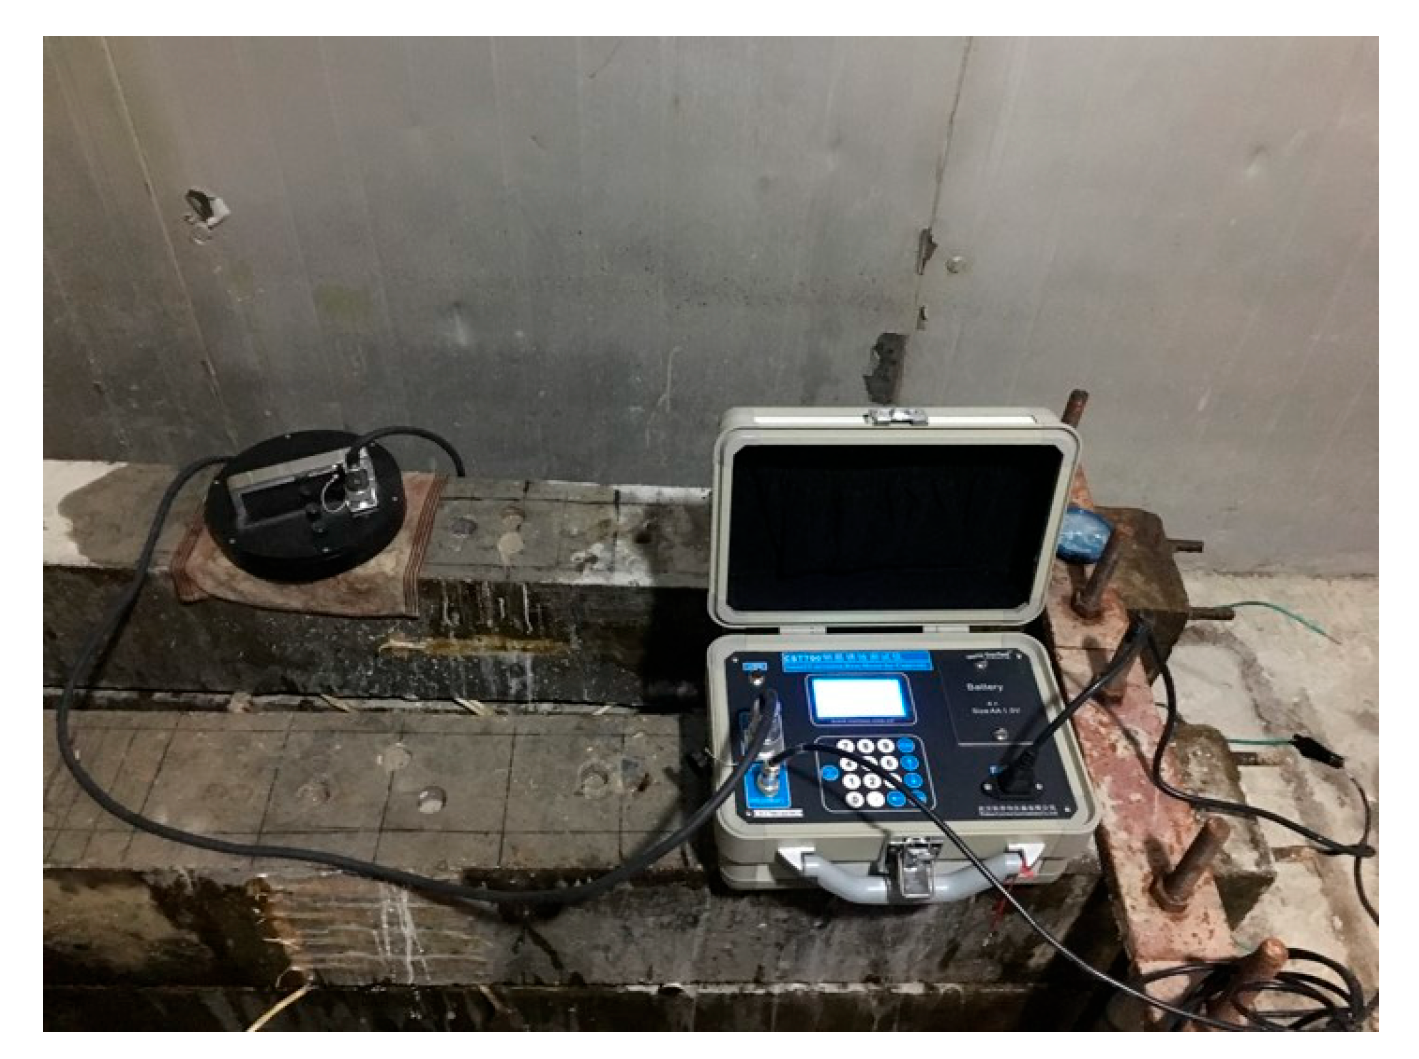
Figure 6.
Curves of the maximum crack width versus the fatigue life ratio .
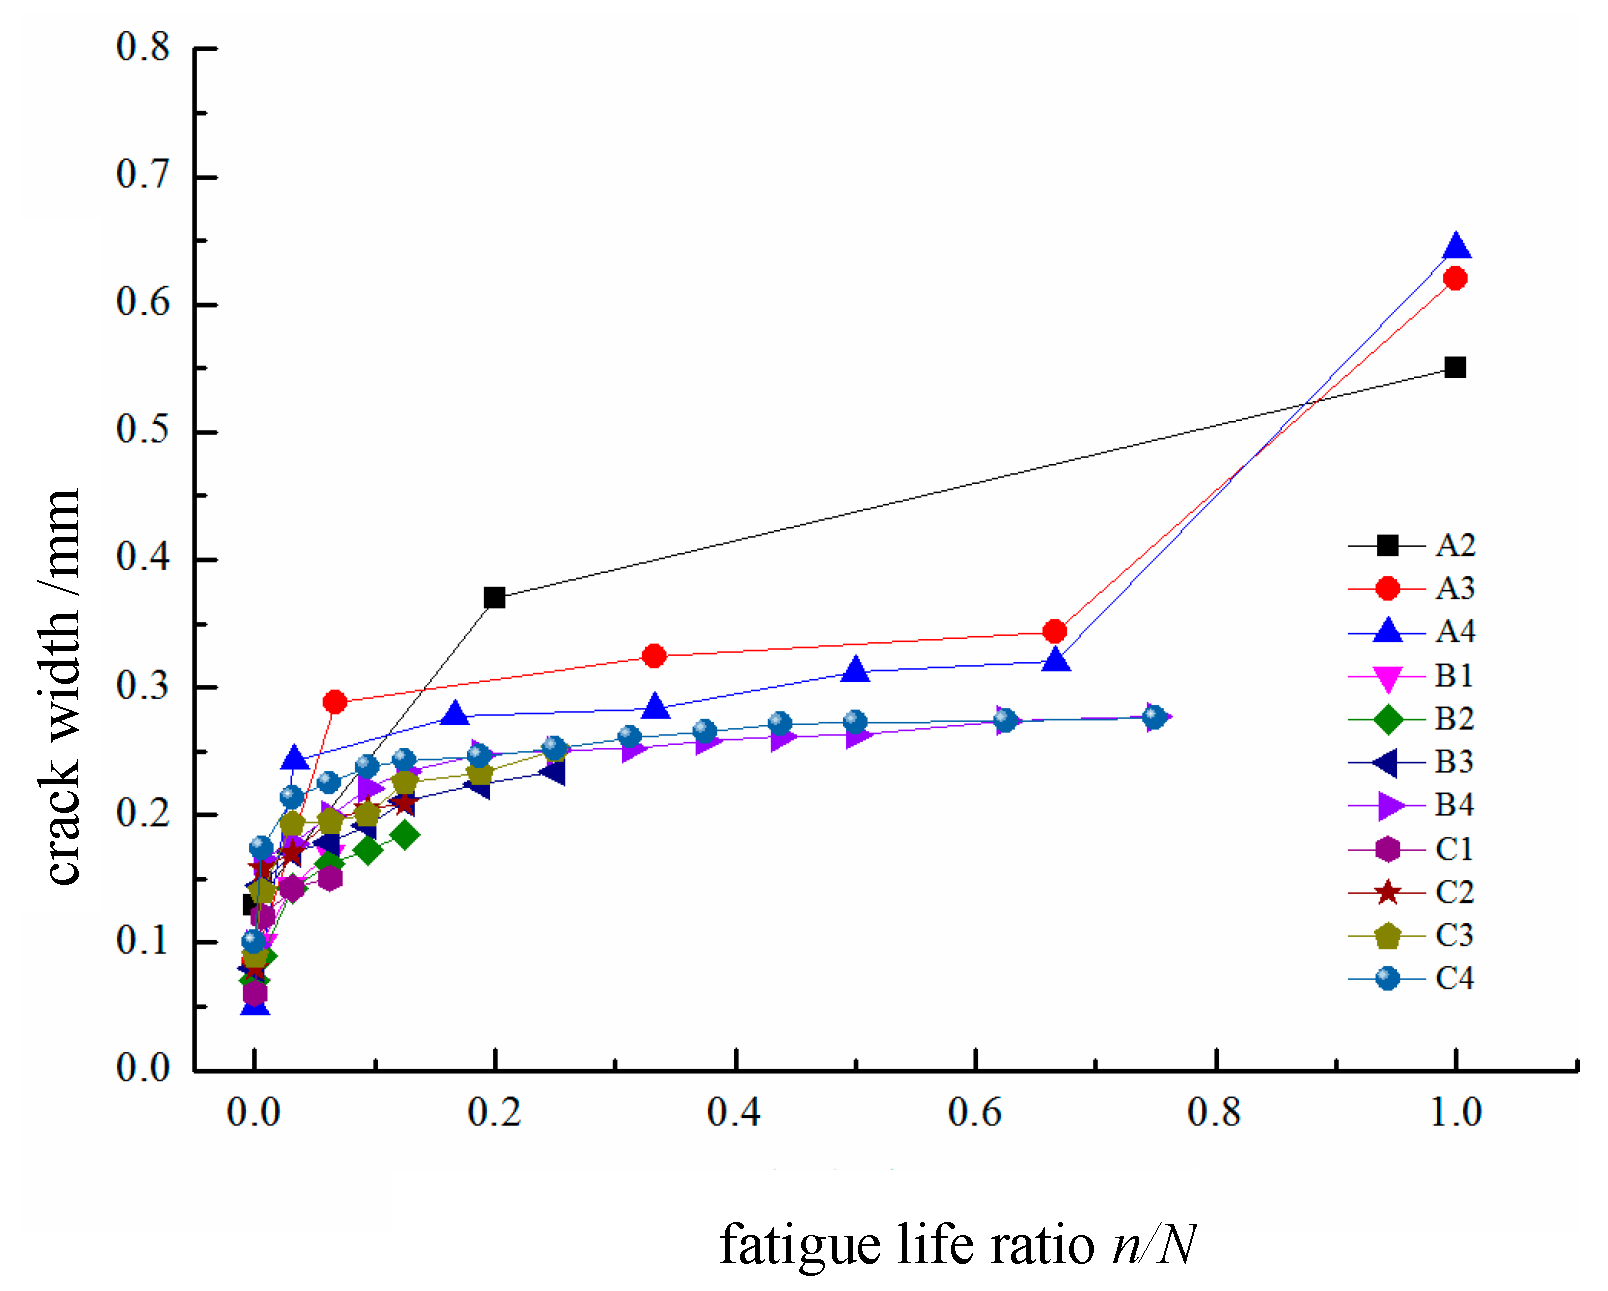
Figure 7.
Curves of the flexural stiffness of the beam versus the fatigue life ratio.
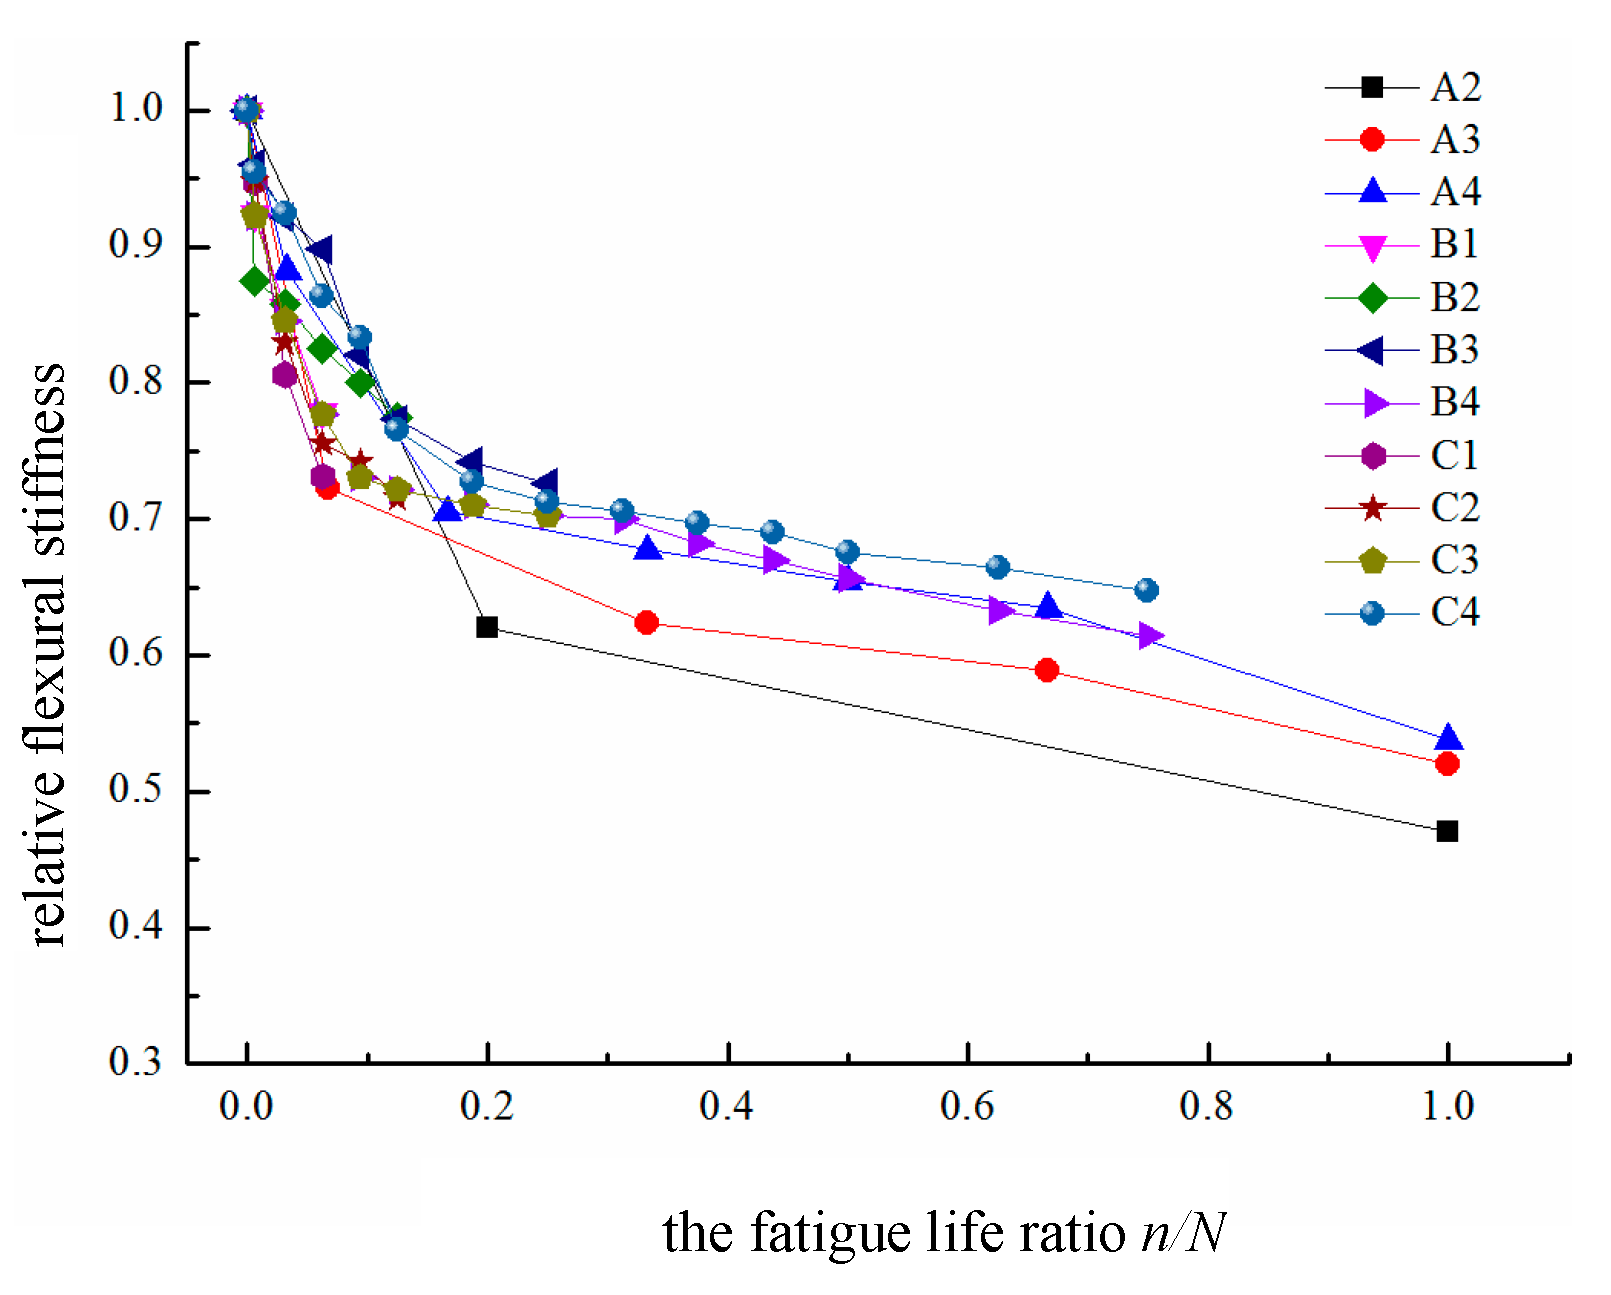
Figure 8.
Curve of the residual strain vs. the fatigue life ratio for concrete.
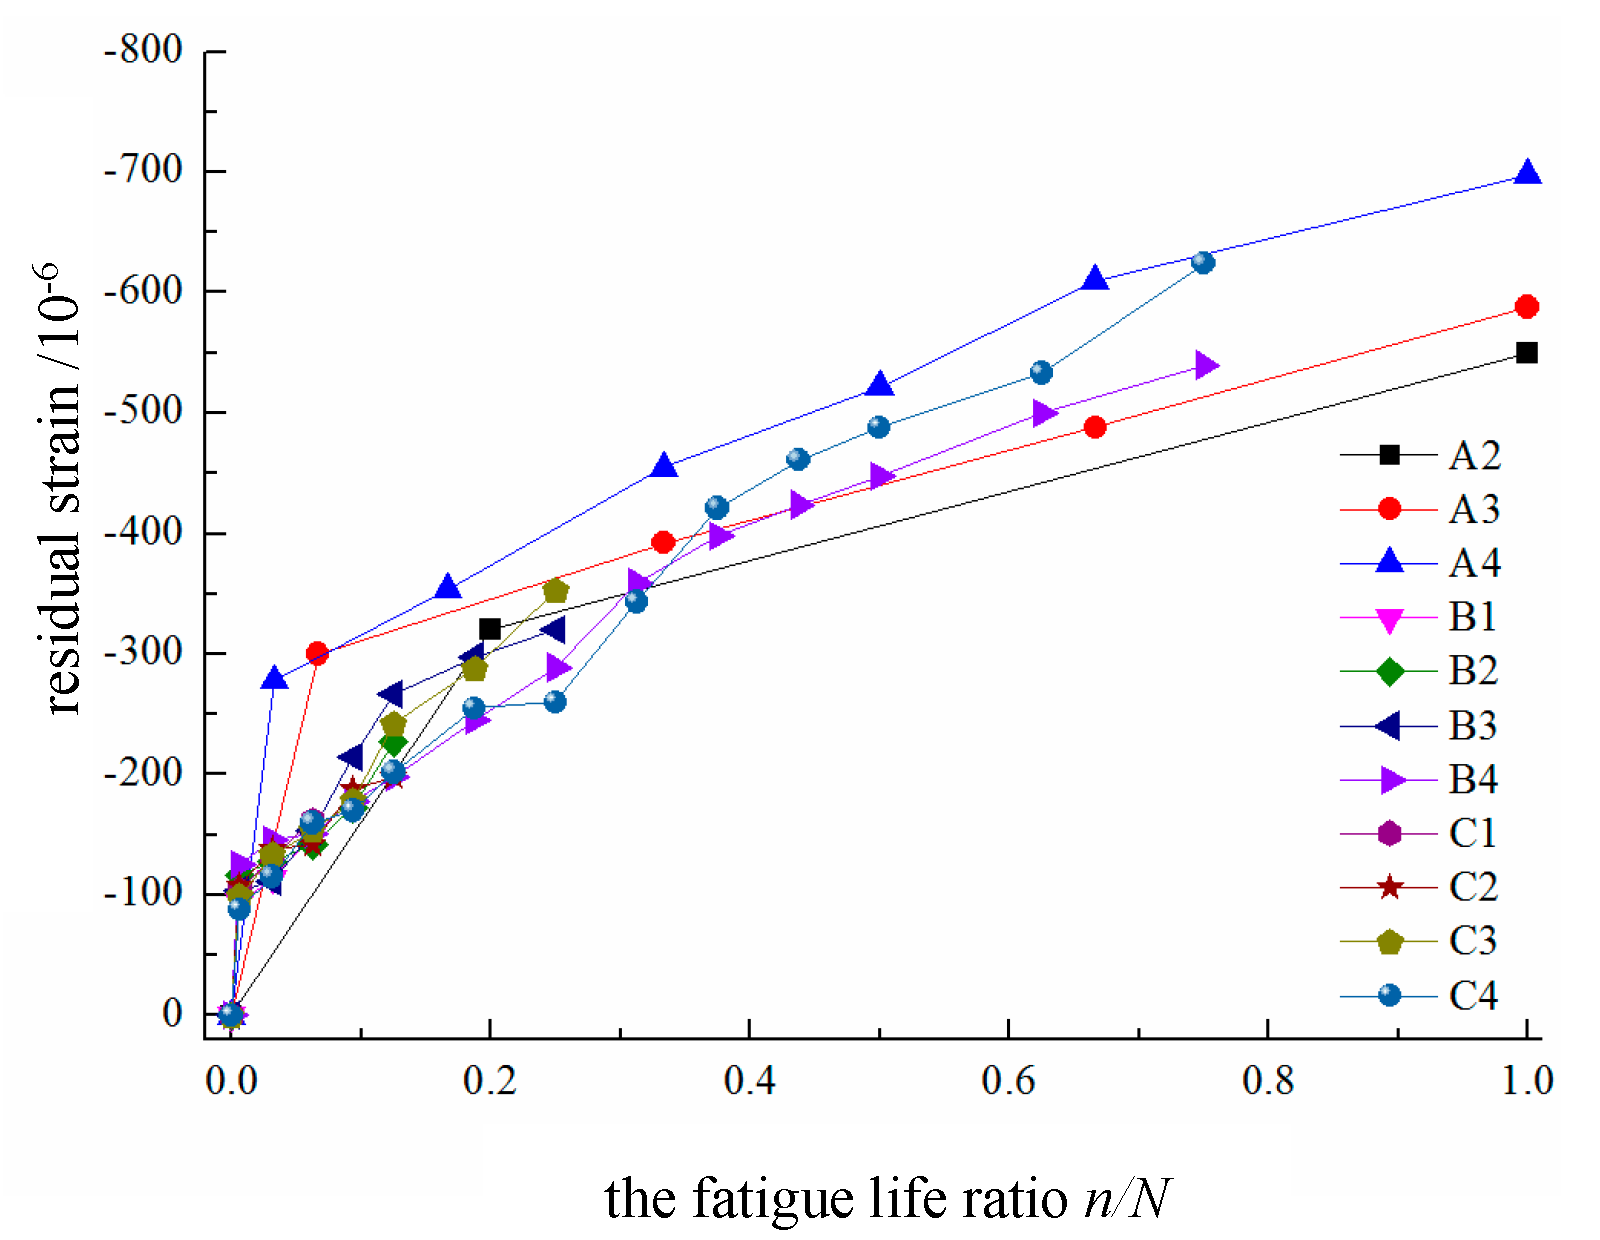
Figure 9.
Curve of the residual strain vs. the fatigue life ratio
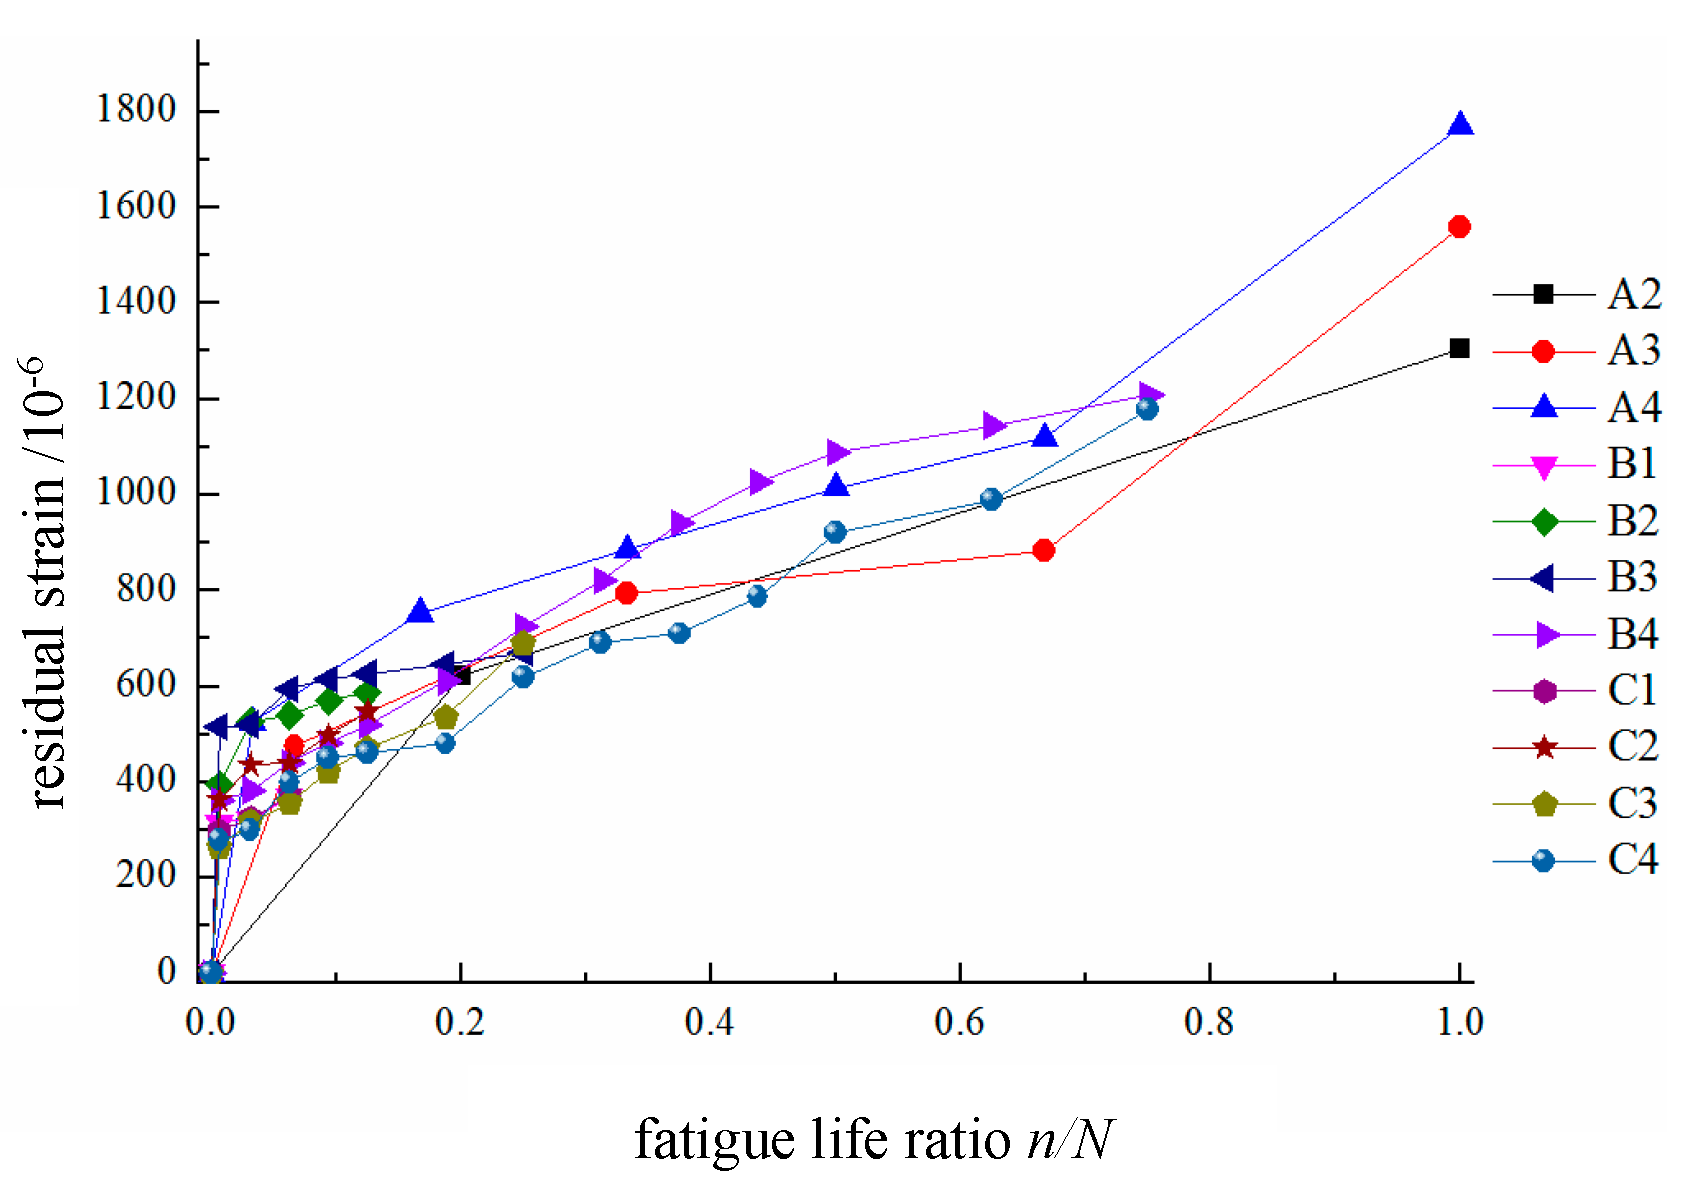
Figure 10.
Cumulative pore volume curves for damaged concrete.
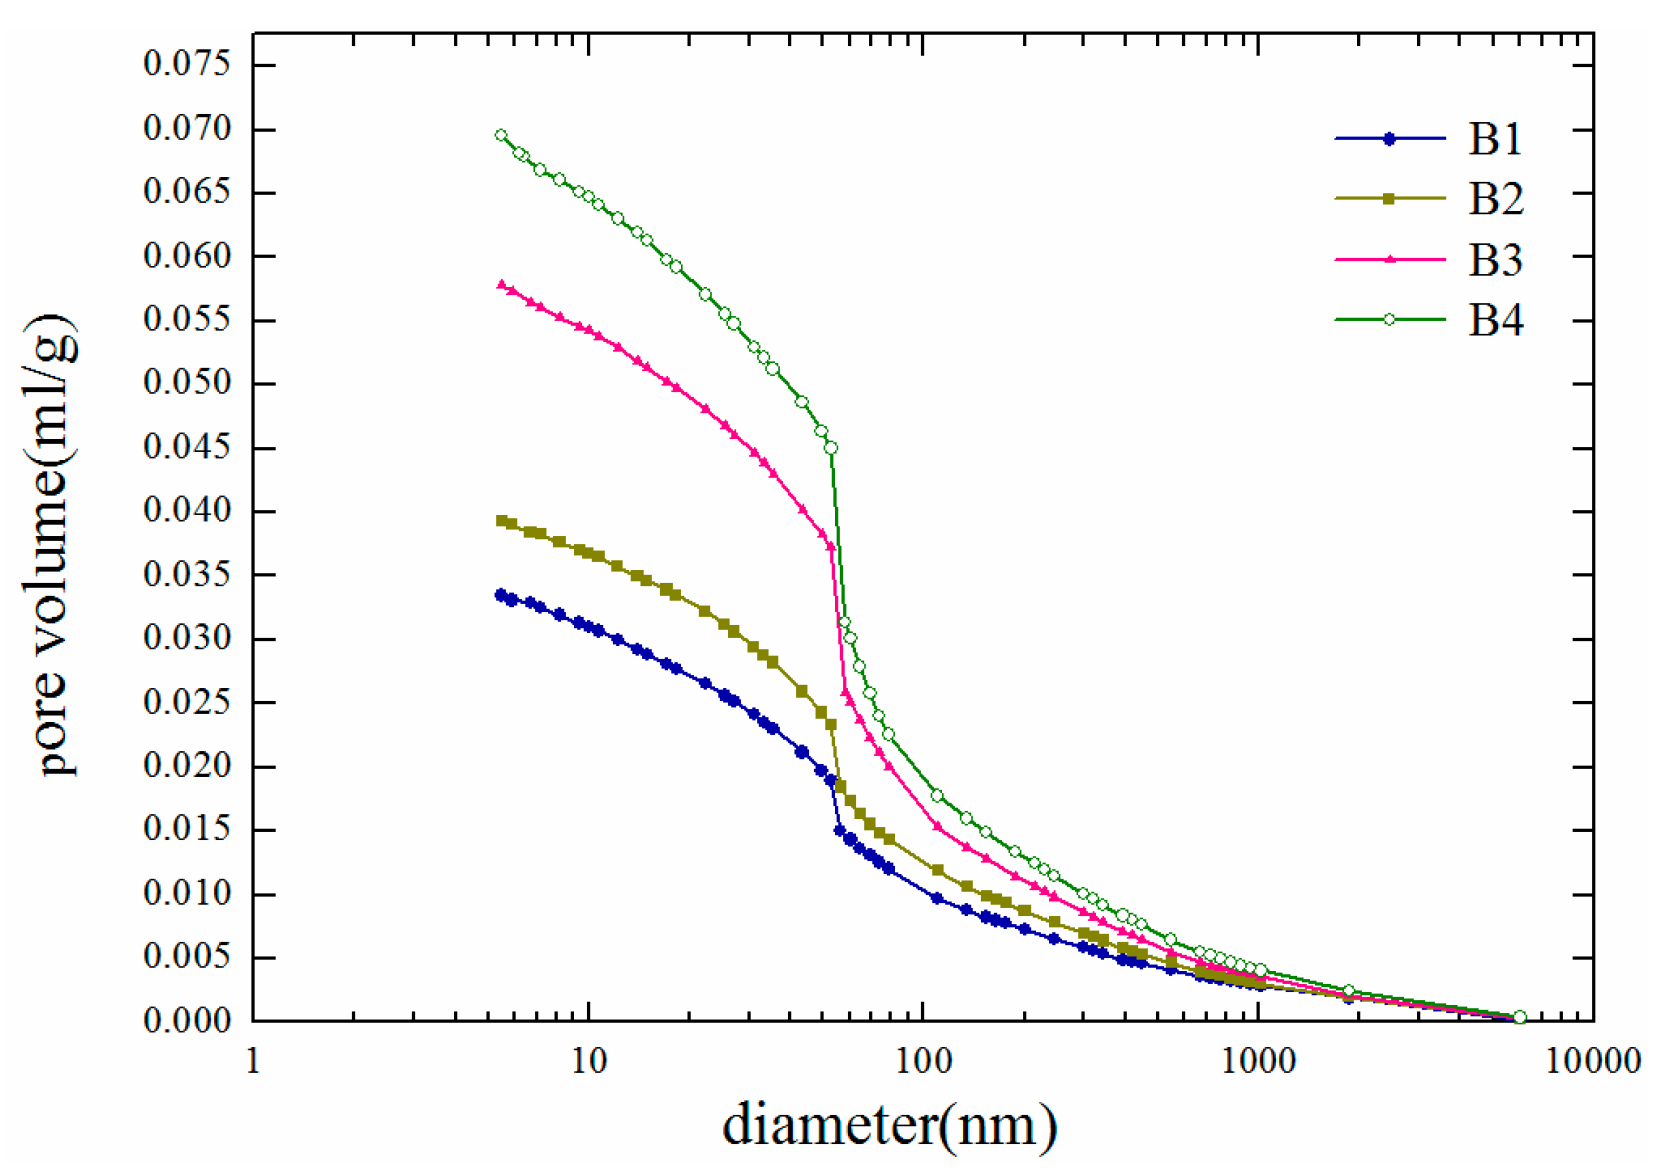
Figure 11.
Pore size distribution curve of damaged concrete.
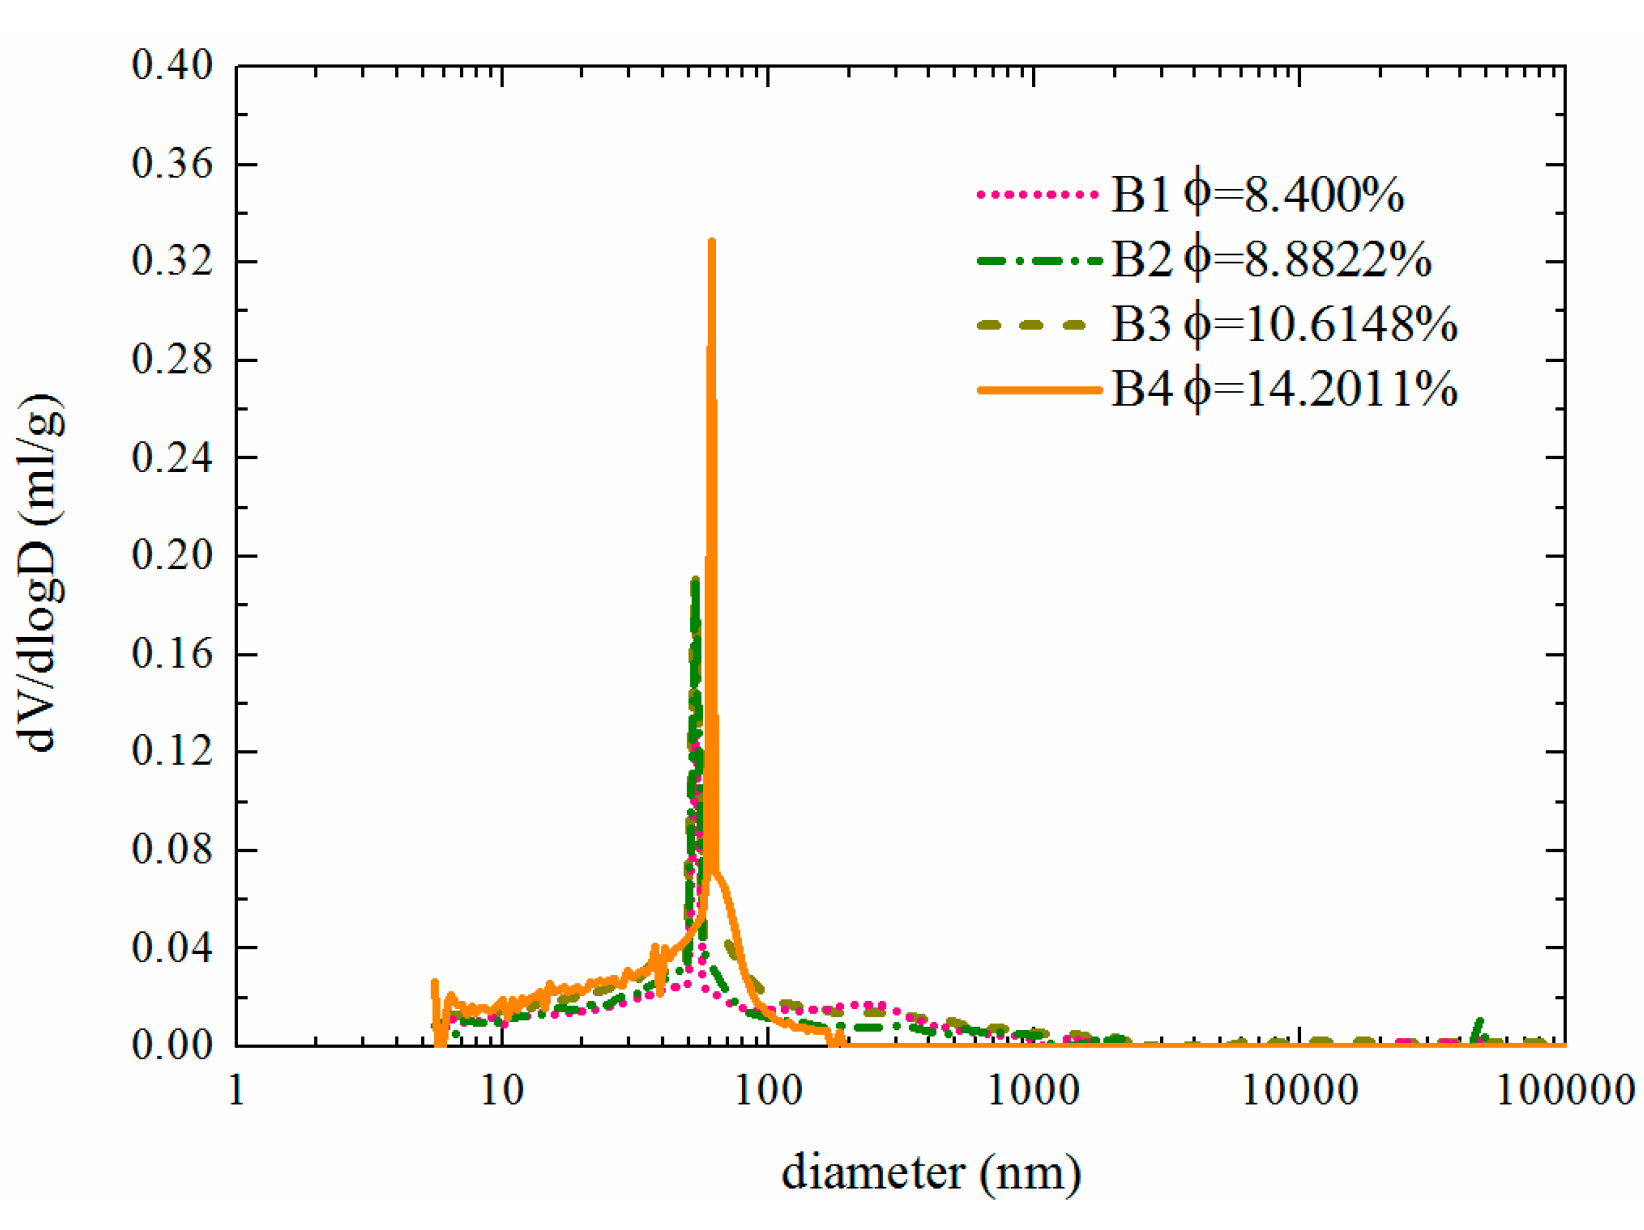
Figure 12.
Experimental results concerning the concrete corrosion current density: (a) group B; (b) group C.
Figure 12.
Experimental results concerning the concrete corrosion current density: (a) group B; (b) group C.
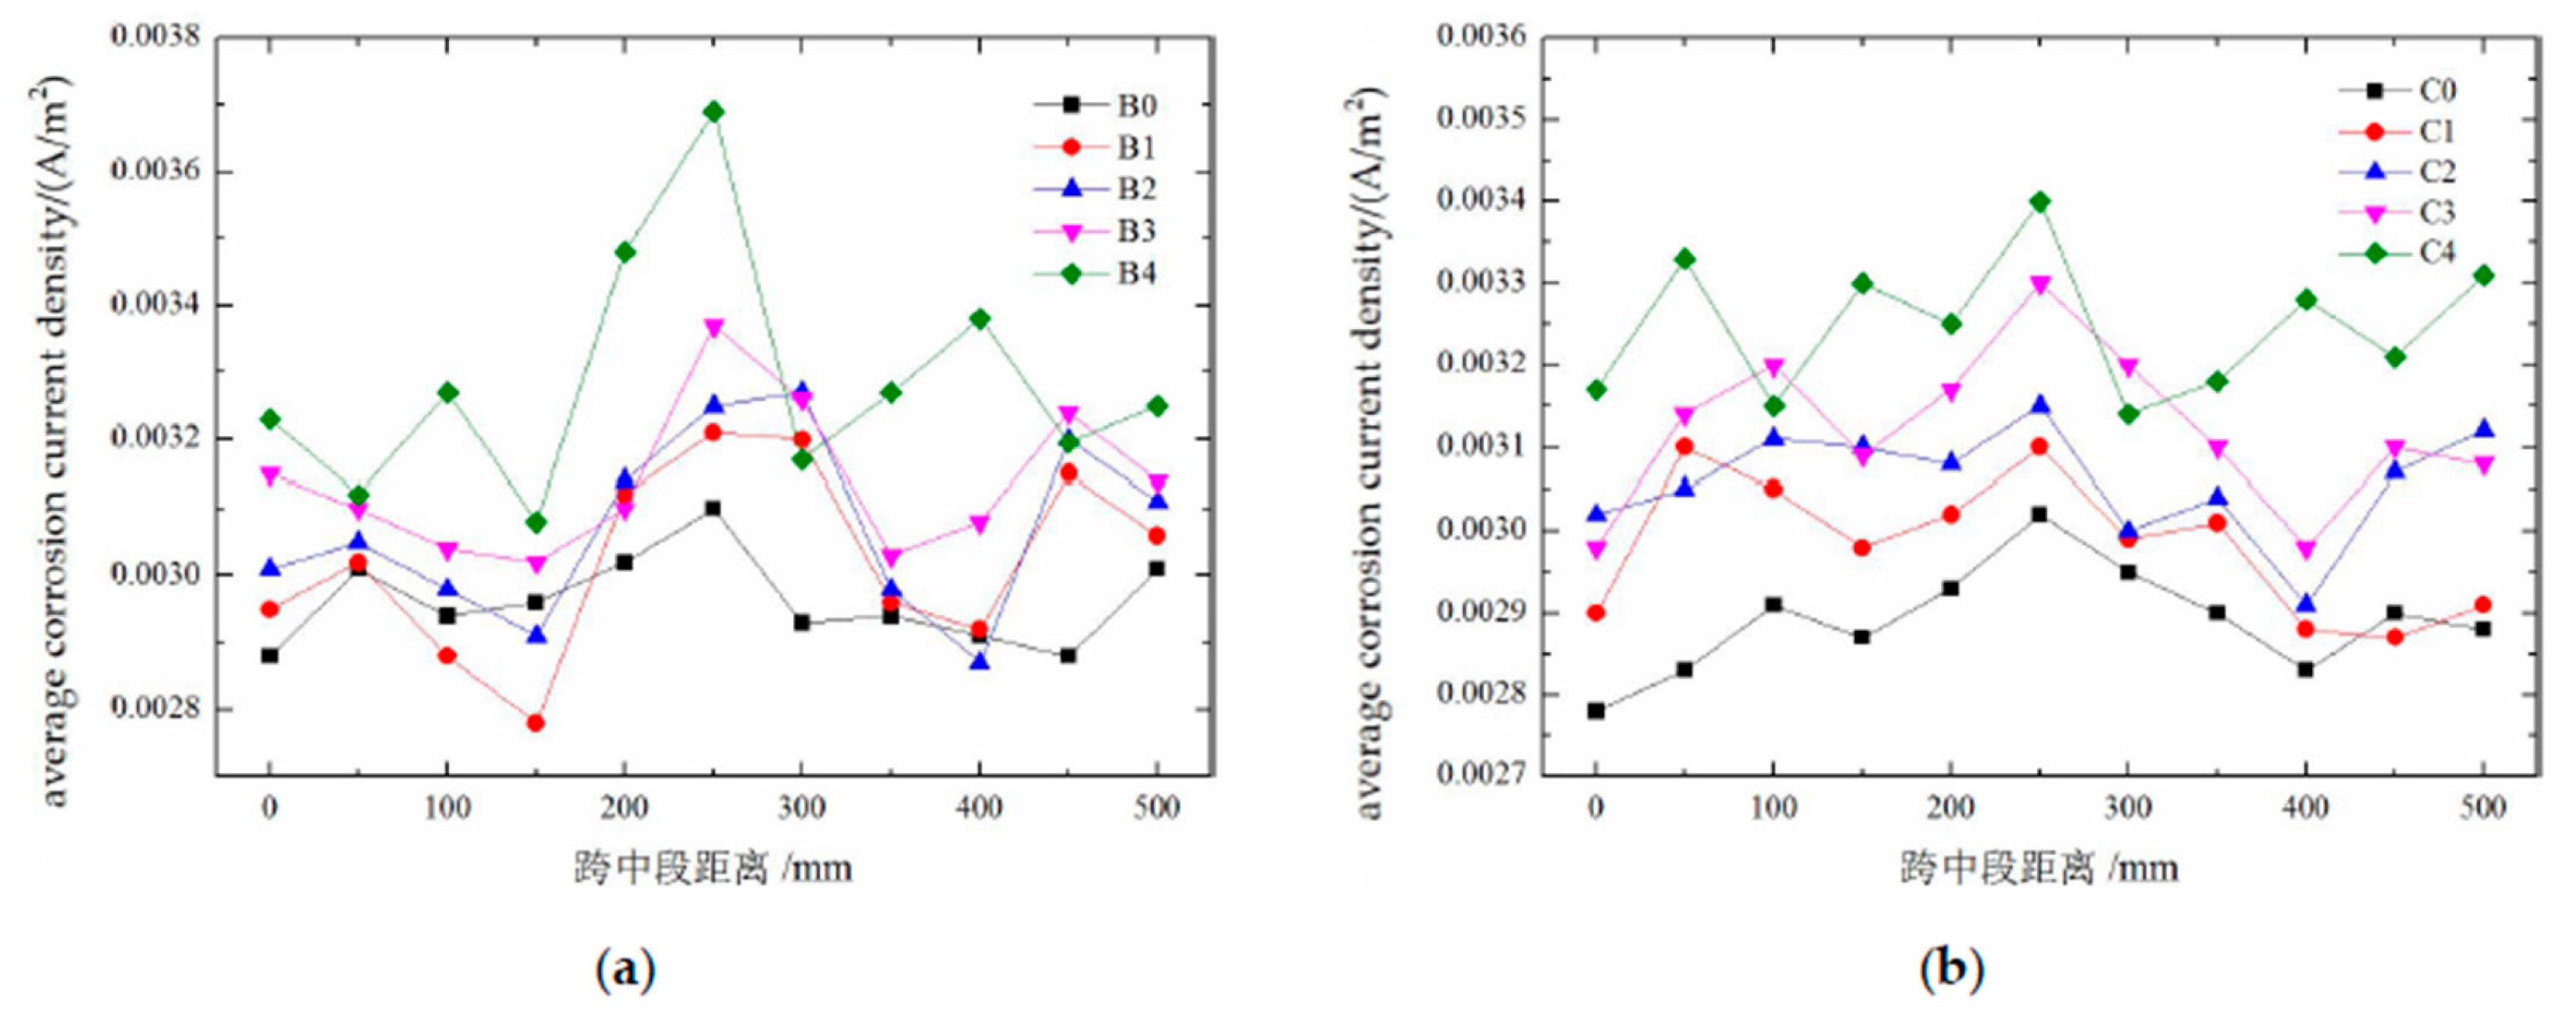
Figure 13.
Results of the concrete corrosion potential test: (a) group B; (b) group C.
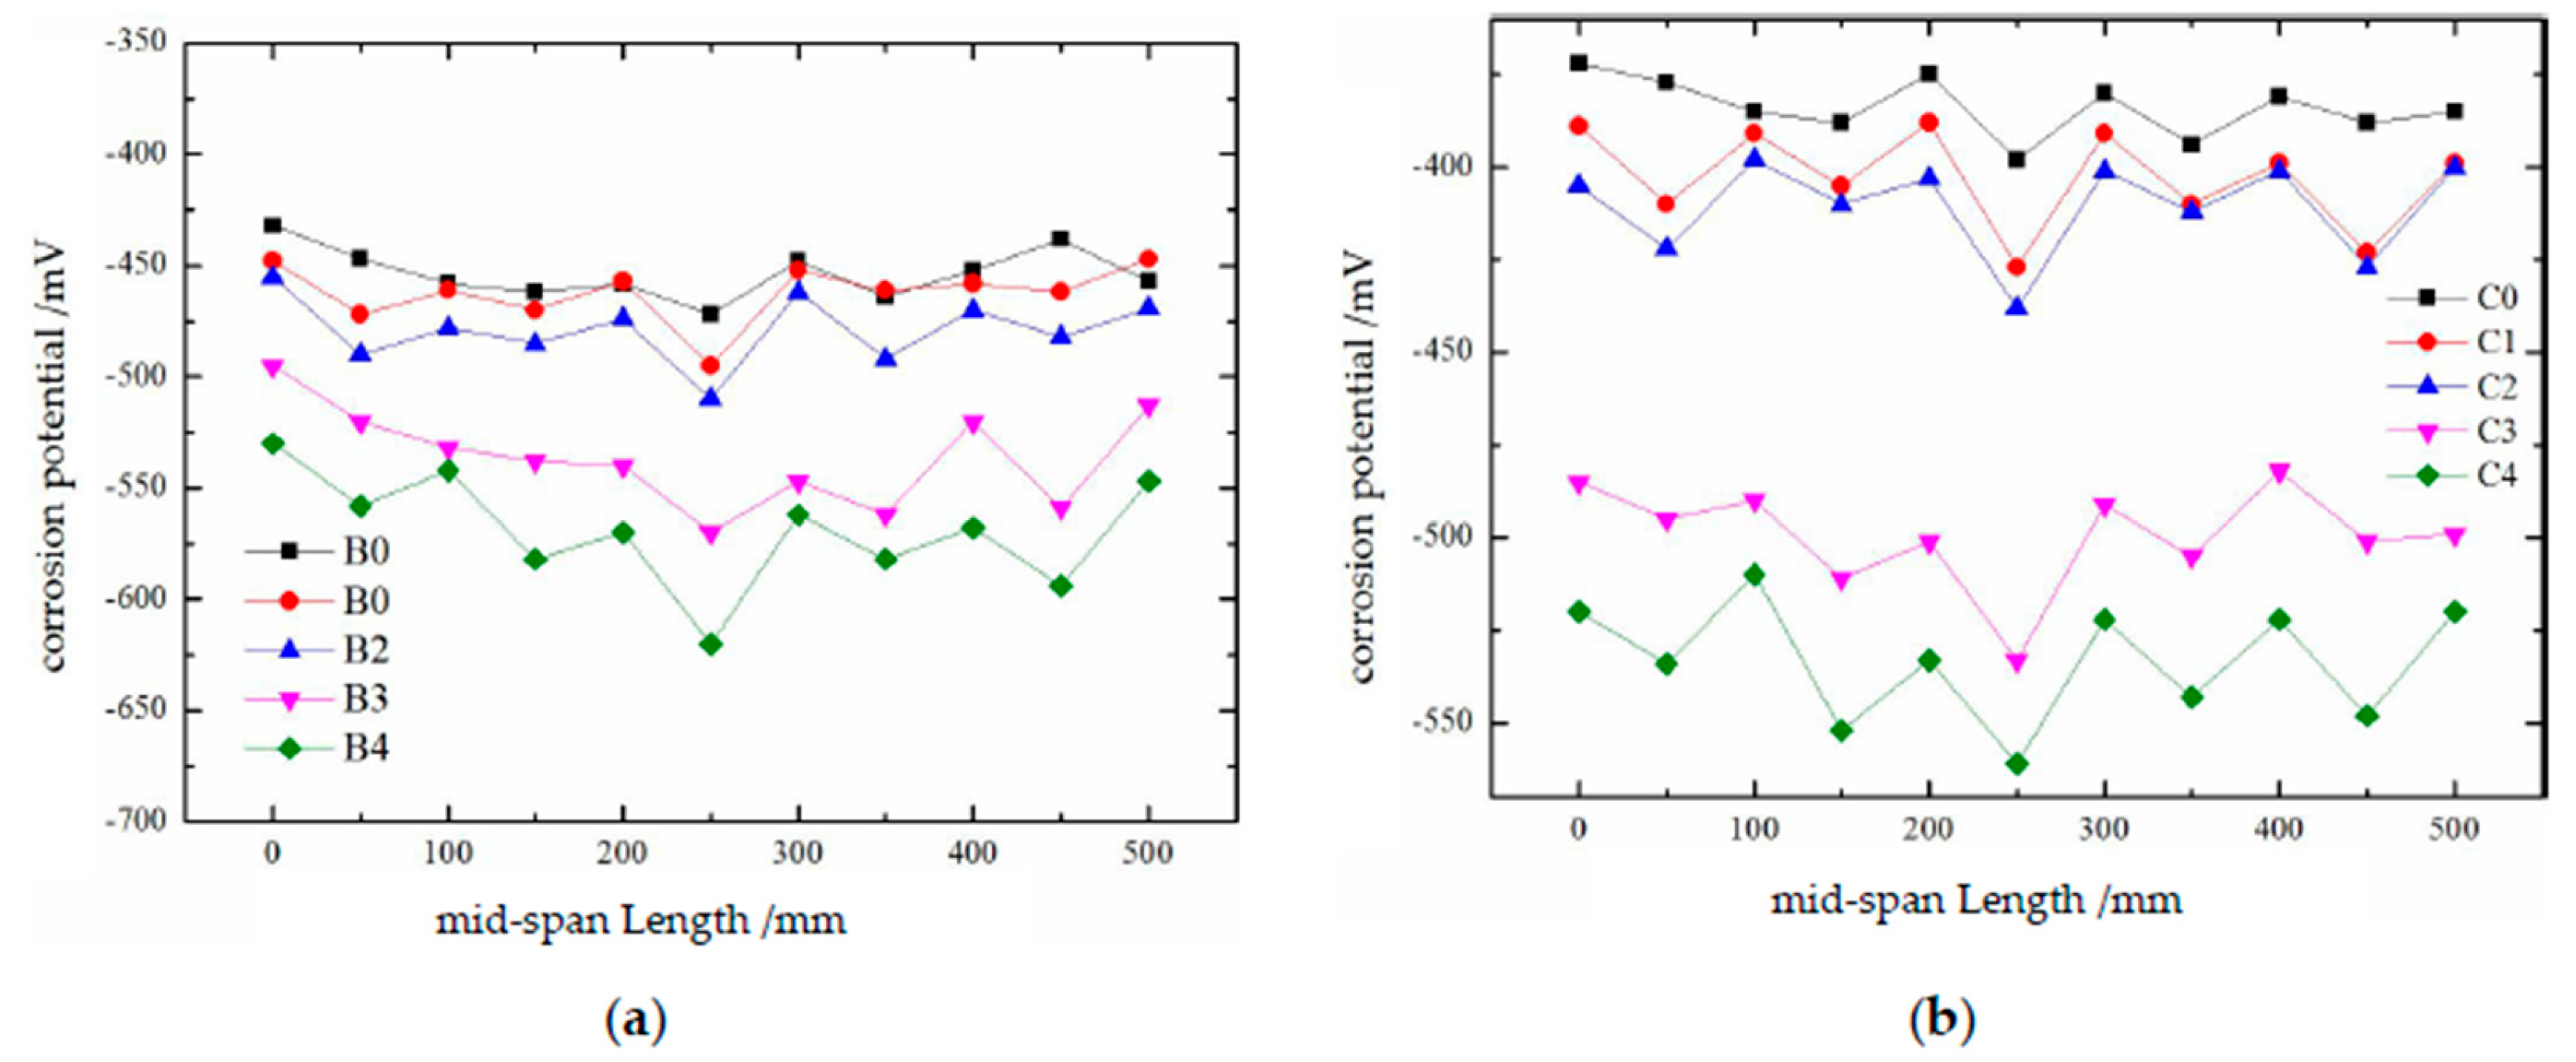
Figure 14.
Average corrosion current density of the reinforcement in different damaged concrete groups.
Figure 14.
Average corrosion current density of the reinforcement in different damaged concrete groups.
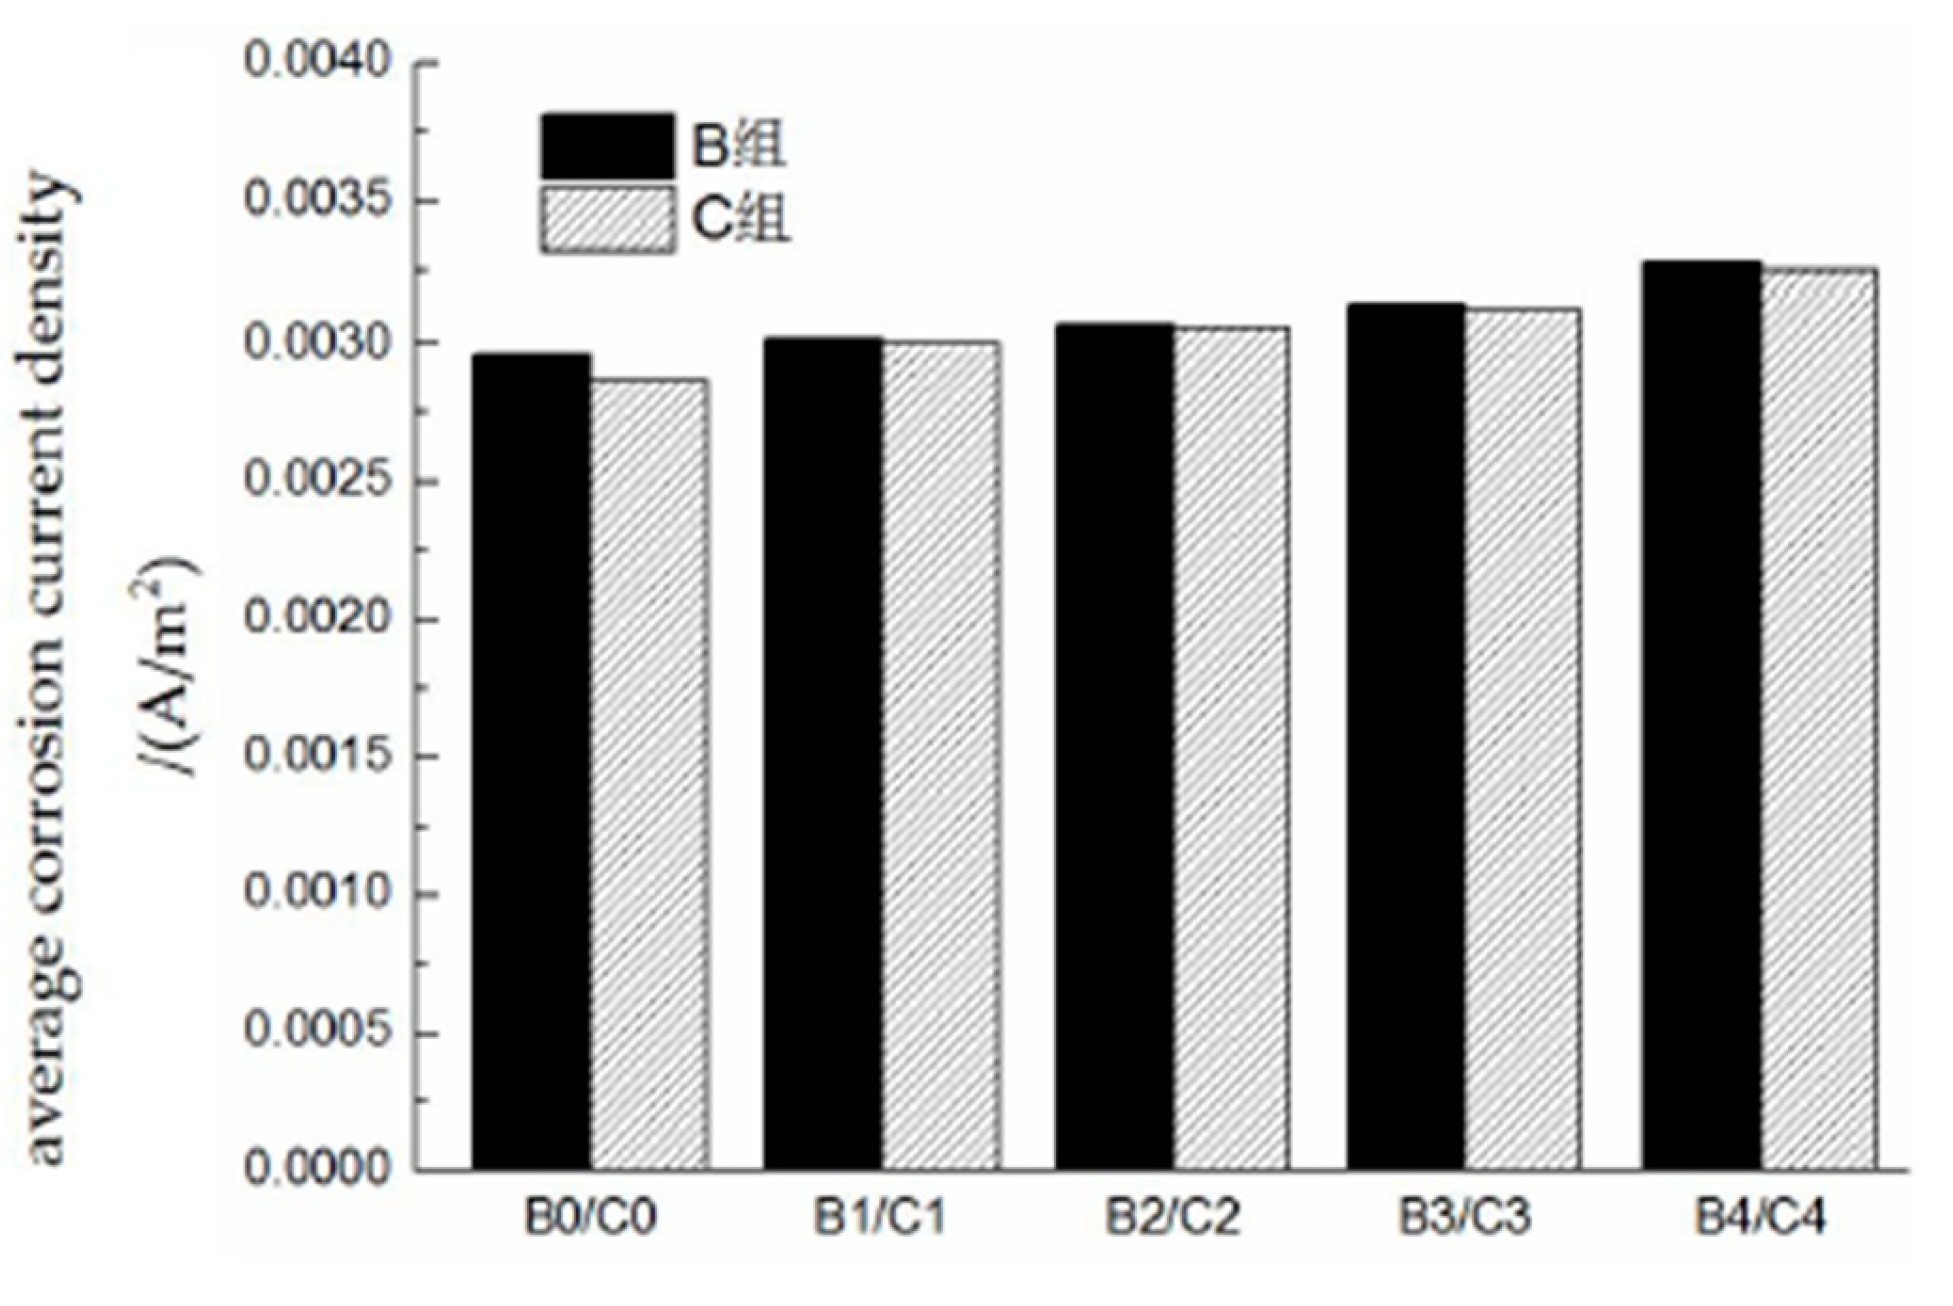
Figure 15.
Relationship between the concrete saturation level and electrical conductivity.
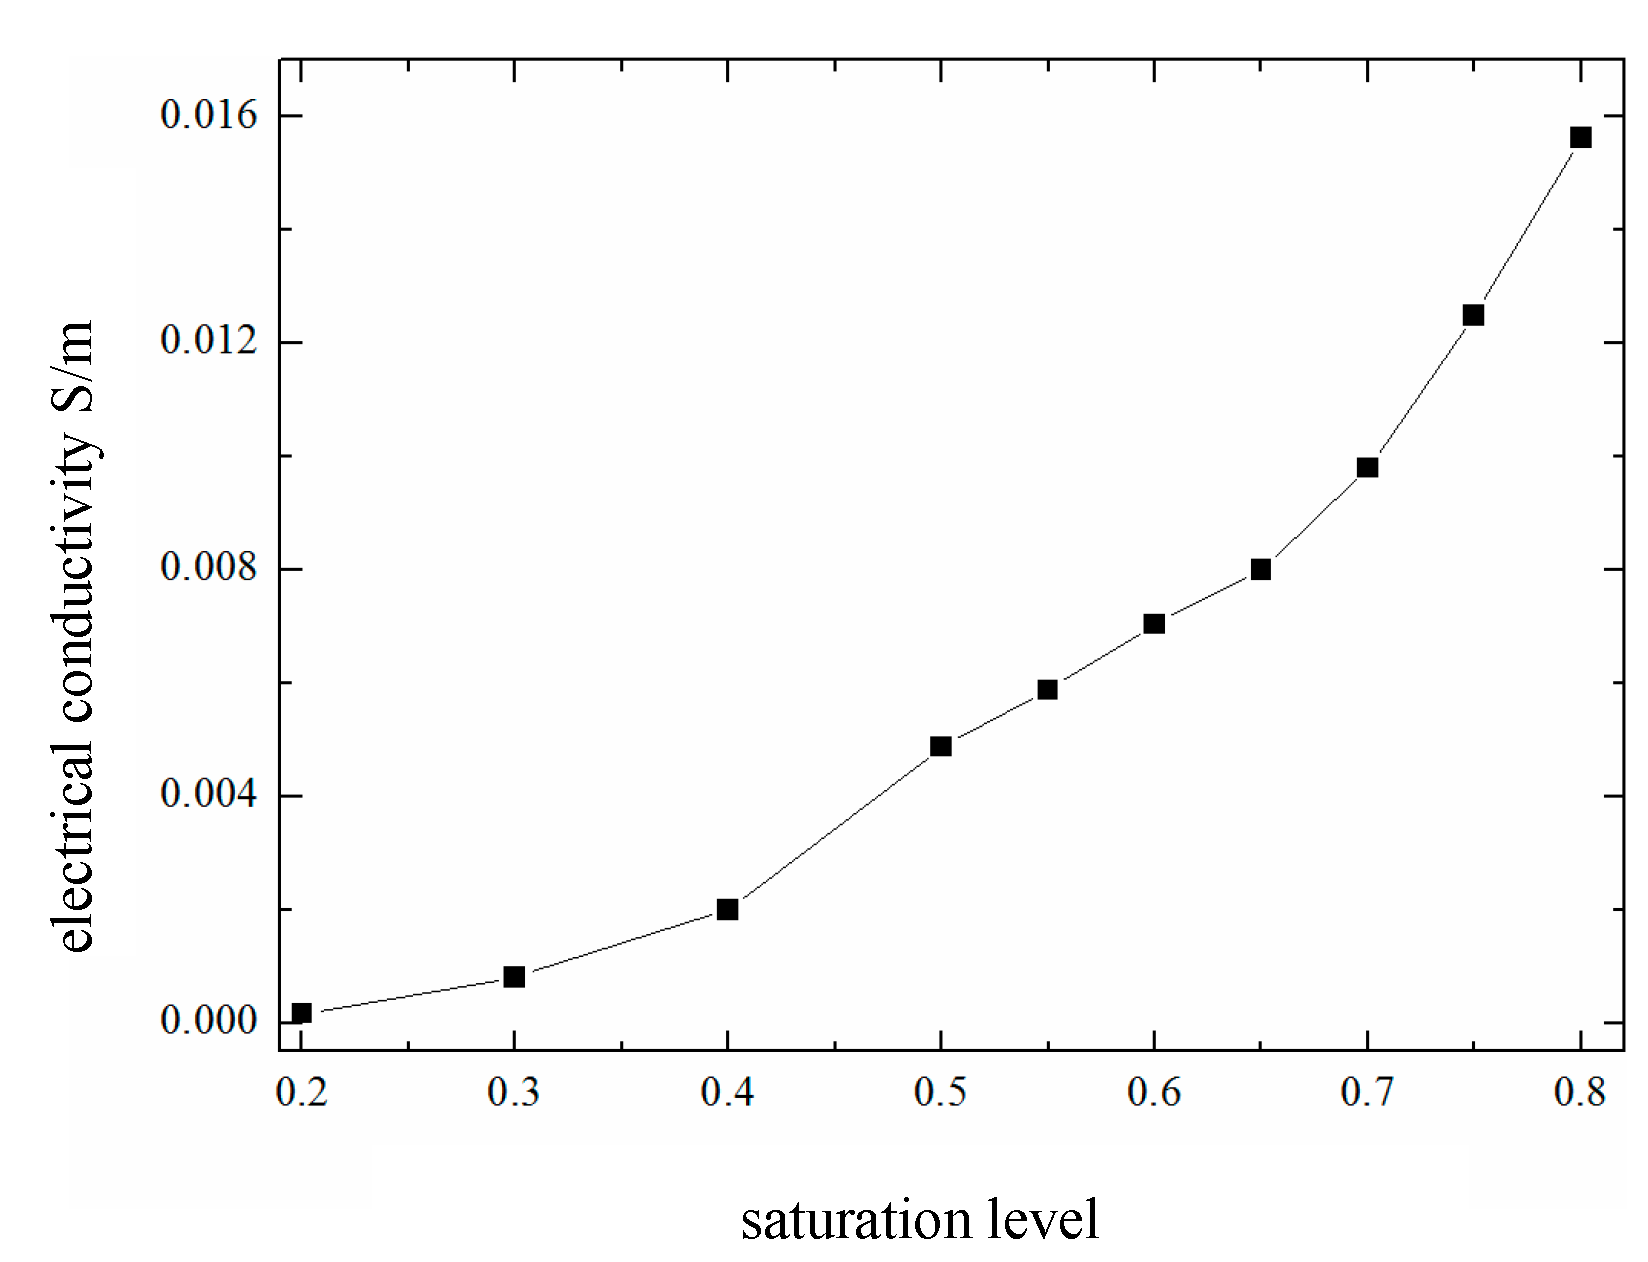
Figure 16.
Reinforcement corrosion model diagram.
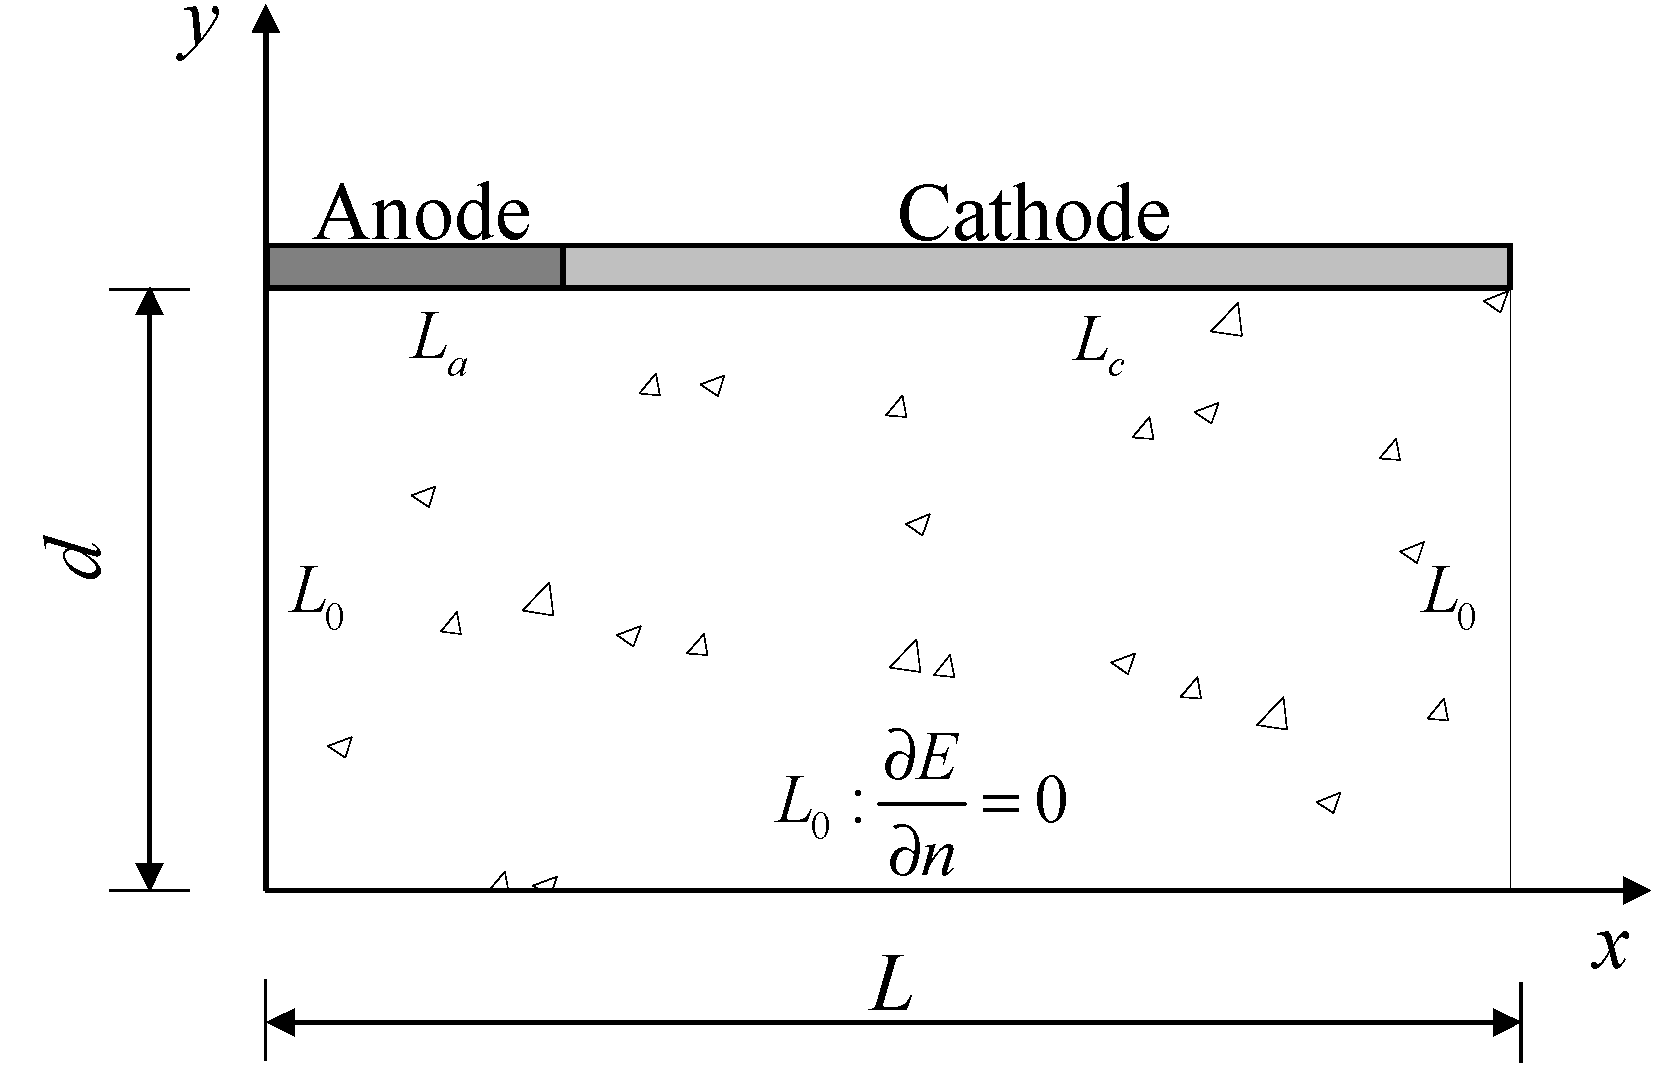
Figure 17.
Numerical calculation process of the reinforcement corrosion model.
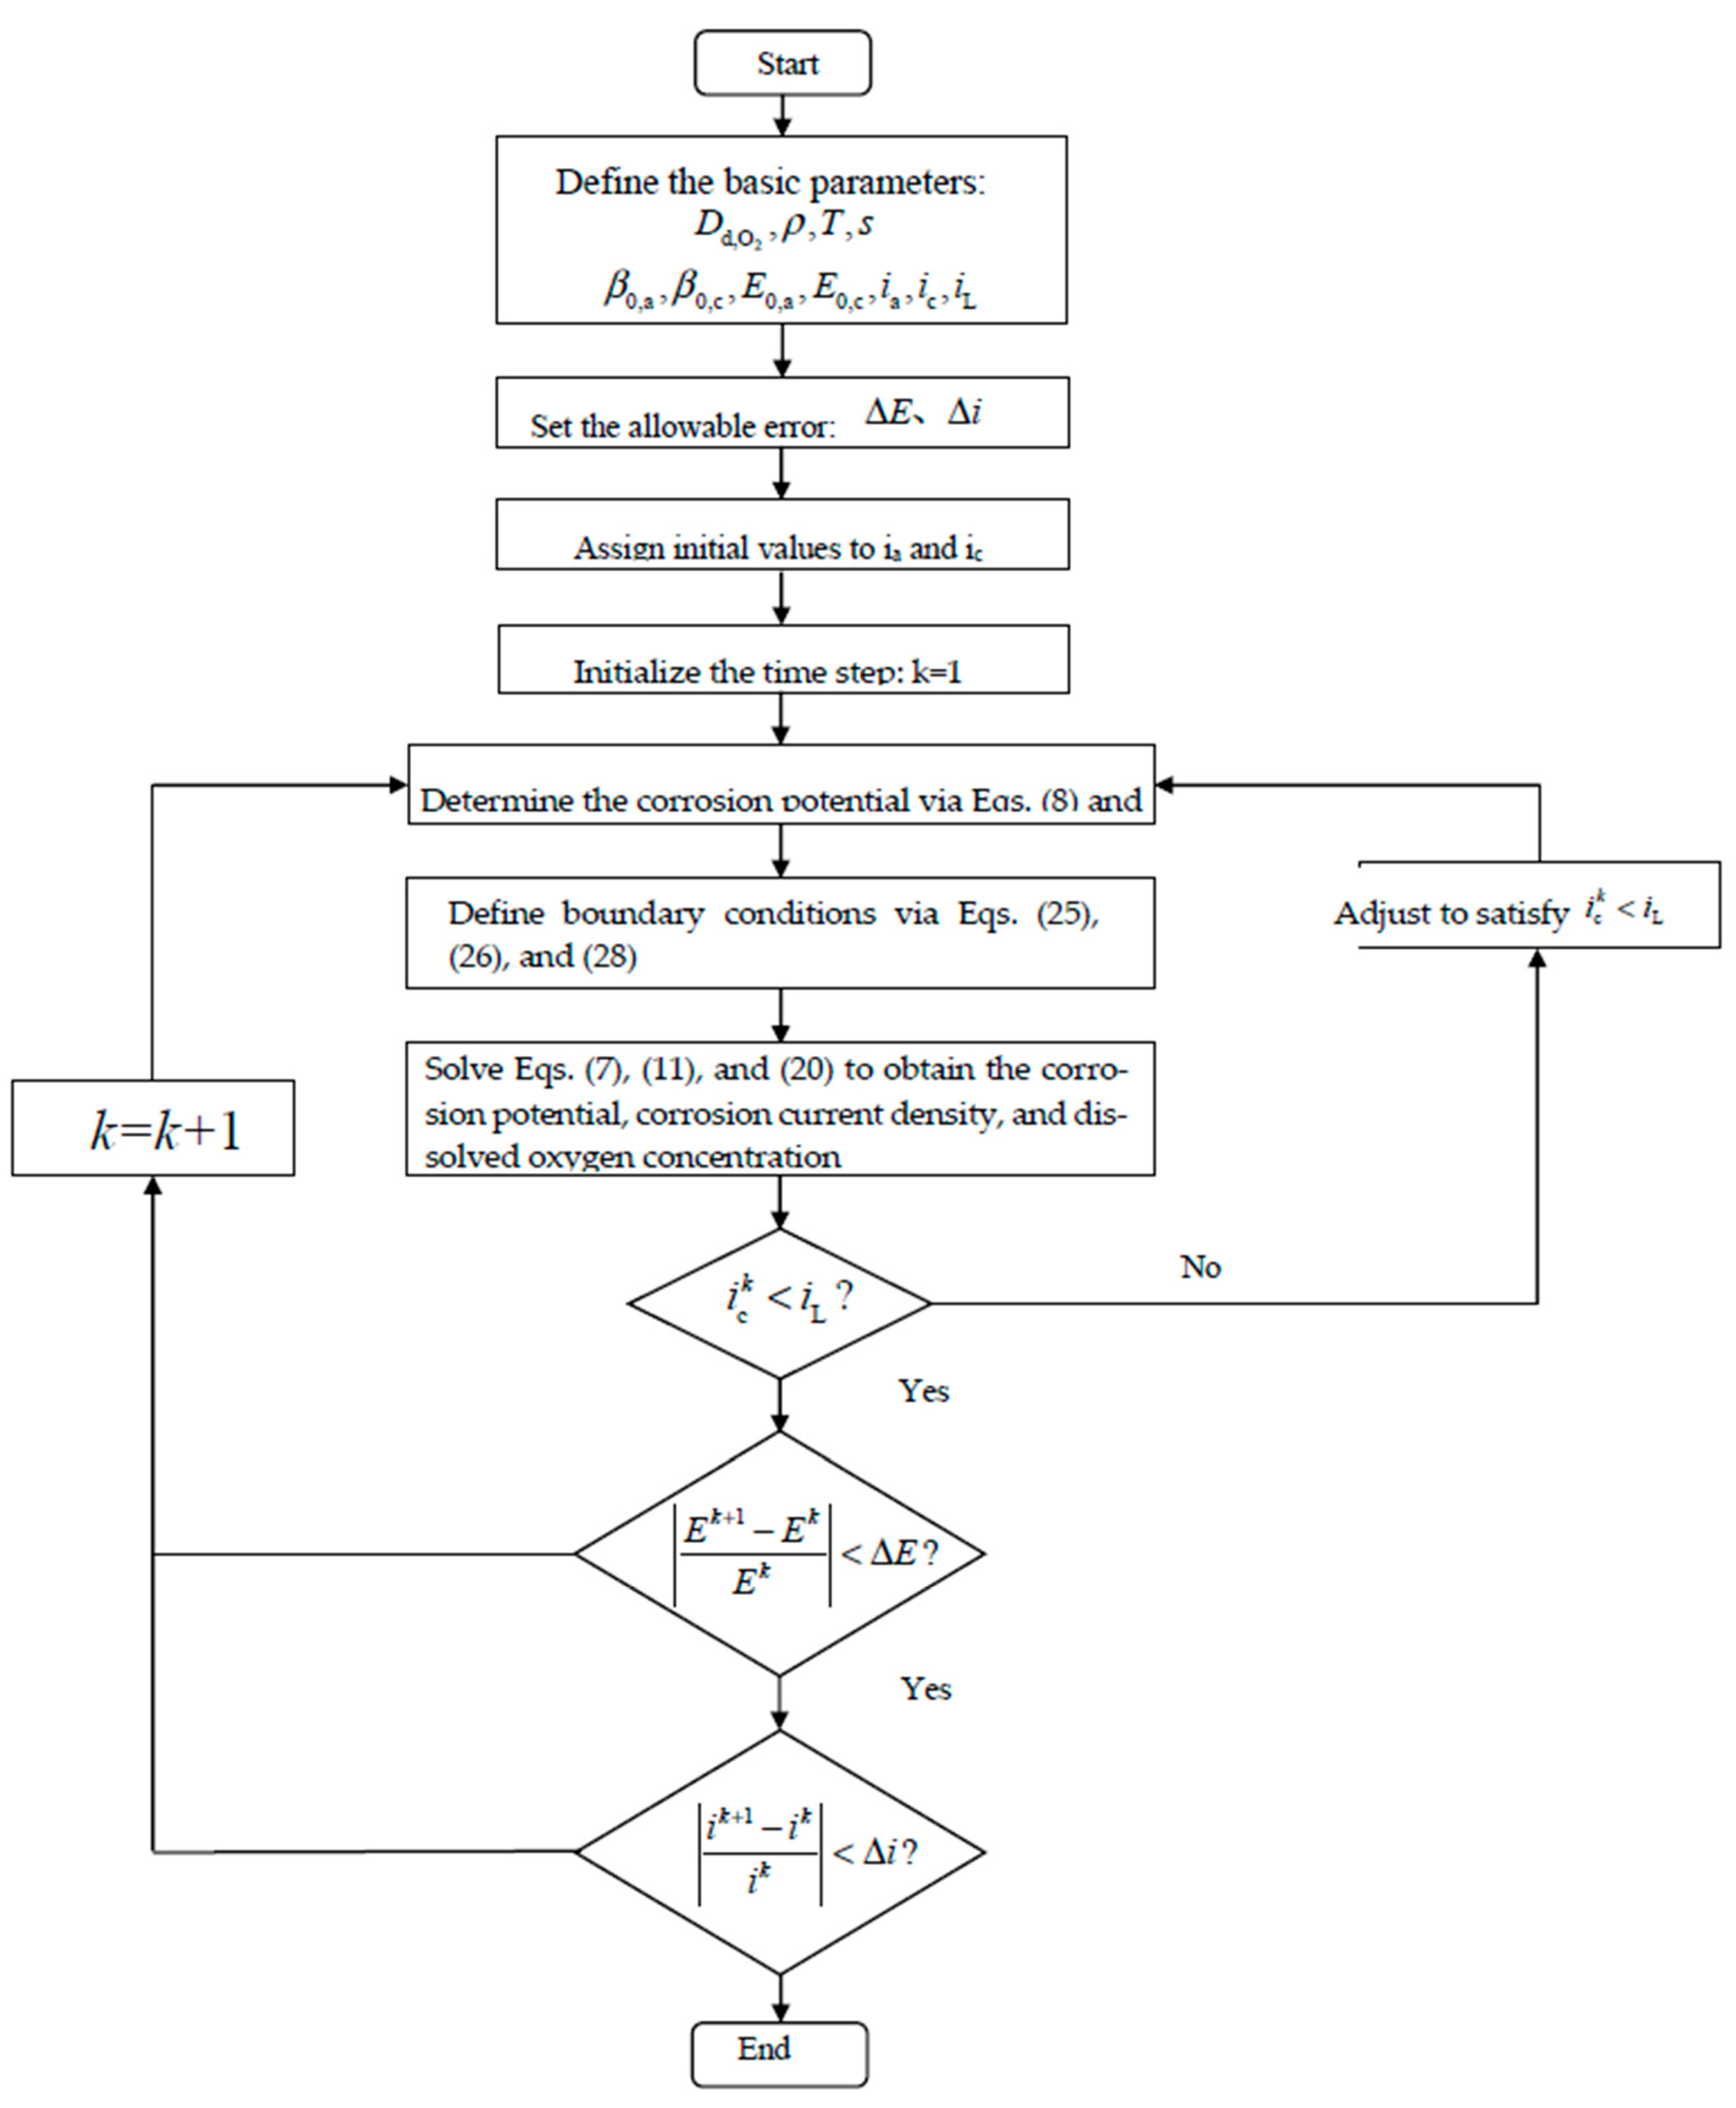
Figure 18.
Distributions of the oxygen concentrations on the surfaces of rebars with different damage levels.
Figure 18.
Distributions of the oxygen concentrations on the surfaces of rebars with different damage levels.
| -780 | 160 | 60 | -160 |
Figure 19.
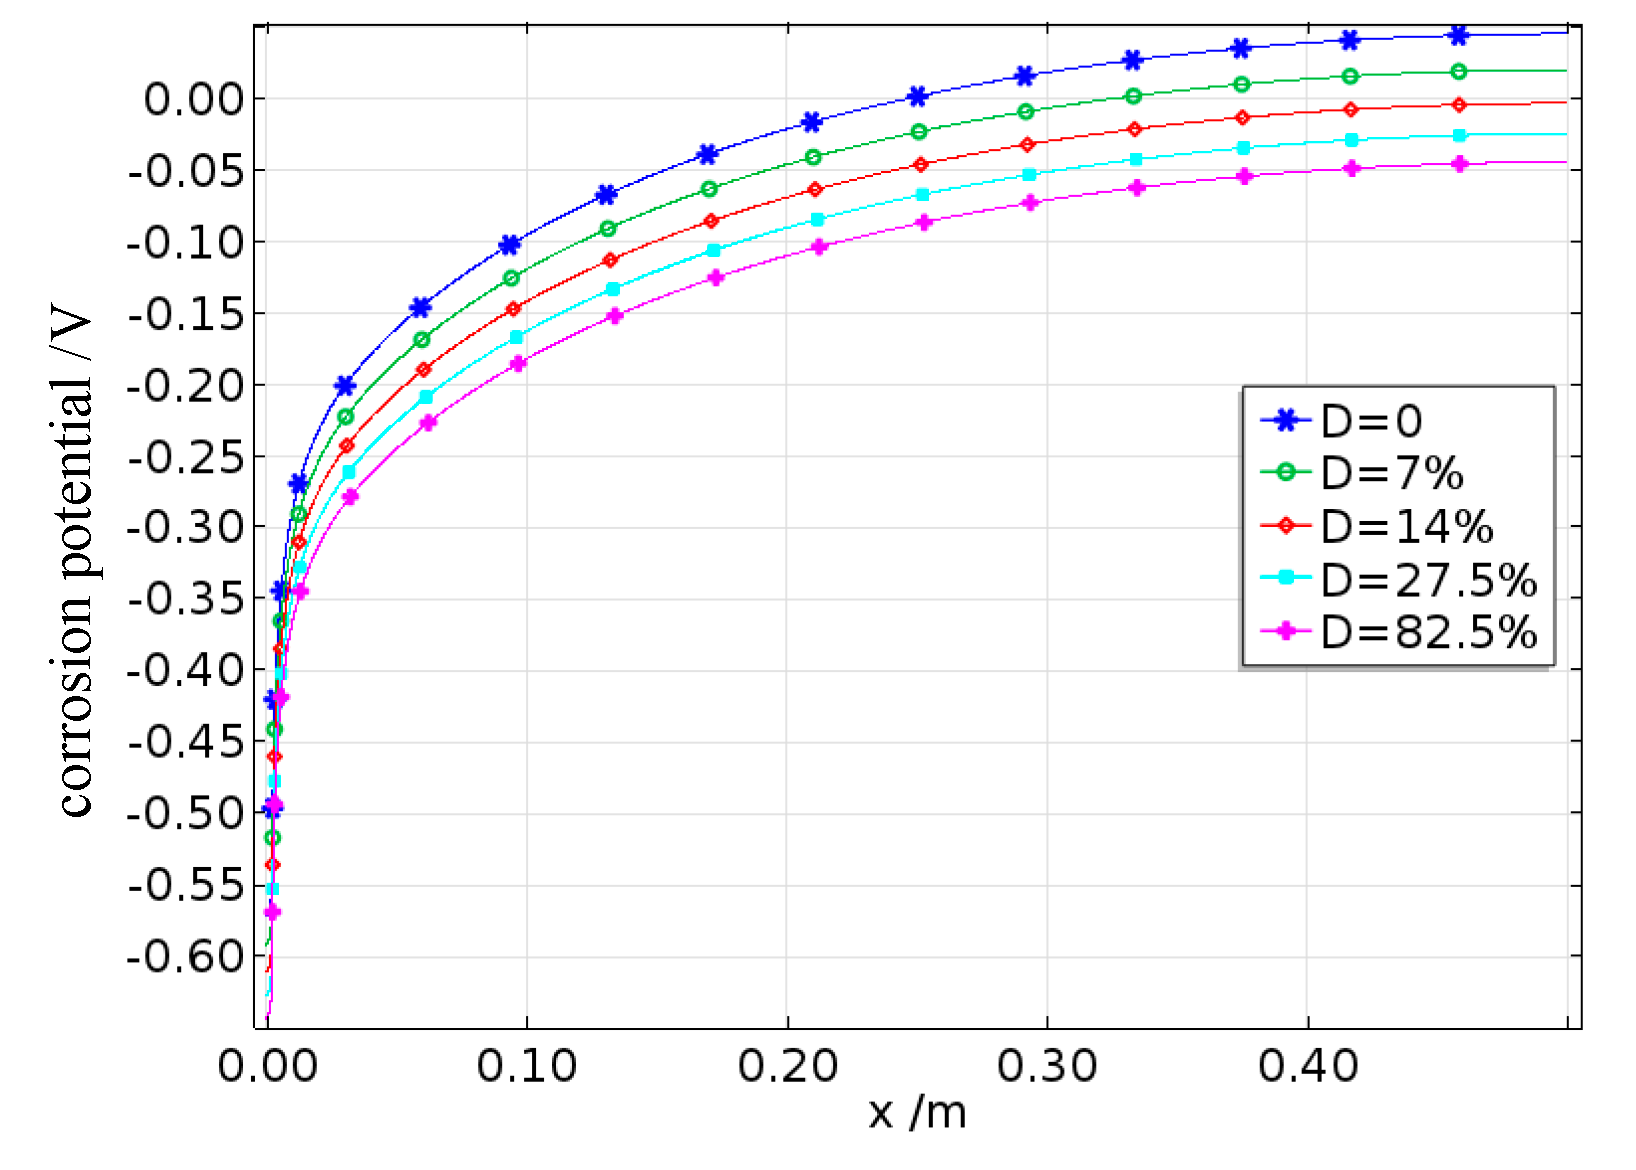
Corrosion potential on the surfaces of rebars with different damage levels.
| -780 | 160 | 60 | -160 |
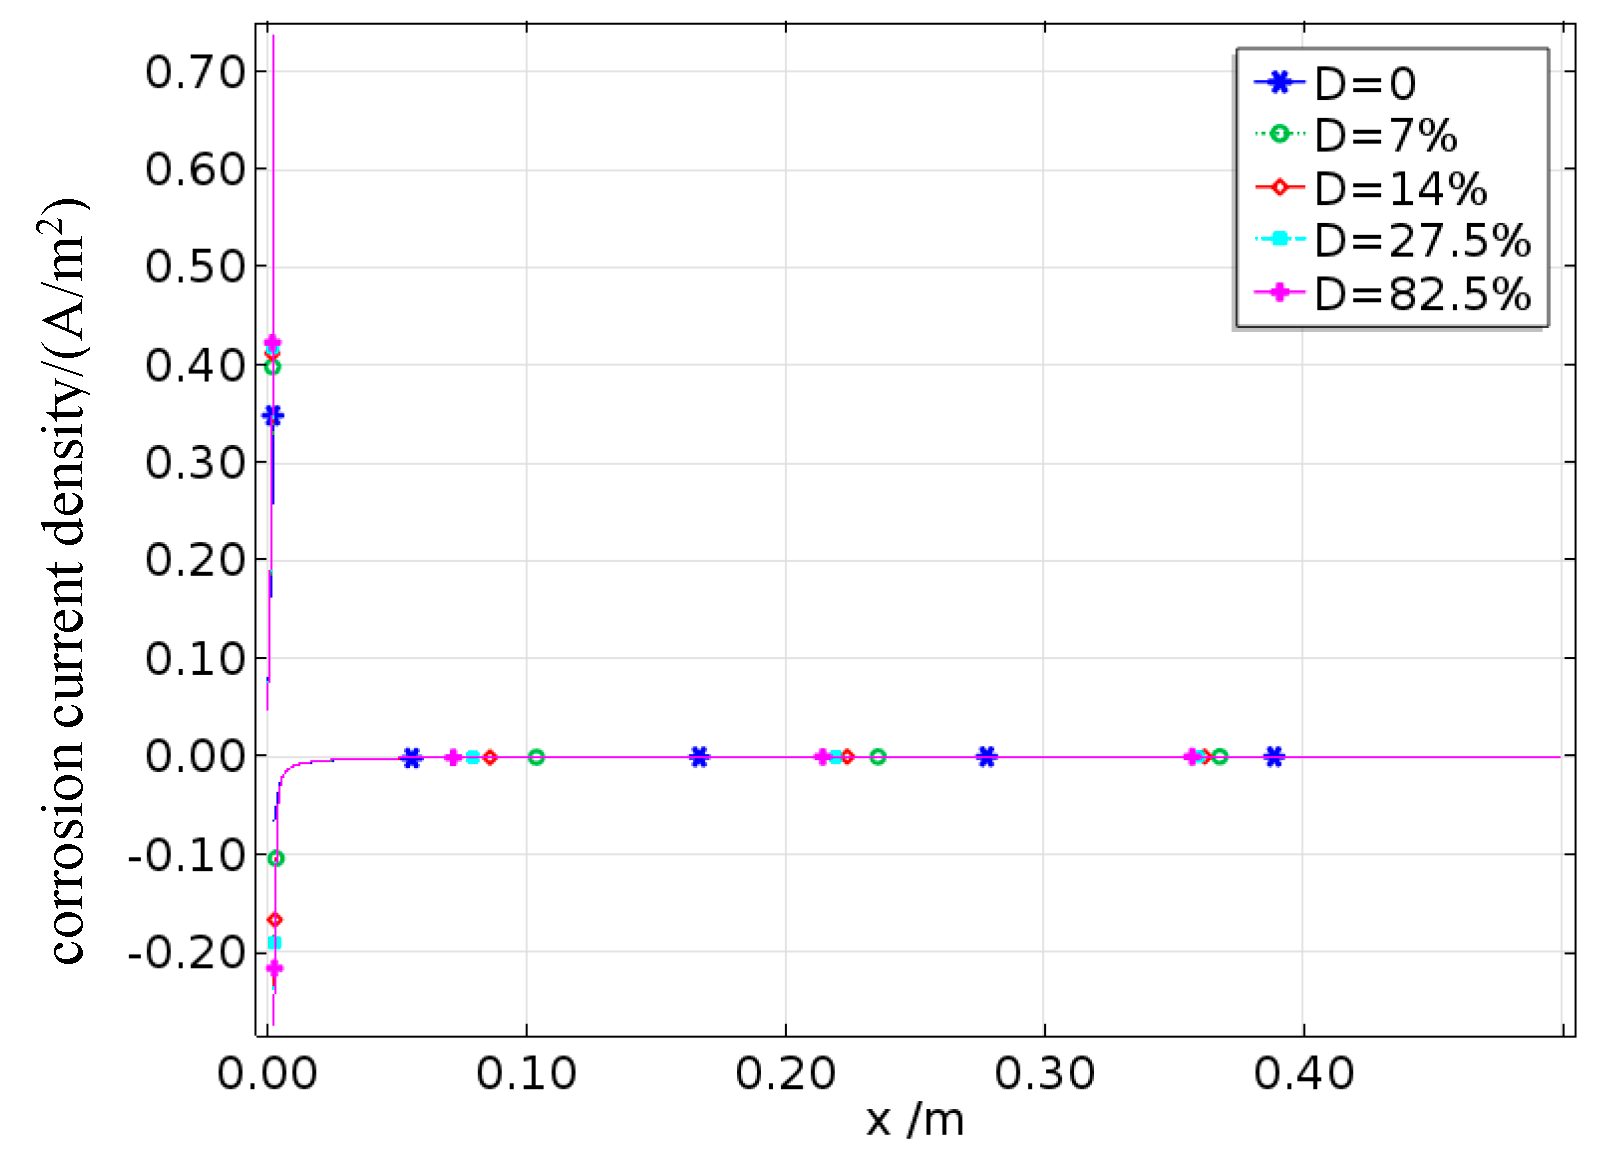
Figure 20.
Corrosion current density on the surfaces of rebars with different degrees of damage. .
| -780 | 160 | 60 | -160 |
Figure 21.
Average corrosion current density on the surfaces of rebars with different degrees of damage.
Figure 21.
Average corrosion current density on the surfaces of rebars with different degrees of damage.
| -780 | 160 | 60 | -160 |
Figure 22.
Effect of saturation on reinforcement corrosion in damaged concrete: (a) D=0 oxygen concentration distribution; (b) D=82.5% oxygen concentration distribution; (c) corrosion potential observed with D=0; (d) corrosion potential observed with D=82.5%; (e) D=0 corrosion current density; (f) D=82.5% corrosion current density.
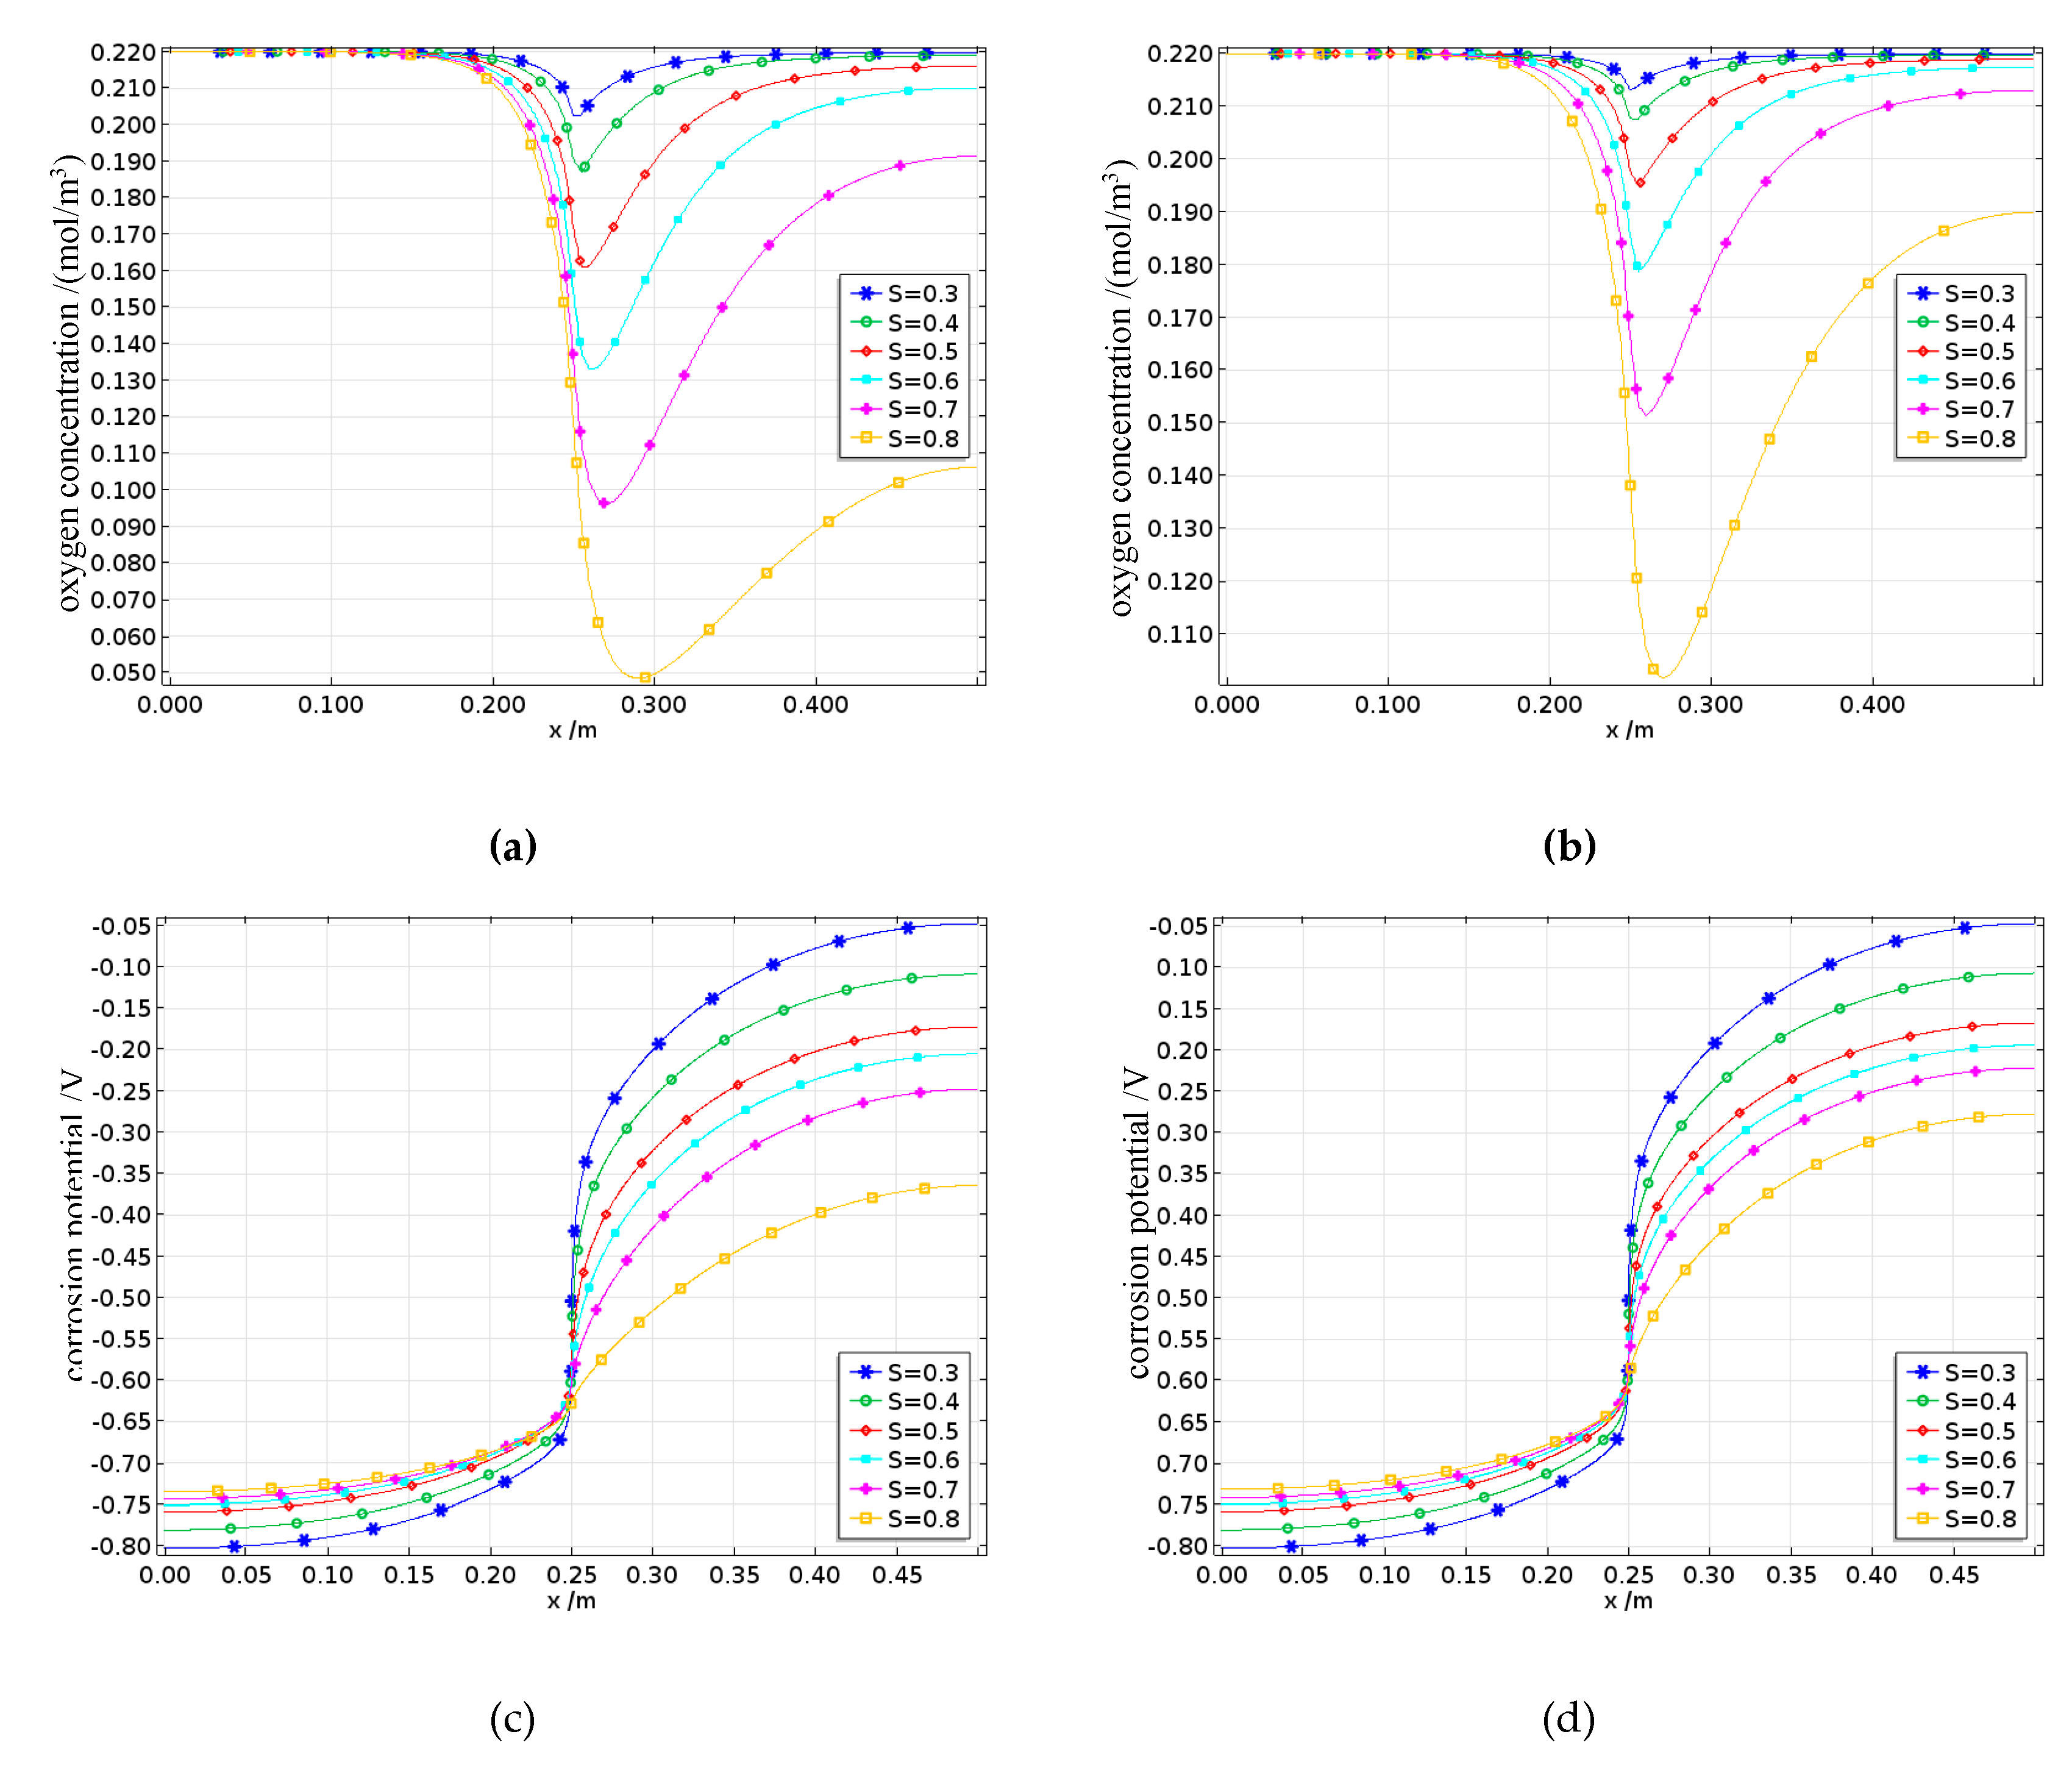
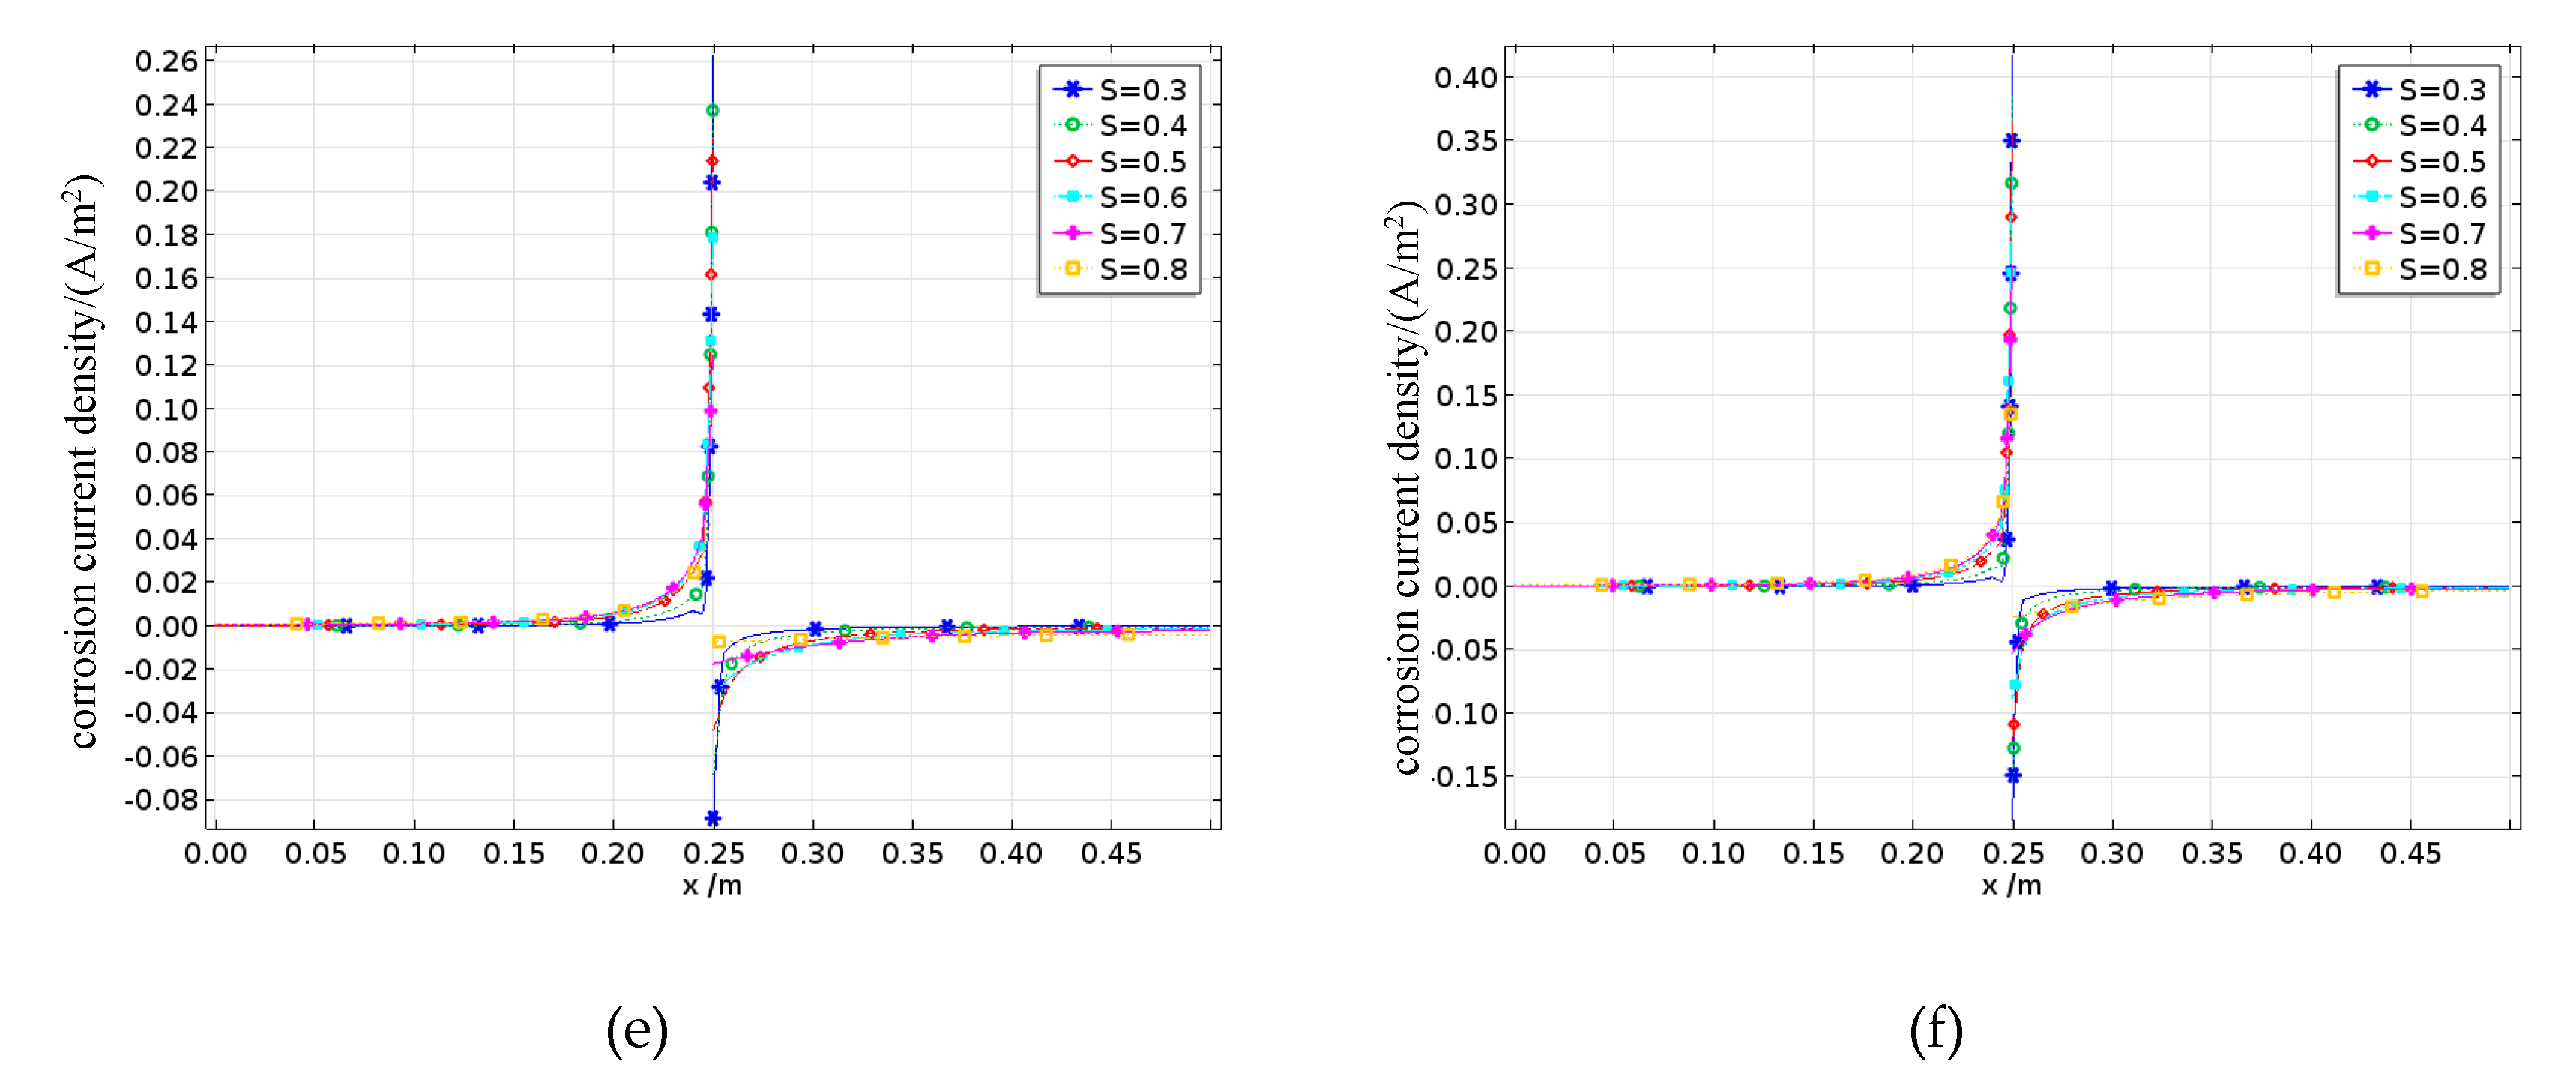
Figure 23.
Effect of saturation rate on the average corrosion current density.
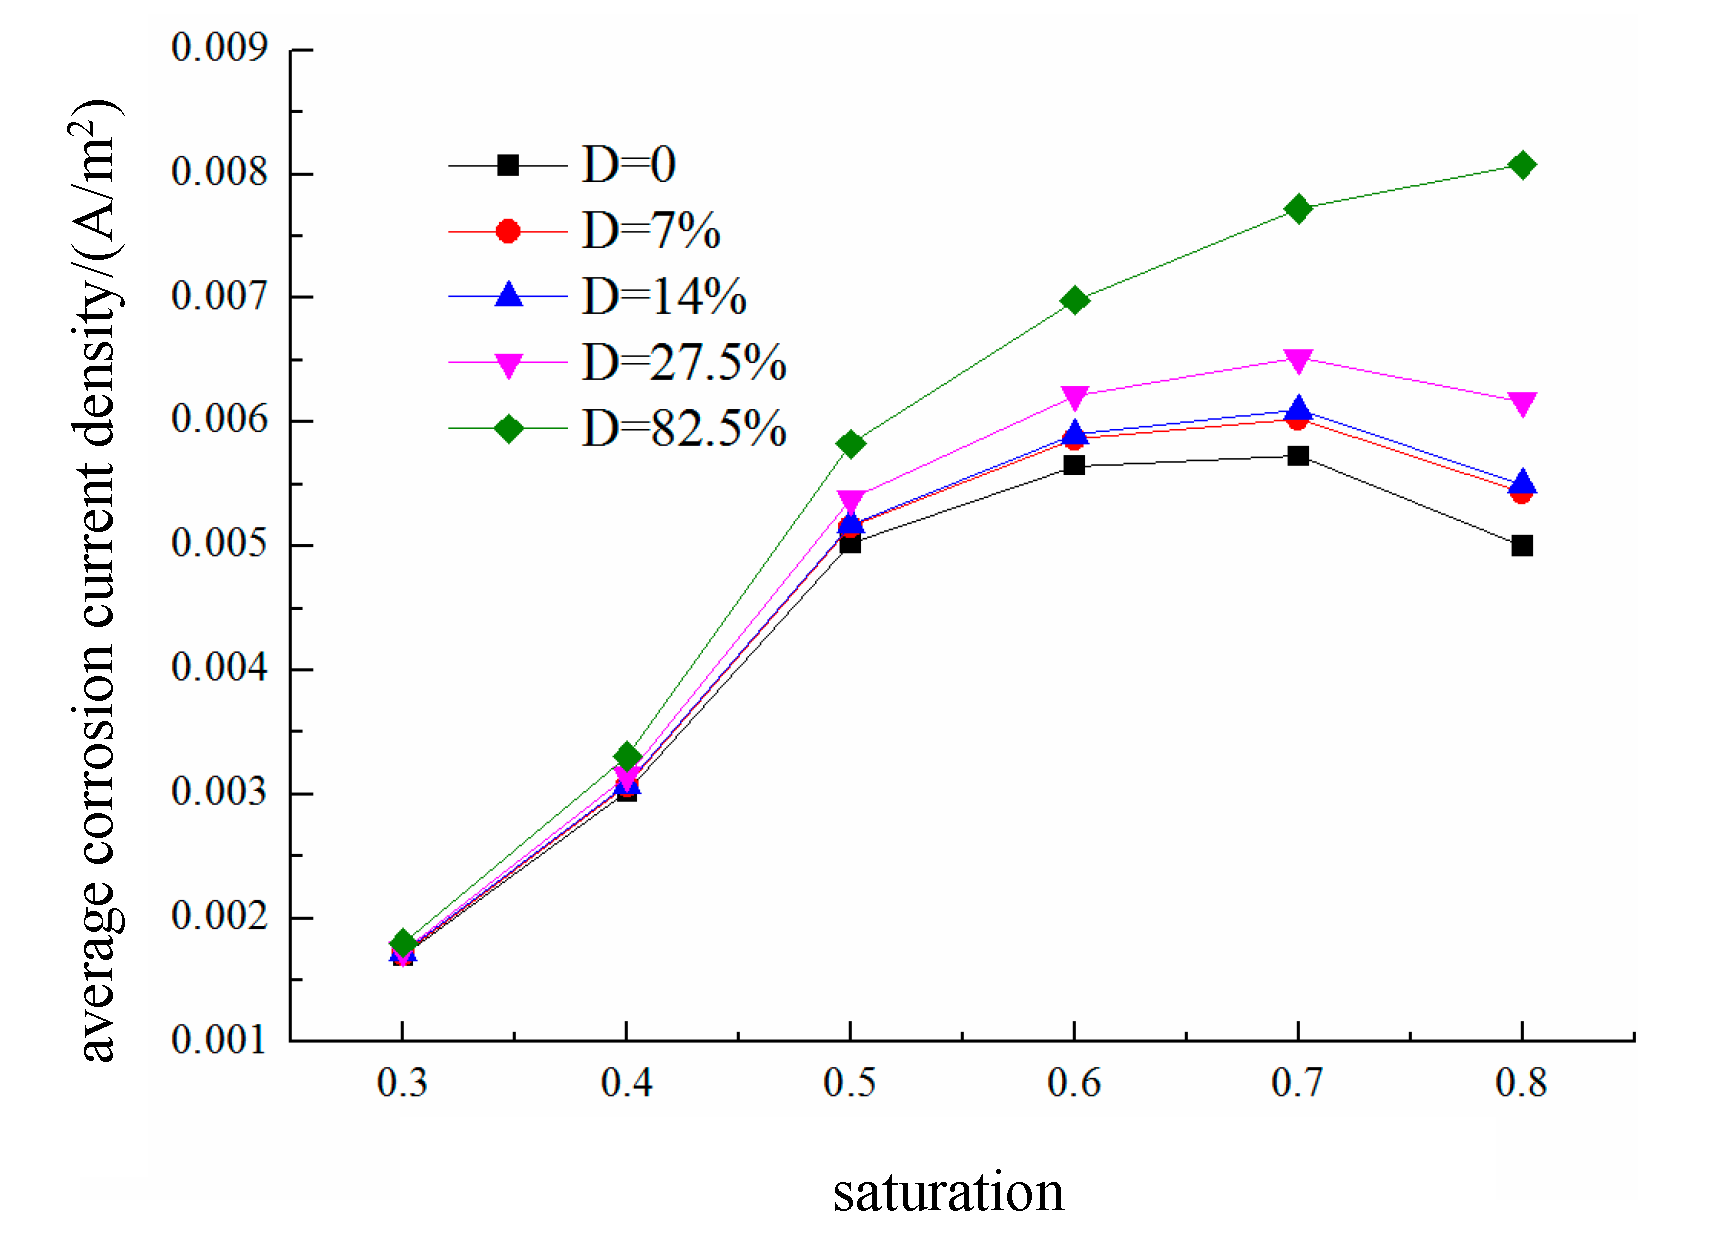
Figure 24.
Effect of temperature on reinforcement corrosion in fatigue-damaged concrete: (a) oxygen concentration distribution with D=0; (b) oxygen concentration distribution with D=82.5%; (c) corrosion potential with D=0; (d) corrosion potential with D=82.5%; (e) corrosion current density with D=0; (f) corrosion current density with D=82.5%.
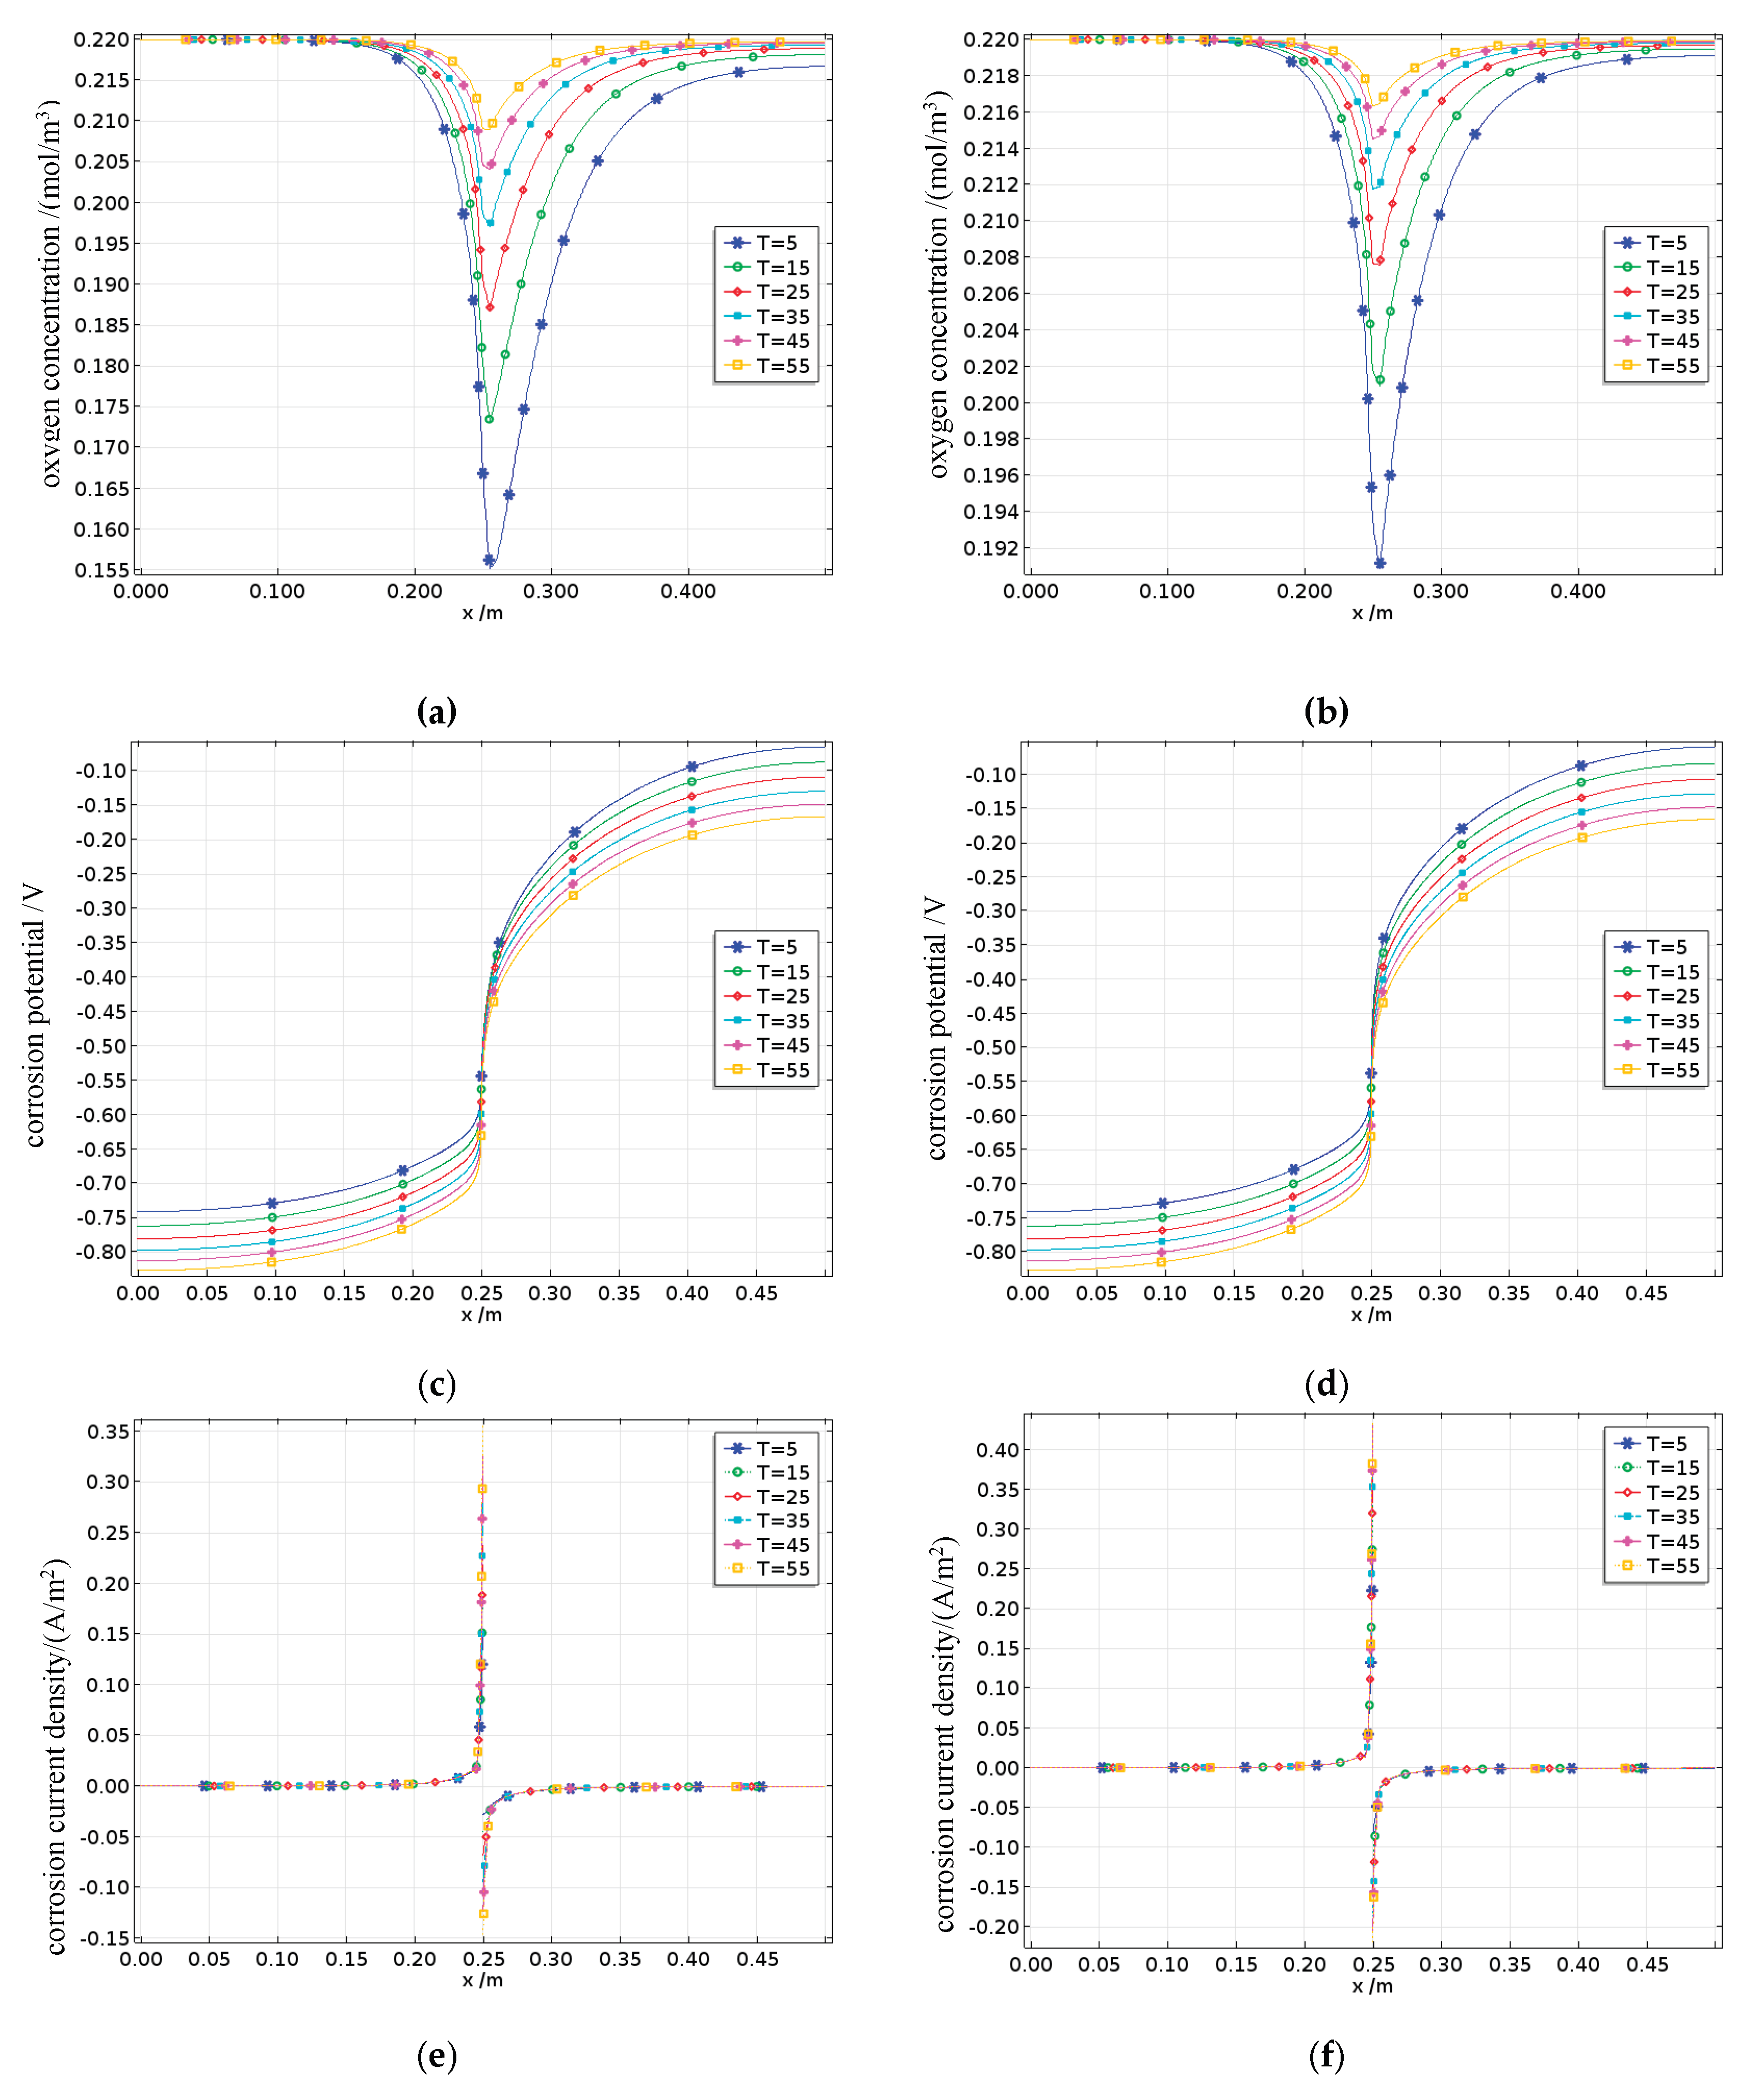
Figure 25.
Figure 25. Effect of temperature on the average corrosion current density.
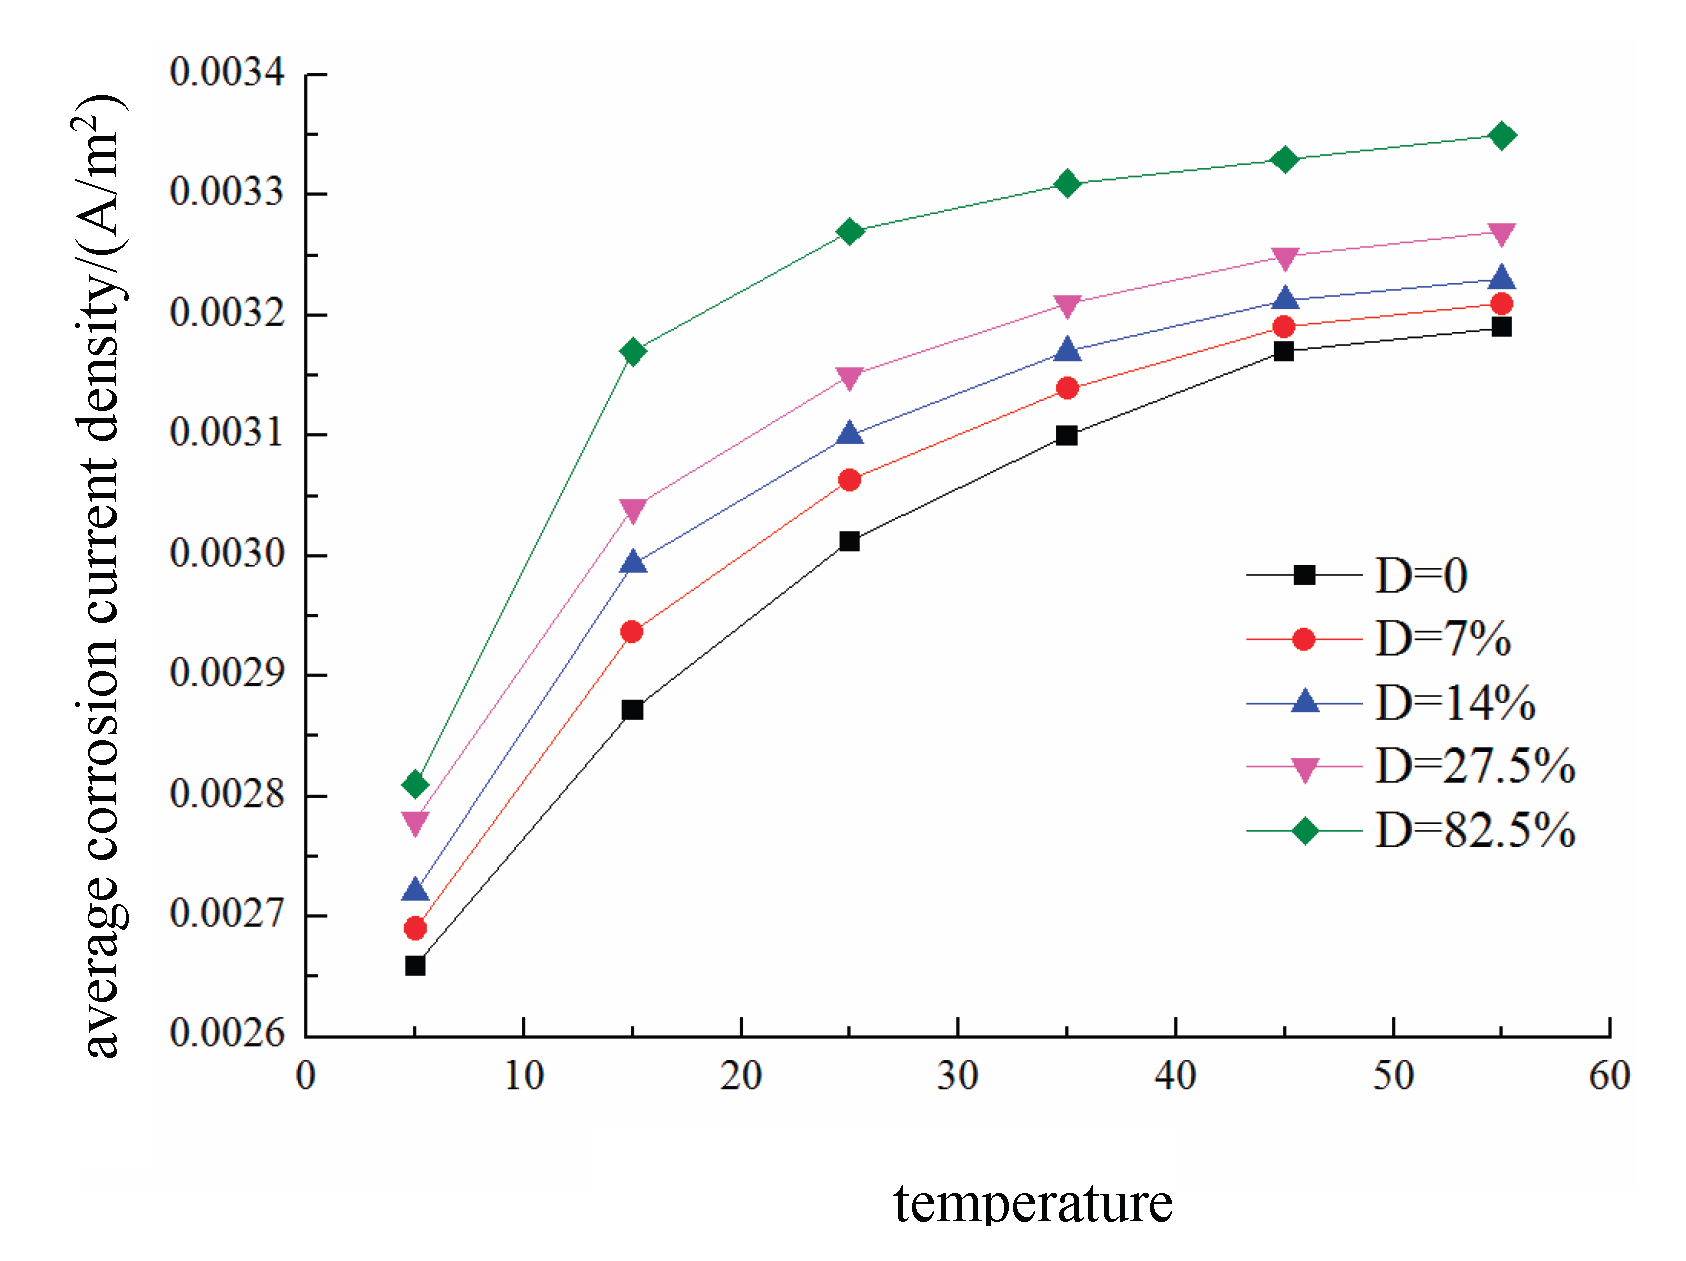
Figure 26.
Effect of the cover thickness on reinforcement corrosion in damaged concrete: (a) oxygen concentration distribution with D=0; (b) oxygen concentration distribution with D=82.5%; (c) corrosion potential with D=0; (d) corrosion potential with D=82.5%; (e) corrosion current density with D=0; (f) corrosion current density with D=82.5%.
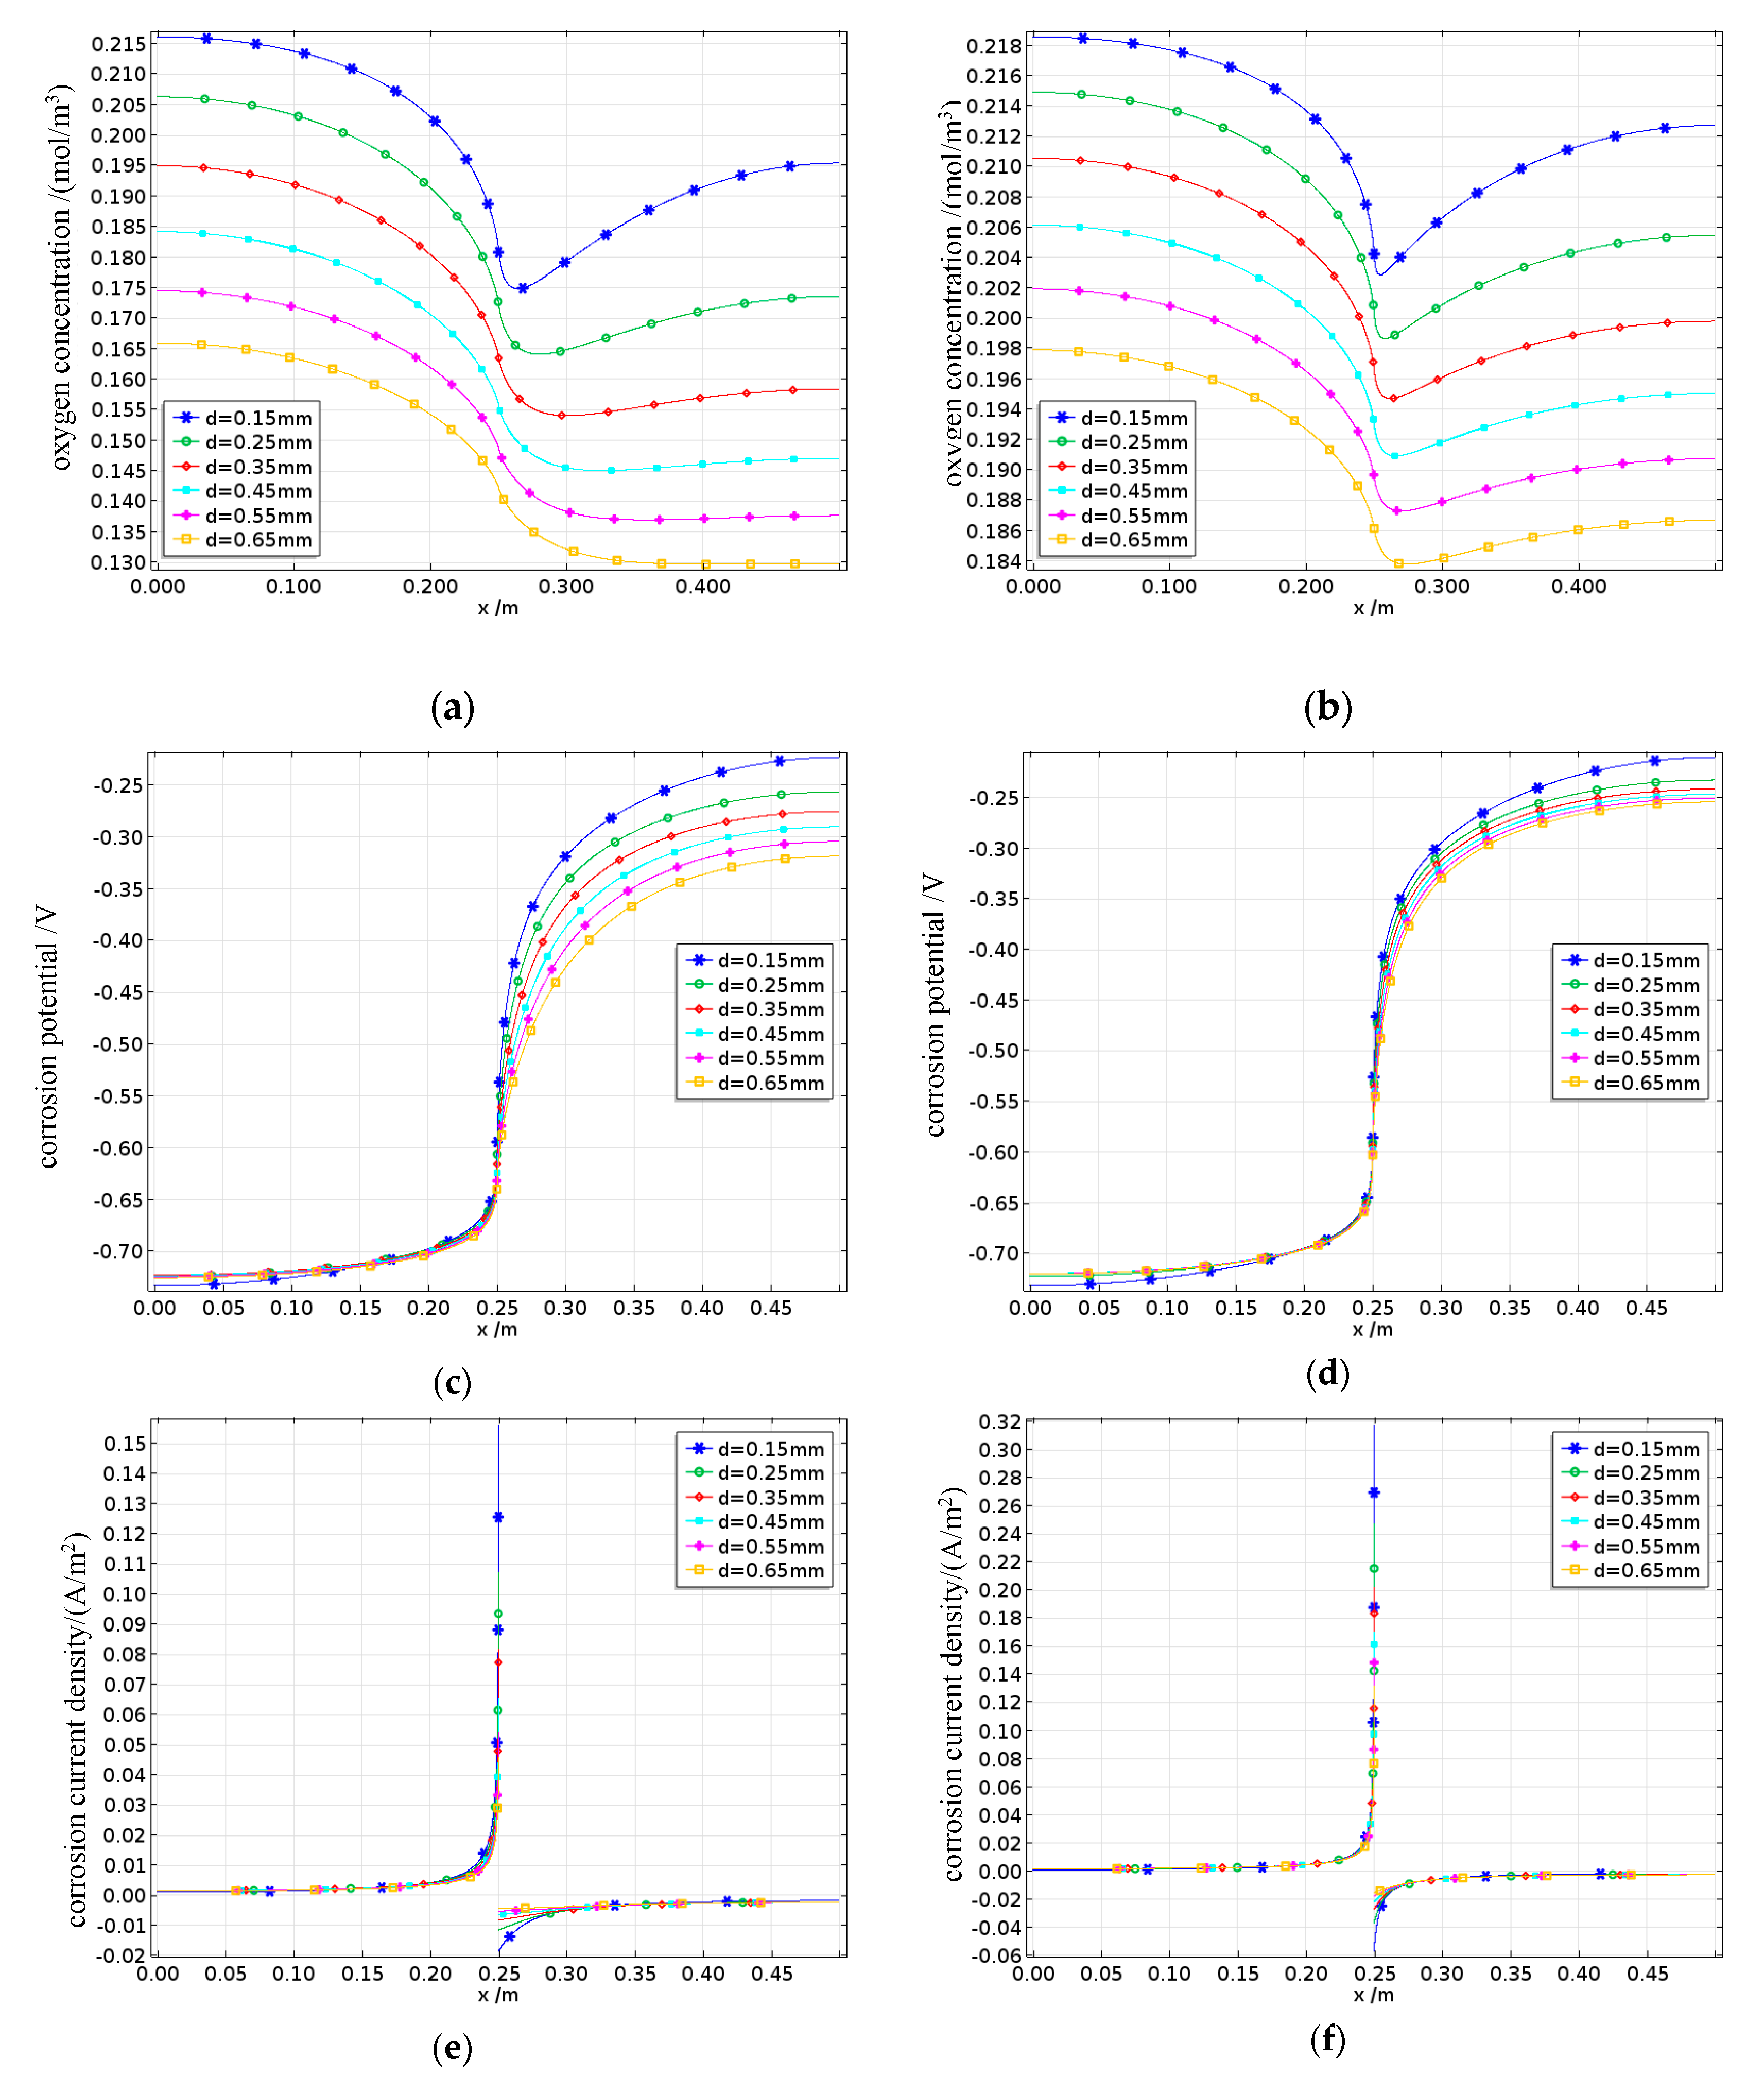
Figure 27.
Effect of the thickness of the protective layer on the average corrosion current density.
Figure 27.
Effect of the thickness of the protective layer on the average corrosion current density.
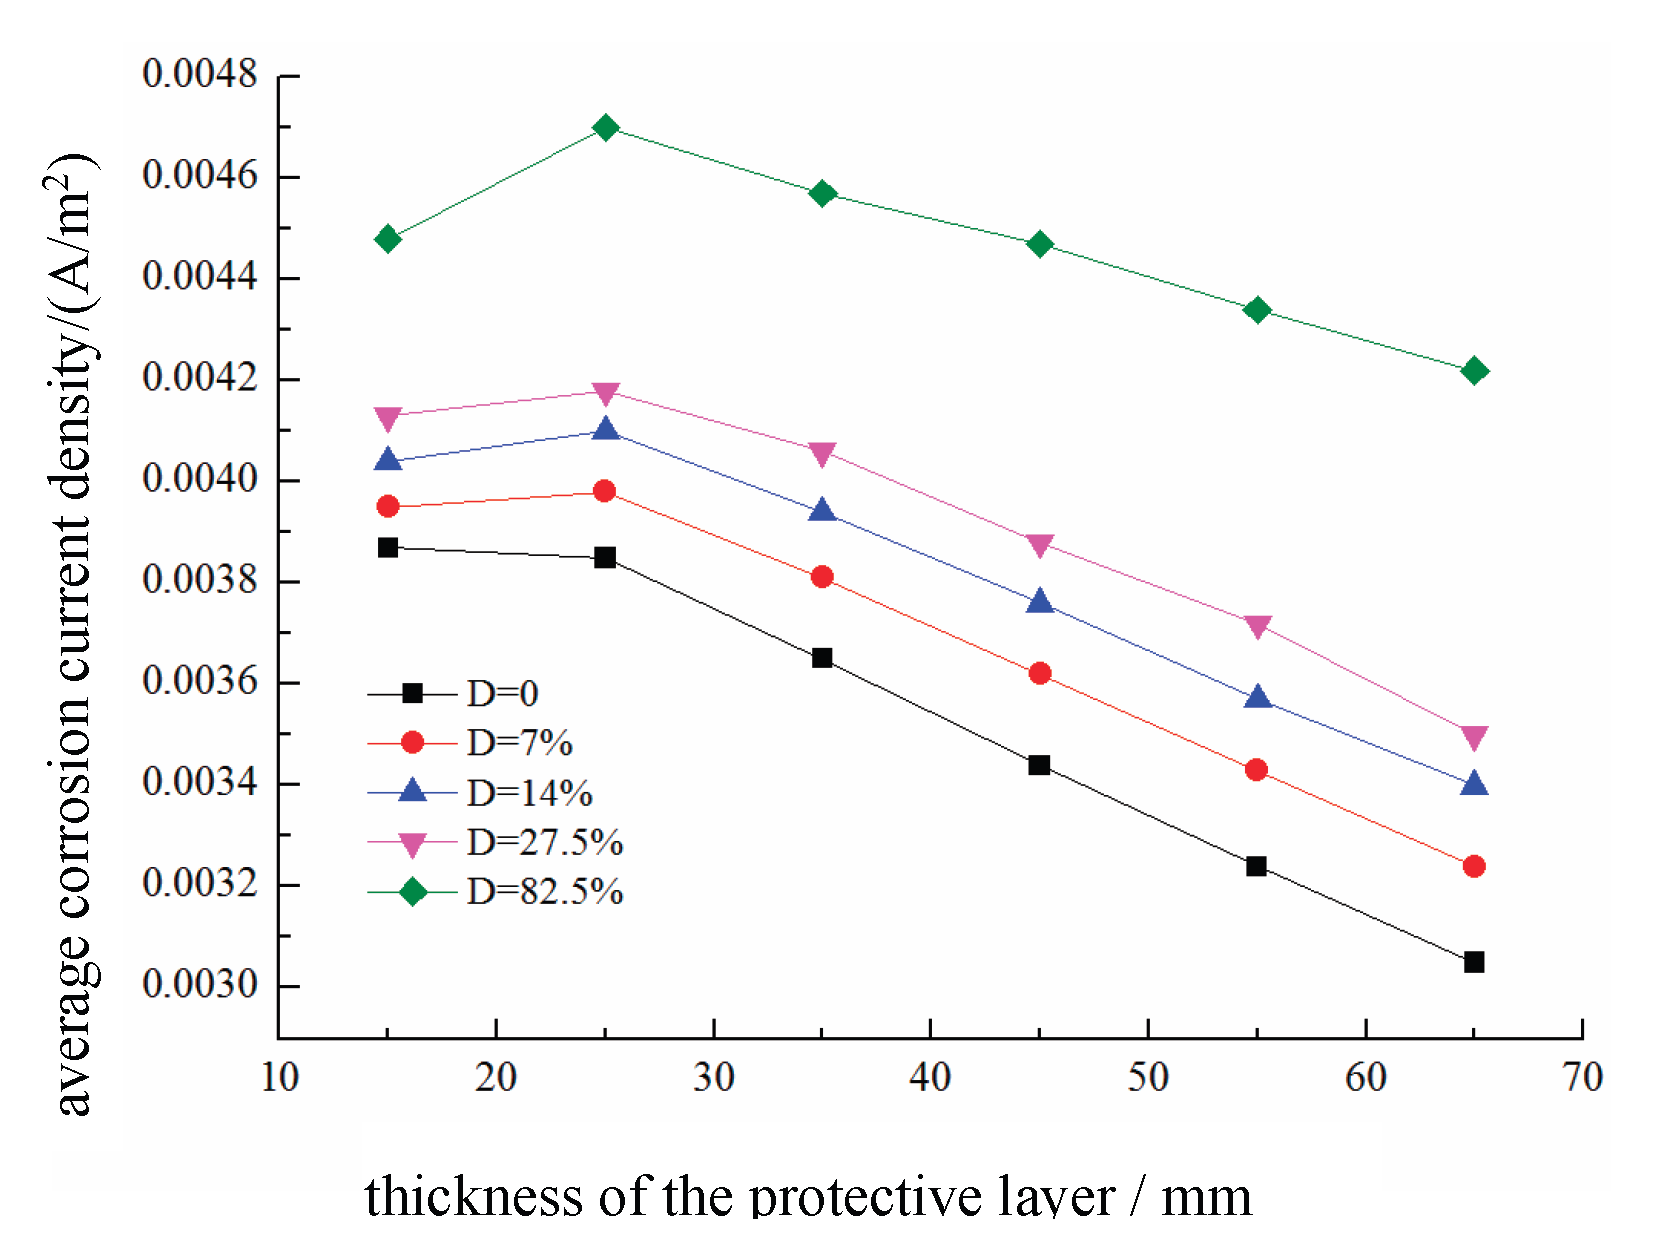
Figure 28.
Effect of the anode-to-cathode area ratio on reinforcement corrosion in damaged concrete: (a) oxygen concentration distribution with D=0; (b) oxygen concentration distribution with D=82.5%; (c) corrosion potential with D=0; (d) corrosion potential with D=82.5%; (e) corrosion current density with D=0; (f) corrosion current density with D=82.5%.
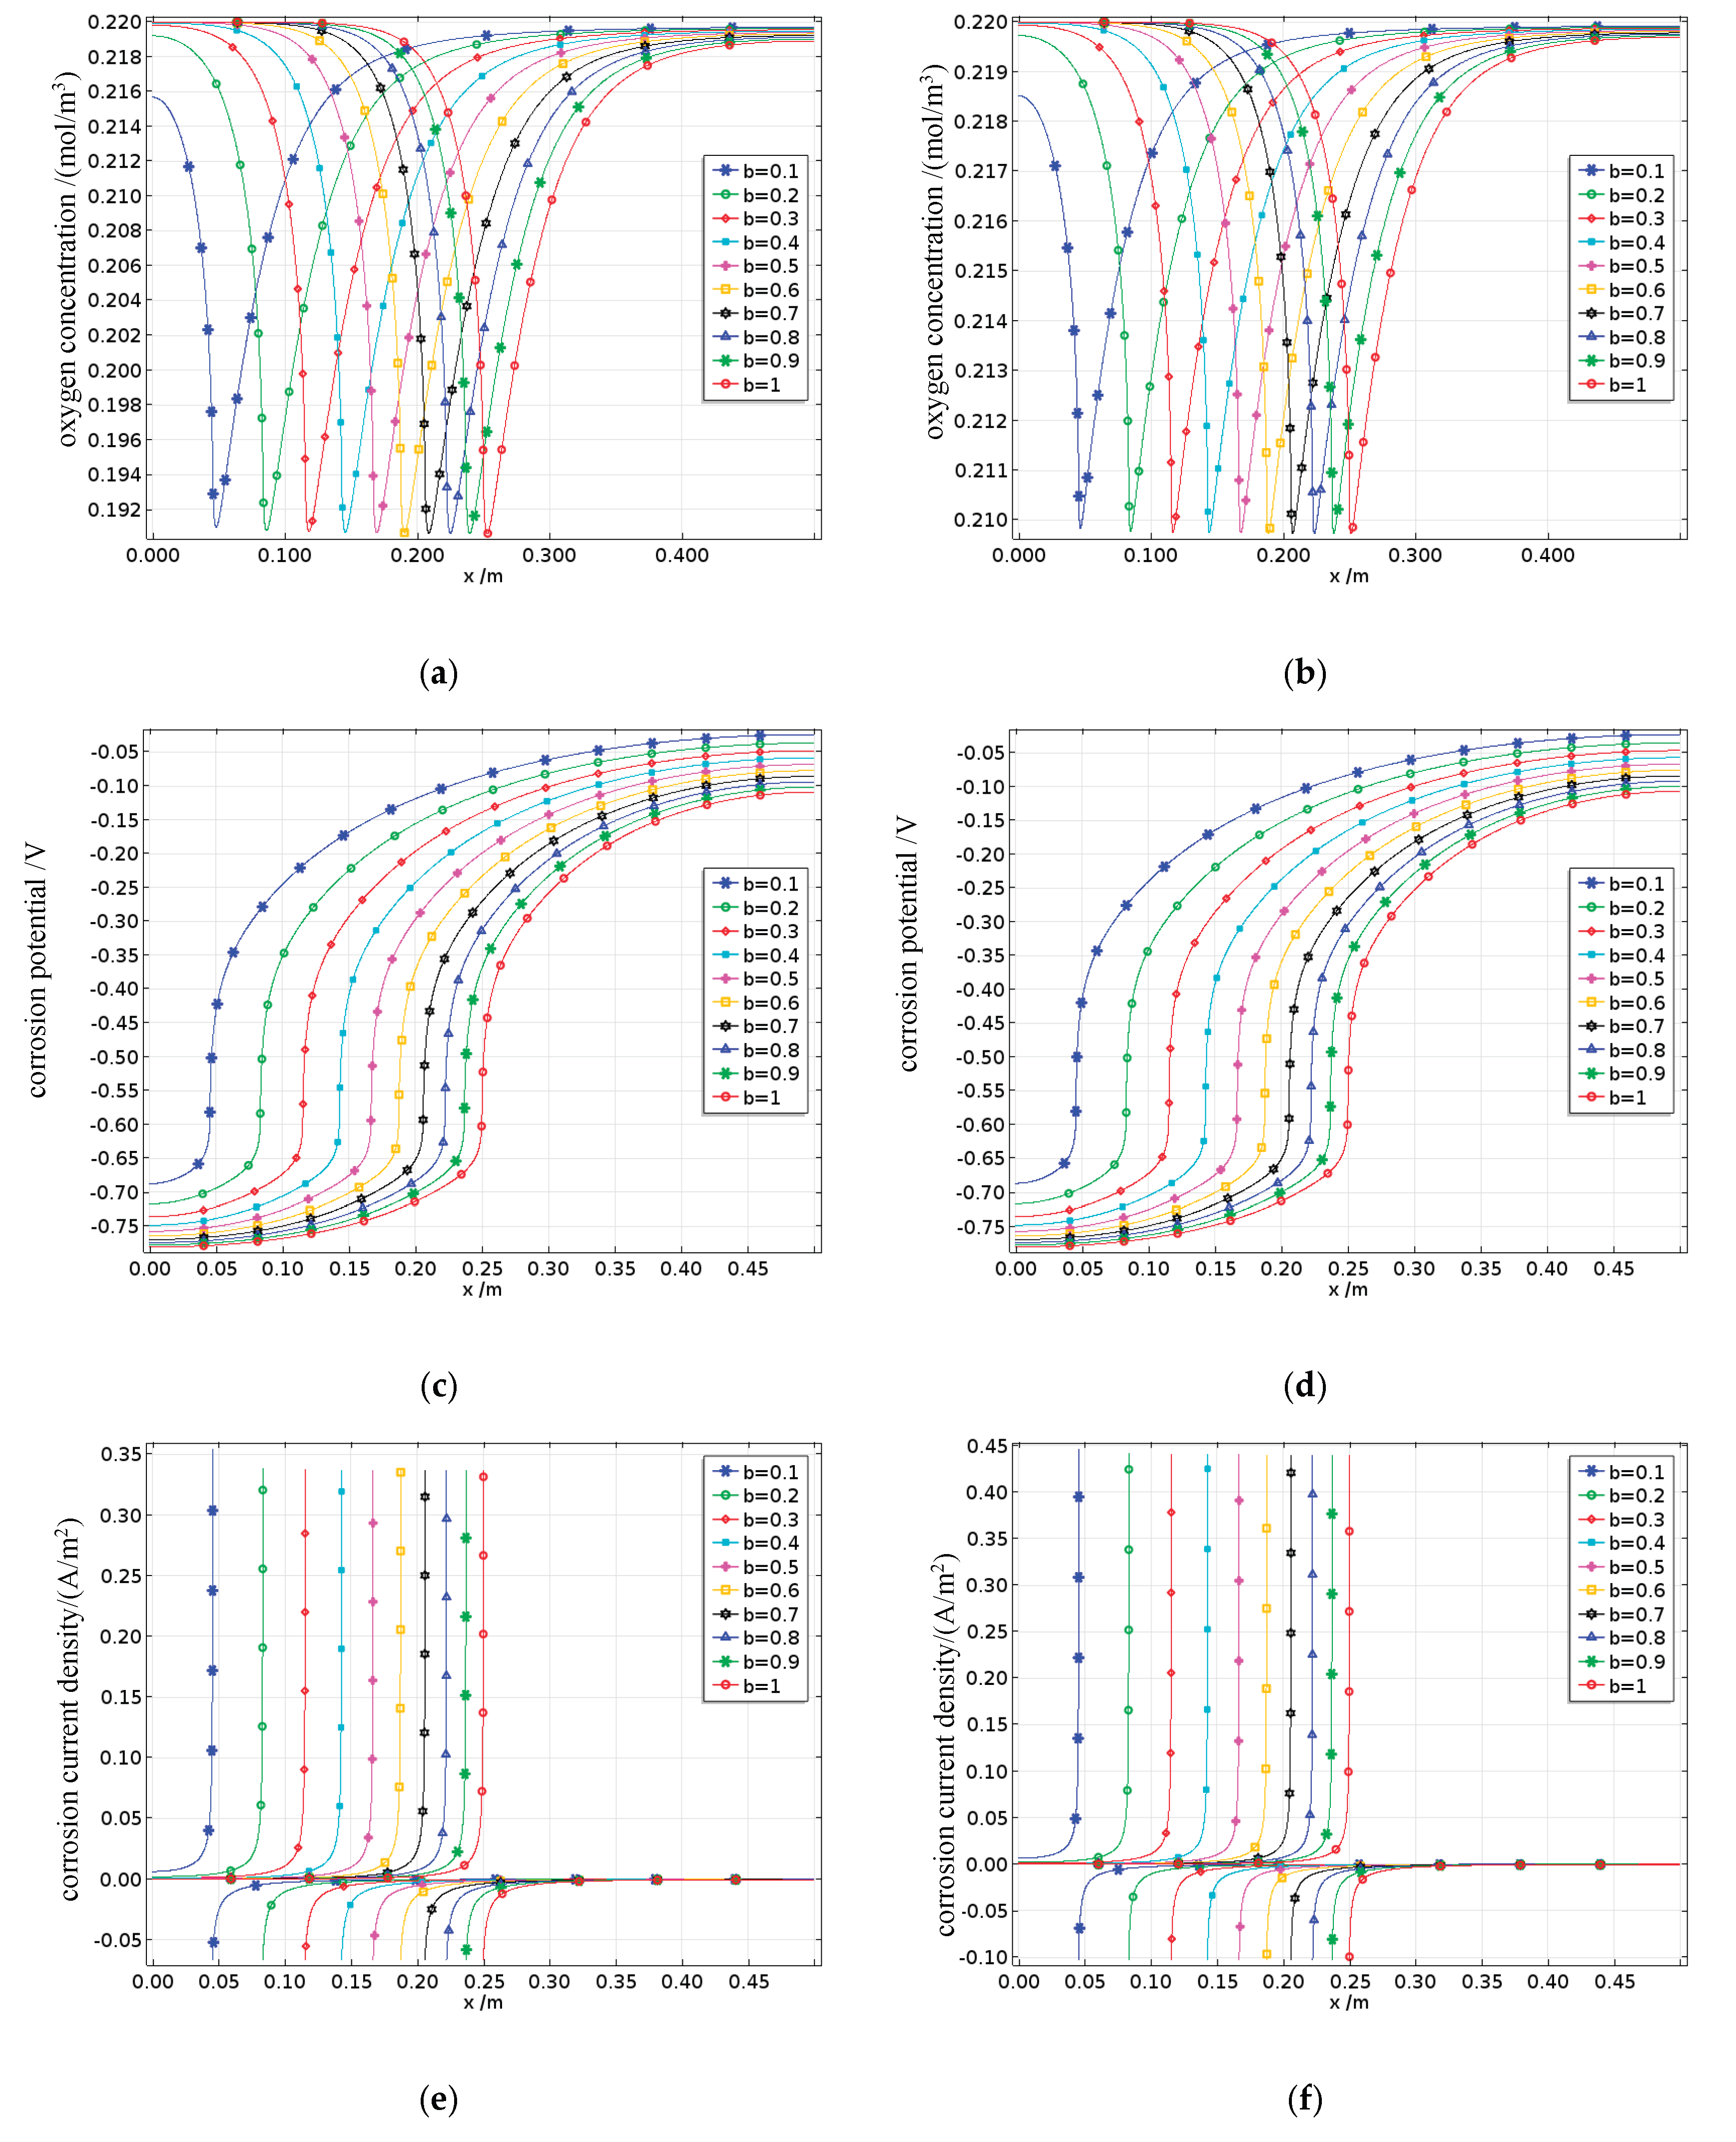
Figure 29.
Effect of the anode-to-cathode area ratio on the average corrosion current density.
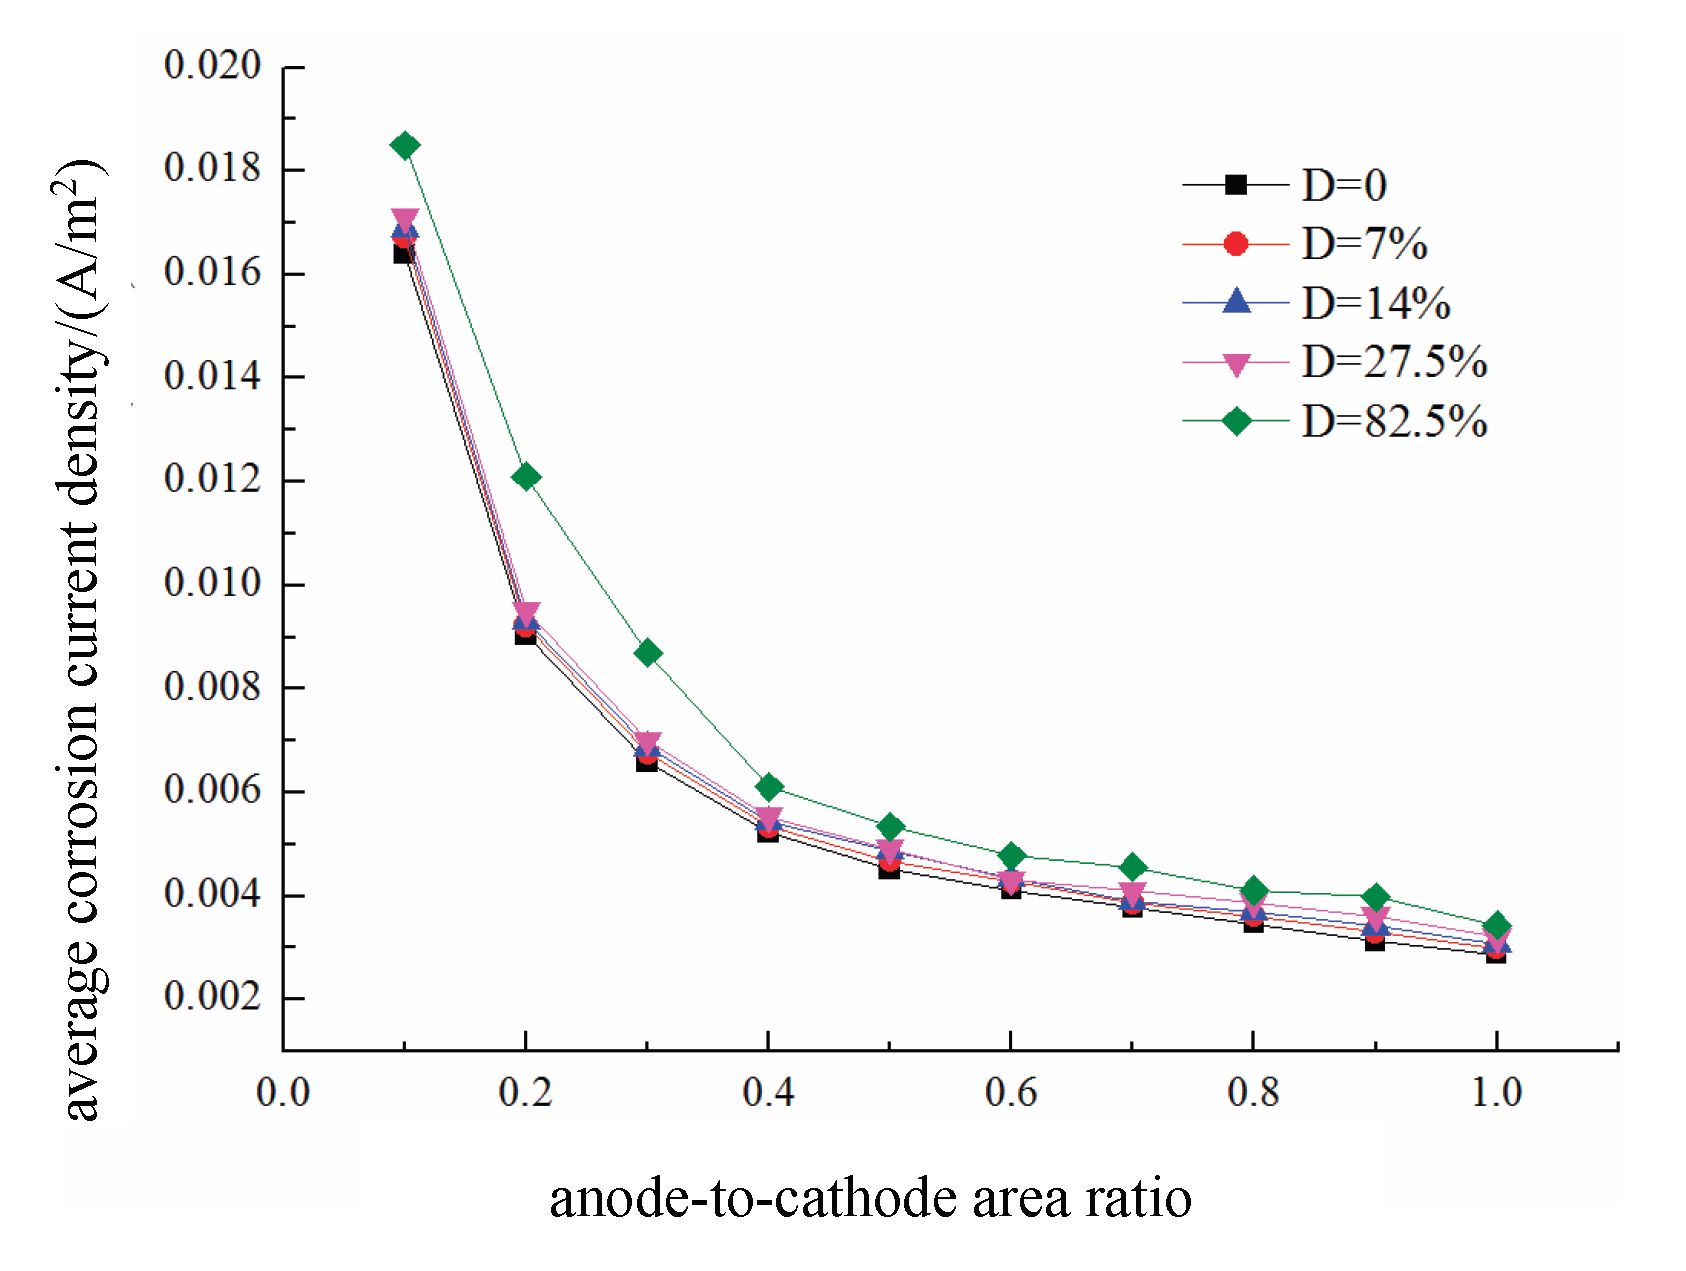

Table 1.
Overview of test beams.
| No. | Test Piece No. |
Test Process | Upper and Lower Limits of Fatigue Loading | Upper Limit Load Level |
Load Times (Ten Thousand) |
Damage Degree |
|---|---|---|---|---|---|---|
| Minimum/Maximum Force (kN) | ||||||
| 1 | A1 | static damage | - | - | - | - |
| 2 | A2 | fatigue failure | 10/70 | 75% | 25.3 | destruction |
| 3 | A3 | fatigue failure | 10/50 | 55% | 75.2 | destruction |
| 4 | A4 | fatigue failure | 10/40 | 45% | 150.6 | destruction |
| 5 | B0 | fatigue-carbonation-rebar corrosion | 10/35 | 40% | 0 | no damage |
| 6 | B1 | fatigue-carbonation-rebar corrosion | 10/35 | 40% | 50 | mild |
| 7 | B2 | fatigue-carbonation-rebar corrosion | 10/35 | 40% | 100 | moderate |
| 8 | B3 | fatigue-carbonation-rebar corrosion | 10/35 | 40% | 200 | moderate |
| 9 | B4 | fatigue-carbonation-rebar corrosion | 10/35 | 40% | 600 | heavy degree |
| 10 | C0 | fatigue-reinforcement corrosion | 10/35 | 40% | 0 | no damage |
| 11 | C1 | fatigue-reinforcement corrosion | 10/35 | 40% | 52.8 | mild |
| 12 | C2 | fatigue-reinforcement corrosion | 10/35 | 40% | 89.7 | moderate |
| 13 | C3 | Fatigue-reinforcement corrosion | 10/35 | 40% | 187.4 | moderate |
| 14 | C4 | fatigue -reinforcement corrosion | 10/35 | 40% | 560.5 | heavy degree |
Table 2.
Concrete mix proportions, mineral compositions, and chemical composition.
| Concrete Mix Proportion | ||||||
|---|---|---|---|---|---|---|
| Water | Cement | Fine Aggregate | Coarse Aggregate | Water-Cement Ratio | - | - |
| 176 | 495 | 648 | 1152 | 0.36 | - | - |
| Mineral Composition of Cement (wt%) | ||||||
| Other | - | |||||
| 55.5 | 19.1 | 6.5 | 10.1 | 5.0 | 3.8 | - |
| Chemical Composition of Cement (wt%) | ||||||
| MgO | Other | |||||
| 62.60 | 21.35 | 4.67 | 3.31 | 3.08 | 2.25 | 2.84 |
Table 3.
Environmental factors of historical natural conditions and the environmental simulation tests.
Table 3.
Environmental factors of historical natural conditions and the environmental simulation tests.
| Temperature Stage | Low-Temperature Stage | Medium-Temperature Stage | High-Temperature Stage | |||||||||
|---|---|---|---|---|---|---|---|---|---|---|---|---|
| month | 11 | 12 | 1 | 2 | 3 | 4 | 10 | 5 | 6 | 7 | 8 | 9 |
| temperature/ | 13.2 | 7.4 | 5.2 | 7.9 | 12.9 | 18.2 | 19.1 | 23 | 26.7 | 29.8 | 28.3 | 24.6 |
| relative humidity/ | 72.3 | 72.5 | 74.9 | 75.5 | 72.6 | 73.1 | 73.4 | 73.1 | 75.7 | 72.1 | 74.5 | 72.8 |
| carbon dioxide/ppm | 430 | 440 | 419 | 420 | 425 | 428 | 424 | 405 | 398 | 350 | 370 | 373 |
| average temperature/ | 9.3 | 18.6 | 26.5 | |||||||||
| accelerated thermal simulation | 15 | 28 | 40 | |||||||||
Note: The data were sourced from the China Meteorological Data Sharing Service Network: http://data.cma.cn/.
Table 4.
Relationship between the reinforcement corrosion status and corrosion current density.
| Polarization Resistance/ | Corrosion Current Density | Loss Rate/ | Erosion Rate |
|---|---|---|---|
| 2.5~0.25 | 0.1~1 | 0.1~1 | Very high |
| 2.5~25 | 0.01~0.1 | 0.01~0.1 | High |
| 25~250 | 0.001~0.01 | 0.001~0.01 | in the |
| >250 | <0.001 | <0.001 | Passivation Phase |
Table 5.
Values of the electrochemical parameters contained in the corrosion model at an ambient temperature of 298 K.
Table 5.
Values of the electrochemical parameters contained in the corrosion model at an ambient temperature of 298 K.
| Parameter | Isgor[11,12] | Kranc[13] | Glass[14] | Gulikers[15] | Kim[16] | Bo Yu[17] |
|---|---|---|---|---|---|---|
| -780 | -780 | -800 | -1200 | -690 | -780 | |
| 160 | 160 | 100 | 400 | 160 | 160 | |
|
|
1 | |||||
|
|
||||||
|
|
60 | 60 | 60 | 91 | 90.7 | 58.2 |
|
|
-160 | -160 | -120 | -176 | -176.3 | -116.3 |
(1) The potential measured against the standard calomel electrode (SCE).
Table 6.
Benchmark electrochemical parameters.
| -780 | 160 | 60 | -160 |
Disclaimer/Publisher’s Note: The statements, opinions and data contained in all publications are solely those of the individual author(s) and contributor(s) and not of MDPI and/or the editor(s). MDPI and/or the editor(s) disclaim responsibility for any injury to people or property resulting from any ideas, methods, instructions or products referred to in the content. |
© 2025 by the authors. Licensee MDPI, Basel, Switzerland. This article is an open access article distributed under the terms and conditions of the Creative Commons Attribution (CC BY) license (http://creativecommons.org/licenses/by/4.0/).
Copyright: This open access article is published under a Creative Commons CC BY 4.0 license, which permit the free download, distribution, and reuse, provided that the author and preprint are cited in any reuse.


