Preprint
Article

This version is not peer-reviewed.

The Model and Burner Development for Crude Glycerol and Used Vegetable Mixing: Cube Mushroom Steaming Oven

Submitted:

01 December 2025

Posted:

03 December 2025

You are already at the latest version

Abstract

Reduce fuel costs, improve waste utilization, and enhance energy efficiency by steaming mushroom substrate cubes using a mixed-fuel burner and furnace system that uses crude glycerol and used vegetable oil as alternative low-cost energy sources. This was the objective of this study. The experimental method measured boiler performance, exhaust-gas composition, temperature profiles, steam generation, and combustion-gas distribution inside the furnace. It was supported by analytical modeling of pressure, temperature, and combustion-gas distribution. Five fuel mixtures were prepared and tested, including 100% used vegetable oil, 100% glycerol, and 50/50, 25/75, and 10/90 blends. The tests were conducted in accordance with DIN EN 203-1. Blending used vegetable oil with glycerol improves flame stability, increases peak temperatures, and reduces the formation of incomplete combustion products compared to pure glycerol. The results also show that the mixture achieves high combustion efficiency (≈90-99%) and boiler thermal efficiency (≈72-73%). The optimal blend for stability, efficiency, and cost savings was 25/75 glycerol and vegetable oil. By cutting yearly fuel expenses by almost half, reducing steaming time by 2 hours per batch, and achieving a quicker payback period (3.26 months), the mixed-fuel system proved to be economically more advantageous than LPG, making it evidently practicable for agricultural producers. This study's conclusions suggest that, to maximize the use of renewable waste fuels and improve long-term sustainability, the following actions should be taken: further optimizing the air-fuel mixing process to improve combustion of higher-glycerol blends; scaling the system for larger mushroom farms; and expanding testing to other agricultural heating applications.

Keywords: 
;  ;  ;  ;  

1. Introduction

Many household and commercial activities produce crude glycerol and used vegetable oil, which are major waste products. This is especially true in the biodiesel manufacturing and food industries. The key to optimal management and use is a good grasp of their features, applications, and environmental impacts.
A thick, colorless, and very hydrating liquid, crude glycerol is a byproduct of the transesterification process used to make biodiesel. Its purity and possible uses are affected by the presence of contaminants, including methanol, soap, free fatty acids, and excess catalysts. Raw glycerol must be refined before it can be used in many sectors due to its chemical composition. Inadequate disposal and management of crude glycerol pose environmental risks. One way to reduce trash and make the world a better place is to recycle and repurpose materials. Discarded vegetable oil, sometimes called waste cooking oil, is produced by commercial, industrial, and residential kitchens every day. The presence of food remnants, free fatty acids, and other contaminants makes its disposal a challenge. Avoiding pollution, particularly that which contaminates water and degrades soil, requires careful collection and treatment. To prevent pollution and unlawful disposal, it is important to establish procedures for collecting spent vegetable oil and properly storing it. In addition to reducing landfill waste, recycling used oil helps preserve valuable resources and lessens our impact on the environment by recovering usable energy.
A wide variety of companies can benefit from both crude glycerol and used vegetable oil, two significant commodities. Their efficient use and management help reduce waste, protect the environment, and promote sustainable development. In line with a circular economy strategy, advances in processing technologies are increasing the possibility of turning these waste products into valuable commodities. Regarding glycerol and used vegetable oil, several studies exist.
Reed et al. [1] created and evaluated M-Diesel, a substitute diesel fuel. Produced from used vegetable oils, it solves the problems of the high cost and thick consistency of traditional vegetable oil fuels. M-Diesel, created from recycled vegetable cooking oils, is an abundant resource; the United States alone produces 350 million gallons per year. Waste oil and sodium hydroxide in methanol are mixed during the transesterification process to produce Fuel. The process of cleaving fat molecules and removing their glycerin yields fatty acid esters. Vegetable oil undergoes a process called transesterification that makes it as thin as regular diesel fuel. Raw vegetable oils may form carbon deposits and are 20 times thicker than diesel; this eliminates a major problem of these fuels. M-Diesel has a 95% greater heat of combustion than conventional diesel, measured in cubic centimeters. The cetane number is also high, ranging from 50 to 80, which is significantly higher than diesel's typical value of 42. Çetinkaya et al. [2] used base-catalyzed transesterification to enhance biodiesel synthesis from cooking oil leftovers received from restaurants. Conditions for reactions and refinement were investigated. The research found the best way to make biodiesel from used cooking oil. Biodiesel's production costs are reduced and its market position is improved when it uses inexpensive feedstock like this oil. How the amount of glycerin impacts the refinement quality of biodiesel was also investigated in the study. In order to selectively oxidize glycerol, Kaminski et al. [3] used catalysts that were composed of copper and gold. The development, characterization, and use of mesoporous cerium-zirconium oxide as a substrate for copper and gold species were accomplished. When it came to glycerol oxidation activity and selectivity toward glyceric acid, bimetallic copper-gold catalysts performed better than monometallic gold catalysts. Catalysts composed of two metals exhibit remarkable stability. When used in alkaline glycerol oxidation, they improved the selectivity for glyceric acid. Transesterification of biodiesel, glycerol, and methanol was performed by Rubianto et al. [4] to produce a sustainable liquid fuel. An external combustion engine was used to test biodiesel blends with glycerol and methanol in ratios ranging from 1:1:1 to 1:1:4 (v/v). An important discovery was that combustion was easier to achieve by adding more methanol to the mixture. A 1:1:4 volume ratio of biodiesel, glycerol, and methanol was the best boiler burner mix.
The performance and emissions of an unmodified diesel engine running on WCOB were examined by Samanta et al. [5]. Biodiesel is a viable alternative to petroleum diesel to help mitigate rapid climate change and global warming driven by diesel engine emissions. Transesterification efficiently produces biodiesel from waste cooking oil. This technique can be accelerated with a 55 °C alkali catalyst. The investigation focused on an unmodified stationary diesel engine running on a B10 blend of 10% WCOB and petroleum diesel (B0). At 1500 rpm, experiments were run with 0%, 25%, 50%, and 100% load. The engine performed poorly at mid- to high-load conditions on B10 WCOB. Jensani et al. [6] observed that co-digestion of food waste and crude glycerol works in experiments. This co-digestion method may boost biogas production. Treatment of food waste and crude glycerol is done in addition to biogas production. The study concluded that anaerobic co-digestion of food waste and crude glycerol increases biogas production and solves waste management issues. Elgharbawy et al. [7] examined the challenges and solutions for producing biodiesel at a lower cost, particularly using waste feedstocks. Relying on edible feedstocks increases competition for food supplies and drives up food prices. Using inexpensive waste feedstocks, such as wasted cooking oil, lowers biodiesel production costs. Waste feedstocks can include large quantities of free fatty acids. High FFA levels react with base catalysts during transesterification, generating soap and lowering biodiesel quality. The study reveals that glycerolysis can pretreat high-FFA waste feedstocks, enabling the use of cheaper raw materials and the production of biodiesel at a lower cost by overcoming the challenges posed by high FFA concentrations. Kurdi et al. [8] demonstrated and assessed the transesterification of waste cooking oil to produce biodiesel. Transesterification turned leftover cooking oil into biodiesel. Methanol reactant and HCl catalyst were utilized. The oil was transesterified at 90°C for 9 hours using 1:4 methanol-to-oil and 1% HCl by weight. Two hot-water (70°C) washes removed alcohol, catalysts, soap, glycerin, and fatty acid methyl esters from biodiesel.
In conclusion, a transesterification process was employed to manufacture biodiesel from waste cooking oil and to evaluate its physical and chemical properties, thereby demonstrating its energy potential. Lima et al. [9] described how chemical and biological catalysts convert residual glycerol. The catalytic approach used to convert glycerol into industrial commodities must be carefully evaluated and selected. In conclusion, residual glycerol can be valorized through chemical and biochemical routes to produce a range of high-value products for various industries, with the right catalysts optimizing these conversion processes. Kumar et al. [10] found that intermittent feeding of municipal sludge (30 g/L of solids) and pure glycerol increased biomass and lipid content. It had 54.99 g/L biomass and 25.35 g/L lipids after 96 hours. This approach significantly reduced fermentation foaming and the need for anti-foam. Municipal sewage helps produce biodiesels and microbial lipids. Intermittent sludge feeding created energy-positive biodiesel. An energy balance analysis for one tonne of biodiesel produced with intermittent sludge feeding (30 g/L SS) showed a positive net energy gain of 22.65 GJ/tonne FAMEs and an energy ratio of 1.41. The technique's high energy ratio and positive net energy gain indicate economic viability. The overall energy input for biodiesel synthesis using purified glycerol was higher (72.7 GJ/tonne FAMEs) than for sludge (54.75 GJ/tonne FAMEs), demonstrating the benefits of sludge. Chilakamarry et al. [11] considered it a vital fuel for the future due to its carbon-reducing properties. However, additional production has produced waste glycerol byproducts. New, safe uses for crude glycerol are needed to address the waste problem. Glycerol can be utilized in various sectors to produce chemical intermediates and other products due to its versatility. This requires innovative, safe solutions for the use of crude glycerol. Glycerol's versatility enables it to be converted into various value-added products across multiple industries, with bioconversion serving as a viable, environmentally benign alternative.
Transesterification of wasted cooking oil produced glycerol as a byproduct of methyl ester synthesis by Syahputra et al. [12]. To compare the extracted glycerol from waste cooking oil with commercial glycerol, IR and GC-MS spectroscopy were used. Commercial and waste cooking oil glycerol have identical 1,2,3-propanetriol groups. The retention times for spent cooking oil and commercial glycerol were 9.6-10.3 and 9.6-10.13 minutes, respectively. The IR spectra of glycerol from waste cooking oil showed OH, CH, C=O, and C-O functional groups, similar to those of commercial glycerin. Rizky et al. [13] purified palm oil-based biodiesel byproduct, glycerol, using household vinegar. Glycerol concentration peaked at 83.47% after purification. Purified glycerol has a water content of 1.83% at its lowest. Purified glycerol has an alkaline pH, with the lowest at 12.00. Refined glycerol was blackish-brown. Overall, the study successfully purified crude glycerol from biodiesel byproducts using home vinegar, producing a product with high glycerol concentration, low water content, an alkaline pH, and a blackish-brown color. Moklis et al. [14] examined current and future trends in upgrading the biodiesel byproduct, crude glycerol, into higher-value compounds. We aim to make biodiesel production more profitable and mitigate the environmental impact of crude glycerol disposal. Crude glycerol often contains impurities that limit its industrial use, necessitating expensive processing. Not suited for food, medicine, or cosmetics due to its lesser purity (60-80%) than refined glycerol. Low heating value, excessive oxygen concentration, and poor combustion performance are further drawbacks. An excess of crude glycerol from biodiesel production could pose social and environmental issues if not properly managed. Agnesty et al. [15] found that used cooking oil (UCO) met SNI 01-3741-2002 quality standards for smell, taste, visual color, water content, free fatty acids, acid number, and peroxide value. This violation means the UCO was toxic and unsafe for reuse or consumption. The maximum biodiesel yield from UCO was 81.33%, and the minimum was 61.7%. The FAME level was 98.18%, and the glycerol content was 0.72%. The most abundant component was methyl palmitate (47.57%), whereas the least abundant was methyl myristate (1.502%). Kumar et al. [16] successfully demonstrated a waste-oil-burning system, yielding several interesting discoveries. Waste oil needed an ignition source to burn for 3-5 minutes, according to initial tests. Kerosene was used to ignite waste oil at 300°C. The insufficient burner area and tall stove prevented the flame from reaching the top layer; therefore, the original attempt failed. After learning from this, a more miniature stove with ample burner space was made, yielding a positive result. An iterative design process helped the team develop a waste-oil burner. Samadov et al. [17] studied vegetable oil processing, which improves crude oil quality, appearance, stability, and safety by removing FFAs, phospholipids, waxes, colors, and other contaminants. Unfortunately, many refining processes remove tocopherols and phytosterols, which are essential for making oil healthy and stable. Armylisas et al. [18] observed that palm-based crude glycerol (CG) and GP from biodiesel and oleochemical refineries had different colors and characteristics. However, all samples maintained a high glycerol content of up to 87.3%. The presence of these pollutants changed physical appearance, pH, viscosity, density, elemental and metal composition, and energy content. Soni et al. [19] created groundnut shell pellets with 20 wt%, 40 wt%, and 60 wt% crude glycerol. The goal was to employ the biodiesel byproduct, crude glycerol, and to improve biomass handling and energy density. Adding glycerol to the pellets increased the volatile matter concentration from 72.45% to 85.18%. Batch pyrolysis of glycerol-containing pellets (0.5 kg) boosted bio-oil yield from 30 to 41 wt% as the glycerol content increased from 0 to 60 wt%. On a batch basis, glycerol concentration increased pyro-gas production from 28 to 32 wt%.
Glycerol production has increased due to the demand for biodiesel, according to Dhabhai et al. [20]. In crude glycerol, free fatty acids, inorganic salts, water, and methanol are impurities. These impurities lower the economic value of glycerol, making it unsuitable for direct use. To make biodiesel profitable, this low-value crude glycerol must be refined and transformed into value-added chemicals. Pamanes et al. [21] demonstrated good ruminal fermentation, including an adaptation phase with no significant variations between treatments. All treatments increased gas production relative to the control, which is good. The study indicated that 20 and 40 g/kg maize oil lowered the methane (CH4) to carbon dioxide (CO2) ratio by 7% and 9.5%, respectively. The maize oil treatment produced the least CH4, suggesting it could be a feeding method to reduce greenhouse gas emissions without lowering gas production. Wu et al. [22] suggested using FAME and glycerol to enhance the economic and environmental competitiveness of biodiesel enterprises.
Make value-added epoxidized acyl glycerides. A 200°C temperature and a 1:1 FAME-to-glycerol molar ratio were found to be optimum for this reaction. Approximately 50% monoacyl, 40% diacyl, and 10% triacyl acyl glycerides were produced. The monoacylglyceride concentration strongly affected epoxide selectivity during epoxidation. A therapy that maintained monoacyl glycerides below 5% improved this phase. Borowka et al. [23] examined the purification of biodiesel glycerin using ion-exchange resins. Biodiesel production from vegetable raw materials yields glycerin with trace amounts of sulfur, chlorine, and nitrogen. Despite low chlorine levels, glycerine from vegetable oils, UCOs, and animal fats is contaminated with sulfur and nitrogen compounds. Glycerin from UCOs is rich in nitrogen. Glycerine cannot pass through the ionite bed because its MONG (organic compounds other than glycerol) impurities are released in a separate phase. Silva et al. [24] refined crude glycerol to greater than 98% purity by weight. Excellent purity made it ideal for etherification. Purified and commercial glycerol were employed in solvent-free batch reactor etherification processes with ethanol, isopropanol, and 3-methyl-1-butanol, using Amberlyst 15 as a catalyst. Glycerol conversion was 97% by weight with 80% monoether selectivity when ethanol was used. Up to 95% glycerol conversion with isopropanol yielded 76% monoether and 22% diether. Rahman et al. [25] found that converting the biodiesel byproduct, crude glycerol (CG), into bioethanol could provide a sustainable energy source. Managing the growth of glycerol production while contributing to renewable fuels is challenging. Crude glycerol, abundant in biodiesel production, can be used to synthesize bioethanol. This turns trash into a resource. Many crucial processes must be optimized to convert glycerol to bioethanol. Increase fermentation efficiency to maximize glycerol bioethanol yield. Genetic engineering advances are needed to generate more efficient and prolific converting microorganisms. To ensure the purity of bioethanol, effective filtration is necessary.
Perez et al. [26] investigated biomass-derived carbon catalysts for the esterification of crude glycerol and acetic acid. The goal was monoacetyl, diacetyl, and triacetyl glycerol. Peanut shells (PC) were activated with KOH (APC) and functionalized with H2SO4 to make PC-F and APC-F catalysts. Functionalized catalysts were tested in crude glycerol. This crude glycerol was synthesized from biodiesel and had an acidic pH, containing water, methanol, Na2SO4, and non-glycerol organic debris. APC-F outperformed PC-F in catalyst testing. The perfect combination of surface acidity and textural qualities increased performance. Sidhu et al. [27] examined water and glycerin emulsification techniques for biodiesel combustion emissions, focusing on their performance and valorization potential. Both water and glycerin emulsion fuels significantly reduced smoke emissions. Compared to pure biodiesel, emulsions with 10% glycerin or water reduced smoke emissions by almost 50%. The study found that both emulsification methods significantly lowered biodiesel NOx emissions. More than 15% less NOx was released with 10% glycerin and water emulsions. This addresses a common issue: biodiesel use increases NOx. Bansod et al. [28] conducted a cradle-to-gate Life Cycle Assessment (LCA) to assess the environmental impacts of three crude glycerol purification methods and identify the drivers and mitigation measures. The LCA compared three methods for purifying crude glycerol: PMP, VDP, and IEP. A 1000-kg pure glycerol functional unit was assessed. The processes exhibited carbon footprints of 3,466.82 kg CO2 eq. FU−1, 1745.72 kg, and 2239.71 kg, respectively. Waste from crude glycerol impurities significantly increased the environmental impact of all three processes, the study found. The carbon footprint and other environmental implications were also affected by the PMP and IEP physicochemical treatment raw materials. Roschat et al. [29] demonstrated that activated carbon derived from Krabok (Irvingia malayana) seed shells enhances biodiesel production by utilizing crude glycerol. Dry chemical activation with NaOH and an innovative biomass incinerator created activated carbon (KC/AC-two-step) from Krabok seed shells. The KC/AC two-step showed strong physicochemical adsorption, as evidenced by a high surface area of 758.72 m²/g and an iodine number of 611.10 mg. These values meet the activated carbon industrial product standard issued by Thailand's Ministry of Industry, TIS 900-2004. Methylene blue adsorption by activated carbon was 99.35% superior. KC/AC two-step activated carbon improved the crude glycerol purity to 73.61%. Commercial activated carbon (C/AC) was 81.19% pure, whereas Krabok-derived activated carbon was cleaner. Glycerol's Zn, Cu, Fe, Pb, Cd, and Na levels dropped significantly after purification. Agrawal et al. [30] examined the sustainability of solketal synthesis from glycerol amid increased biodiesel output and alternative fuel demand. The biodiesel industry produces a significant amount of glycerol that pharmaceutical and cosmetic companies do not use. The project explores environmentally friendly methods for utilizing surplus glycerol and creating valuable products. Solketal, a gasoline additive, is effectively made from glycerol. Its production from glycerol addresses traditional fuel problems and promotes the use of alternative fuels. Batch and continuous solketal synthesis are employed, with the latter showing the most promise. Various homogeneous and heterogeneous catalysts are used to increase solketal yield in reactors for glycerol and dimethyl ketone reactions. Ruzibayev et al. [31] improved the purification of crude glycerol to produce high-quality glycerol without distillation. This was done with cations. A 70:30 blend of activated carbon and clay yielded the best results across both glycerol and ash levels. Pilicita et al. [32] evaluated spent cooking oil as a sustainable biodiesel alternative, emphasizing its potential to reduce fossil fuel usage and mitigate environmental challenges while exploring methods to enhance its properties and improve engine performance. This article discusses biodiesel manufacturing using residual cooking oil, which can reduce fossil fuel consumption and environmental impact. Used cooking oil is abundant and inexpensive, making it a viable solution for circular economy waste management. Biodiesel generated from waste cooking oil through transesterification exhibits biodegradability and reduced greenhouse gas emissions; however, it also has high viscosity and nitrogen oxide emissions. Haymoba et al. [33] created vegetable oil blends with a balanced fatty acid profile, targeting a PUFA-to-PUFA ratio of 5:1 to 10:1. The researchers examined various vegetable oil quality indices. They examined PUFA fractions of these oils. The oil combination was formulated using mathematical modeling. The oils reviewed were compatible with respect to organoleptic parameters (color, clarity, taste, and smell), suggesting they may be mixed.
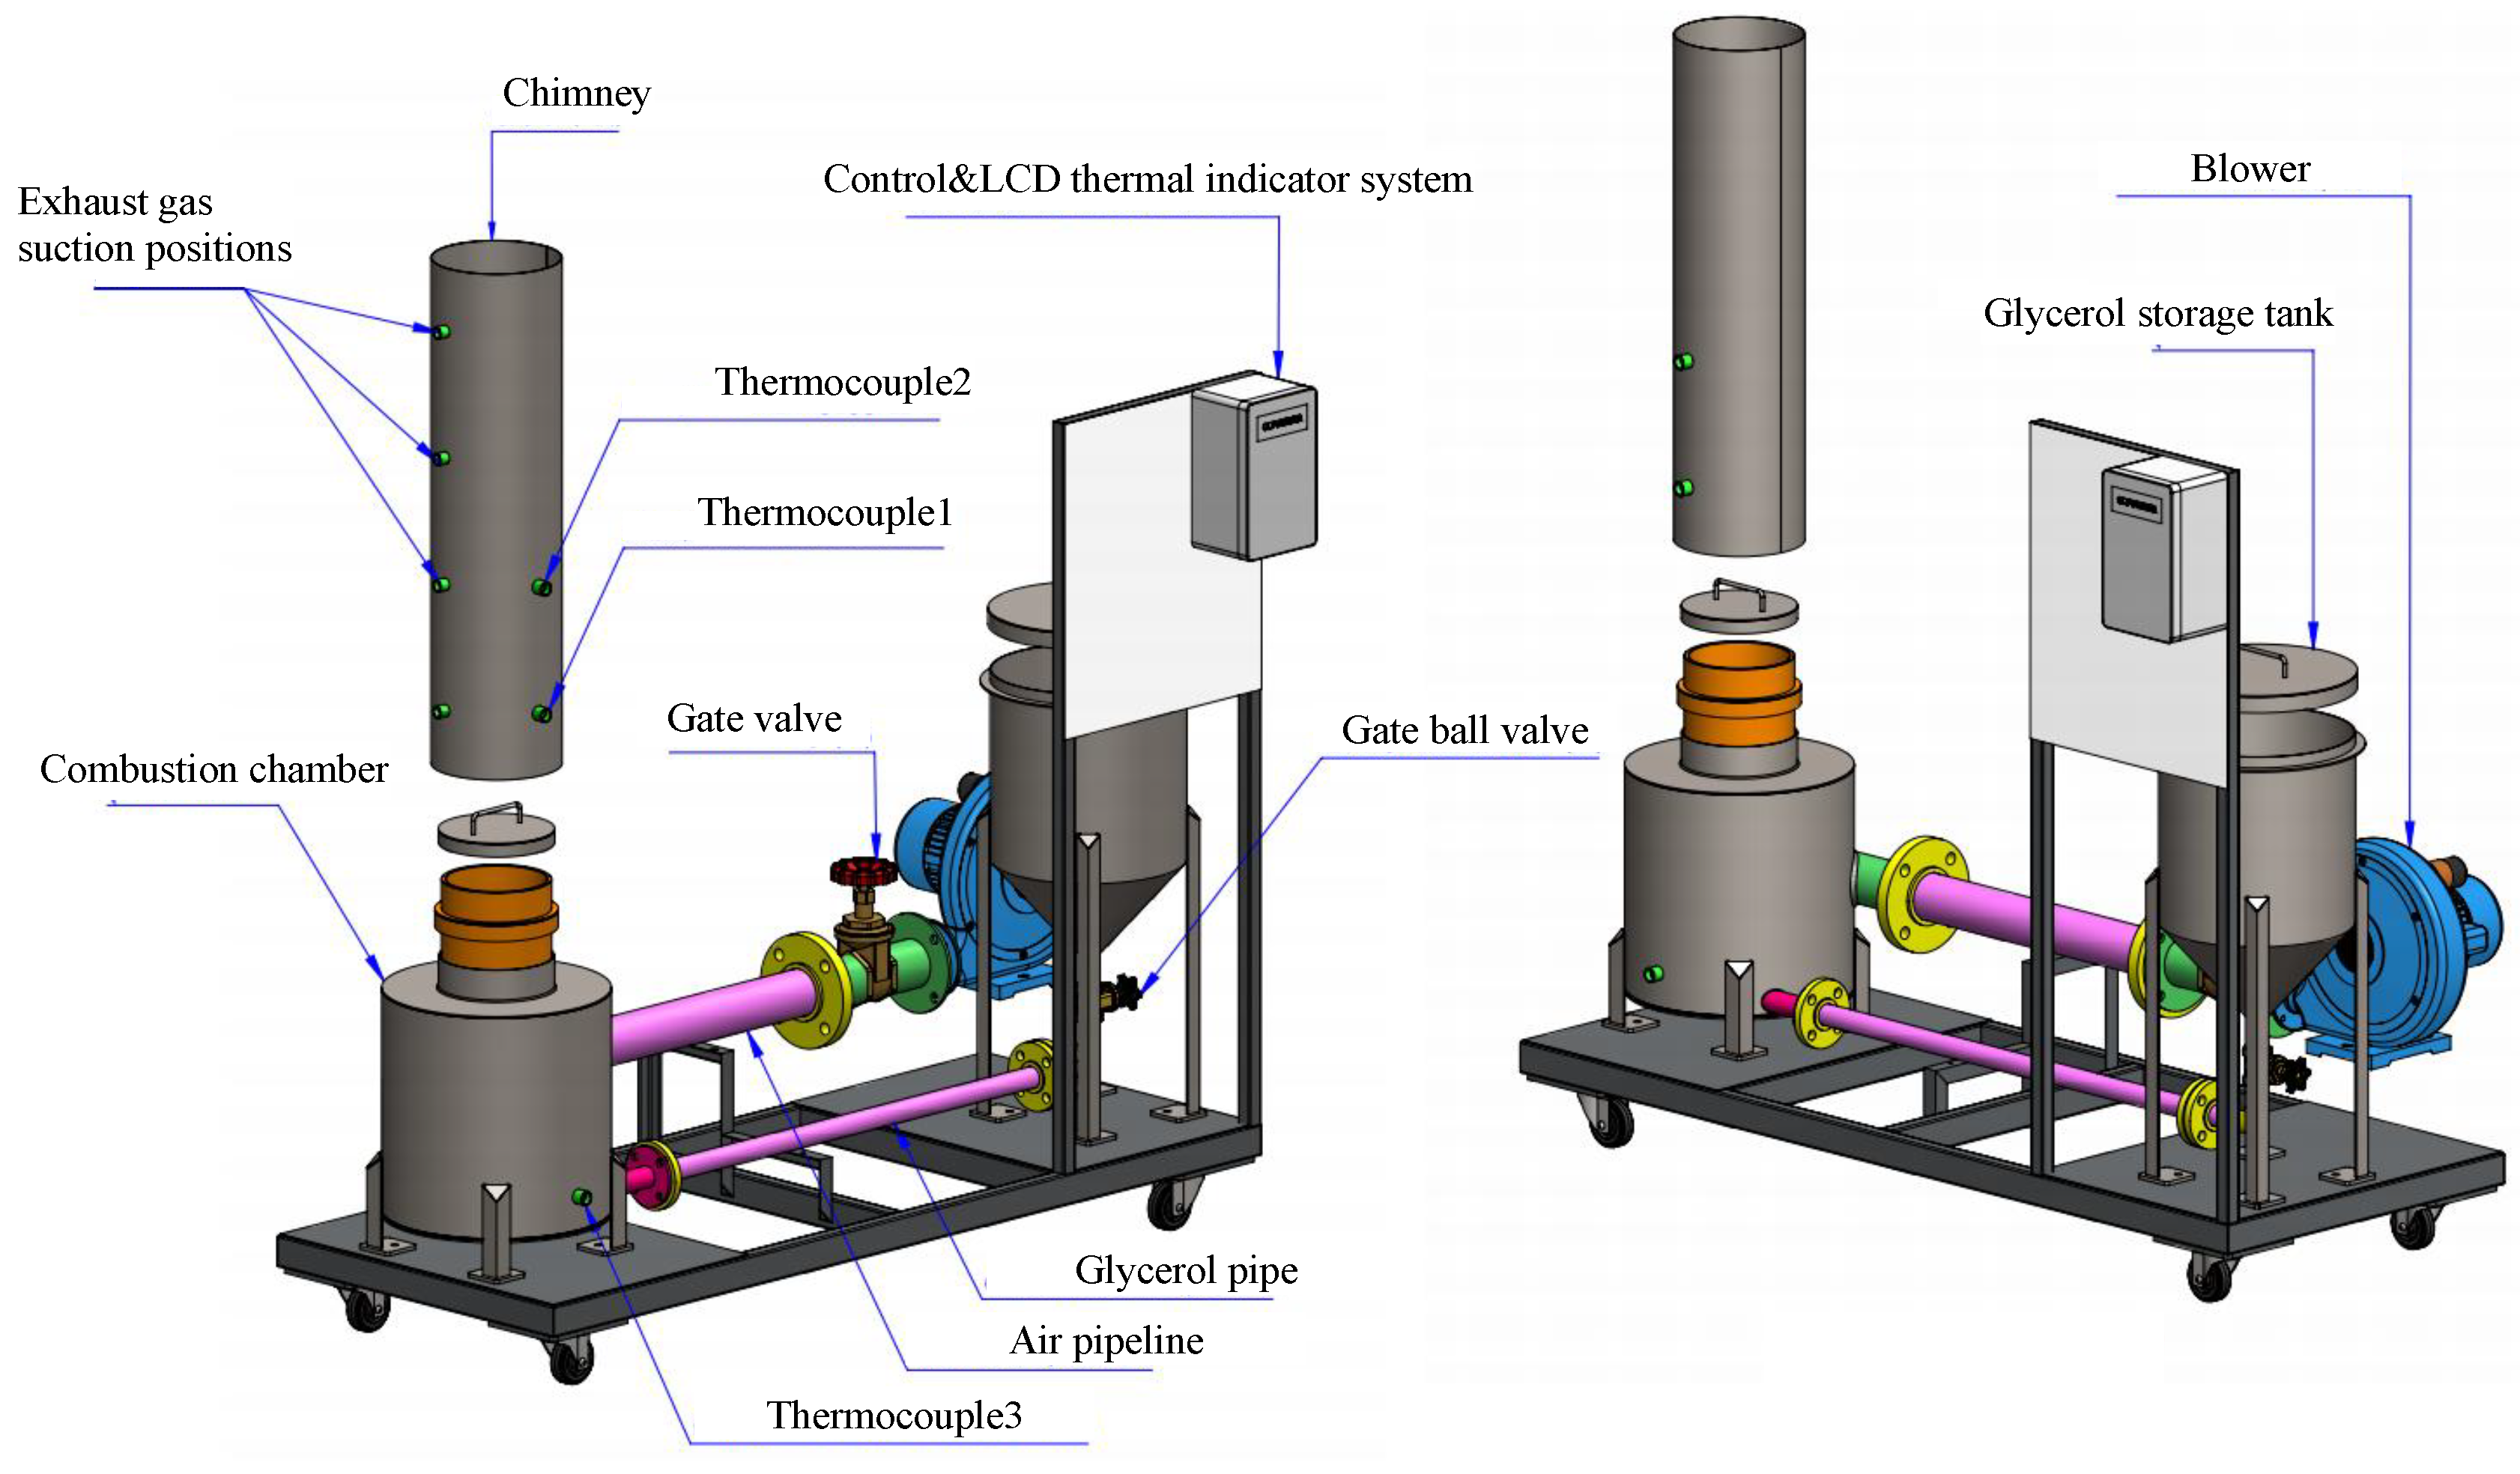
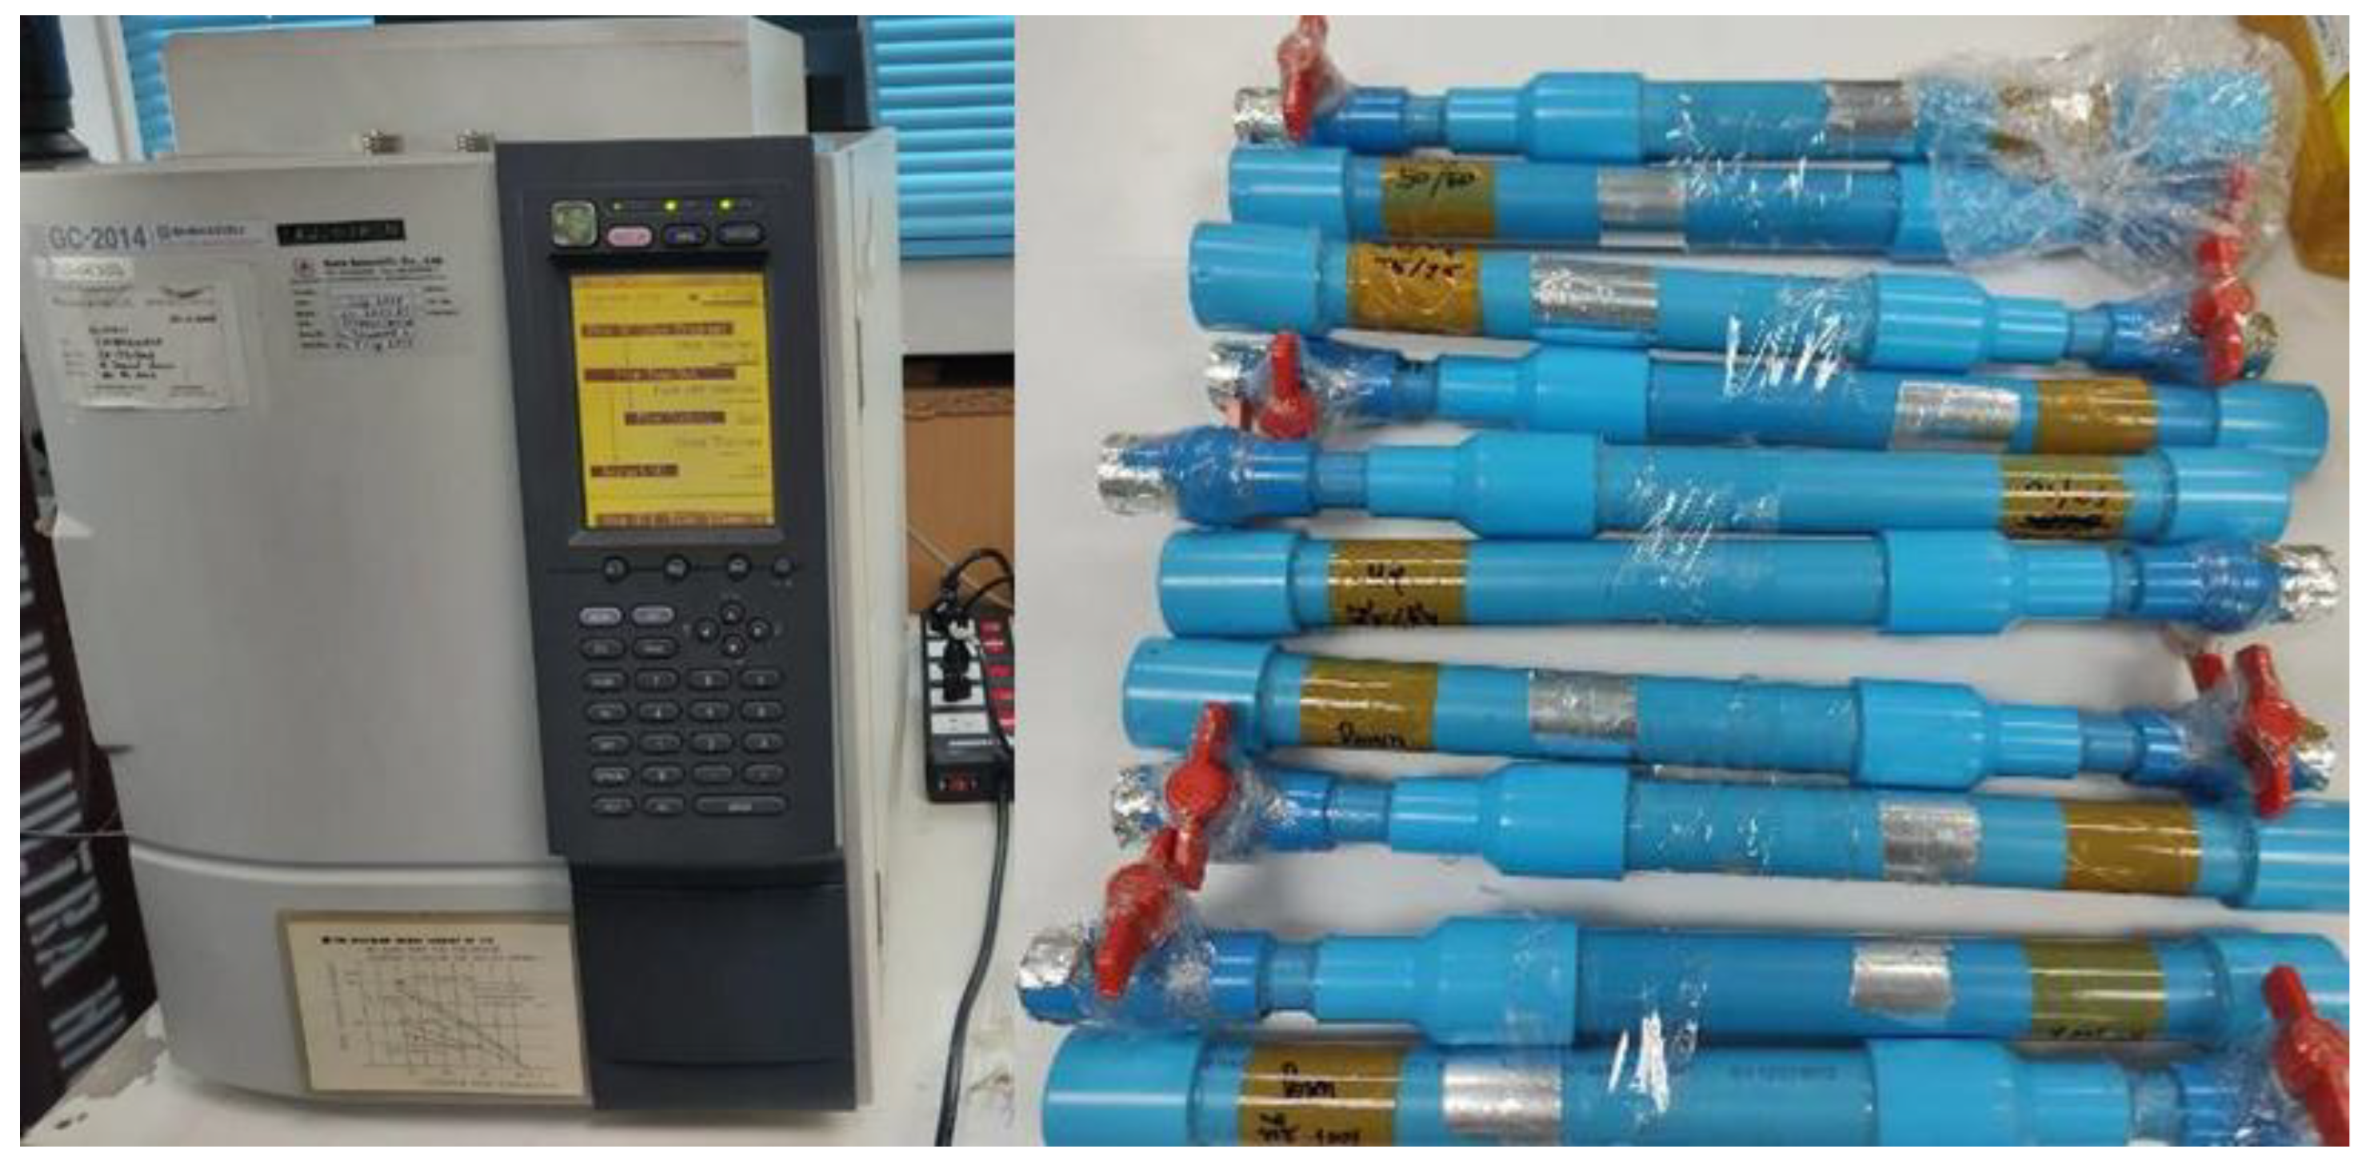
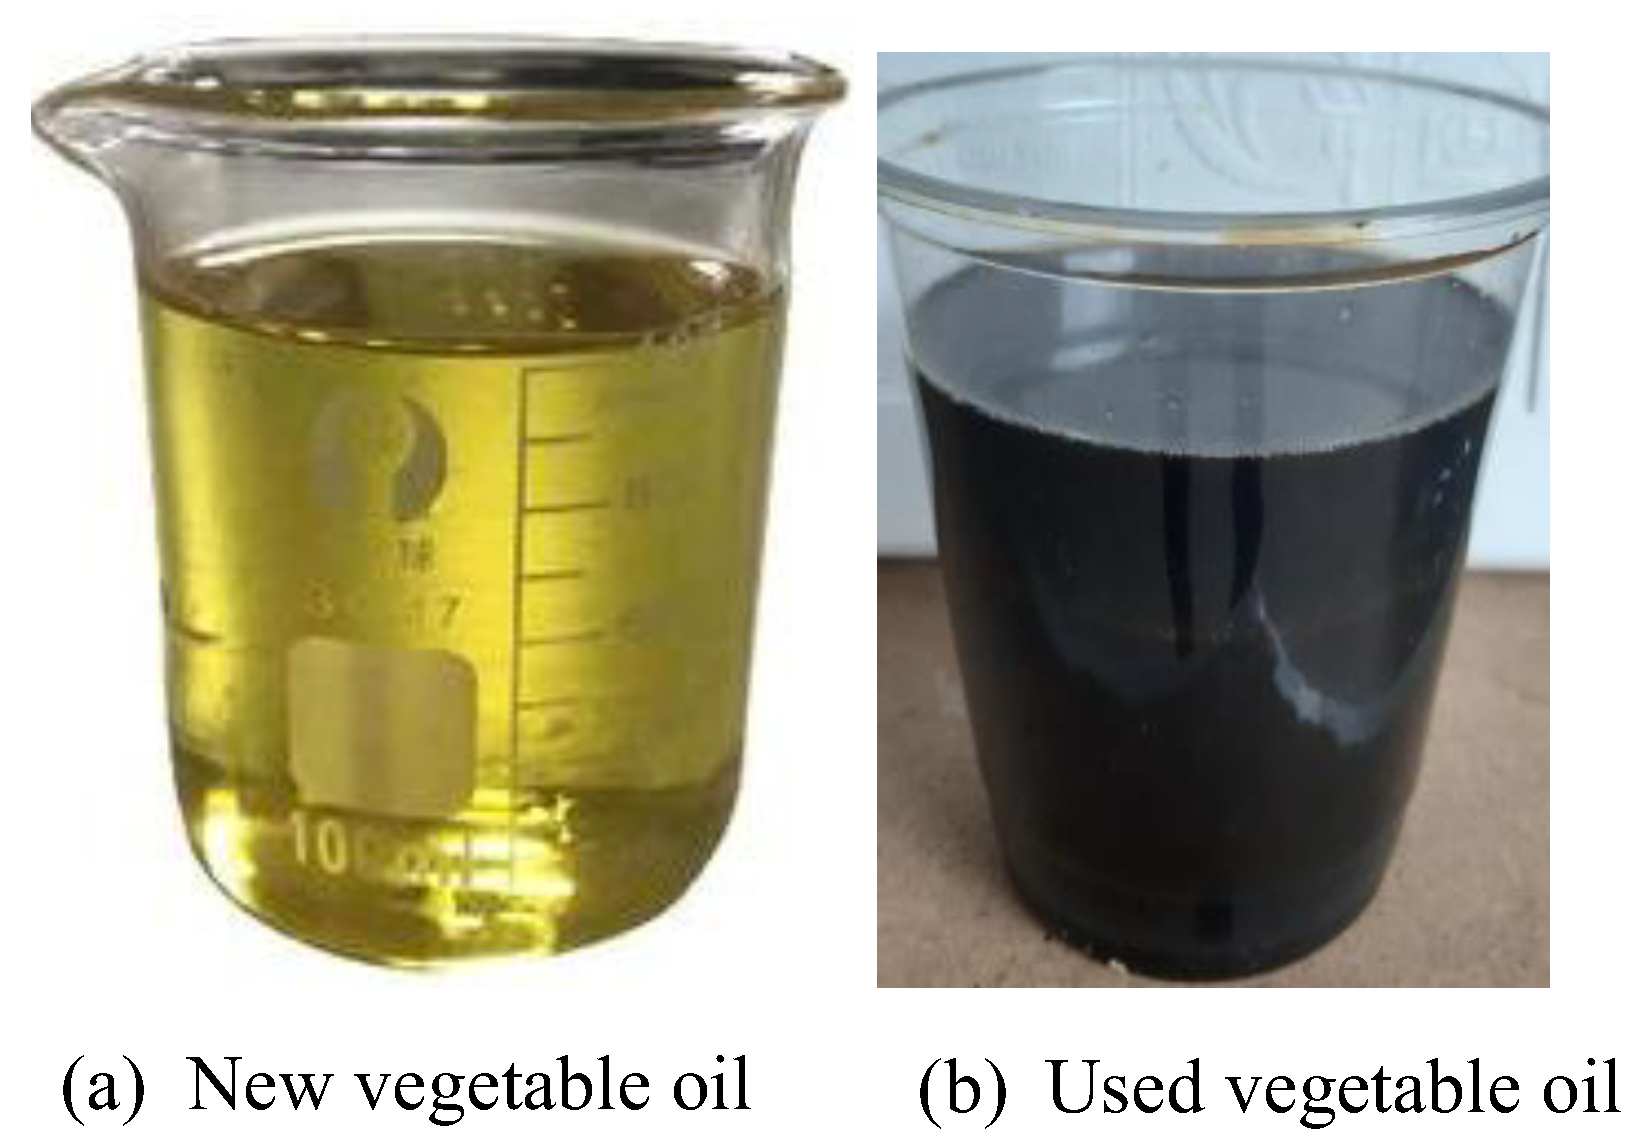
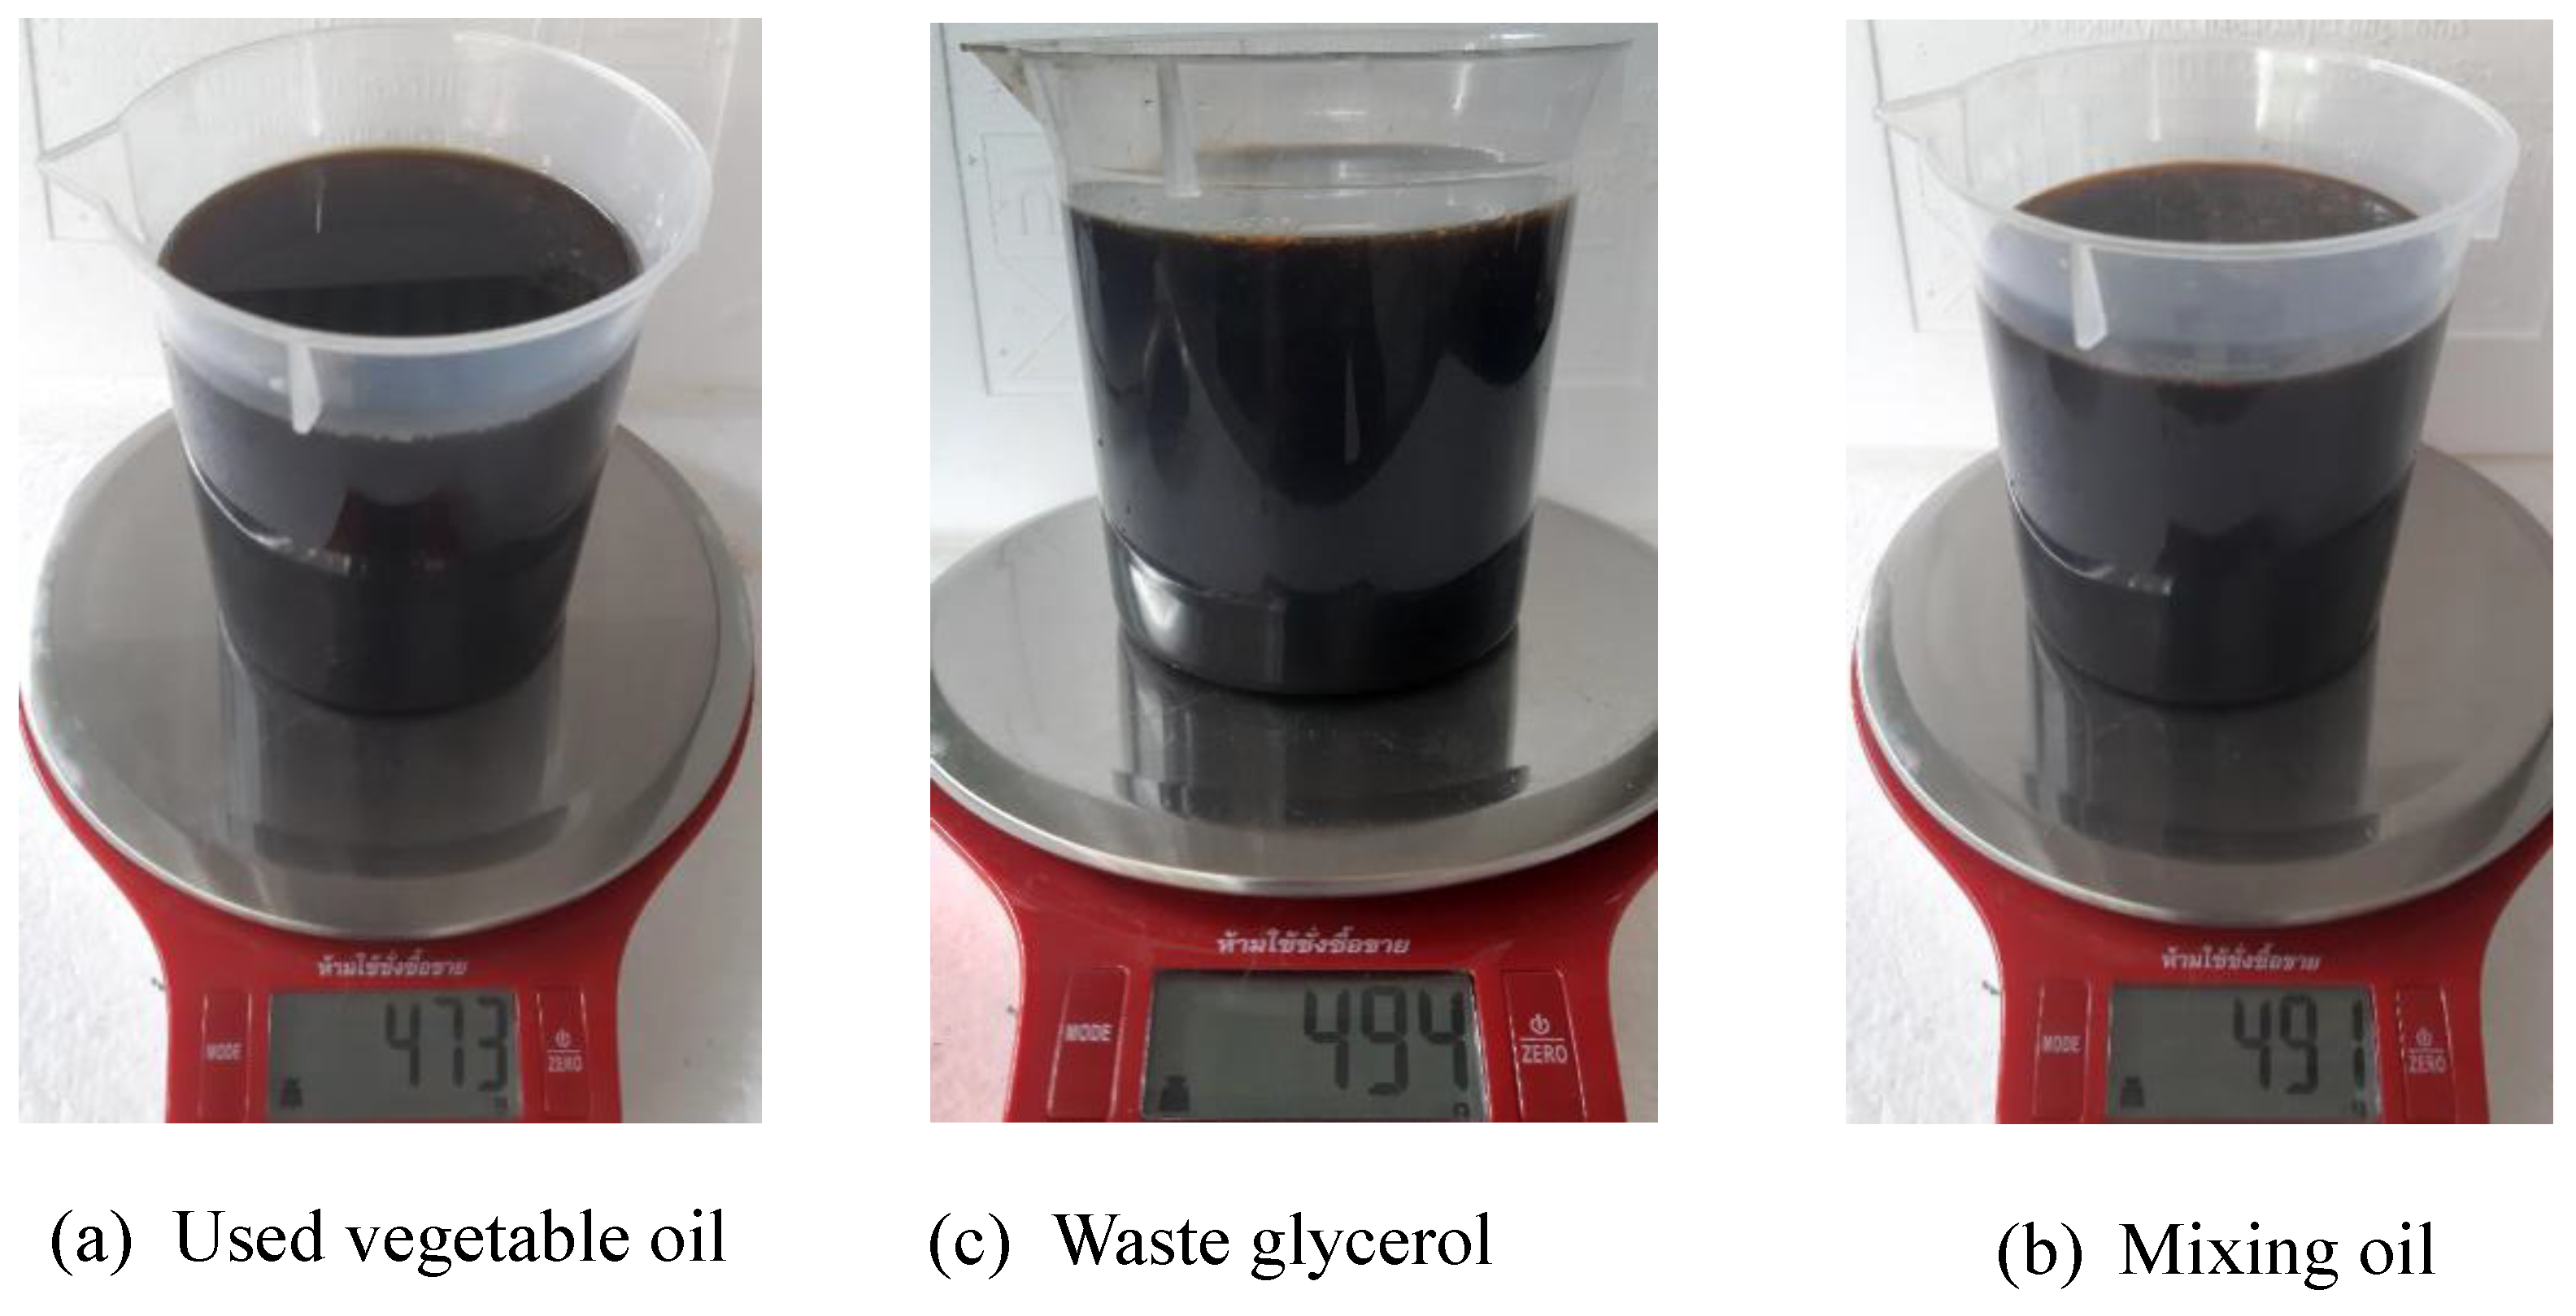
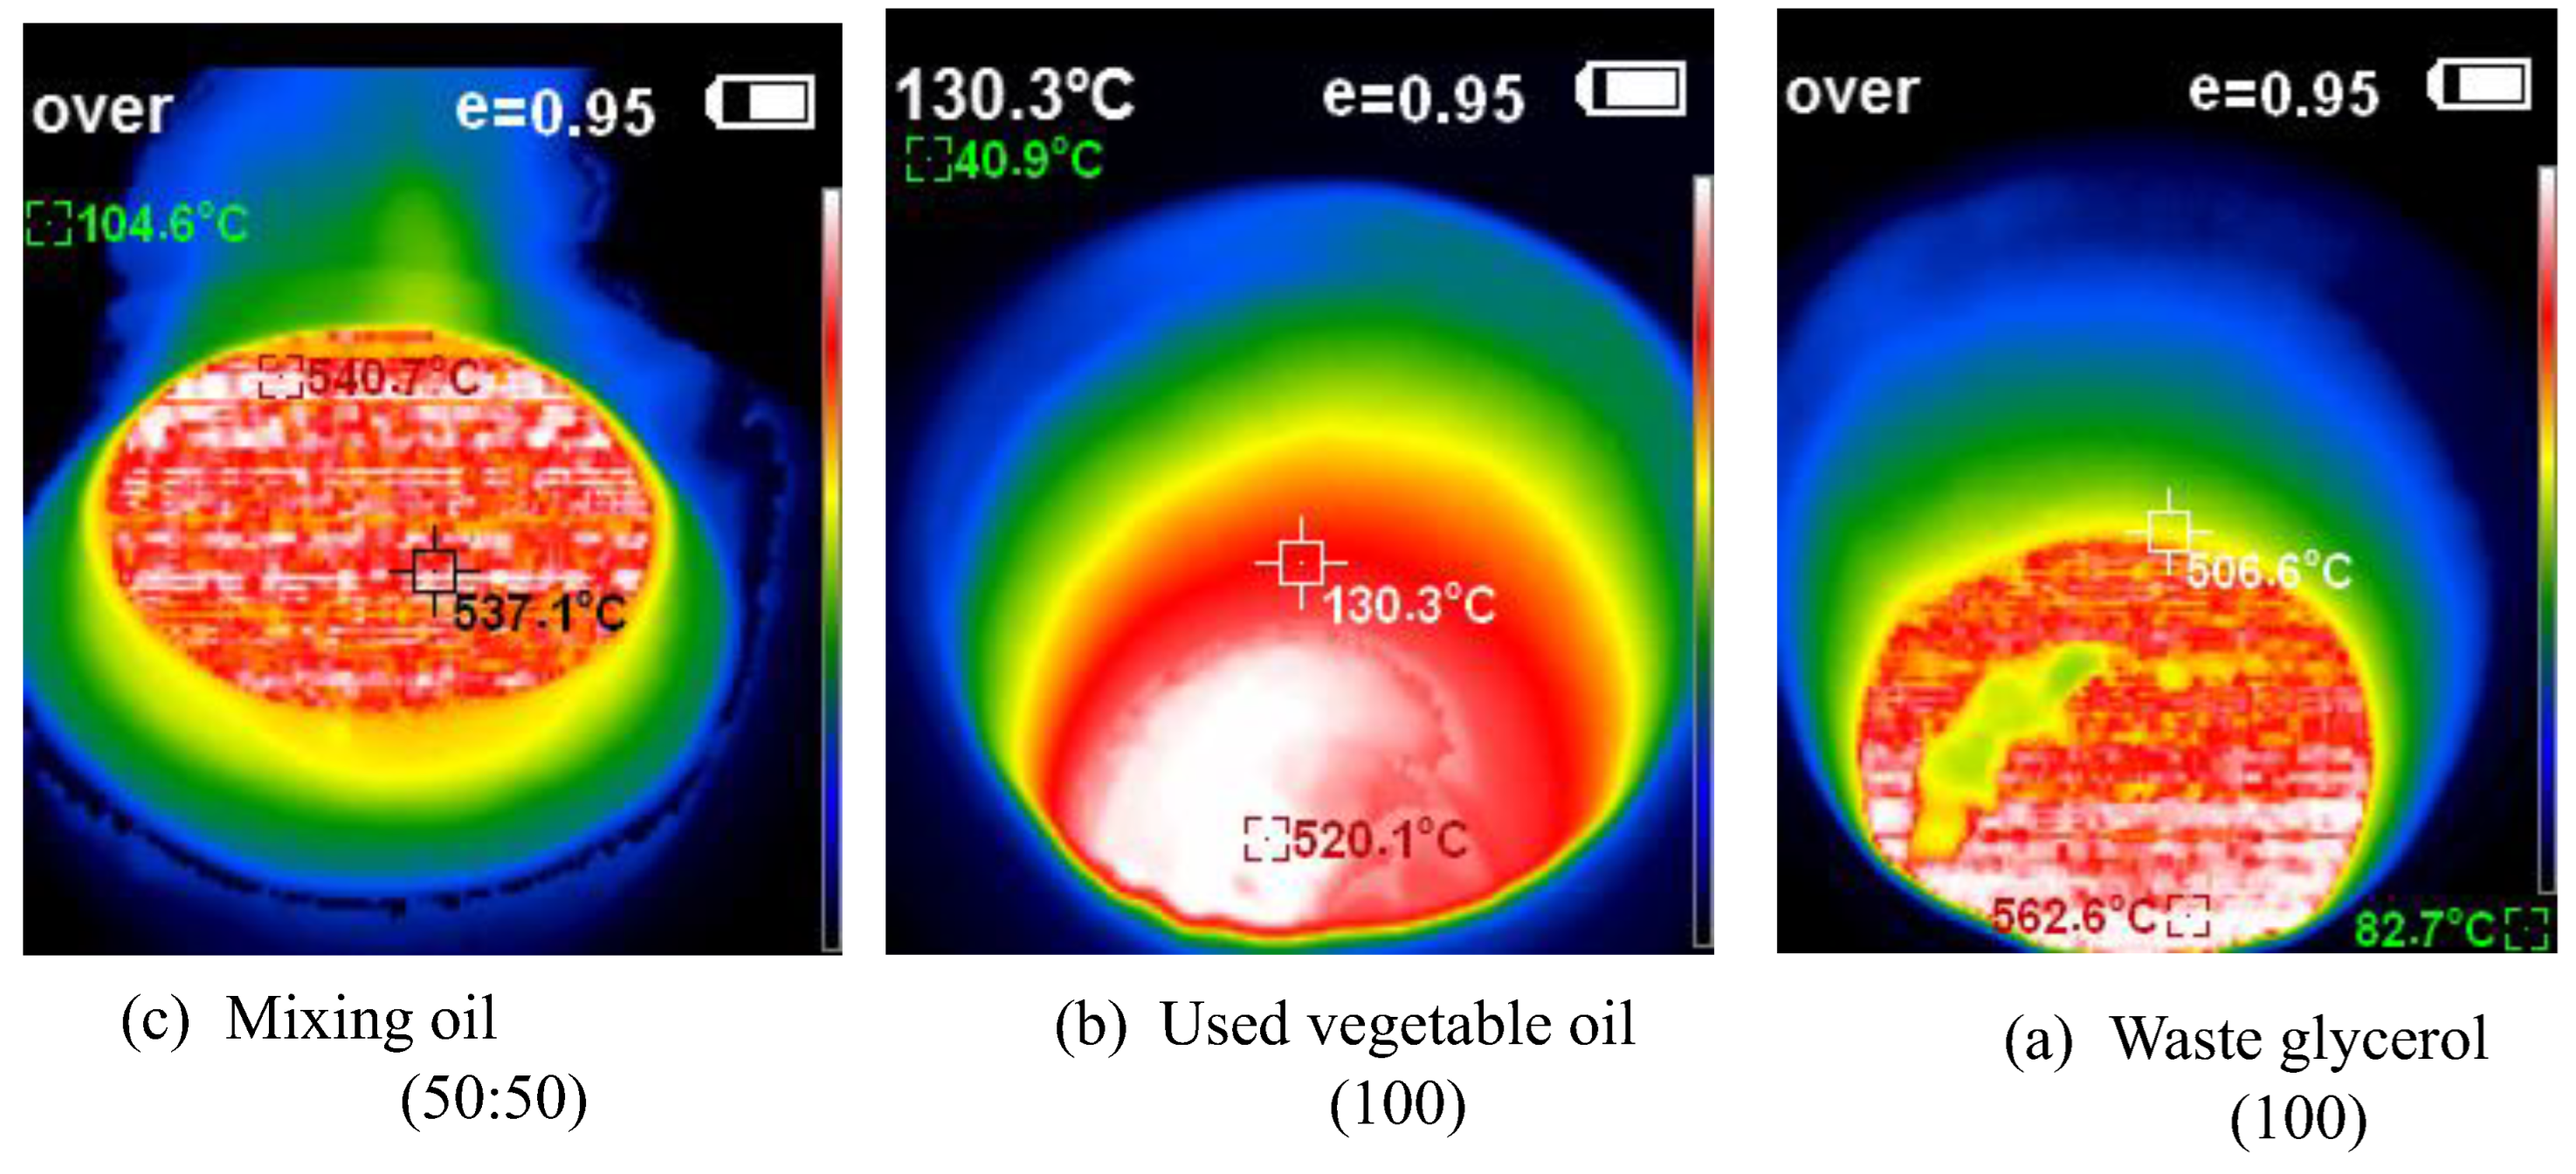
This study developed and tested a mixed-fuel burner and furnace system that steams mushroom substrate cubes using crude glycerol and vegetable oil to reduce fuel costs, waste, and energy efficiency. Preparing five fuel mixtures (100% glycerol, 100% used vegetable oil, and 50/50, 25/75, 10/90 blends), testing combustion and thermal efficiency using DIN EN 203-1 standards, and measuring temperature profiles, exhaust-gas composition, steam generation, and boiler performance with analytical modeling of furnace pressure, temperature, and combustion-gas distribution were the experimental methods.

2. Experimental Apparatus and Procedure

2.1. Experimental System

Following the layout and operation of each main component, the schematic design depicts the entire experimental furnace system (Figure 1). Fuel from the glycerol storage tank is delivered to the combustion chamber via the glycerol pipe, and air for atomization and combustion is supplied to the chamber by the blower via the air pipeline. Burning fuel releases hot gases into the air from the combustion chamber, which is located underneath the chimney. While the unit is running, the flue gas composition may be sampled at predefined exhaust gas suction points in the chimney. It is possible to monitor temperatures within the chimney, near the exhaust region, and along the fuel-air section using three thermocouples: thermocouple 1, thermocouple 2, and thermocouple 3. The temperature measurements from these thermocouples are continually shown via a control and LCD thermal indicator system. To keep combustion steady, the gate ball valve and gate valve control the flow of Fuel and air into the combustion chamber. This experimental setup is intended to assess the furnace's performance. It integrates fuel supply, airflow management, combustion, temperature monitoring, and exhaust sampling into a single system. Figure 2 shows several places (top and bottom) where the gas is collected. Then, using the Shimadzu GC-2014 Gas Chromatography (GC) analyzer, which has five sets and two cylinders, different fuel mixture ratios are tested to determine the composition of the combustion gases. Furthermore, three sets of Type K 1100 °C ceramics, a stainless steel rod thermocouple, and a data recorder with a PLC-controlled display are used to measure the gas temperature via the Omron E5CS-Q1KJX-F temperature controller. Handheld anemometers from the UT360 series measure the air intake rate.

2.2. Standard Test

Combustion efficiency and thermal efficiency are the two main metrics used to measure the effectiveness of the combustion stove. Combustion efficiency testing, thermal efficiency testing, and exhaust gas quality assessment are all part of the testing protocols used in this study, which adhere to DIN EN 203-1.

2.2.1. Combustion Efficiency Test

For the combustion efficiency test, a standard flue-gas collection hood was placed over the burner for five minutes. Then, a gas probe was inserted and stabilized O₂, CO₂, and CO values were recorded every minute for fifteen minutes. After that, the used-oil fuel flow rate and measurement heights inside the combustion chamber were varied to observe changes in exhaust gas composition. Crank efficiency, based on heat from fuel combustion and heat lost due to carbon monoxide formation, was calculated from the collected data.
η C = Q f u e l Q l o s s , c o Q f u e l × 100 %
Where η C is combustion efficiency, Q f u e l is heat from fuel combustion, Q l o s s , c o is heat loss.

2.2.2. Thermal Efficiency Test

The Water Boiling Test (WBT) was used to measure thermal efficiency. It entailed taking the starting water temperature, adding 3,000 grammes of water to a container, and placing a thermocouple 5 cm above the water's level. Starting at 25°C, the water was monitored every minute until it reached the boiling point, around 95°C. The time was recorded at the moment boiling began, and the heating process continued for another five minutes before the stove was turned off and the final temperature was recorded. The stove was ignited using used vegetable oil and allowed to stabilize for five minutes before the prepared container was placed on it. Following this, the remaining water was weighed. The collected data were used to determine the stove's thermal efficiency. This data included the following: water mass, specific heat (4.17 J/g°C), fuel mass flow rate, latent heat of vaporization (2,260 J/g), temperature difference, lower heating value of the used oil, and mass of evaporated steam.
Preprints 187600 i012
Where η T H is thermal efficiency, W w is water weight, gram, C p , w is the specific heat of water, kJ/(kg oC), m f u e l is the mass flow rate of used oil, kg/s, h f g , v a p o r is the latent heat of vaporization, kJ/kg, Δ T is the temperature difference between the start and final test state, K, t t o t is testing time, s, L H V f u e l is the lower heat value of Fuel, kJ/kg, W w tis water weight, kg.

2.3. Experimental Procedure

The test methods in this study make use of both fresh and used vegetable oils, as well as waste glycerol (Figure 3 and Figure 4). To evaluate the furnace's performance, five different fuel conditions were prepared and tested. These conditions included 100% used vegetable oil, 100% waste glycerol, and mixtures of 50% used vegetable oil and 25% waste glycerol. The total volume of each fuel condition was 7 liters. Table 1 shows the results of these tests, which examined the combustion behavior and fuel characteristics of the various fuels. For the experiment, we used 20 mL of 99.5% alcohol as a starting point, filled the fuel tank to the top with the specified combination, let it spill over into the combustion chamber, and then put the burner liner in. The system was permitted to attain steady-state combustion, usually within 10-15 minutes, as evidenced by a stable flame height, after about five minutes, when evaporated Fuel was clearly generated. The blower was run at a minimum airflow of 2.3 m/min (1.15 m³/min). To avoid flame flashback, the supply valve was closed after the tank was empty of Fuel. Before positioning the flue-gas collecting hood with two thermocouple points over the combustion chamber, the furnace was left running for another half an hour to ensure stable combustion. The two-cylinder PVC sampling device was used to route the exhaust gases. During sampling, both ball valves were opened and then covered with aluminum foil to avoid leaking. The flow and temperature readings were taken using UT360 handheld anemometers placed at the boiler steam outlet and blower intake, as well as an Omron E5CS controller with Type-K thermocouples and an EXTECH 42509 infrared thermometer. Figure 5 and Figure 6 show the results of applying these procedures to steam 750 oyster mushroom substrate bags in a 100-liter boiler. To evaluate and compare the effectiveness of the five fuel formulations, performance assessments were conducted, including combustion temperature, exhaust gas parameters, fuel consumption rate, and overall furnace efficiency.

3. Analytical Analysis

To get the thermodynamic equations for the fuel-air mixture, we utilize the governing equations of a miniature furnace. A few of the furnace's fundamental physical features include the fuel-air combination, the combustion process, and the combustion gases, which mix with the air to determine when the Fuel and air have been burnt out. Fuel vapor is produced when glycerol, combined with vegetable oil boils. Afterwards, it makes its way into the furnace to be fully mixed with air. Part one of an open system, according to the first rule of thermodynamics, is the mixing zone, which consists of 1) boiling steam of glycerol and used vegetable oil combined with air, the Premixer, and 2) the second part, the equation zone. Figure 7 illustrates the distinction between the combustion gas and air mixing zones, namely the Primary Zone, and the Dilution Zone, which is the area within the liner hole where the gas is diluted due to mixing with air.
All gases in the combustion chamber are ideal gases.
Preprints 187600 i013
Where P represents the internal pressure of the combustion chamber. V is the volume of the combustion chamber. A c o m . L = π D c o m 2 2 . L
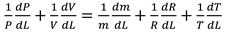
This is the derivative equation of the concept gas equation with respect to distance.
Preprints 187600 i014
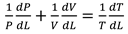
At each stage, when Fuel, air, and combustion are combined, the equation may be expressed as:
Preprints 187600 i015
Base on Figure 7, for the premix zone, the variables ma, mf, mu, V, ru, Tu, and Uu represent the following: air mass, fuel mass (boiling vapor of glycerol and utilized vegetable oil), pressure, volume of the furnace, gas constant, and temperature.
Figure 7 shows that in the primary zone, also known as the combustion zone, the mass of the air and Fuel that is burnt is equal to mu, Pb is the average pressure of the air and Fuel inside the combustion chamber at adiabatic temperatures, V is the volume of the furnace or combustion chamber, Rb is the gas constant, Tb is the system's temperature when burned (the adiabatic temperature), and Uu is the system's internal energy.
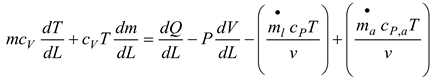
The energy balance in the system is obtained as follows;
Preprints 187600 i001
Where m is the system's mass. m l is a temporary decrease in mass. m a is the volume of air that, through the liner hole, goes into the diluting phase. Gas velocity, denoted as v, and pressure, P, are two variables. In 
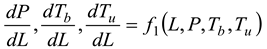
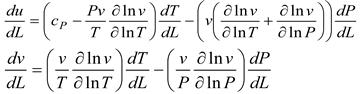
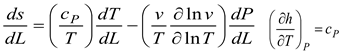
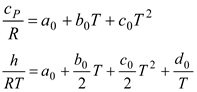
Table 2, we can see that the thermodynamic parameters that vary with distance (L(x)) are a function of both temperature and pressure, as given in Eq. 4 (Heywood, 1986; Gordon, 1975).
shows the thermodynamic parameters of the main zone (the combustion zone) as functions of temperature and pressure (T, P), which vary with distance (L(x)).
Preprints 187600 i007
A temperature derivative equation, equalized per unit distance, may be derived from the original equation under the assumption of constant volume and average pressure. The following is an example of both burnt and unburned:
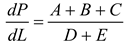
- Pressure per distance
Preprints 187600 i008
where
Preprints 187600 i009
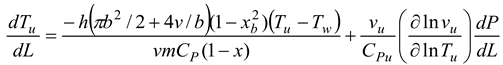
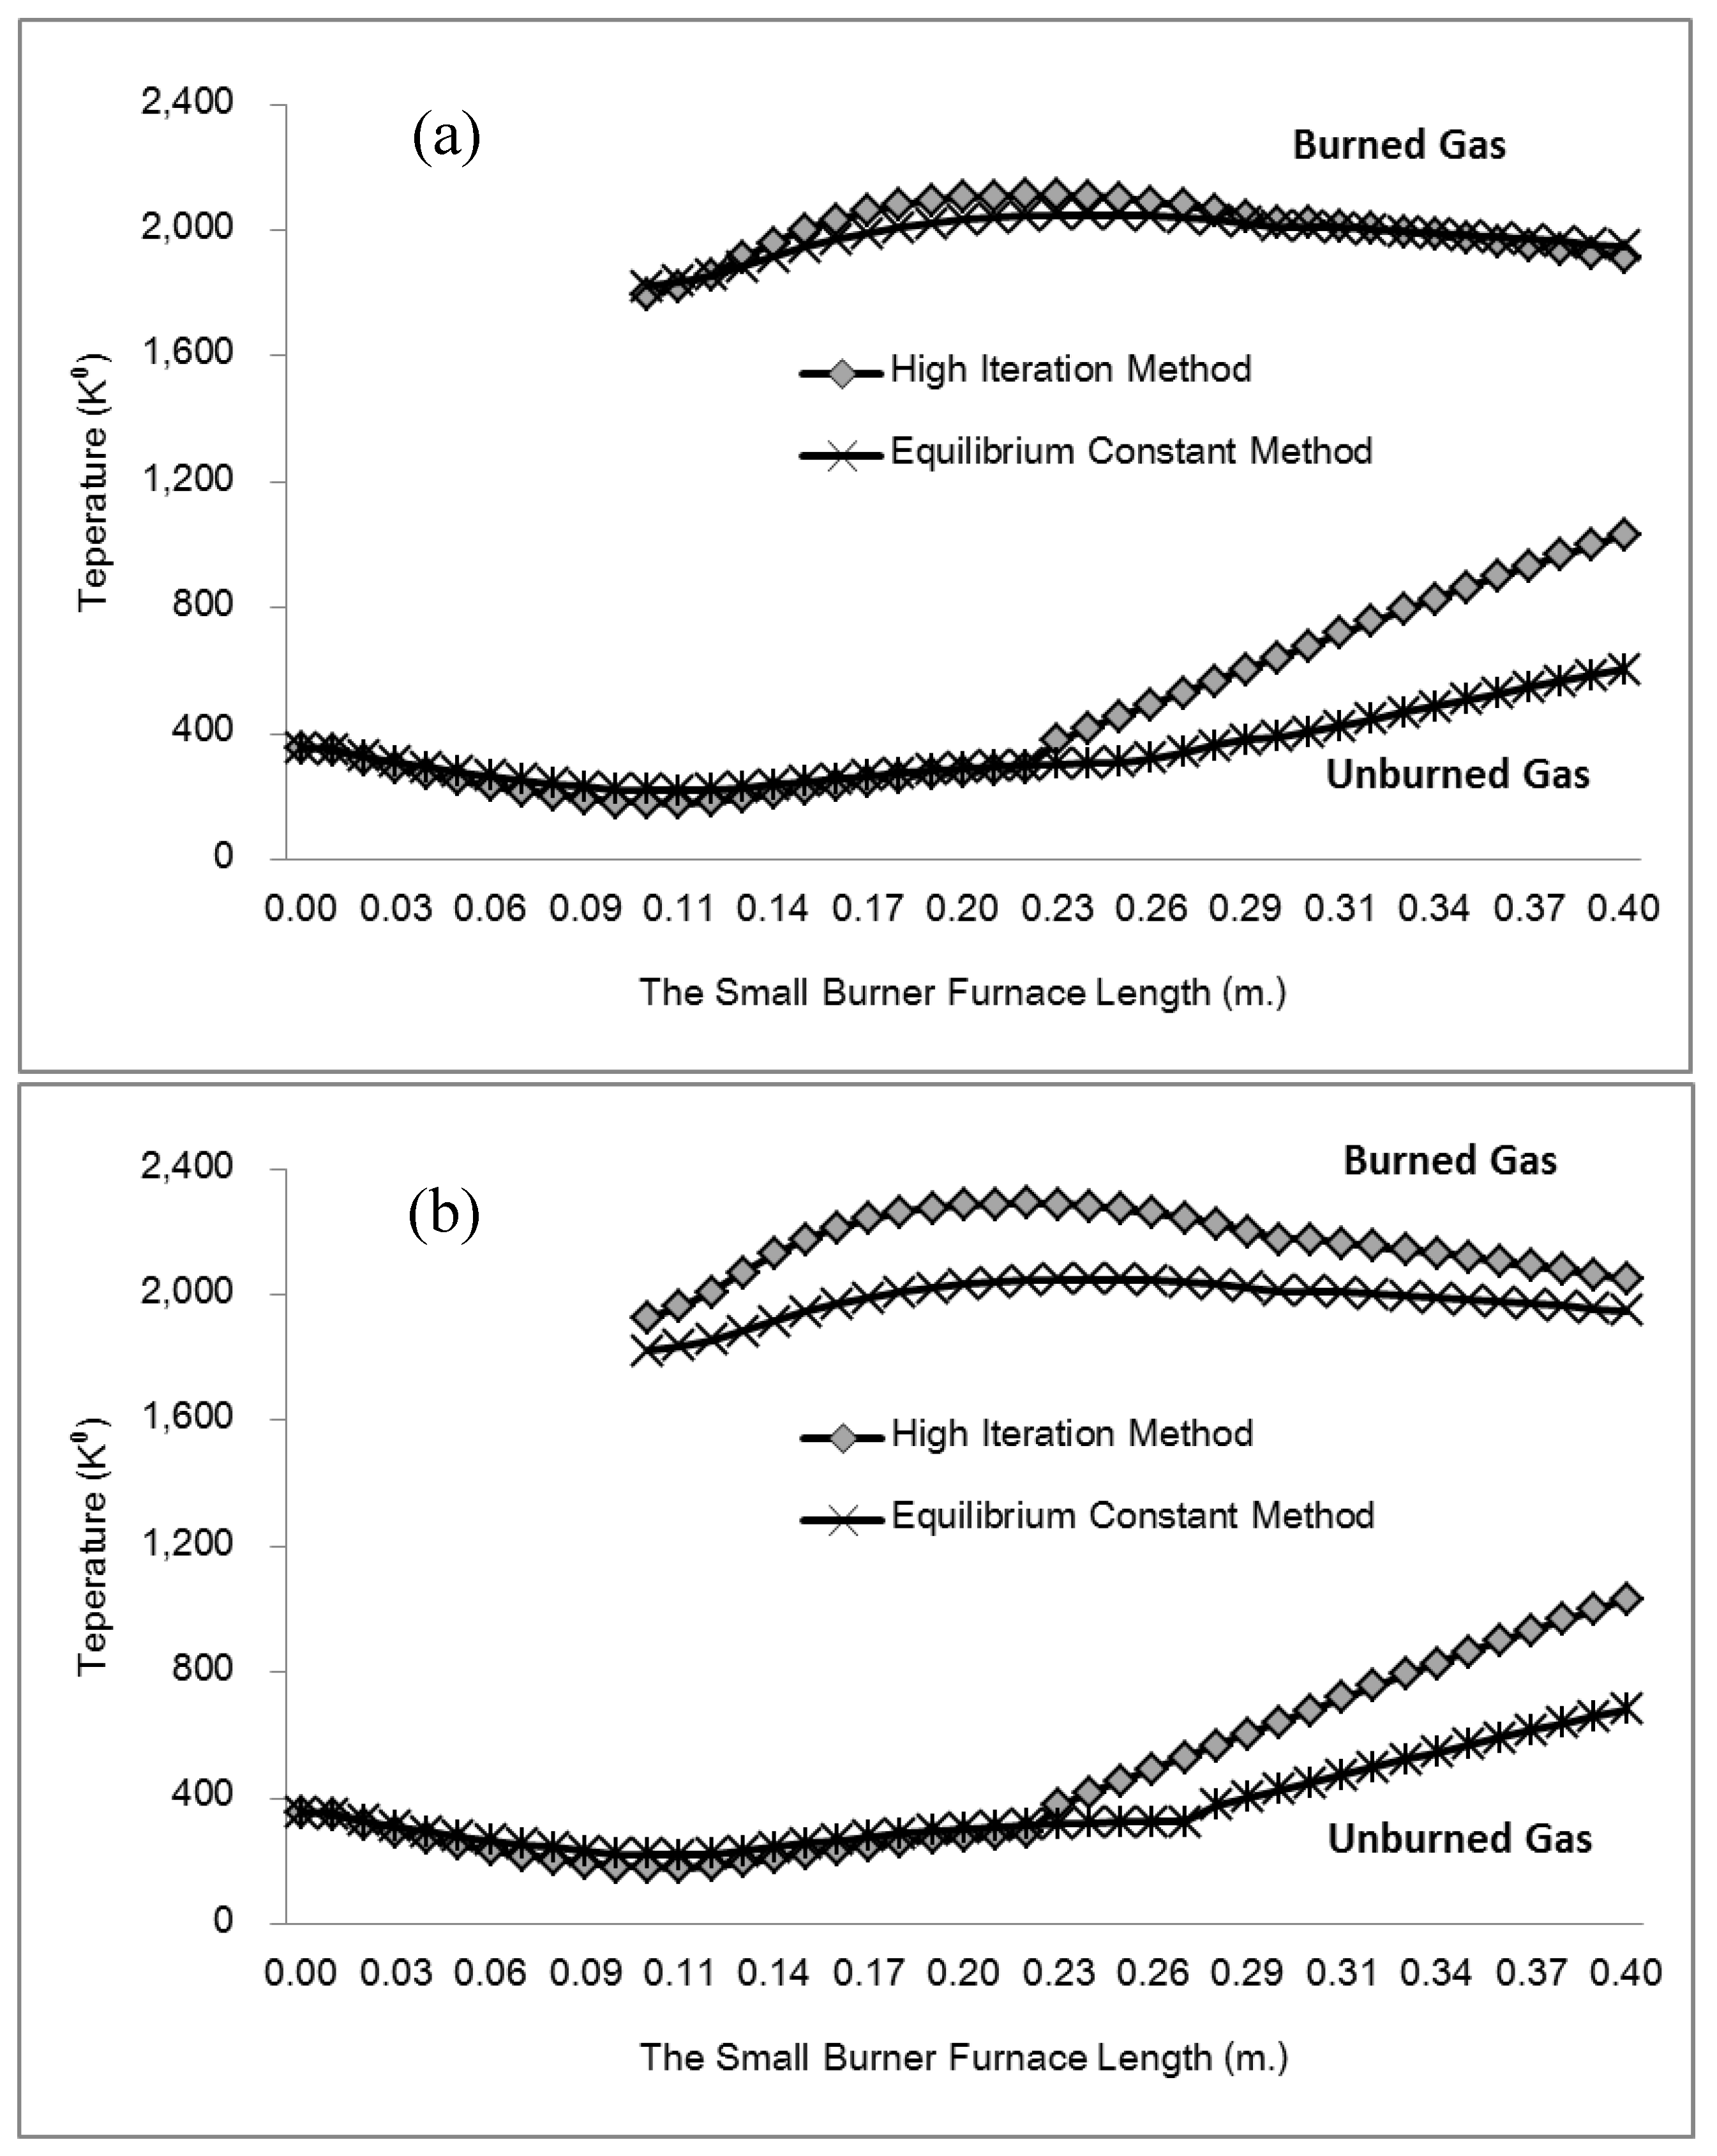
- Burning and unburned gas temperature
Preprints 187600 i010
Preprints 187600 i011
Where Tu is the unburned gas temperature (K), Tb is the combustion gas temperature (K), Tw is the wall temperature of the furnace, C is the initial gases blow-by is the constant obtained by repeating in the convergent process. x is the mixture of air and gas obtained from the combustion. The following can be done to simulate the burning of low-calorific fuels in miniature furnaces and flames:
- First, we will look at the enhanced procedure at the zone where the Fuel and air combine. Two distinct zones: the combustion zone and the dilution zone. In every zone, the combustion process is exhaustive.
- Combustion equation of mixed Fuel ( C α H β O γ N δ ), under the fuel-air ratio ε and the equivalent of ϕ air, one mole can be written as an equation.
ε ϕ C α 1 H β 1 O γ 1 N δ 1 + ε ϕ C α 2 H β 2 O γ 2 N δ 2 + 0.21 O 2 0.79 N 2 ν 1 C O 2 + ν 2 H 2 O + ν 3 N 2 + ν 4 O 2 + ν 5 CO + ν 6 H 2 ν 7 H + ν 8 O + ν 9 OH ν 10 NO + v 11 N
Where C α 1 H β 1 O γ 1 N δ 1 is the 1st Fuel (Glycerol Vapor) and C α 2 H β 2 O γ 2 N δ 2 is the 2nd Fuel (Vegetable used vapor oil) [Metzger, 2007],
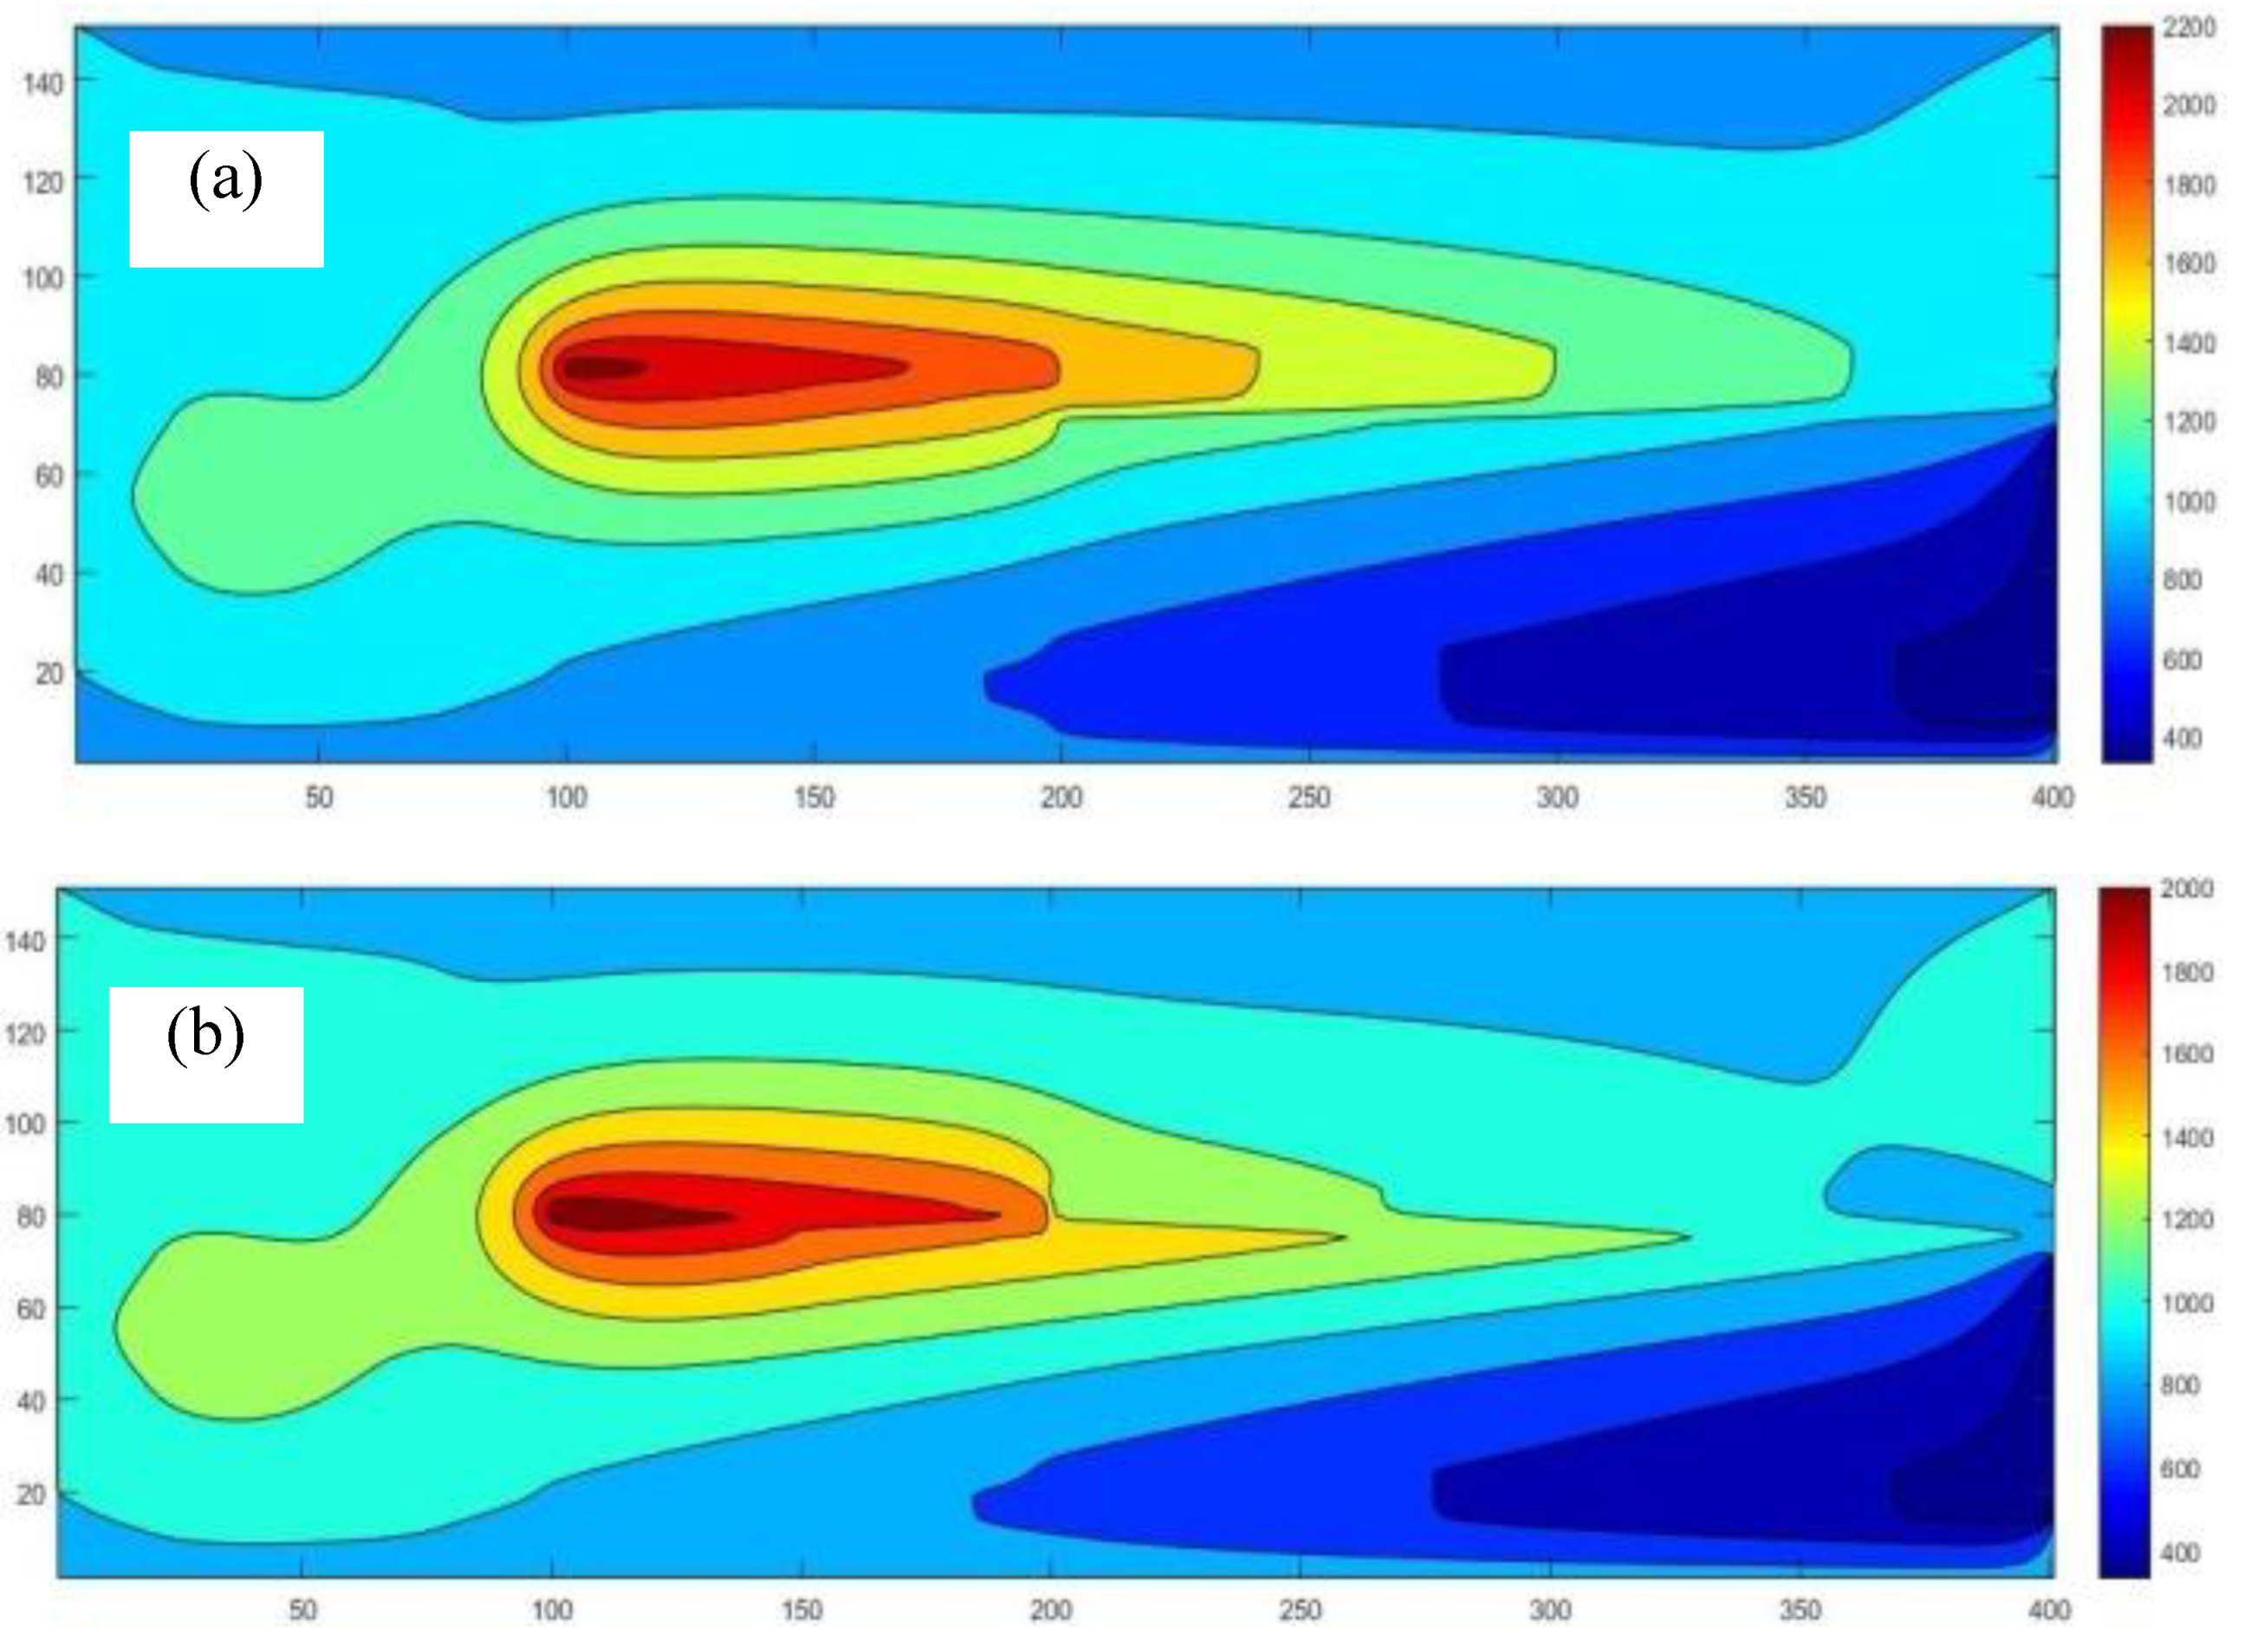
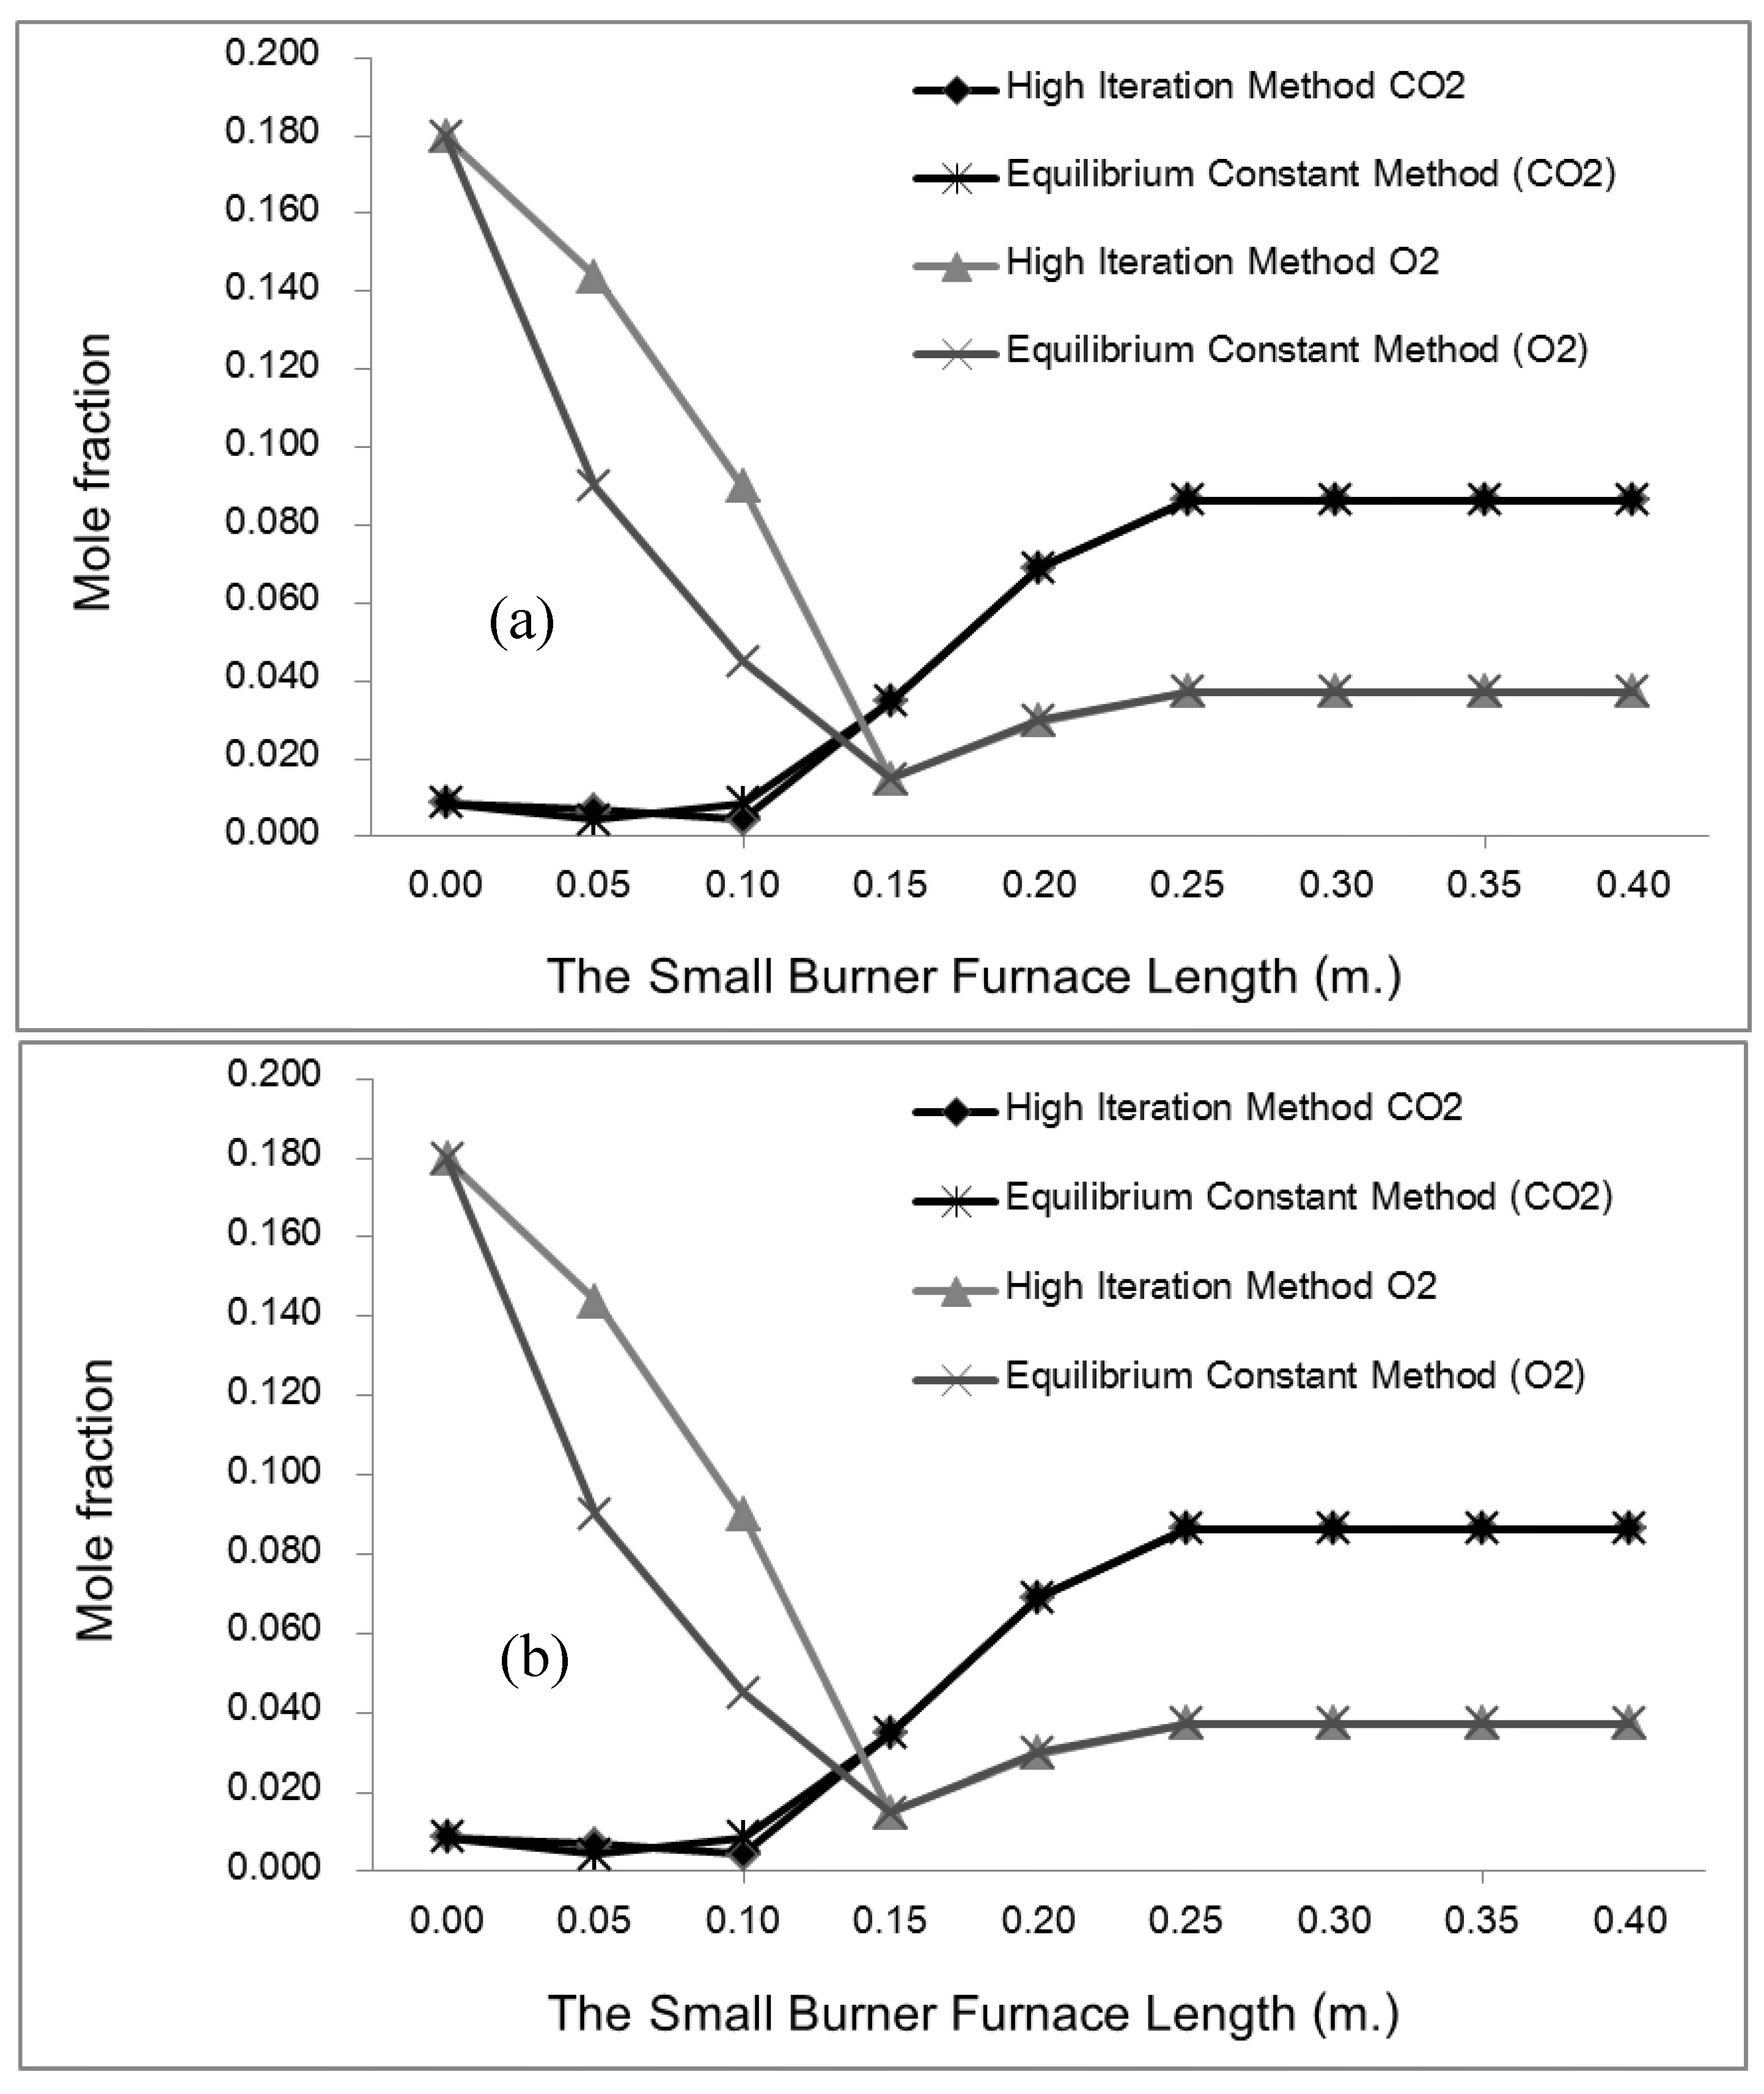
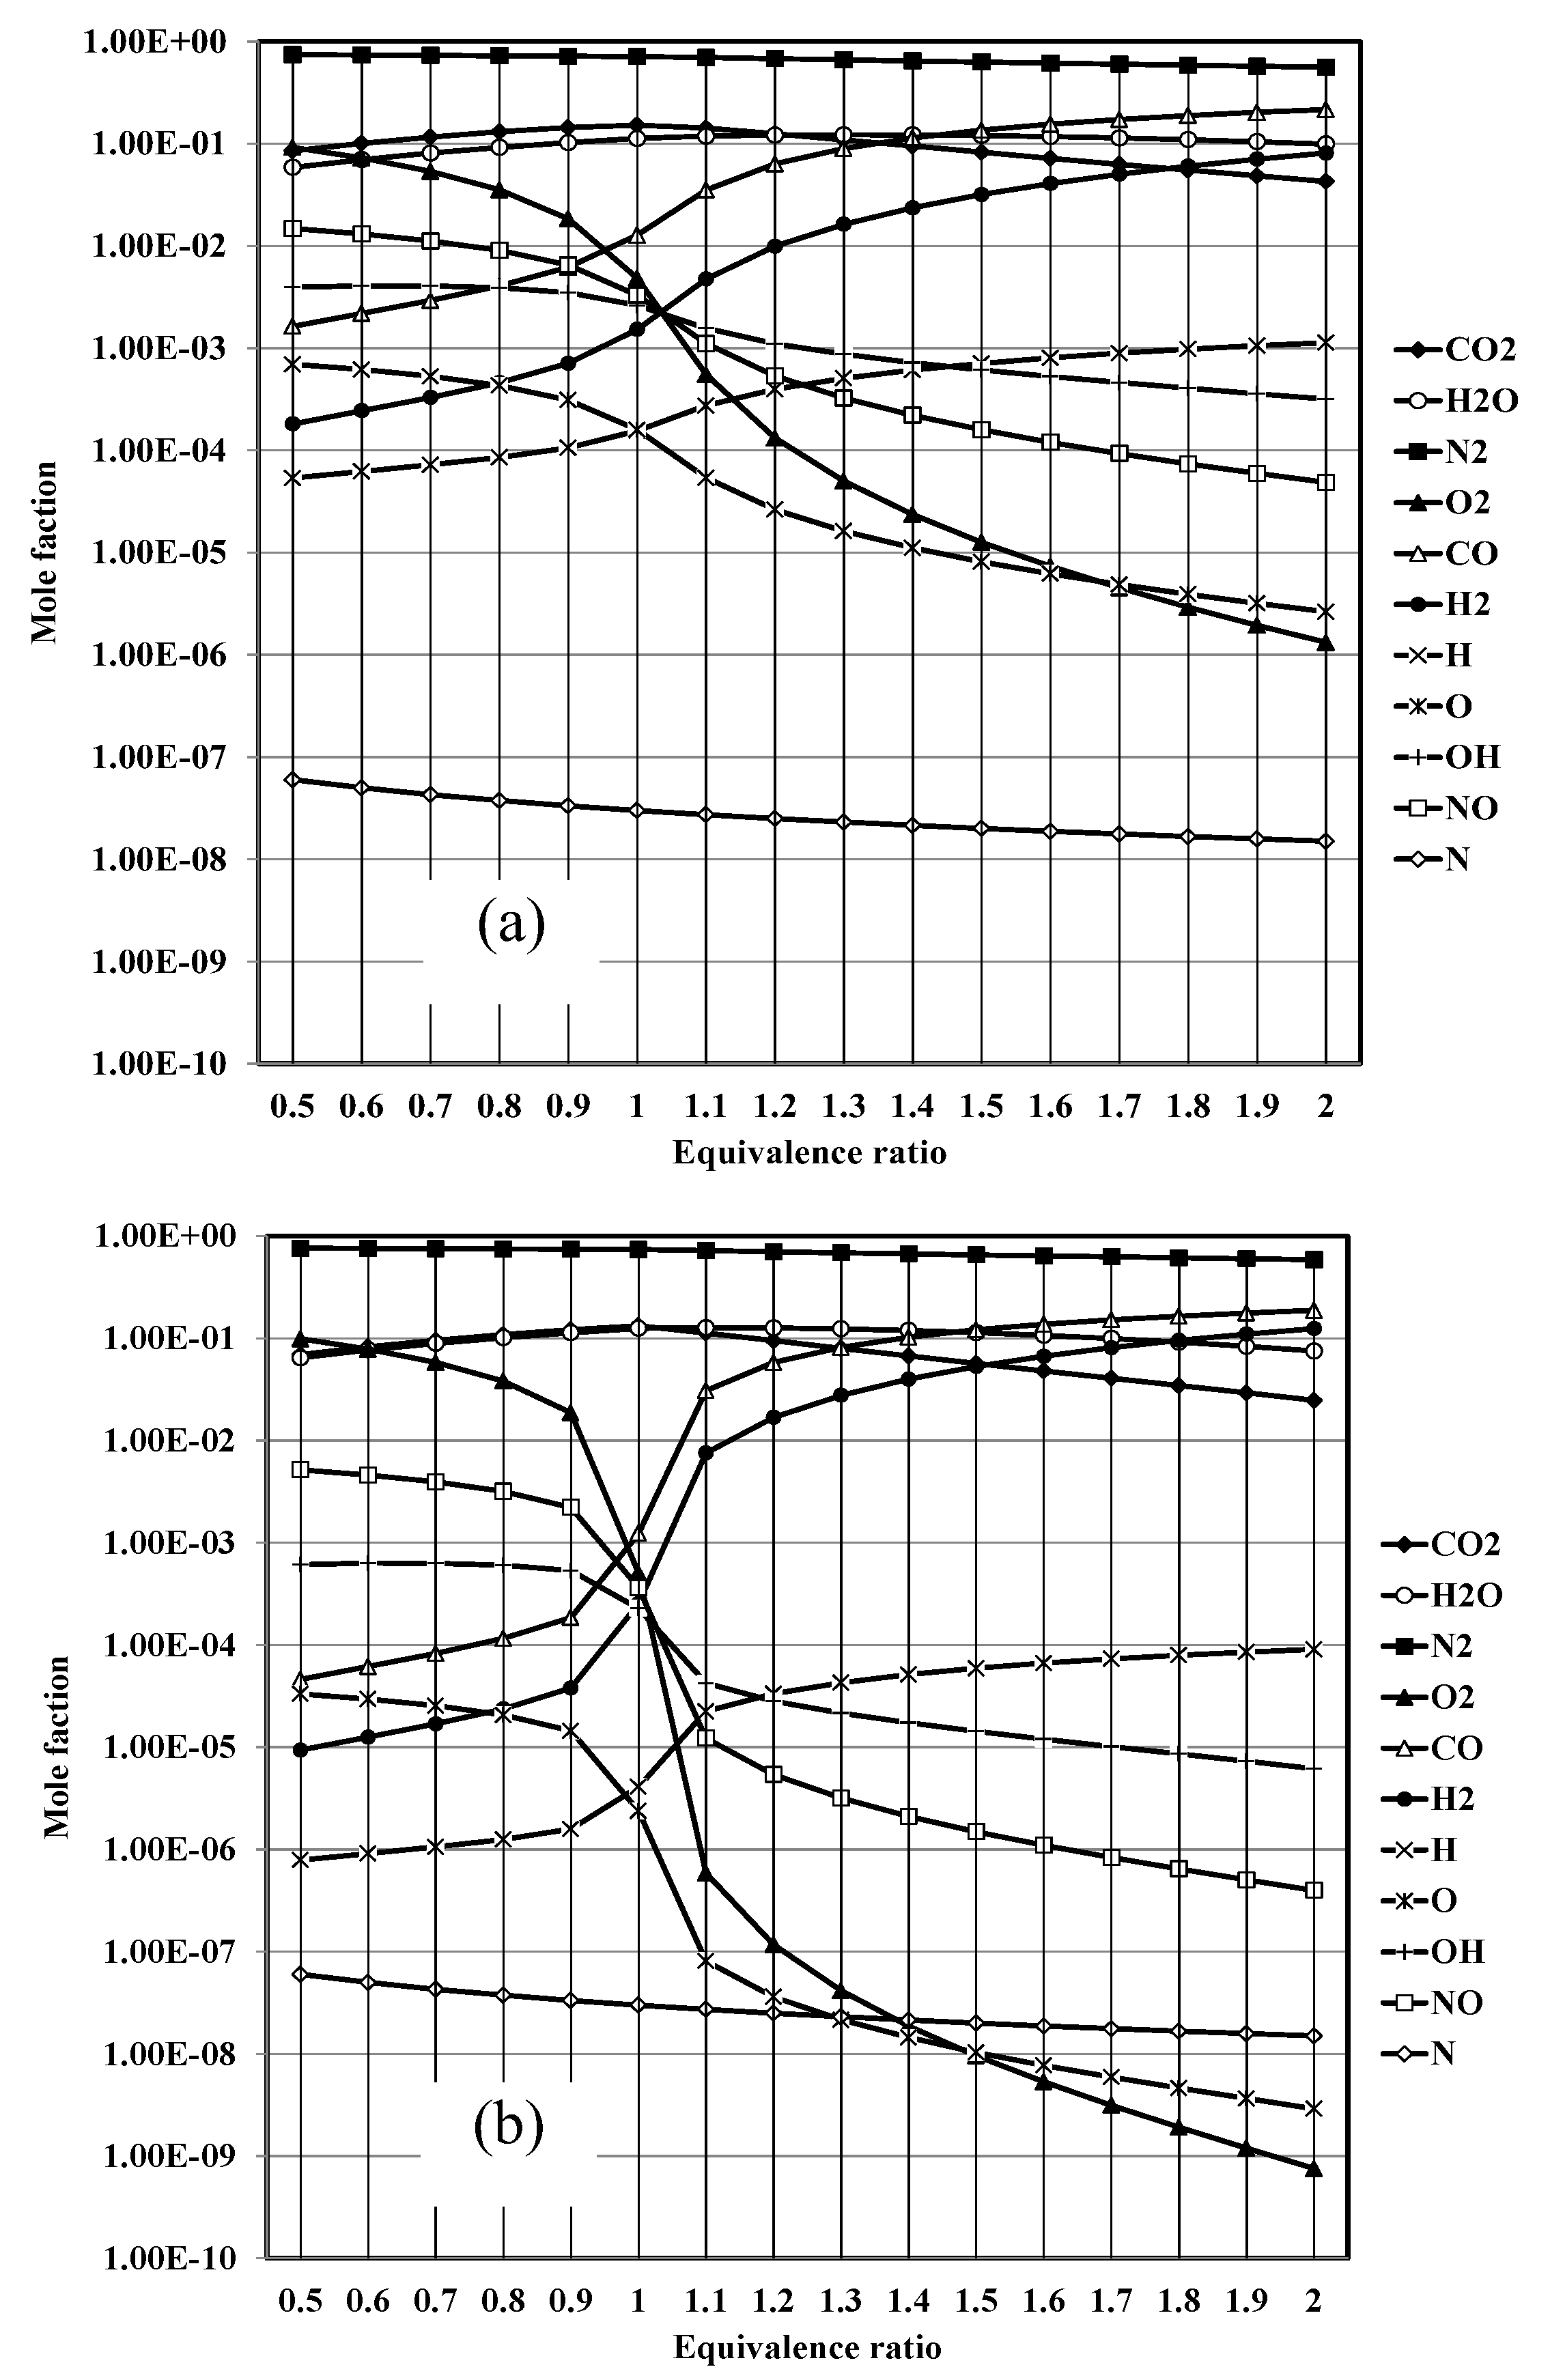
Where ν is the mole ratio of the production gases (11 types). At the chemical equilibrium, there are three zones in the considering process. In the 1st zone, fuel-air is mixing already at temperatures below 500 K, in which "C" "O" _2 "," "H" _2 O,N_2 in the exhaust gas. For the combustion zone, there are 11 different gases in the exhaust, including CO2, H2O, N2, O2, CO, H2, H, O, OH, NO, N, at adiabatic flame temperature and then the dilution zone with N2, O2 added at temperature below 1000 K. Therefore, by considering the chemical equilibrium of each zone, there are four sub-equations that are identical to each of them as follows:
C ε ϕ α 1 + ε ϕ α 2 + ε ϕ α 3 = ( y 1 + y 5 ) N
H ε ϕ β 1 + ε ϕ β 2 + ε ϕ β 3 = ( 2 y 2 + 2 y 6 + y 7 + y 9 ) N
O ε ϕ γ 1 + ε ϕ γ 2 + ε ϕ γ 3 + 0.42 = ( 2 y 1 + y 2 + 2 y 4 + y 5 + y 8 + y 9 + y 10 ) N
N ε ϕ δ 1 + ε ϕ δ 2 + ε ϕ δ 3 + 1.58 = ( 2 y 3 + y 10 + y 11 ) N
In cases where y is the percentage of moles and N is the total number of moles of the product. Hence, the following is the percentage of total moles of combustion products:
i = 1 11 y i 1 = 0
Rearrangements in the linear equation form (excluding N term) as follows:
2 y 2 + 2 y 6 + y 7 + y 9 d 1 ( y 1 + y 5 ) = 0
2 y 1 + y 2 + 2 y 4 + y 5 + y 8 + y 9 + y 10 d 2 ( y 1 y 5 ) = 0
2 y 2 + y 10 + y 11 d 3 ( y 1 + y 5 ) = 0
Where
d 1 = β 1 + β 2 + β 3 α 1 + α 2 + α 3 , d 2 = γ 1 + γ 2 + γ 3 + 0.42 ε ϕ α 1 + α 2 + α 3 , d 3 = δ 1 + δ 2 + δ 3 + 1.58 ε ϕ α 1 + α 2 + α 3
The procedure requires consideration of seven unknowns, the value of which exceeds that of the equations, as stated before. Hence, according to the equilibrium constant connection at the same mole ratio, pressure, volume, and temperature under the same conditions, the gases formed from combustion are considered to be an ideal gas and undergo the following breakdown [Table 3]:
Hence, the following is how the issue is solved using the Newton approach in terms of the Taylor Series distribution:
f j ( y 3 , y 4 , y 5 , y 6 ) = 0   where   j = 1,2 , 3,4   f j + f j y 3 Δ y 3 + f j y 4 Δ y 4 + f j y 5 Δ y 5 + f j y 6 Δ y 6 = 0
Equilibrium may be achieved by setting Matrix Algebra, where the initial value serves as the default for solving subsequent equations until the entire error condition is met. The process is as follows:
[ Δ y ] = i n v [ A ] [ f ]
The mole proportions matrix, denoted as [Δy], is assumed to be less than or equal to zero. The constants matrix, denoted as [A], is obtained from the molar proportional derivative according to Taylor's derivative equations. The main equation matrix, denoted as [f], is solved using MATLAB. You can figure out the changes in pressure, temperature, and the velocity of exhaust gas flow from
T a = Q a m a R a + T a P a P a v a ln v a ln T a + ln v a ln P a P a R a / 1 + c P a R a ln v a ln T a
P b = P m b m a T a T a + V V + P
m b = Q b P b V 1 + u b T b 1 R b P V u b T b 1 R b + u b P b m b V 1 + V V T a T a u b u a R a T a T b u b T b + P V m a u b T b 1 R b + u b P b m b V

4. Results and Discussion

4.1. Predicted Results

Figure 8 shows the pressure distribution throughout the length of a small burner furnace under two equivalency ratios tested using the High Iteration Method and the Equilibrium Constant Method. The Fuel is a mixture of 70% glycerol and 30% used vegetable oil. Pressure falls at the burner inlet in both cases because the reactant mixture is accelerated and heat is released quickly. It then drops to its lowest point before rising sharply in the mid-furnace region. This is because the combustion reaction gets hotter and the gas expands more, which increases the pressure. The peak pressure is lower in the fuel-lean condition (a), with an equivalence ratio of 0.8, due to the reduced heat release and weaker thermal expansion caused by the limited availability of Fuel. On the other hand, with an equivalency ratio of 1.2, the fuel-rich situation (b) results in a significantly higher-pressure peak. This is because the increased concentration of Fuel boosts the intensity of combustion and gas production, which in turn causes a bigger buildup of pressure along the furnace. There is a subtle distinction between the two computer approaches, and that is because the High Iteration technique is more sensitive to reaction kinetics than the equilibrium-based technique.
Figure 9 shows the temperature distribution along the center zone of the small burner furnace for a fuel mixture of 70% glycerol and 30% used vegetable oil. The results are compared using two equivalence ratios, and the analysis includes both burned and unburned gases. The analysis was conducted using the High Iteration Method and the Equilibrium Constant Method. Under fuel-lean condition (a), with an equivalence ratio of 0.8, the burned-gas temperature rises slowly due to partial combustion and lower reaction intensity, while the unburned-gas temperature steadily rises along the length of the furnace, stabilizing around 1,600-1,700 K. This is because the limited fuel content causes moderate heat release. The burned-gas temperatures in the fuel-rich condition (b), with an equivalence ratio of 1.2, are much higher, reaching around 1,900-2,000 K. This is because the increased combustion intensity and thermal energy released in the presence of more Fuel causes a steeper temperature rise as the furnace moves through it. Due to the continued reaction downstream caused by incomplete combustion zones caused by extra Fuel, the unburned-gas temperature rises more quickly in (b) than in (a). Because the Equilibrium Constant Method assumes perfect equilibrium behavior and produces lower estimates, and the High Iteration Method incorporates combustion kinetics and iterative temperature corrections, which lead to slightly higher predicted temperatures, the two computational methods differ in these respects.
Thermal energy and combustion intensity are shown spatially in Figure 10, which also shows the contours of the furnace's interior temperatures for the fuel mixture (70% glycerol and 30% used vegetable oil) for two equivalency ratios. At an equivalence ratio of 0.8, the fuel-lean condition (a) causes the mixture to reach its optimal air-fuel interaction and the maximum temperature to reach around 2000 K. This happens close to the upstream region of the combustion chamber, just downstream of the burner nozzle, where the reaction first becomes fully established. On the other hand, condition (b), which is fuel-rich and has an equivalency ratio of 1.2, has an even higher maximum temperature of around 2200 K. This condition is also located in the same location but flows farther downstream because the greater fuel concentration improves heat release and intensifies the flame core. Compared to case (a), which results in a narrower hot zone due to restricted fuel availability limiting peak combustion temperature and overall flame spread, case (b) has a hotter and wider high-temperature zone because the richer mixture provides more combustible material, leading to stronger exothermic reactions and a more pronounced thermal plume.
Figure 11 displays the CO₂ and O₂ mole-fraction distribution throughout the tiny burner furnace's length for the mixed Fuel (70% glycerol and 30% used vegetable oil) under two equivalency ratios, illuminating the spatial variations in combustion progress and oxygen consumption. As the oxygen is used up in the primary combustion reactions, the O₂ mole fraction quickly drops in the first 0.10-0.15 m of the fuel-lean case (a) with an equivalence ratio of 0.8.
At the same time, CO₂ starts off very low and then rises sharply in the same area, reaching its maximum beyond 0.20 m when combustion is fully established and oxidation is complete. On the other hand, in the fuel-rich case (b), with an equivalence ratio of 1.2, the initial O₂ concentration is significantly lower due to the insufficiency of air in comparison to the Fuel, which causes O₂ to decrease even more quickly near the intake. CO₂, on the other hand, continues to increase along the furnace but reaches a slightly lower maximum than in the lean case due to incomplete combustion and the limitations imposed by the fuel-rich conditions on full oxidation. Because it integrates reaction-kinetic effects and non-equilibrium behavior, the High Iteration Method captures the stronger gradients associated with actual combustion, and hence predicts steeper increases in O₂ depletion and CO₂ production compared to the Equilibrium Constant Method. The major combustion zone, where oxygen consumption peaks and CO₂ generation is highest, occurs approximately 0.10-0.25 m from the entrance. The geographic patterns overall represent the combined effects of oxygen availability, reaction intensity, and fuel-air mixing.
Figure 12 illustrates the effect of varying the equivalence ratio on the mole fractions of major and minor combustion products (CO₂, H₂O, N₂, O₂, CO, H₂, OH, O, H, NO) for the mixed Fuel of 70% glycerol and 30% used vegetable oil, showing how chemical equilibrium shifts between fuel-lean and fuel-rich conditions. As the equivalence ratio increases from lean to stoichiometric, the concentrations of CO₂ and H₂O rise because more Fuel becomes available for complete oxidation, while O₂ progressively decreases due to increased oxygen consumption. Beyond stoichiometric conditions—entering the fuel-rich region—the CO₂ and H₂O levels begin to plateau or decline slightly, and species associated with incomplete combustion such as CO and H₂ increase sharply since there is insufficient oxygen to fully oxidize the Fuel. Radical species such as OH, O, and H also peak near stoichiometric conditions, where the flame temperature and reaction intensity are highest, then decline under rich conditions due to reduced oxidation reactions. Nitrogen-related species (mainly N₂ and trace NO) show limited variation, with NO peaking near stoichiometric mixtures because thermal NO formation is strongly temperature-dependent. Overall, the observed trends arise from the balance between oxygen availability and fuel concentration: lean mixtures promote complete oxidation and high O₂ levels, stoichiometric mixtures maximize combustion temperature and radical formation, while rich mixtures enhance incomplete combustion, increasing CO and H₂ while reducing oxidized products.
) in the furnace for mixing oil (Glycerol : Used vegetable oil, 70:30) at (a) equivalence ratios = 0.8 by mole and (b) equivalence ratios = 1.2 by mole.

4.2. Measured Data

Flame temperature distributions produced by three distinct fuels—waste glycerol, used vegetable oil, and a 50:50 mixed oil—are shown in the thermal images in Figure 13. The infrared camera was used to capture these images, and the color gradients from blue-green to yellow-red indicate the intensity of temperature from cooler outer regions to hotter core regions. A concentrated high-temperature core with a maximum reading of around 506.6 °C is seen in the flame produced by waste glycerol; this indicates vigorous localized combustion. However, there are discernible temperature swings throughout the flame's surface. The flame produced by the combustion of used vegetable oil shows the most evenly distributed high-temperature zone, with a maximum temperature of approximately 520.1 °C, indicating stable and efficient combustion. A somewhat wider high-temperature zone with a maximum value of 537.4 °C is observed in the thermal pattern of the 50:50 mixed oil. This is the highest value among the three fuels and suggests that the combined qualities of the two oils have increased combustion intensity.
For various fuel ratios of glycerol and used vegetable oil, Table 4 shows the variations of major exhaust-gas components (Hₖ, air percentage, CH₄, and COₖ) measured at the upper and lower sampling positions of the furnace. This data reveals how combustion characteristics are influenced by fuel composition and sampling location. With no measurable H₂ or CH₄ and the highest CO₂ levels (25-27%), pure used vegetable oil (Up Oil and Down Oil) indicates efficient burning with little incomplete-combustion products. Because partial thermal decomposition of glycerol promotes the formation of hydrogen and light hydrocarbons under high-temperature conditions, small amounts of H₂ (2.4-5.4%) and CH₄ (4.3% for some mid-ratio blends) appear when glycerol and vegetable oil are blended in certain ratios, such as 90:10, 50:50, or 75:25. This is particularly true at the upper sampling position. Because glycerol has a lower calorific value and a higher oxygen content, it changes flame stability, and as a result, CO₂ levels for mixed fuels drop significantly (14% to 24%), showing less complete oxidation. Combustion of pure glycerol elevates H₂ generation (3.9% at the top) and CH₄ production (4.3%), but CO₂ decreases to 18% to 20%, indicating more noticeable incomplete combustion. The "Down" sample is closer to the initial mixing zone, where more air dilutes the gas composition, leading to higher measured "air (%)" values and lower detectable fuel-rich species, and the "Up" sample contains hotter post-flame gases that enhance thermal cracking and hydrogen formation. A larger vegetable-oil percentage supports more stable combustion and higher CO₂ generation, while a rise in glycerol content decreases combustion completeness and increases pyrolysis-driven species like H₂ and CH₄, as seen in the table overall.
To demonstrate how even tiny variations in air supply may have a significant impact on flame behavior and combustion performance, Table 5 illustrates the variance in combustion efficiency for a fuel combination consisting of 90% used vegetable oil and 10% glycerol under three slightly varying airflow rates. The surface temperature varies slightly between 195-200°C as the airflow rate increases from 1.30 to 1.32 m³/min, while the flame temperature stays reasonably constant around 485-490°C, suggesting that the combustion zone is thermally stable under these conditions. The combustion efficiency varies between 90% and 92%, reaching 92% at the maximum airflow rate of 1.32 m³/min. This indicates that even a small increase in air supply increases the mixing of Fuel and air and makes the oxidation process more complete. On the other hand, efficiency decreases to 90% with somewhat lower airflow (1.31 m³/min) due to less complete combustion from less oxygen supply, even if the flame temperature seems to be the same. The chart shows that a little greater airflow rate offers improved combustion quality without unduly cooling the flame, leading to ideal efficiency for this fuel combination.
Table 6 displays the results of three boiler tests' thermal efficiency, illustrating how changes in fuel mass, residual water, steam flow rate, boiling temperature, and evaporated water affect the boiler's total heat-transfer and performance. Using slightly varied masses of Fuel (5.8-6.8 kg) results in an increase from 3.3 to 3.6 kg of evaporated water across all three experiments, suggesting that a larger fuel input results in more phase change and steam generation. Saturated liquid and vapor enthalpy values are independent of temperature and pressure at boiling point, so they do not change. A high combustion furnace efficiency (99.1–99.4%) indicates that the fuel combination burns nearly entirely regardless of the circumstances. The steam flow rate fluctuates slightly between 6.0 and 6.1 m³/min, and the boiling temperature increases from 112 to 114°C, indicating a minor improvement in steam generation and heat release in the subsequent experiments. Because heat loss surrounding the combustion chamber and outside surfaces are different, the efficiency of a stove drops from 81.3% to 83.6% over time. Since both the heat-exchange area and the geometry of the boiler do not change, the heat exchange efficiency stays at 90%. Variations in fuel mass and steam output generate tiny changes in boiler efficiency, which varies from 72.2% to 73.1%. This indicates that experiments with higher boiling temperatures and more steam generation produce somewhat superior thermal performance. The table shows that thermal efficiency is affected by even modest changes in fuel mass and steam flow, yet the system keeps a consistent and high-quality heat transfer across all three experiments.

4.3. Economic Analysis

Cost, fuel consumption, operating time, and financial returns are clearly different when comparing LPG with a mixed fuel of glycerol and used vegetable oil (25/75), as shown in Table 7, which gives an economic value analysis. Since the waste-based Fuel is less expensive and requires a smaller amount per steaming cycle (28 kg compared to 40 kg for LPG), the mixed-fuel system produces substantially lower annual fuel expenses—only 6,720 Baht versus 23,040 Baht for LPG—despite the fact that the initial stove and boiler cost is slightly higher for the glycerol-vegetable oil system (30,000 Baht) than for LPG (21,000 Baht). Even after accounting for the depreciation of stoves and boilers, the combined annual running cost of 39,120 Baht is lower than that of 44,040 Baht for LPG, even if electricity costs 2,400 Baht in the mixed-fuel system owing to blower operation. Even though both systems bring in 144,000 Baht in revenue per year from mushroom cultivation, the mixed fuel system is more economically beneficial since it saves 99,960 Baht per year compared to LPG. The glycerol-vegetable-oil system has a shorter payback period (3.26 months vs. 3.67 months) due to its decreased operational expenses. Thanks to its lower steaming time each batch (4 hours vs. 6 hours), the mixed-fuel system boosts production and saves 96 operational hours per year. Despite a somewhat higher initial investment, the combined glycerol-vegetable oil system delivers faster return, improved production efficiency owing to lower Fuel and shorter steaming time, and greater cost reductions, according to the economic study.

5. Conclusion

In order to improve energy efficiency, decrease operational costs, and encourage waste-to-energy utilization, this study set out to build, model, and experimentally test a burner and furnace system that used vegetable oil and crude glycerol as inexpensive renewable fuels to steam mushroom substrate cubes. The main conclusions are that blended fuels, particularly those with a 25/75 glycerol-vegetable oil ratio, enhance flame stability, raise the peak combustion temperature, decrease incomplete-combustion products, and achieve high combustion and thermal efficiencies (≈90-99% and 72-73%, respectively). Analytical simulations corroborated the desired distributions of pressure, temperature, and gas species, and economic analysis showed that blended fuels had much lower yearly fuel costs, quicker steaming times, and a shorter payback period compared to LPG. The main takeaways from this study are as follows: (i) a stable burner system that uses mixed fuels was successfully developed; (ii) the best air-fuel conditions for efficient combustion were identified; (iii) analytical modeling was used to validate the thermodynamic behavior; (iv) all blends demonstrated high thermal and combustion efficiency; (v) compared to pure glycerol, mixed fuels produced better exhaust emissions; and (vi) mushroom producers reaped substantial economic benefits and reduced fuel dependence. The study suggests that small and medium-scale agricultural operations can benefit from using this mixed-fuel system to reduce energy costs, improve sustainability, and boost productivity. It also suggests that future research should concentrate on finding the best ratios of higher glycerol, scaling the system up for bigger industrial users, and applying the technology to other thermal-processing applications. This will help to maximize the use and long-term impact of fuels made from renewable waste.

CRediT authorship contribution statement

Anumut Siricharoenpanich: Methodology, Investigation, Funding acquisition, Formal analysis, Conceptualization, Writing - review&editing. Paramust Juntarakod: Methodology, Investigation, Formal analysis, Data curation. Paisarn Naphon: Writing-original draft, Supervision, Validation, Methodology.

Acknowledgments

The study team expresses its gratitude to the Faculty of Engineering at Rajamangala University of Technology Isan and the Faculty of Engineering at Srinakharinwirot University for granting access to research facilities and instruments.

Nomenclatures

A cross section area, m2 C initial gases blow-by is the constant
C p , w specific heat of water, kJ/(kg oC) h f g , v a p o r latent heat of vaporization, kJ/kg,
D diameter, m L H V f u e l lower heat value of Fuel, kJ/kg
L length, m mf mass of the fuel (Mixture), kg
ma mass of air, kg m mass, kg
mu mass of air and fuel, kg m f u e l mass flow rate of used oil, kg/s
m l momentary mass loss. Kg Q f u e l h e a t f r o m f u e l c o m b u s t i o n , k W
P pressure, kPa ru constant value of the gas,
Q l o s s , c o heat loss, Kw Uu internal energy, kJ/kg
t t o t testing time, s v average gas velocity, m/s
V volume, m3 Tb combustion gas temperature, K
Tu unburned gas temperature, K η T H thermal efficiency
Tw wall temperature of the furnace, K
W w water weight, kg,
Δ T temperature difference between the start and final test state, K
η C combustion efficiency

References

  1. Reed, T. B.; Graboski, M. S.; Gaur, S. Development and commercialization of oxygenated diesel fuels from waste vegetable oils. Biomass & Bioenergy 1992, 3, 111–115. [Google Scholar]
  2. Çetinkaya, M.; Karaosmanoǧlu, F. Optimization of Base-Catalyzed Transesterification Reaction of Used Cooking Oil. Energy & Fuels 2004, 18, 1888–1895. [Google Scholar] [CrossRef]
  3. Kaminski, P. The Application of Copper-Gold Catalysts in the Selective Oxidation of Glycerol at Acid and Basic Conditions. Catalysts 2021, 11, 94–102. [Google Scholar] [CrossRef]
  4. Rubianto, L.; Sudarminto, H. P.; Udjiana, S. S. Combination of biodiesel, glycerol, and methanol as liquid Fuel. Conf. Ser.: Mater. Sci. Eng. 2021, 1073, 012005. [Google Scholar] [CrossRef]
  5. Samanta, A.; Adhikary, A.; Roy, P.C. Waste Cooking Oil Biodiesel: Its Testing, Performance and Emission in an Unaltered Diesel Engine. Conf. Ser.: Mater. Sci. Eng. 2021, 1080, 012034. [Google Scholar] [CrossRef]
  6. Jensani, M.K. N.; Sadikin, A. N.; Ngadi, N.; Azman, M. F.; Ab Muis, Z.; Asli, U. A. Anaerobic Co-Digestion of Food Waste with Crude Glycerol for Biogas Production. Chemical Engineering Transactions 2021, 83, 577–582. [Google Scholar]
  7. Elgharbawy, A. S.; Sadik, W. A.; Sadek, O. M.; Kasaby, M. A. Maximizing biodiesel production from high free fatty acids feedstocks through glycerolysis treatment. Biomass & Bioenergy 2021, 146, 105997. [Google Scholar]
  8. Kurdi, M.A. I.; Sitohy, M.; Hefnawy, H. T.; Gomaa, A. M. Characterization of biodiesel prepared from waste cooking oil. Journal of Agricultural Research 2021, 48, 481–487. [Google Scholar] [CrossRef]
  9. Lima, P.J. M.; da Silva, R. M.; Neto, C. A. C. G.; Silva, N. C. G. e; Souza, J. E. da S.; Nunes, Y. L.; dos Santos, J. C. S.; dos Santos, J. C. S. An overview on the conversion of glycerol to value-added industrial products via chemical and biochemical routes. Biotechnology and Applied Biochemistry. Biotechnol Appl Biochem. 2021, 69, 2794–2818. [Google Scholar] [CrossRef] [PubMed]
  10. Kumar, L. R.; Yellapu, S. K.; Tyagi, R. D.; Drogui, P. Biodiesel production from microbial lipid obtained by intermittent feeding of municipal sludge and treated crude glycerol. Systems Microbiology and Biomanufacturing 2021, 1, 344–355. [Google Scholar] [CrossRef]
  11. Chilakamarry, C. R.; Sakinah, A. M. M.; Zularisam, A. W.; Pandey, A. Glycerol waste to value added products and its potential applications. Systems Microbiology and Biomanufacturing 2021, 1, 1–19. [Google Scholar] [CrossRef] [PubMed]
  12. Syahputra, R. A.; Pulungan, A. F. Isolation and characterization of glycerol by transesterification of used cooking oil. Rasayan Journal of Chemistry 2023, 16, 648–652. [Google Scholar]
  13. Rizky, Y.; Panggabean, S.; Sigalingging, R. Purification of glycerol from biodiesel byproduct by using kitchen vinegar. Journal of Physics: Conference Series 2023, 2421, 012006. [Google Scholar] [CrossRef]
  14. Moklis, M. H.; Cheng, S.; Cross, J. S. Current and Future Trends for Crude Glycerol Upgrading to High Value-Added Products. Sustainability 2023, 15, 2979. [Google Scholar] [CrossRef]
  15. Agnesty, S. Y.; Aulia, H. N. Test of biodiesel from used cooking oil from dormitory x on opacity and exhaust emissions hc, co and co2. EDUSAINTEK JURNAL PENDIDIKAN SAINS DAN TEKNOLOGI 2023, 10, 439–456. [Google Scholar]
  16. Kumar, A. S.; Harish, P.; Sriram, R. C. P. Reducing the Waste Oil Decomposition and Producing a useful Energy Conversion Process. International Journal for Modern Trends in Science and Technology 2023, 9, 33–37. [Google Scholar]
  17. Samadov, E. Analysis of vegetable oil refining technology. Chemical Technology, Control and Management 2023, 1, 5–18. [Google Scholar] [CrossRef]
  18. Armylisas, A.H. N.; Hoong, S. S.; Ismail, T. N. M. T. Characterization of crude glycerol and glycerol pitch from palm-based residual biomass. Biomass Conversion and Biorefinery 2023, 5, 1–13. [Google Scholar]
  19. Soni, B.; Shah, A. J.; Karmee, S. K. Pyrolysis of pellets prepared from groundnut shell and crude glycerol: in-situ utilization of pyro-gas and characterization of products. Detritus 2023, 22, 60–71. [Google Scholar]
  20. Dhabhai, R.; Koranian, P.; Huang, Q.; Scheibelhoffer, D.S. B.; Dalai, A. K. Purification of glycerol and its conversion to value-added chemicals: A review. Separation Science and Technology 2023, 58, 1383–1402. [Google Scholar] [CrossRef]
  21. Pámanes, C. G.; Páez-Lerma, J. B.; Herrera-Torres, E.; Araiza-Rosales, E. E.; Hernández-Vargas, V.; Medrano-Roldán, H.; Reyes-Jáquez, D. Effect of Vegetable Oils or Glycerol on the In Vitro Ruminal Production of Greenhouse Gases. Ruminants 2023, 3, 140–148. [Google Scholar] [CrossRef]
  22. Wu, Z.; Cai, J.; Liu, Z.; Liang, X. jiang; Yu, S.; Nie, Y. Utilization of biodiesel and glycerol for the synthesis of epoxidized acyl glycerides and its application as a plasticizer. Journal of the American Oil Chemists' Society 2023, 100, 12715. [Google Scholar] [CrossRef]
  23. Borówka, G.; Krasodomski, W.; Lubowicz, J. Purified Glycerine from Biodiesel Production as Biomass or Waste-Based Green Raw Material for the Production of Biochemicals. Energies 2023, 16, 4889. [Google Scholar] [CrossRef]
  24. Silva, S.S. O.; Nascimento, M. R.; Lima, R. J. P.; Luna, F. M. T.; Cavalcante Júnior, C. L. Experimental and Simulation Studies for Purification and Etherification of Glycerol from the Biodiesel Industry. AppliedChem 2023, 3, 492–508. [Google Scholar] [CrossRef]
  25. Rahman, H. Purifying Crude Glycerol from Biodiesel Production for Sustainable Energy Solutions. Jurnal Teknologi 2023, 11, 85–99. [Google Scholar] [CrossRef]
  26. Perez, F. M.; Gatti, M. N.; Fermanelli, C. S.; Saux, C.; Renzini, M. S.; Pompeo, F. Crude glycerol esterification using biomass-derived carbon acid catalysts. Next Materials 2024, 2, 100125. [Google Scholar] [CrossRef]
  27. Sidhu, M. S.; Roy, M.; Elsanusi, O. A. Comparative Analysis of Water and Glycerin Emulsification: Particle Size, Stability, Engine Performance, and Emissions in Biodiesel Fuels. Journal of Renewable Energy 2024, 1, 2357238. [Google Scholar] [CrossRef]
  28. Bansod, Y.; Crabbe, B.; Forster, L.; Ghasemzadeh, K.; D’Agostino, C. Evaluating the environmental impact of crude glycerol purification derived from biodiesel production: A comparative life cycle assessment study. Journal of Cleaner Production 2024, 437, 140485. [Google Scholar] [CrossRef]
  29. Roschat, W.; Donrussamee, S.; Smanmit, P.; Jikjak, S.; Leelatam, T.; Phewphong, S.; Namwongsa, K.; Moonsin, P.; Promarak, V. Quality Improvement of Crude Glycerol from Biodiesel Production Using Activated Carbon Derived from Krabok (Irvingia malayana) Seed Shells. Korean Journal of Materials Research 2024, 34, 1–11. [Google Scholar] [CrossRef]
  30. Agrawal, P. S.; Tiwari, R. Synthesis of Solketal: A Potent Fuel Additive from A Glycerol. A Byproduct of Biodiesel Industries 2024, 5, 371–402. [Google Scholar]
  31. Ruzibayev, A.; Abdurakhimov, A.; Calvo-Gómez, O.; Akhmedova, S.; Kurambayev, S. Purification of Crude Glycerol Derived from Hydrogenated Cottonseed and Its Use in Confectionary Products. Rural Sustainability Research 2024, 51, 81–93. [Google Scholar] [CrossRef]
  32. Pilicita, J.; Domínguez, J. A.; Torresano, C.; Salazar, B. Analysis of the use of waste cooking oil as an alternative fuel. Multidisciplinar 2025, 3, 204–212. [Google Scholar] [CrossRef]
  33. Наумoва, Н. Л.; Bec, Y. Development of vegetable oil blends with a balanced fatty acid composition. Vestnik Krasnoârskogo Gosudarstvennogo Agrarnogo Universiteta 2025, 12, 203–210. [Google Scholar]
  34. Heywood, J.; Rannacher, R. An Analysis of Stability Concepts for the Navier-Stokes Equations. Journal für die Reine und Angewandte Mathematik 1986, 372, 1–33. [Google Scholar]
  35. Gordon, L.V. The Measurement of Interpersonal Values; Science Research Associates: Chicago, IL, 1975. [Google Scholar]
  36. Metzger, M.J. Making sense of credibility on the Web: Models for evaluating online information and recommendations for future research. Journal of the American Society for Information Science and Technology 2007, 58, 2078–2091. [Google Scholar] [CrossRef]
Figure 1. Schematic diagram of the experimental system.
Preprints 187600 g001
Figure 2. Photograph of the Gas Chromatography (GC) analyzer and gas sampling cylinders.
Preprints 187600 g002
Figure 3. Photograph of the vegetable oil.
Preprints 187600 g003
Figure 4. Photograph of (a) vegetable oil, (b) waste glycerol oil, and (c) mixing oil.
Preprints 187600 g004
Figure 5. Photograph of small furnace.
Preprints 187600 g005
Figure 6. Photograph of cube mushroom pack.
Preprints 187600 g006
Figure 7. The computation domain of the small furnace with different zones.
Preprints 187600 g007
Figure 8. Pressure distribution (center zone) along the furnace for mixing oil (Glycerol : Used vegetable oil, 70:30) at (a) equivalence ratios = 0.8 by mole and (b) equivalence ratios = 1.2 by mole.
Preprints 187600 g008
Figure 9. Temperature distribution (center zone) along the furnace for mixing oil (Glycerol : Used vegetable oil, 70:30) at (a) equivalence ratios = 0.8 by mole and (b) equivalence ratios = 1.2 by mole.
Preprints 187600 g009
Figure 10. Temperature contour for mixing oil (Glycerol : Used vegetable oil, 70:30) at (a) equivalence ratios = 0.8 by mole and (b) equivalence ratios = 1.2 by mole.
Preprints 187600 g010
Figure 11. Gases distributions (CO2, O2 Mole fraction along the furnace for mixing oil (Glycerol : Used vegetable oil, 70:30) at (a) equivalence ratios = 0.8 by mole and (b) equivalence ratios = 1.2 by mole.
Preprints 187600 g011
Figure 12. Effect of equivalent ratios on the combustion gases ( C O 2 , H 2 O , N 2 , O 2 CO , H 2
Preprints 187600 g012
Figure 13. Flame temperatures from three different oils.
Preprints 187600 g013
Table 1. Fuel ratios used in the testing.
No. Fuels Ratios (%)
1 Upper; used vegetable oil 100
2 Lower; used vegetable oil 100
3 Upper; oil mixture (used vegetable oil/waste glycerol) 90:10
4 Lower; oil mixture (used vegetable oil/waste glycerol) 90:10
5 Upper; oil mixture (used vegetable oil/waste glycerol) 50:50
6 Lower; oil mixture (used vegetable oil/waste glycerol) 50:50
7 Upper; oil mixture (used vegetable oil/waste glycerol) 75:25
8 Lower; oil mixture (used vegetable oil/waste glycerol) 75:25
9 Upper; waste glycerol 100
10 Lower; waste glycerol 100
Table 2. Thermodynamic properties that change with distance (L(x)).
Specific internal energy,
volume, entropy, enthalpy, [Ferguson,1986]
Fuels [Metzger, 2007]
(Glycerol and vegetable oil (Vapor phase)
Preprints 187600 i002Preprints 187600 i004 Preprints 187600 i003Preprints 187600 i005
Air & Gas Combustion product, [Grill 2007]
Preprints 187600 i006
Table 3. Chemical equilibrium from the combustion products.
C O 2 C O + 1 2 O 2
H 2 + 1 2 O 2 H 2 O
1 2 H 2 + 1 2 O 2 O H
1 2 N 2 N
1 2 O 2 + 1 2 N 2 N O
1 2 H 2 H
1 2 O 2 O
K 1 = y 5 y 4 1 / 2 P 1 / 2 y 1
K 2 = y 2 y 4 1 / 2 y 6 P 1 / 2
K 3 = y 9 y 4 1 / 2 y 6 1 / 2
K 4 = y 7 P 1 / 2 y 6 1 / 2
K 5 = y 8 P 1 / 2 y 4 1 / 2
K 6 = y 11 P 1 / 2 y 3 1 / 2
K 7 = y 10 y 4 1 / 2 y 3 1 / 2
Table 4. Variations of gases in the exhaust gases.
No. Sample Name Ratio H2 (%) Air (%) CH4 (%) CO2 (%)
1 Up Oil 100 nd. 74.295 nd. 25.705
2 Down Oil 100 nd. 73.050 nd. 26.950
3 Up Oil:Gly 90:10 2.442 74.183 nd. 23.375
4 Down Oil:Gly 90:10 2.497 74.076 nd. 23.427
5 Up Oil:Gly 50:50 4.805 75.019 4.360 15.816
6 Down Oil:Gly 50:50 5.419 75.720 4.378 14.483
7 Up Oil:Gly 75:25 nd. 75.222 nd. 24.778
8 Down Oil:Gly 75:25 nd. 74.916 nd. 25.084
9 Up Gly 100 3.902 73.173 4.323 18.601
10 Down Gly 100 nd. 79.149 nd. 20.851
nd.= not detected.
Table 5. Variation of combustion efficiency (Glycerol/Used vegetable coil: 10:90).
No, Air flow rate
(m3/min.)

Fuel weight (g)
Surface temperature (oC) Flame temperature (oC) Combustion efficiency (%)
1 1.30 1000 200 490 91
2 1.31 1000 195 485 90
3 1.32 1000 198 485 92
Table 6. Thermal efficiency.
Details Test I Test II Test III
mw = Remaining water (kg) 2.7 2.4 3.6
mS = Evaporated water (kg) 3.3 3.6 2.4
mf = mass of fuel; (kg) 6.3 6.8 5.8
hw = Enthalpy of residual water (kJ.kg-1) 117.4 109.1 109.1
hf = Enthalpy of saturated liquids (kJ.kg-1) 417.5 417.5 417.5
hS = Enthalpy of saturated vapor (kJ.kg-1) 2,674 2,674 2,674
HV = Calorific value of fuel (kJ.kg-1) 13,476 13,476 13,476
Combustion furnace efficiency (%) 99.4 99.3 99.1
Boiling steam flow rate (m3/min) 6.1 6 6.1
Boiling steam temperature (oC) 112 115 114
Stove Efficiency 81.3 88.6 83.5
Heat exchange area m2 (Radius=0.2 m) 0.5 0.5 0.5
Heat exchange efficiency (%) 90 90 90
Boiler efficiency (%) 72.8 73.1 72.2
Disclaimer/Publisher’s Note: The statements, opinions and data contained in all publications are solely those of the individual author(s) and contributor(s) and not of MDPI and/or the editor(s). MDPI and/or the editor(s) disclaim responsibility for any injury to people or property resulting from any ideas, methods, instructions or products referred to in the content.
Copyright: This open access article is published under a Creative Commons CC BY 4.0 license, which permit the free download, distribution, and reuse, provided that the author and preprint are cited in any reuse.
Prerpints.org logo

Preprints.org is a free preprint server supported by MDPI in Basel, Switzerland.

Subscribe

Disclaimer

Terms of Use

Privacy Policy

Privacy Settings

© 2025 MDPI (Basel, Switzerland) unless otherwise stated