
Submitted:
01 December 2025
Posted:
03 December 2025
You are already at the latest version
Abstract
Accurate and rapid measurement of junction temperature is critical for optimizing the performance and ensuring the longevity of a super luminescent diode. However, due to diverse diode structure, direct measuring and monitoring the junction temperature of a super luminescent diode are often challenging and impractical. We propose a non-invasive methodology to precisely determine the junction temperature and spectral characteristics of a super luminescent diode. This method utilizes a modified static modulated Fourier-transform spectrometer alongside a generalized analyzing expression derived from Gaussian components. Fast acquisition of spectral information is achieved through the modified static modulated Fourier-transform spectrometer and analyzing method. The proposed model exceptional accuracy, yielding an average coefficient of determination R2, of 0.99 across a range of operating currents and junction temperatures. Our analysis reveals a distinct linear correlation between the extracted fitting parameters-specifically, the carrier temperature, the spectral shape parameter and the physical junction temperature. These findings demonstrate that critical internal physical conditions of the diode can be accurately inferred directly from its measured spectrum, providing a robust tool for device characterization.
Keywords:
spectral characteristics
; Gaussian curve fitting
; non-linear least square method
; spectral information
; junction temperature
; Fourier-transform
; spectrometer
1. Introduction
Super luminescent diodes are essential components widely used in various optical applications, ranging from optical coherence tomography to fiber-optic sensors [1,2]. For these devices, accurate modeling of spectral information is crucial, not only for understanding device performance but also for diagnosing internal physical processes, such as thermal behavior [3,4]. One of the most significant factors affecting the lifespan and stability of these diodes is the junction temperature, which is, however, challenging to measure directly during operation [5,6].
The spectral characteristics of these sources can be effectively estimated using Gaussian curve fitting techniques [3,7]. This modeling approach involves a reciprocal relationship: if the fitting parameters are precisely defined, the spectral characteristics can be accurately estimated; conversely, if the spectral information is acquired experimentally, the corresponding internal physical parameters of the Super luminescent diodes or light-emitting diodes can be inferred [8,9,10].
This work focuses on utilizing a generalized analytical expression based on spectral line components to model the measured spectra of a super luminescent diode. Specifically, we employ a modified static modulated Fourier-transform spectrometer to obtain rapid spectral data. It allows for relatively fast measurement (in the order of microseconds) compared to a conventional dynamic modulated Fourier transform spectrometer [11]. Due to the diverse structures of these diodes, directly measuring and monitoring the junction temperature of a super luminescent diode is often challenging and impractical [7,12]. Therefore, evaluating the performance of the super luminescent diode through its characteristics is a more effective and accurate method for assessment [13].
We then investigate the relationship between the fitting parameters obtained through the nonlinear least squares method and the device's operating conditions, specifically current and junction temperature [1,8,12]. Furthermore, this study establishes the quantitative connections between the extracted carrier temperature and external conditions, providing a robust method for non-invasive temperature estimation [5,14].
2. Methodology
Most commercially available spectrometers rely on a scanning mechanism. This design renders them inadequate for applications that require the monitoring of optical characteristics that vary rapidly with respect to changing operating conditions.
To address this limitation, the static modulated Fourier-transform spectrometer is employed. Unlike traditional scanning instruments, the static modulated Fourier-transform spectrometer generates an interferogram as a function of space, making it ideally suited for the real-time, instantaneous monitoring of the optical properties of light sources.
The static modulated Fourier-transform spectrometer comprising a modified Sagnac interferometer which is one of popular configurations. It consists of a beam splitter, two mirrors, a focusing lens, and a detector, as shown in Figure 1. Emission from the optical source is collected and collimated by the collective optics. The collected light enters the static modulated Fourier-transform spectrometer. It is split into two separate beams at the beam splitter. Since two mirrors are asymmetrically displaced from the beamsplitter, the separated beams travel different optical paths. The two beams are subsequently recombined at the beamsplitter. This difference in optical path difference causes the beams to interfere, generating a spatially distributed interferogram.
By performing a Fourier-transform on the measured interferogram, the corresponding spectral information is obtained. The resulting spectrum is substantially affected by changes in temperature and operating current. Analyzing these spectral changes provides insight into how the light-emitting diode is influenced by its operating conditions. The analytical expression for estimating the spectrum related to a light-emitting diode is given as:
where is a frequency of a light-emitting diode, is a peak frequency of a light-emitting diode, is the Planck constant, is the Boltzmann constant, is a carrier temperature, and , , , ,, and are fitting parameters. The numerator of the original frequency-based expression shows that the terms represent distinct spectral features: the first term represents a growing spectral line, the second term represents a decaying spectral line, and the third term is an additional component introduced to improve similarity.
In the static modulated Fourier-transform spectrometer, the obtained spectral information is a function of wavenumber, which can be converted from the frequency of the light source as follows:
where is the speed of light, is a wavelength corresponding to , and is a wavenumber corresponding to . Equation (1) can be reformulated using Equation (2), as follows:
where is the peak wavenumber corresponding to and serves as a fitting parameter in the wavenumber domain. The advantage of this equation over Eq. (1) is that the parameter values are significantly larger, which allows for more accurate estimation. Equation (3) can be solved from the obtained spectral information using the least squares method. Specifically, information such as the peak wavenumber and junction temperature, along with the operating condition of the optical source, can be obtained. These parameters are then used to estimate the emission spectrum. The concept of this procedure is depicted in Figure 2.
The carrier temperature is expressed as a function of the junction temperature . The carrier temperature is known to be typically higher than the junction temperature. The relationship between the carrier temperature and the junction temperature is modeled linearly using Equation (4).
where is expected to be related to electrical bias condition on materials, mainly influenced by current. The junction temperature is calculated using Eq. (4)
The intensity of emission from the source is expected to be related to three fitting parameters, , , and . Given that the intensity varies exponentially, this relationship is expressed as follows:
where is the emission intensity, while , , and are fitting parameters determined via the method of the least squares.
3. Results and discussions
The parameters in Equation (3) are calculated using the nonlinear least squares method applied to the measured spectrum. This process allows for the estimation of spectral characteristics and, conversely, the inference of corresponding LED parameters given the spectral information. This process can also be used specifically to estimate the temperature from the spectrum.
Figure 3 shows the measured spectrum and the fitting results. In Figure 3a, a solid line shows the spectrum obtained using the static modulated Fourier-transform spectrometer, while a dashed line shows the fitted spectrum calculated using Equation (3).
For this experiment, a source current was fixed at 0.55 A, and the junction temperature was varied from 25 °C to 45 °C in increments of 5 °C. During the calculation, several parameters were held constant: = 1, == 6422.11 cm−1, and = 0.1. When least square method is applied to extract the parameters from the spectrum at a temperature of 25°C, the results were: = 4.031×10⁻⁵, =7.884×10⁻⁷, = 0.008066, =244.4 °C.
Figure 3(b) shows carrier temperature as a function of junction temperature. The carrier temperature increases from 244.4 °C to 264.8 °C, while the junction temperature increases from 25 °C to 45 °C. The relationship between the carrier temperature and the junction temperature is calculated using Equation (4), which is depicted by the dashed line. Fitting parameters representing the intensity of emission are investigated, shown in Figure 3c,d. remains constant with respect to the junction temperature. As the junction temperature increases, parameters, and , increase. At 45 °C, and are 8.915×10⁻⁵ and 7.127×10⁻⁶, respectively. The remaining fitting parameter, , is analyzed as a function of junction temperature, as shown in Figure 3e. It is linearly related to the junction temperature and increases as the junction temperature rises. At 45 °C, is 0.008383.
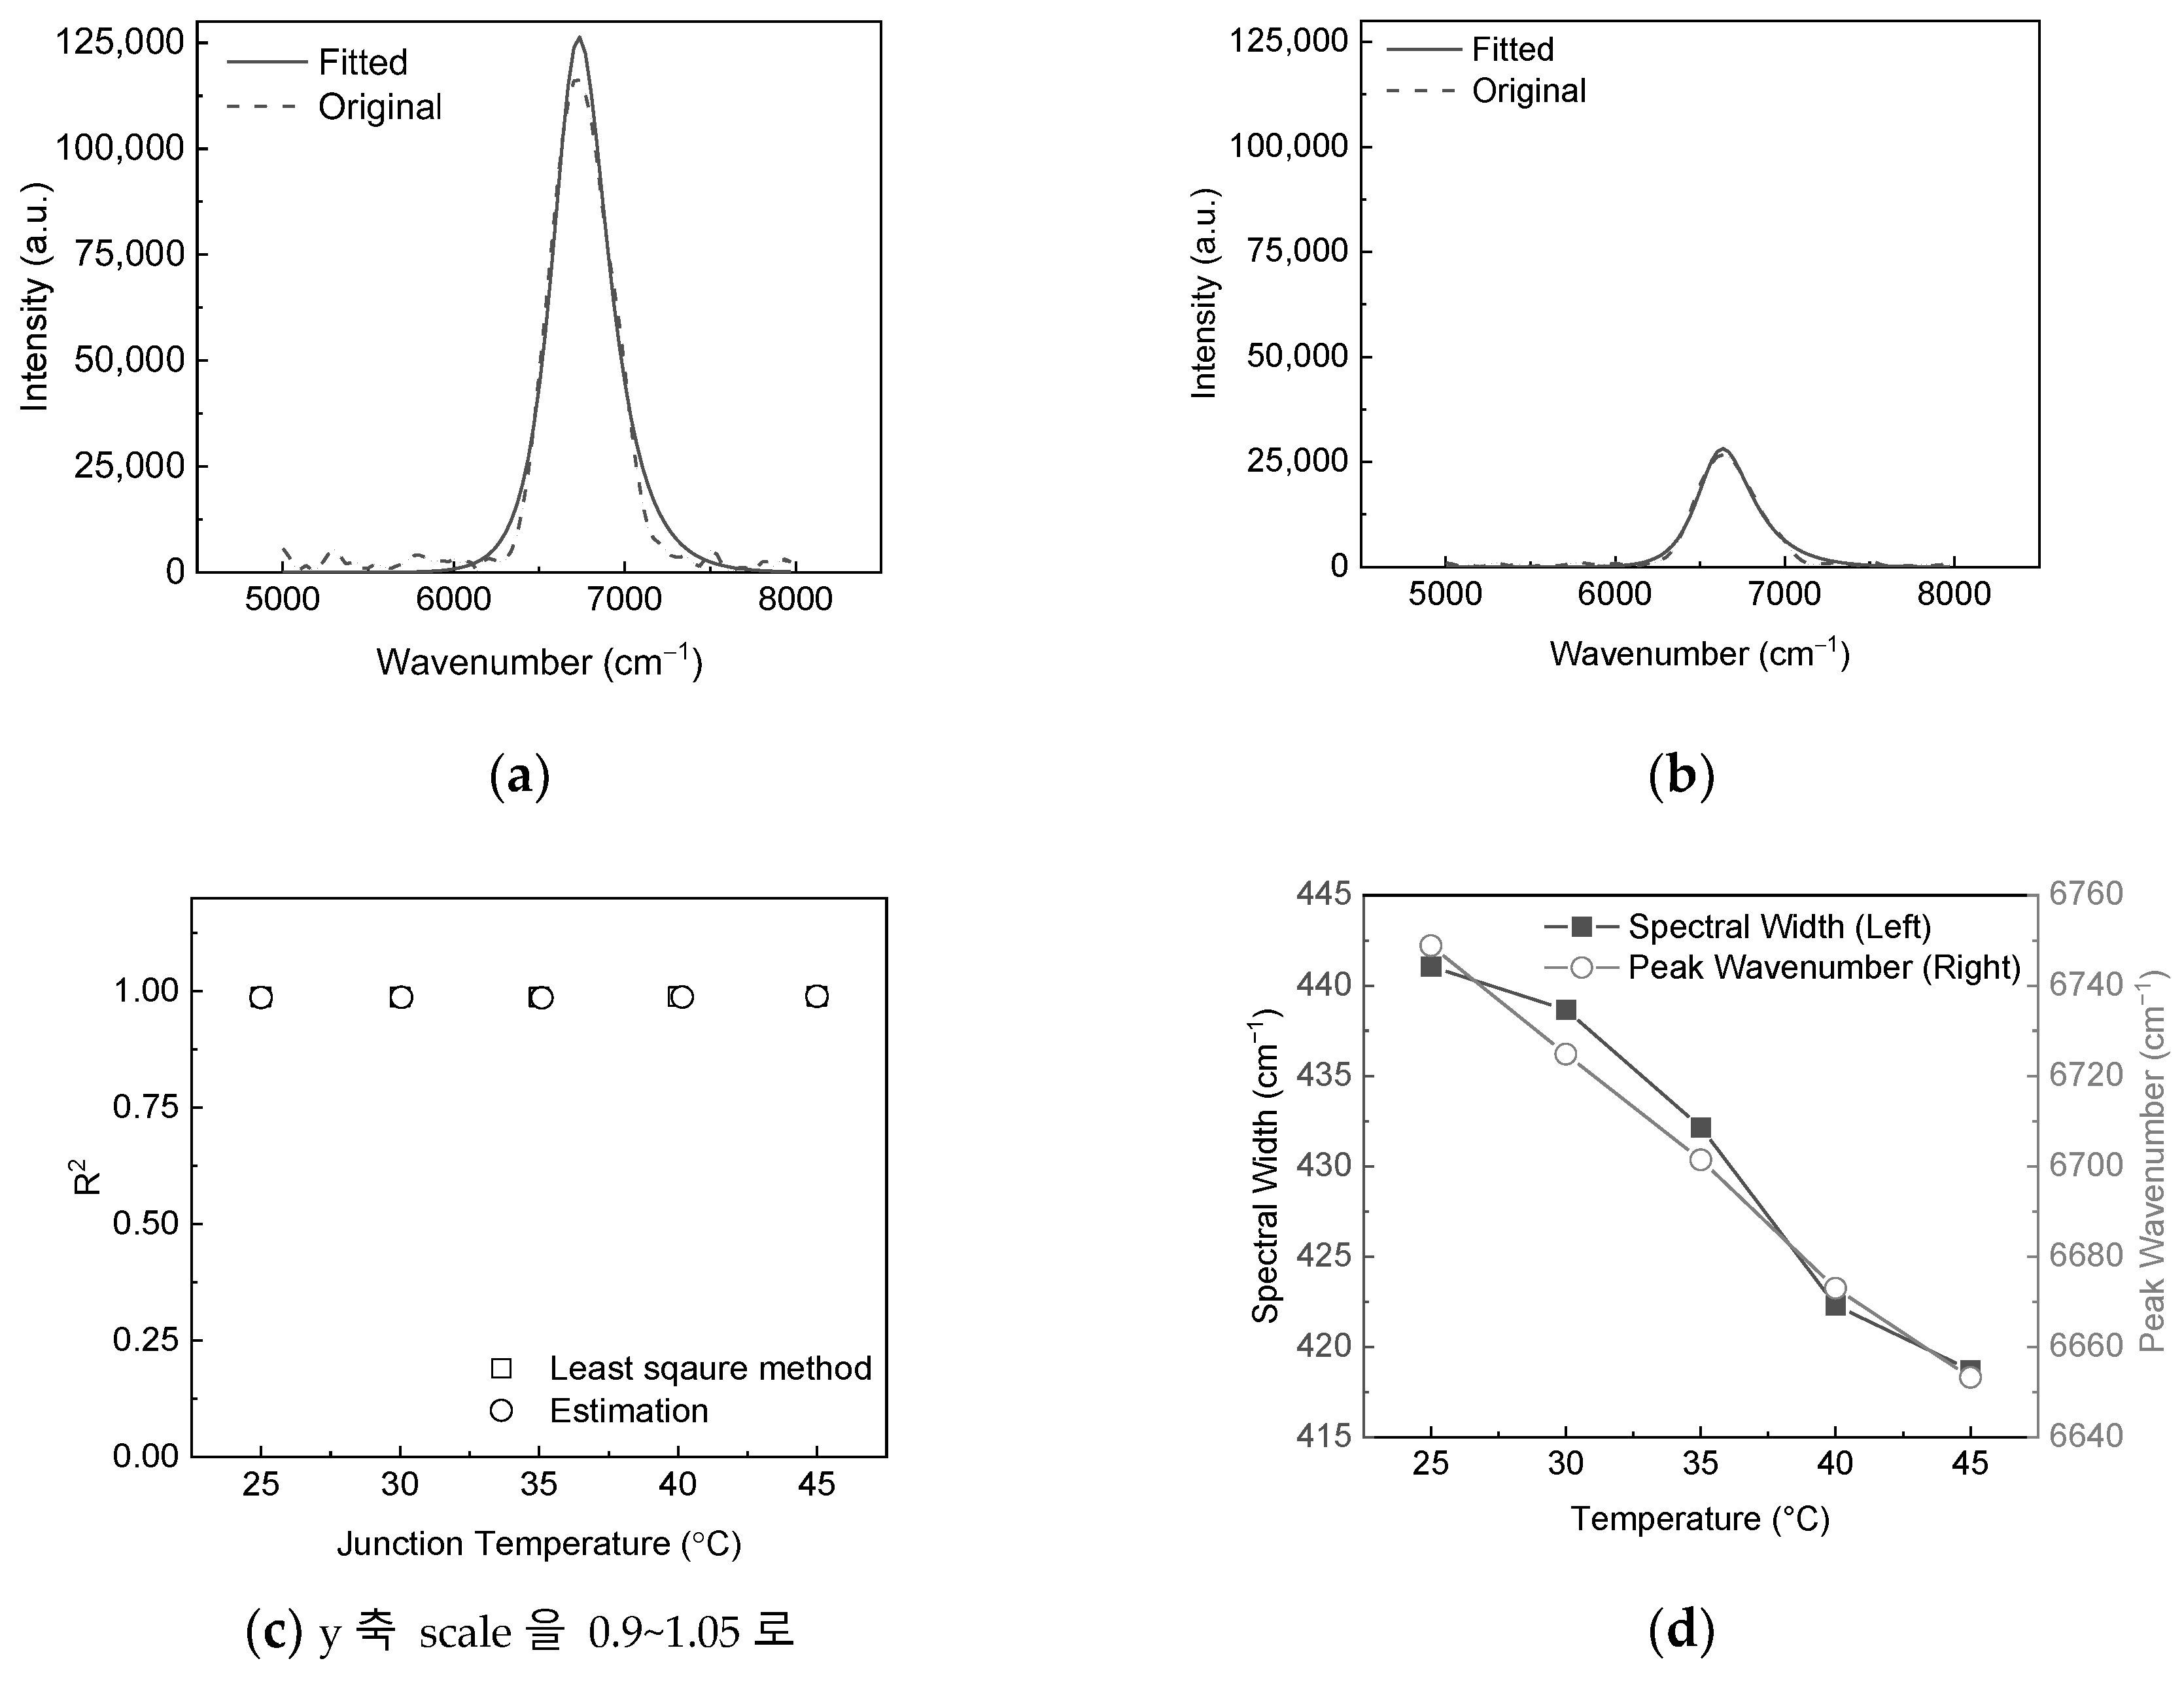
The spectrum is calculated using parameters obtained from Eq. (3). Figure 4 shows the estimated spectrum and optical characteristics at various temperatures. The estimated spectra at 25 °C and 45 °C are compared to those obtained using the static modulated Fourier-transform spectrometer, as shown in Figure 4a,b. To evaluate the accuracy of the estimated spectrum, the coefficient of determination R2 is calculated, as shown in Figure 4c. Hollow rectangles represent the spectrum calculated using the least squares method, while the hollow circles represent the estimated spectrum calculated using the extracted parameters. In both cases, the average R2 is 0.99, indicating high accuracy for both the extracted parameter and the estimated spectrum.
The variation of spectral width and peak wavenumber was investigated across the temperature range, as shown in Figure 4d. At 25 °C, the spectral width and the peak wavenumber are 441.06 cm−1, and 6748.83 cm−1, respectively. As the temperature rises, both the spectral width and the peak wavenumber decrease. At 45 °C, the spectral width and the peak wavenumber are 418.72 cm−1, and 6653.24 cm−1, respectively.
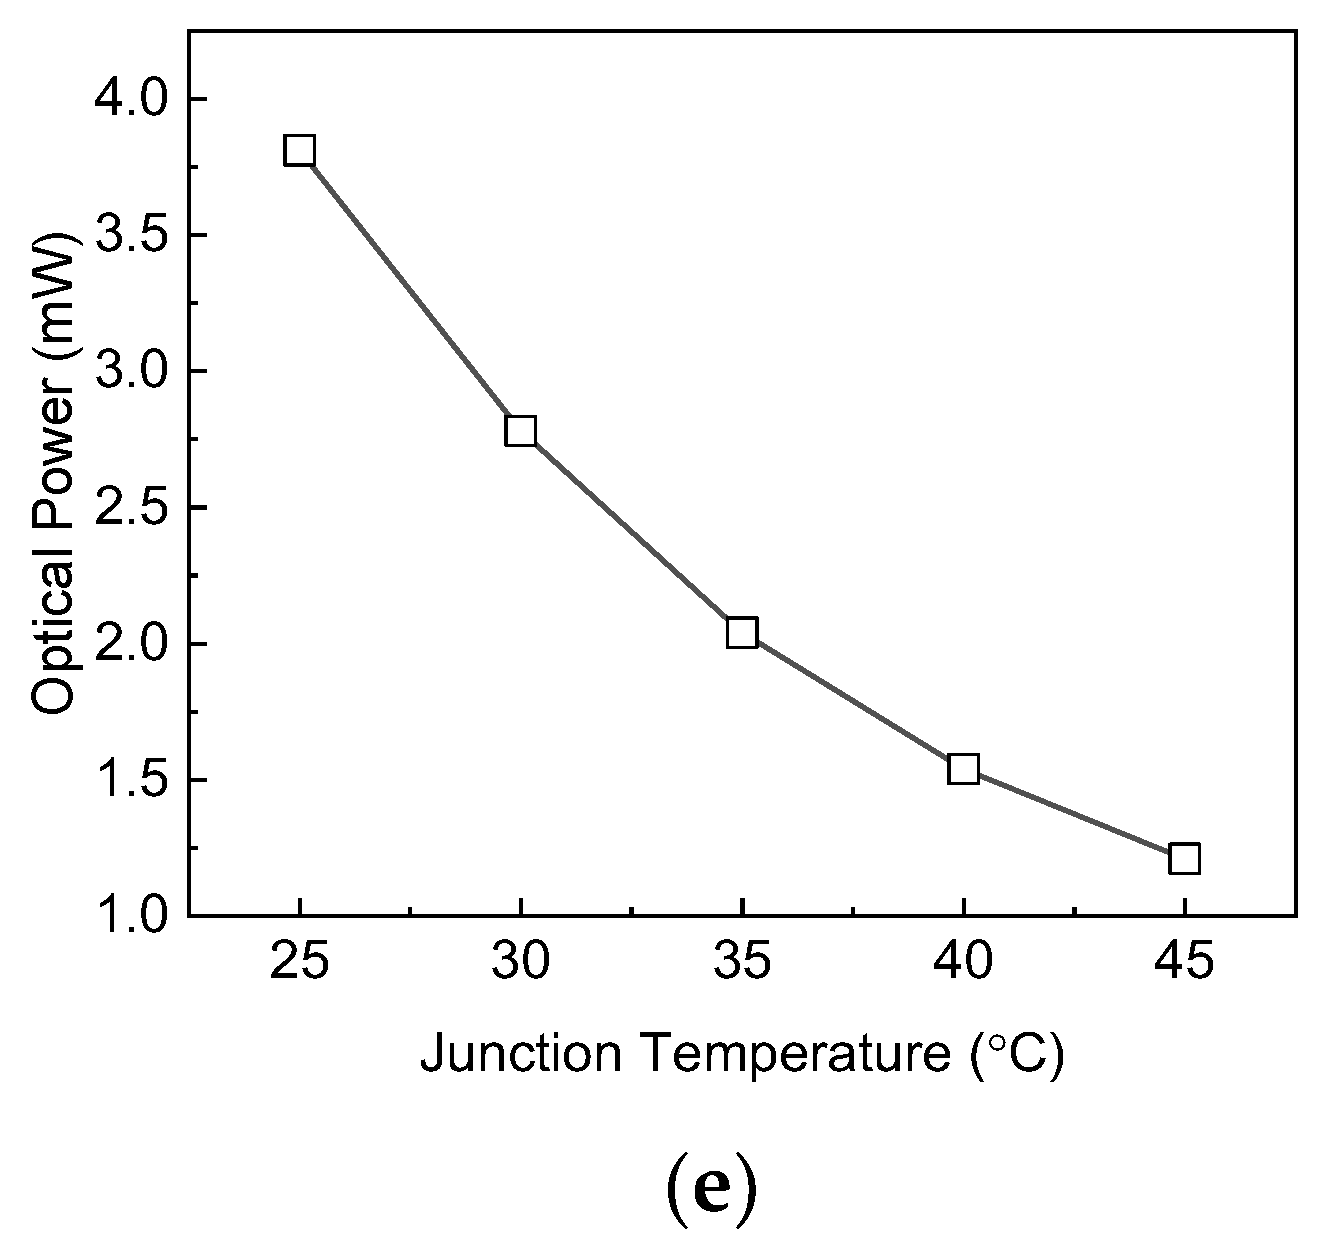
The optical power of the source was measured using a thermal detector, as shown in Figure 4e. It is noted that in super luminescent diodes, the optical power output is significantly affected by temperature variations, particularly at high operating currents. The optical power was measured to be 3.81 mW at 25 °C, while it dropped to 1.21 mW at 45 °C, representing a significant reduction.
4. Conclusions
We propose a novel approach to evaluate the super luminescent diode performance by combining a modified static modulated Fourier-transform spectrometer with Gaussian curve fitting method to rapidly obtain and estimate its spectral properties. The static modulated Fourier transform spectrometer allows for relatively fast measurement (in the order of microseconds) compared to a conventional dynamic modulated Fourier transform spectrometer [11]. This capability is key to addressing the challenges of impractical and inaccurate super luminescent diode evaluation often encountered due to their diverse internal structures.
This study also presented and validated an analytical expression utilizing Gaussian curve fitting components to estimate the spectral output of super luminescent diodes. The proposed model provides a highly accurate method for spectral estimation, achieving an average coefficient of determination R2 of 0.99 across various operating currents and temperatures.
By applying the nonlinear least squares method to measured spectra from a static modulated Fourier-transform spectrometer, we successfully extracted key fitting parameters. The analysis revealed distinct physical correlations: the carrier temperature, , and the spectral shape parameter, , exhibited clear linear dependencies on the junction temperature. Additionally, the intensity parameters, and , followed an exponential trend with rising temperature, while the optical power decreased significantly as expected.
These results demonstrate that the internal physical state of a super luminescent diode, specifically its junction and carrier temperatures, can be accurately inferred solely from its spectral shape. This approach offers a powerful, non-invasive tool for monitoring device health and thermal performance in real-time applications.
Author Contributions
For research articles with several authors, a short paragraph specifying their individual contributions must be provided. The following statements should be used “Conceptualization, W.K.J; methodology, J.Y.C. and W.K.J.; software, J.Y.C.; validation, J.Y.C. and W.K.J.; formal analysis, J.Y.C. and W.K.J.; investigation, J.Y.C. and W.K.J.; resources, W.K.J.; data curation, J.Y.C. and W.K.J.; writing—original draft preparation, J.Y.C. and W.K.J.; writing—review and editing, J.Y.C. and W.K.J.; visualization, J.Y.C. and W.K.J.; supervision, W.K.J; project administration, W.K.J.; funding acquisition, W.K.J. All authors have read and agreed to the published version of the manuscript.
Funding
This research was funded by a grant from Hanseo University.
Data Availability Statement
Dataset available on request from the authors.
Acknowledgments
The authors thank the anonymous referees for their helpful comments that improved the quality of the manuscript.
Conflicts of Interest
The authors declare no conflicts of interest.
References
- Keppens, A.; Ryckaert, W.R.; Deconinck, G.; Hanselaer, P. Modeling high power light-emitting diode spectra and their variation with junction temperature. J. Appl. Phys. 2010, 108, 043104. [Google Scholar] [CrossRef]
- Schubert, E.F. Light-Emitting Diodes, 2nd ed. N: Cambridge University Press, 2006. [Google Scholar]
- Vaskuri, A.; Baumgartner, H.; Kärhä, P.; Andor, G.; Ikonen, E. Modeling the spectral shape of InGaAlP-based red light-emitting diodes. J. Appl. Phys. 2015, 118, 203103. [Google Scholar] [CrossRef]
- Keppens, A.; Ryckaert, W.R.; Deconinck, G.; Hanselaer, P. High power light-emitting diode junction temperature determination from current-voltage characteristics. J. Appl. Phys. 2008, 104, 093104. [Google Scholar] [CrossRef]
- Ohno, Y. Spectral modeling of high CRI white LEDs. Opt. Eng. 2005, 44, 111302. [Google Scholar] [CrossRef]
- Chen, N.C.; Lien, W.C.; Yang, Y.K.; Shen, C.; Wang, Y.S.; Chen, J.F. Spectral shape and broadening of emission from AlGaInP light-emitting diodes. J. Appl. Phys. 2009, 106, 074514. [Google Scholar] [CrossRef]
- Xi, Y.; Schubert, E.F. Junction-temperature measurement in GaN ultraviolet light-emitting diodes using diode forward voltage method. Appl. Phys. Lett. 2004, 85, 2163. [Google Scholar] [CrossRef]
- Liu, C.-C.; Chen, C.-Y.; Weng, C.-Y.; Wang, C.-C.; Jenq, F.-L.; Cheng, P.-J.; Wang, Y.-H.; Houng, M.-P. Physical parameters extraction from current–voltage characteristic for diodes using multiple nonlinear regression analysis. Solid-State Electron. 2008, 52, 839–843. [Google Scholar] [CrossRef]
- Samuel, A.; Kuo, Y. Estimation of the emission characteristics of solid-state incandescent light emitting devices by linear regression of spectral radiance. Solid-State Electron. 2023, 204, 108651. [Google Scholar] [CrossRef]
- Sikora, R.; Markiewicz, P.; Rózga, P. An accurate model of LED luminaire using measurement results for estimation of electrical parameters based on the multivariable regression method. Metrol. Meas. Syst. 2022, 29, 2–251. [Google Scholar] [CrossRef]
- Cho, J.Y.; Lee, S.; Jang, W.K. Performance-Enhanced Static Modulated Fourier Transform Spectrometer with a Spectral Reconstruction. Sensors 2023, 23, 2603. [Google Scholar] [CrossRef] [PubMed]
- Chou, H.-Y.; Yang, T.-H. Dependence of emission spectra of LEDs upon junction temperature and driving current. J. Light Visual Environ. 2008, 32, 183. [Google Scholar] [CrossRef]
- Raggiunto, S.; Belli, A.; Palma, L.; Ceregioli, P.; Gattari, M.; Pierleoni, P. An Efficient Method for LED Light Sources Characterization. Electronics 2019, 8, 10–1089. [Google Scholar] [CrossRef]
- Norde, H. A modified forward I–V plot for Schottky diodes with high series resistance. J. Appl. Phys. 1979, 50, 5052–5053. [Google Scholar] [CrossRef]
Figure 1.
A static Fourier-transform spectrometer comprising a modified Sagnac interferometer for detecting the emission spectrum of a light-emitting diode. The key components are labeled as follows: M1 and M2 are mirrors; BS is a beamsplitter; CL is a collective lens; S is the optical source (light-emitting diode); C is the controller for both temperature and current of the optical source; D is the detector. The region labeled IO indicates the overlapped sector where the two interfering beams generate an interferogram as a function of space.
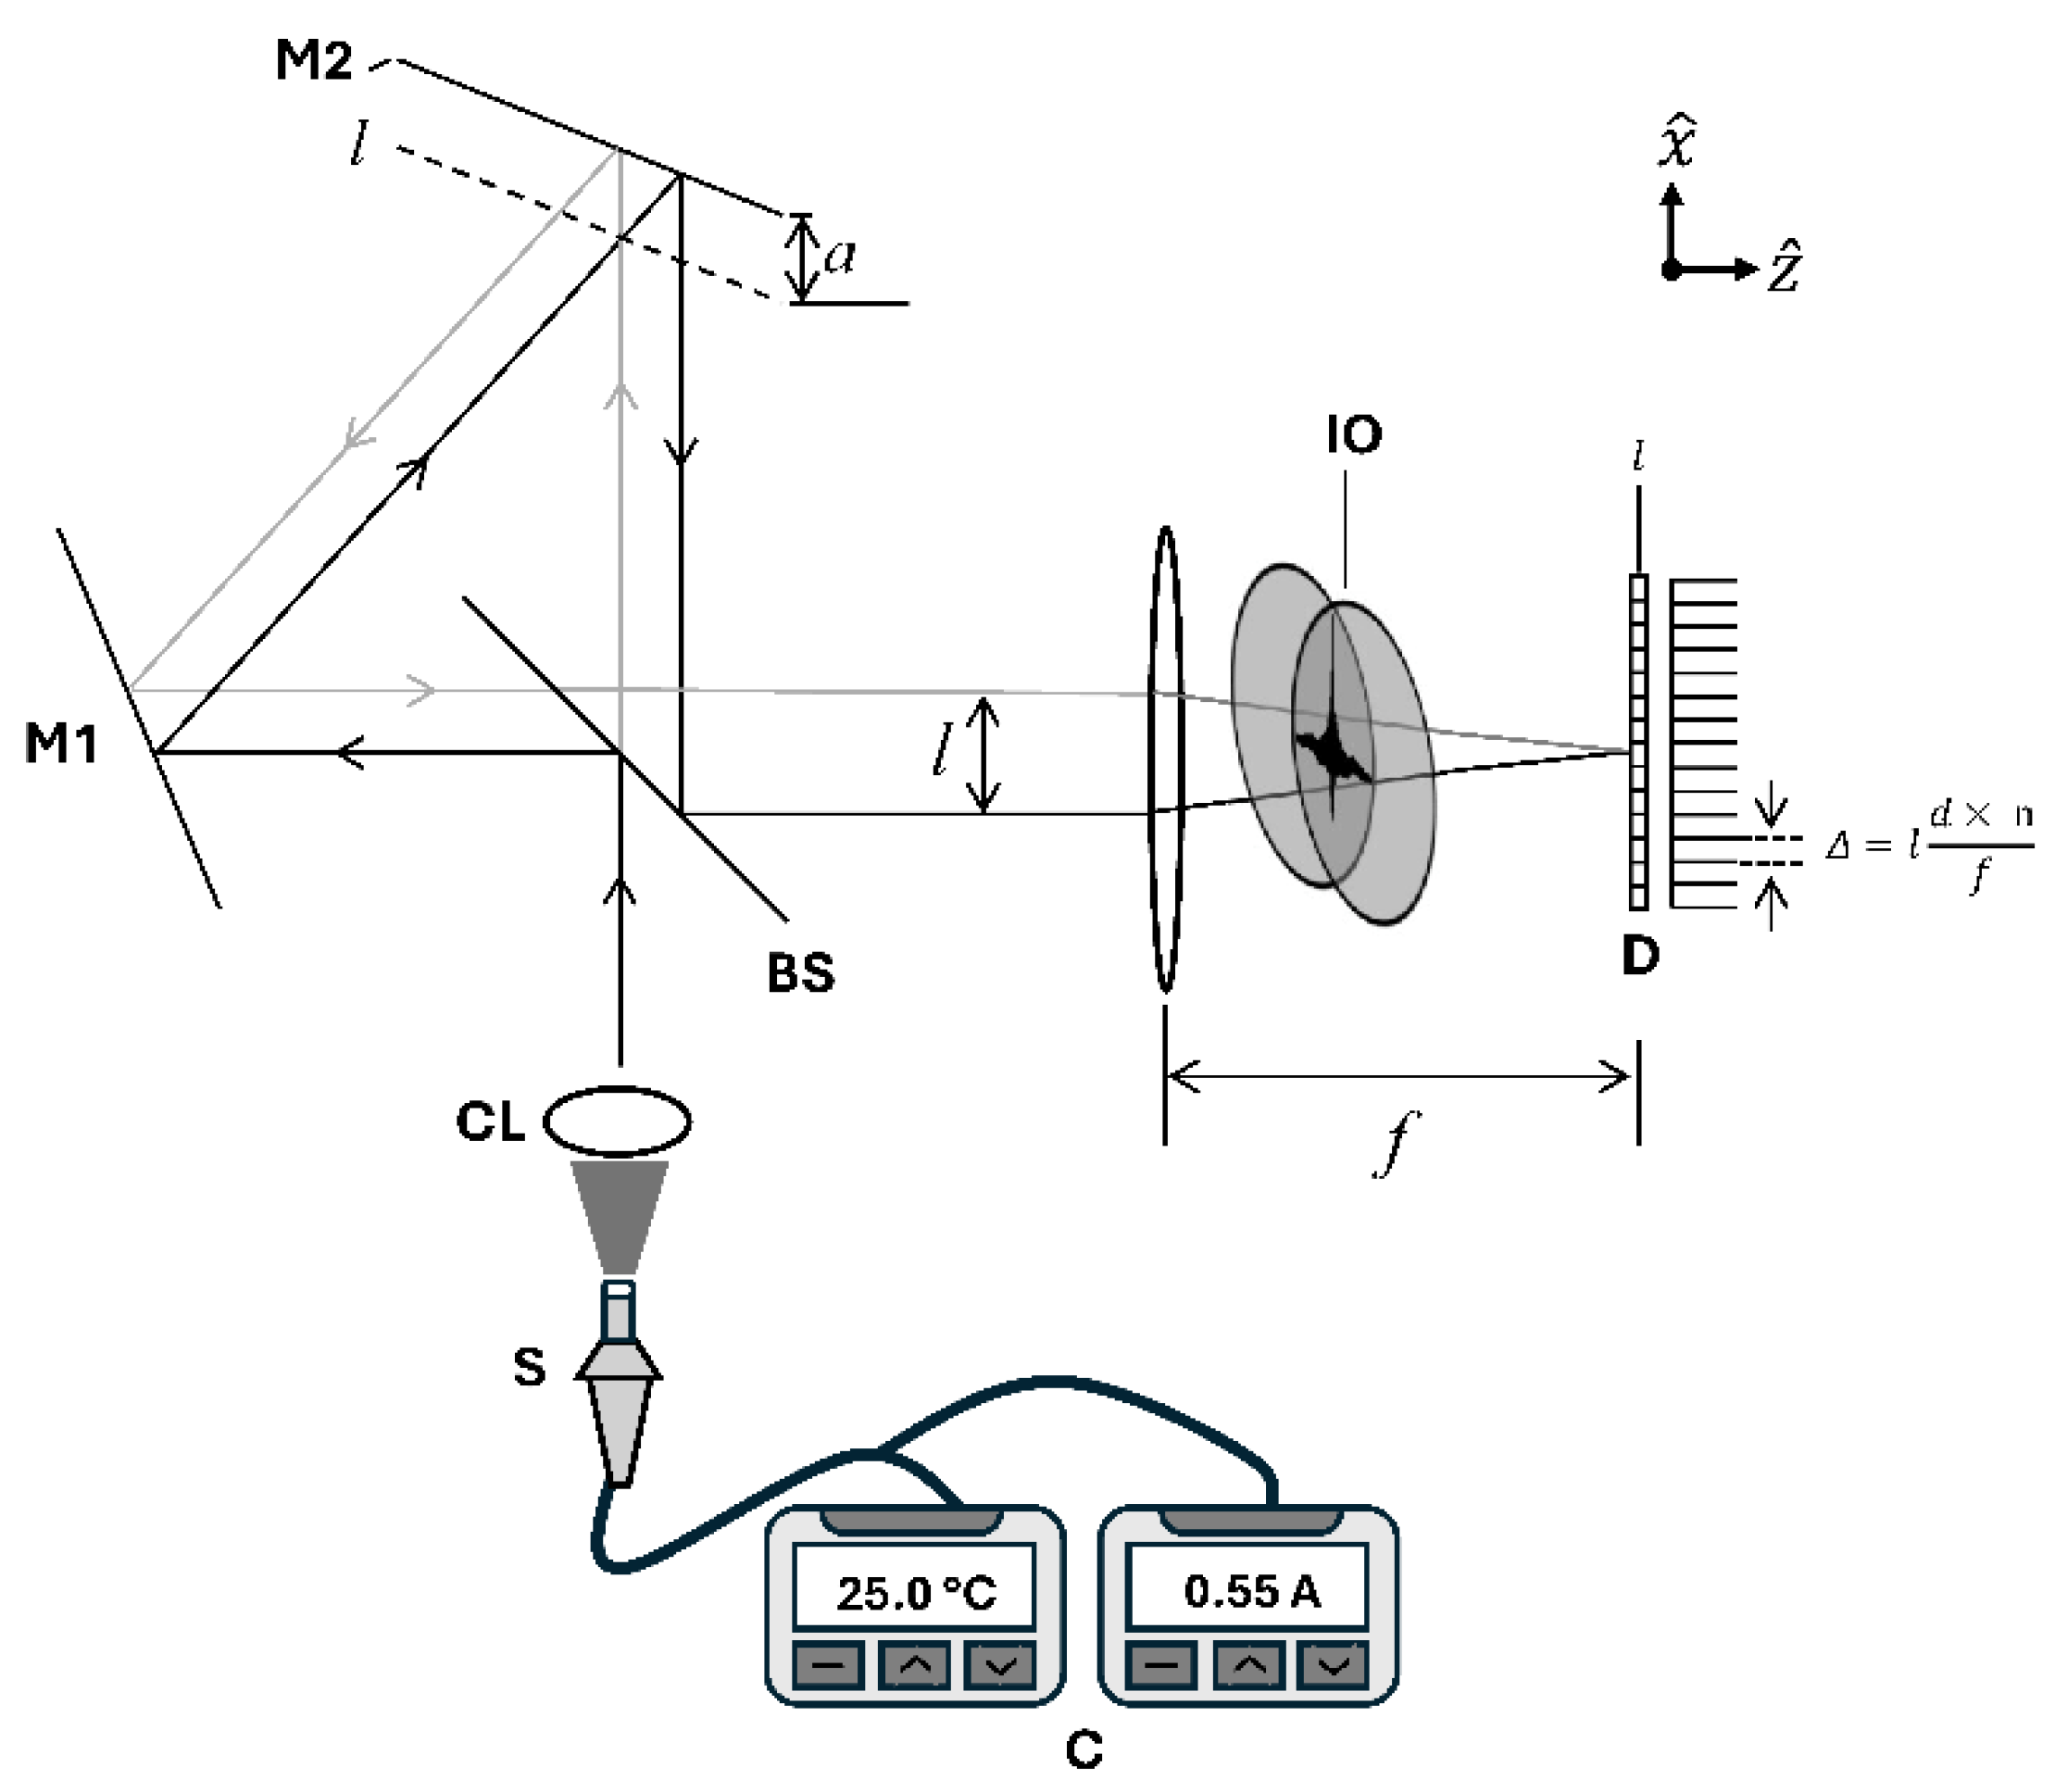
Figure 2.
A concept of estimating optical characteristics of a light-emitting diode.
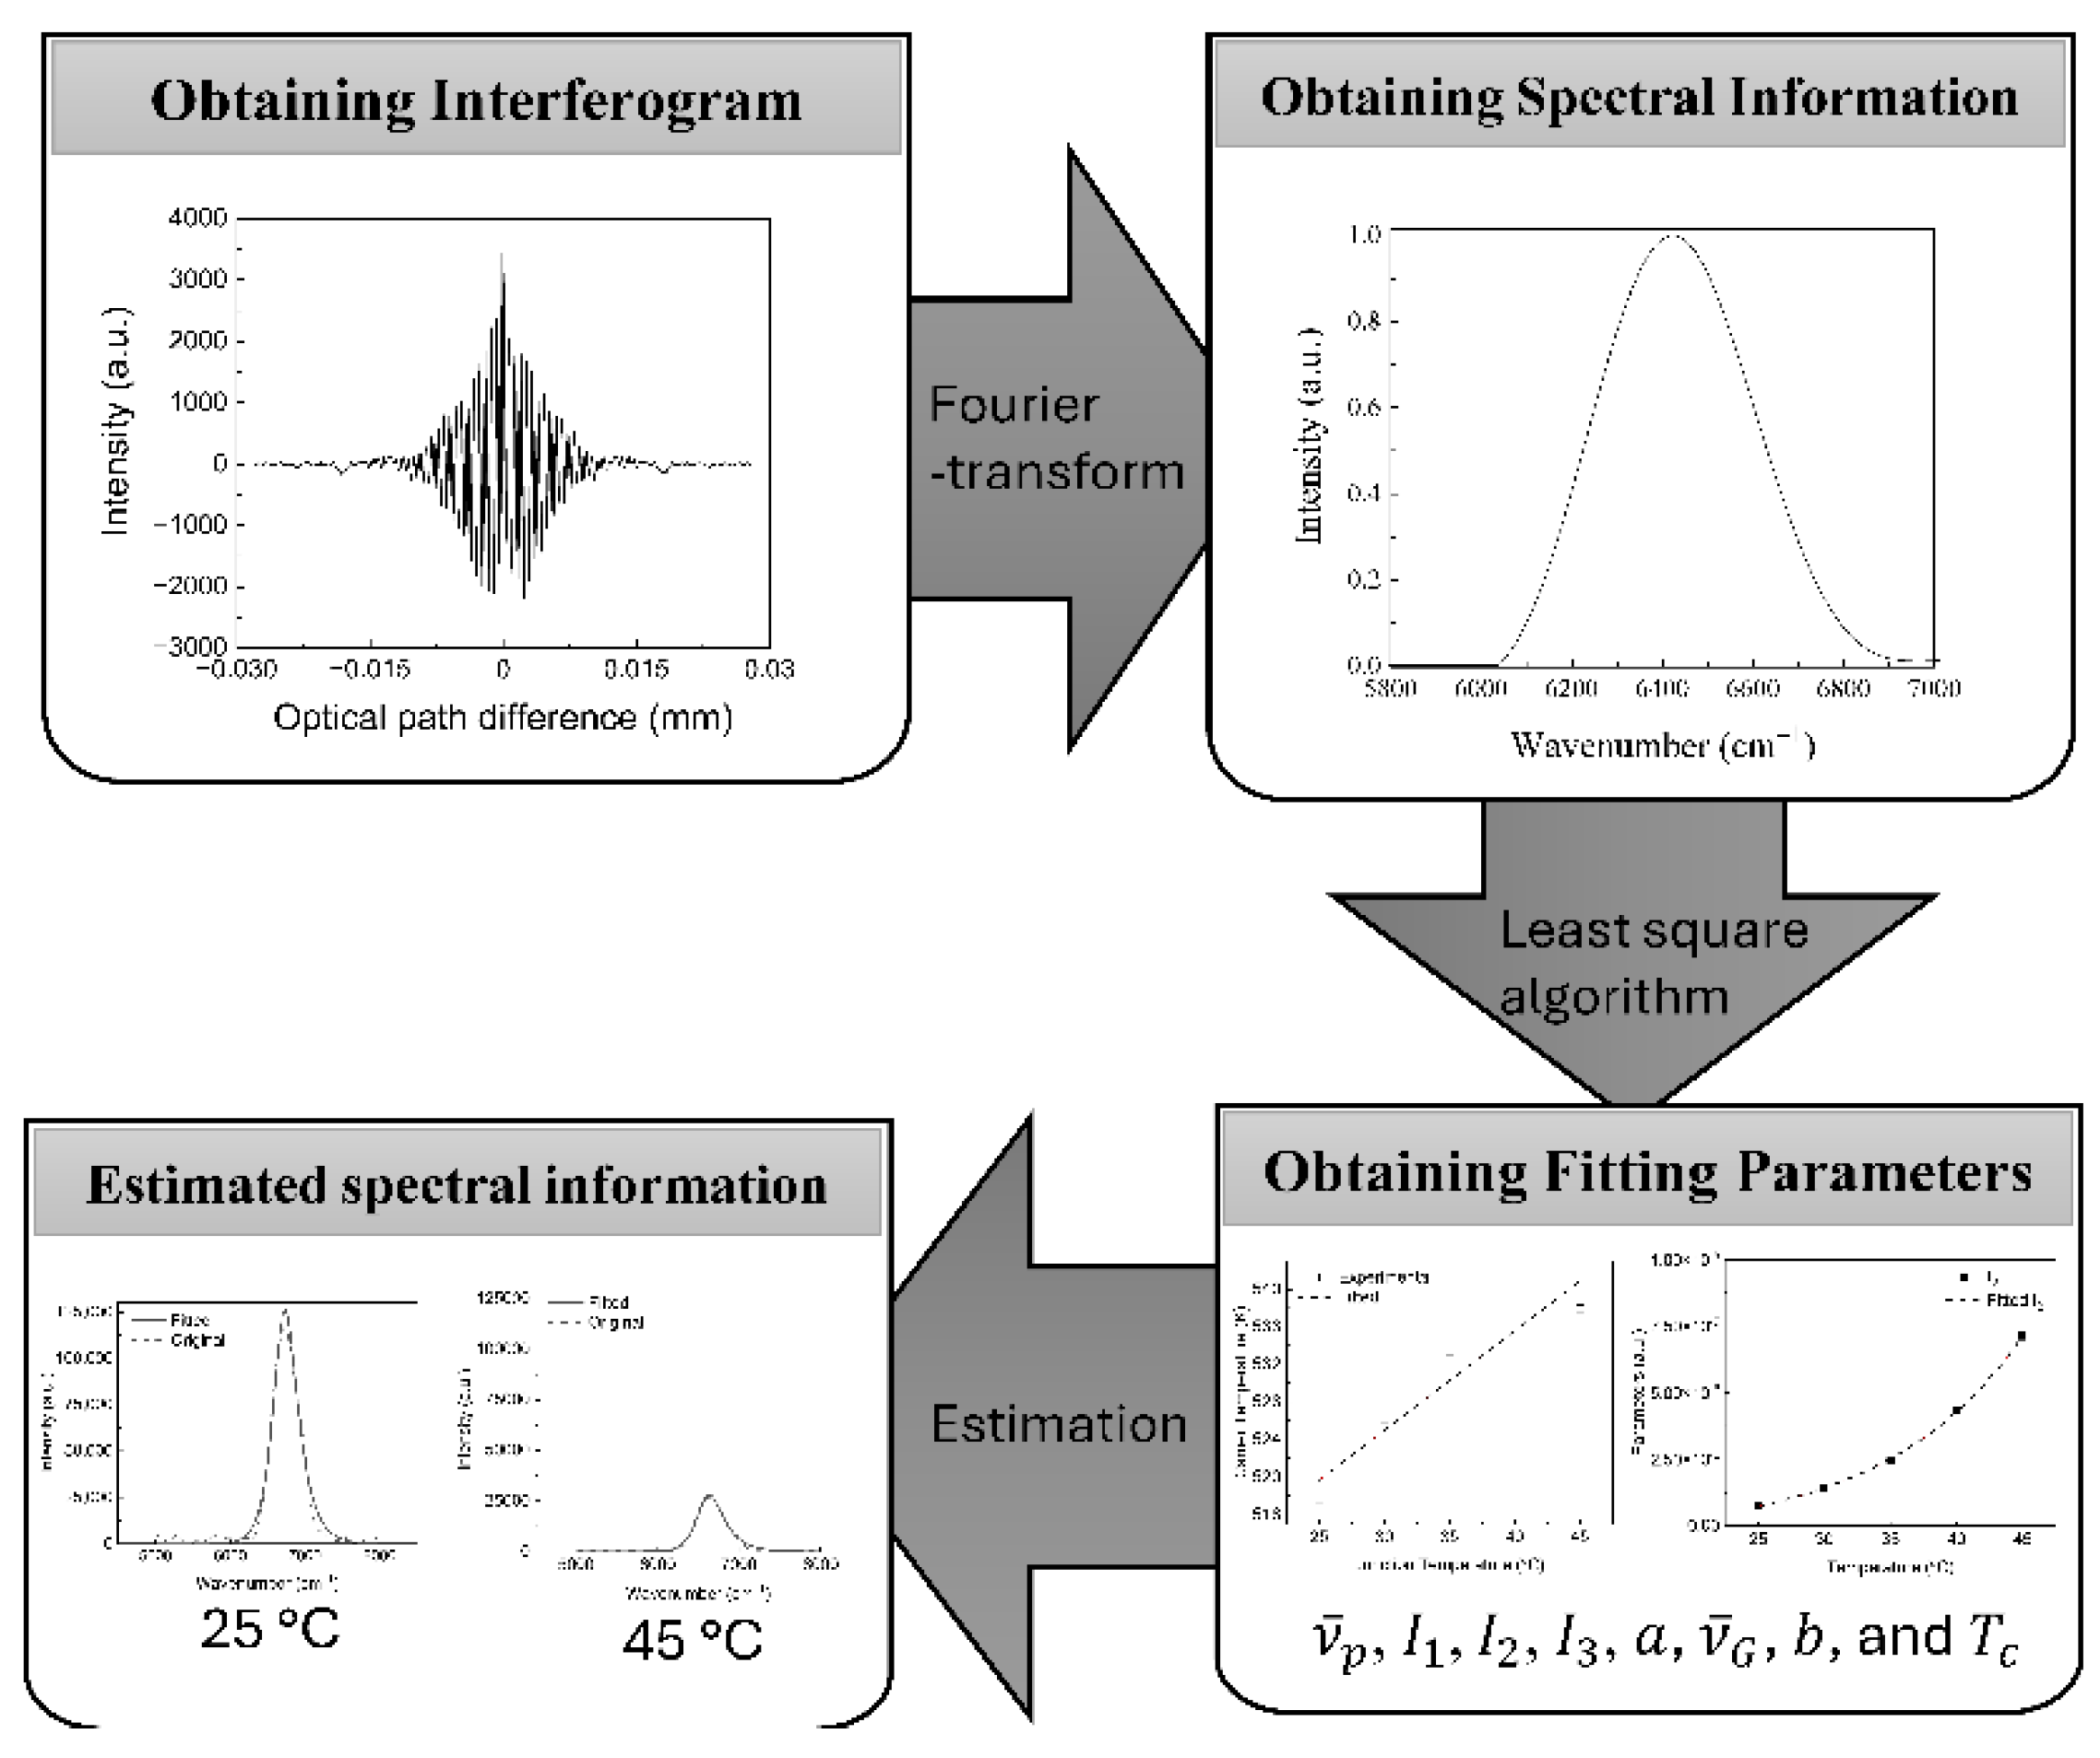
Figure 3.
Measured and fitted spectra and fitted parameters along with a junction temperature. (a) measured spectrum compared to fitted spectrum calculated using Eq. (3). (b) Carrier temperature as a function of junction temperature. (c) as a function of temperature, (d) as a function of temperature, (e) as a function of temperature.
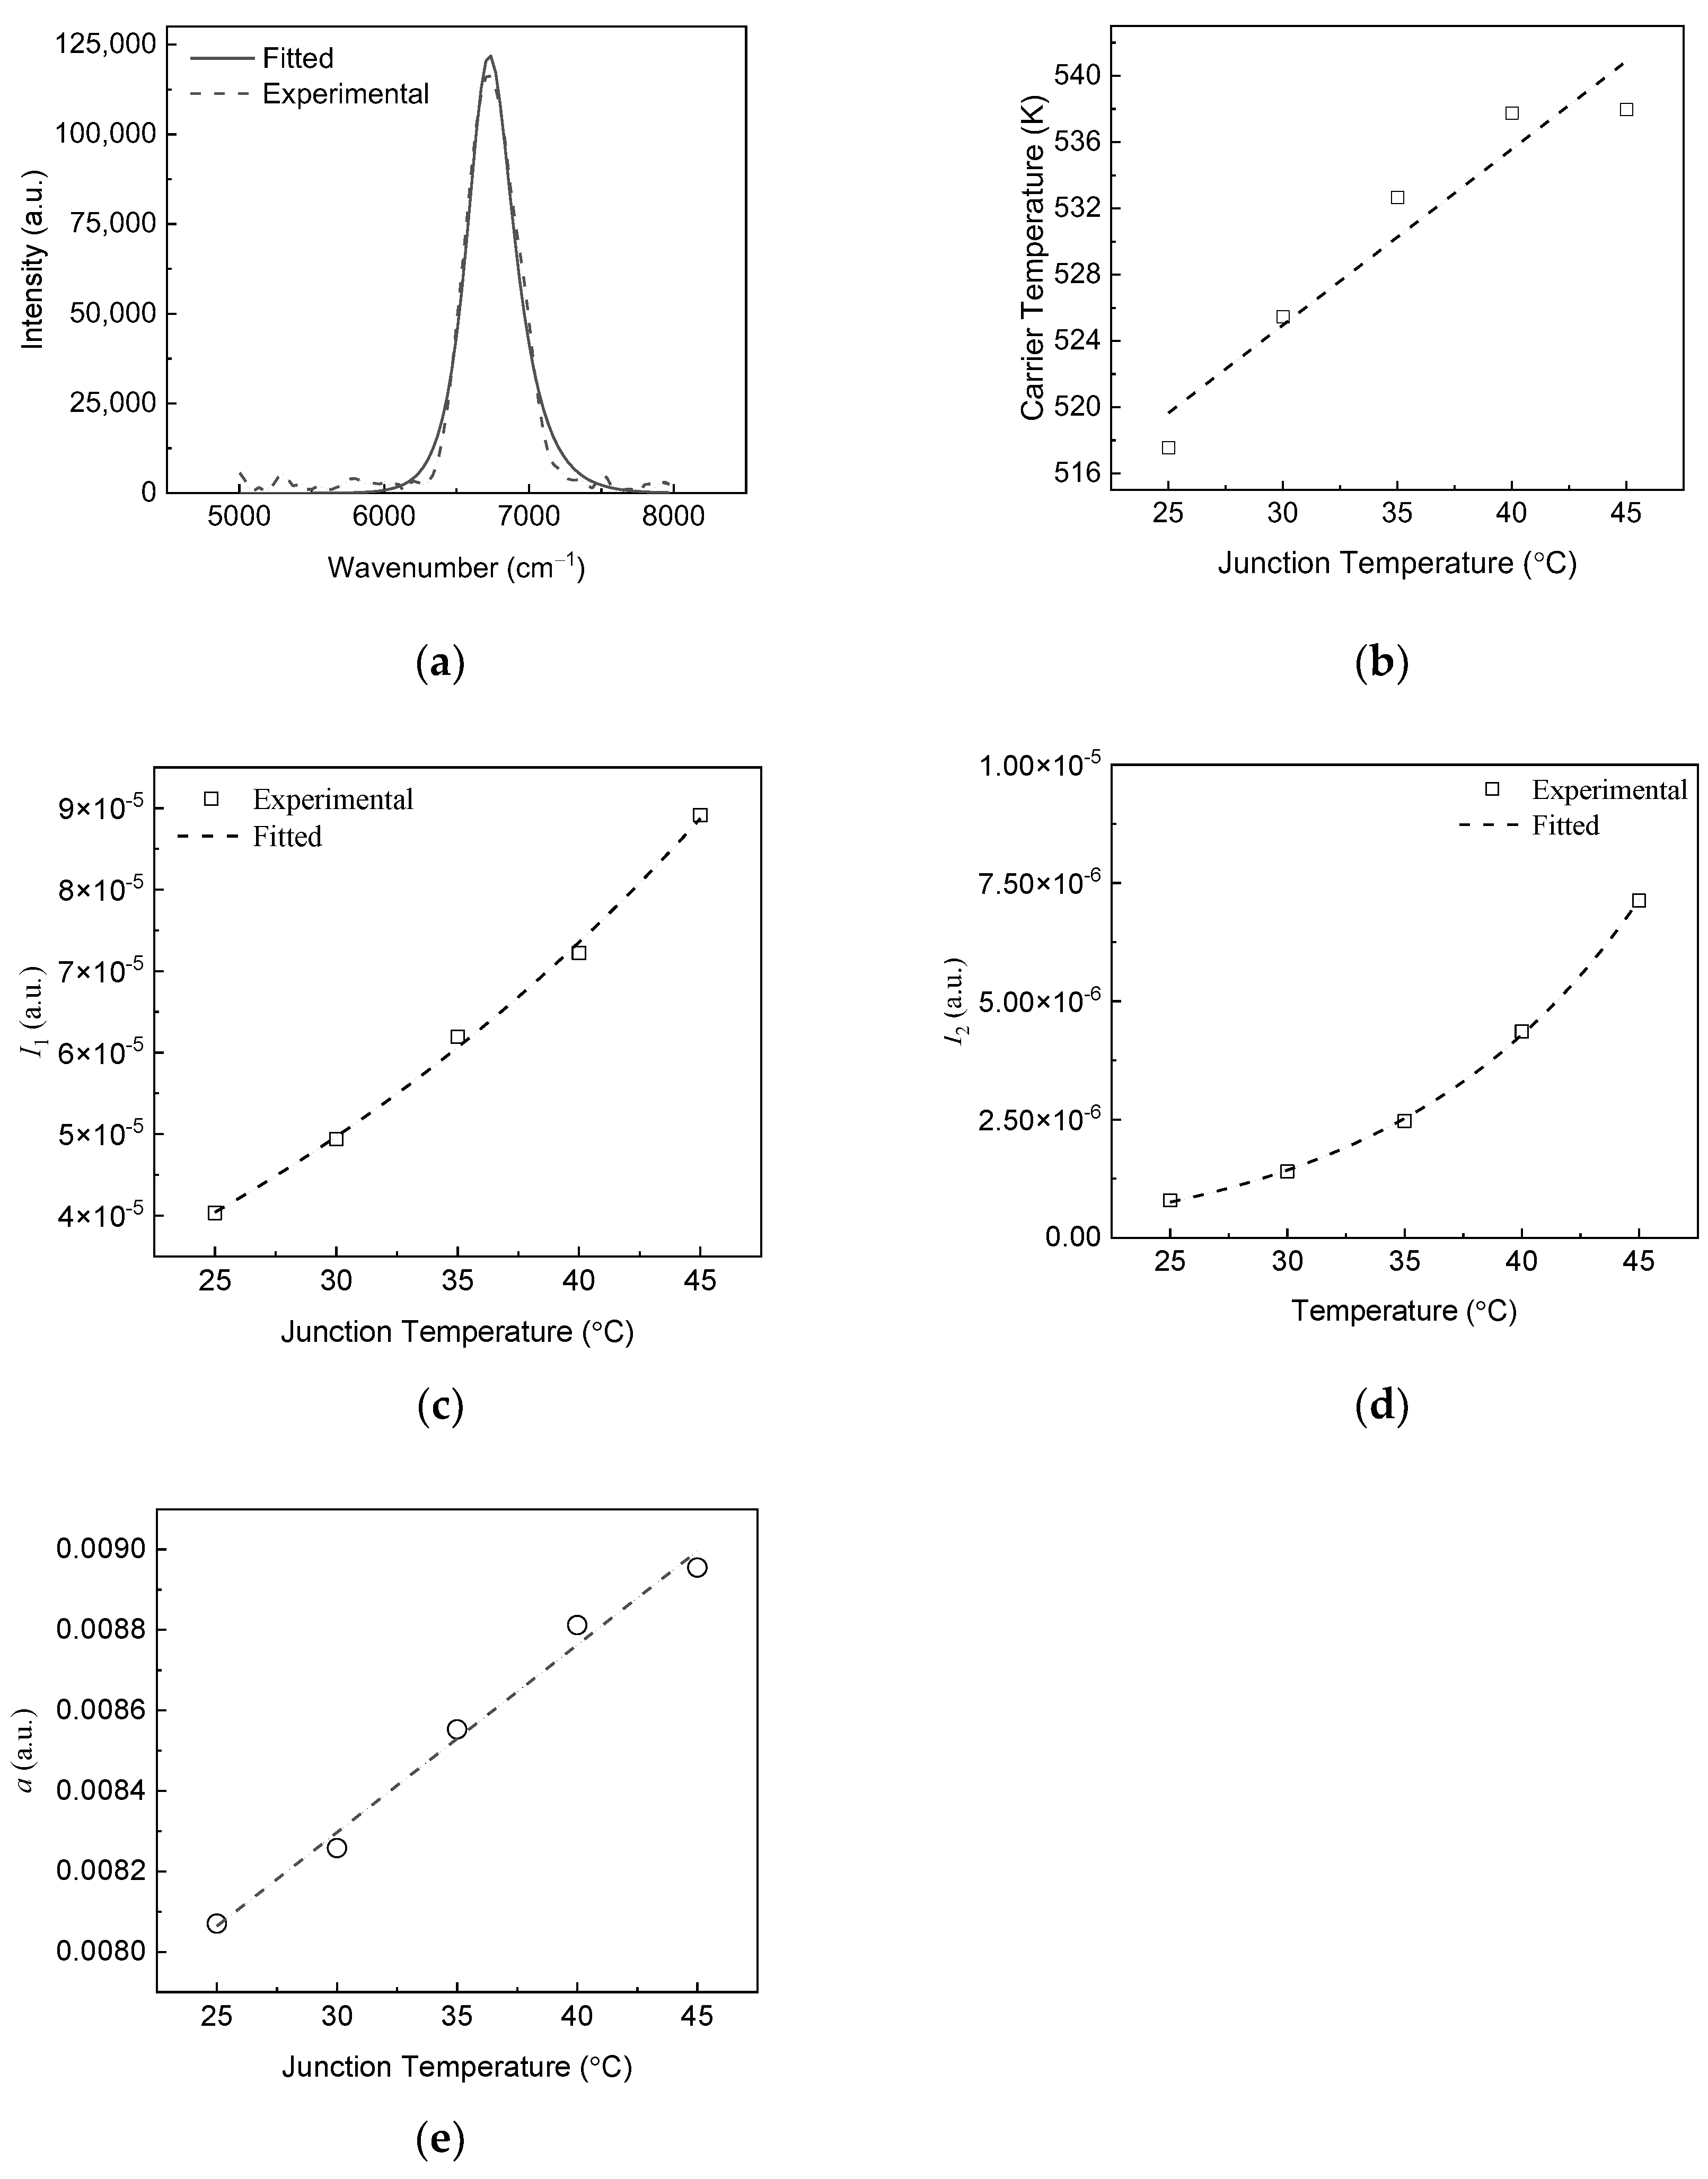
Figure 4.
The estimated spectrum and optical characteristics at various temperatures. (a) The estimated spectrum at 25 °C. (b) The estimated spectrum at 45 °C. (c) the coefficient of determination as a function of junction temperature. (d) The variation of spectral width and peak wavenumber as a function of junction temperature. (e) The output optical power of the source.
Disclaimer/Publisher’s Note: The statements, opinions and data contained in all publications are solely those of the individual author(s) and contributor(s) and not of MDPI and/or the editor(s). MDPI and/or the editor(s) disclaim responsibility for any injury to people or property resulting from any ideas, methods, instructions or products referred to in the content. |
© 2025 by the authors. Licensee MDPI, Basel, Switzerland. This article is an open access article distributed under the terms and conditions of the Creative Commons Attribution (CC BY) license (http://creativecommons.org/licenses/by/4.0/).
Copyright: This open access article is published under a Creative Commons CC BY 4.0 license, which permit the free download, distribution, and reuse, provided that the author and preprint are cited in any reuse.


