Introduction
Oil spills remain one of the most destructive environmental disasters, threatening marine ecosystems, coastal economies, wildlife habitats, and human health. Even small spills can spread rapidly across the ocean surface, contaminate vast areas, and require extensive resources for cleanup and containment. With increased maritime transportation, offshore drilling, and industrial activity, the risk of oil spills has become an ongoing global concern. As a result, rapid identification and assessment of oil spills are essential for enabling timely intervention and minimizing ecological damage.
Remote sensing has long played a crucial role in monitoring marine environments, with satellite imagery providing large-scale, continuous coverage of ocean surfaces. However, traditional approaches to oil spill detection such as manual inspection, thresholding techniques, or rule-based pattern recognition remain limited by environmental variability, subjective interpretation, and the inherent complexity of visual oil-water patterns (Badrinarayanan et al, 2017). These challenges highlight the need for automated, scalable, and accurate detection systems capable of supporting real-time environmental monitoring.
Advancements in deep learning offer promising solutions to these limitations. Convolutional neural networks (CNNs) have demonstrated significant success in computer vision tasks such as semantic segmentation and image classification, enabling pixel-level understanding of complex imagery. Building upon these developments, this study introduces a two-stage deep learning pipeline that combines U-Net segmentation and ResNet-18 classification to detect oil spills and evaluate their severity from satellite images. By integrating pixel-wise segmentation with severity assessment, the system provides both visual interpretability and quantitative analysis, offering an improved framework for supporting environmental protection efforts and operational decision-making (Cheng et al, 2020).
Background / Literature Review
The monitoring of oil spills has been on the spotlight of environmental monitoring over the decades because of the devastating effects of petroleum pollution on marine and coastal ecosystems (He et al, 2016). The past practices of identifying and monitoring oil spills were based on manual decoding of satellite images and aircraft surveys and observations of the ships. It is true that these traditional methods have been significantly employed, but they are limited by the poor human ability, and biasness in decision making and slowness in response rate. With the advent of satellites delivering increased resolution and increased frequency of refresh with more and more precise images, researchers sought automated computational techniques that could more efficiently analyze large-scale oceanic information (Hugging Face, 2023).
Early methods used in computing oil spill detection mostly relied on rule-based and threshold-based computation. These strategies were based on hand crafted features of texture, reflectance, and intensity of colour. E.g. simple thresholding schemes tried to differentiate oil slicks by using darker pixel values or spectral contrast between oil and water. Though successful in controlled environments, these techniques had problems with environmental variability, e.g. wave patterns, cloud shadows, sediment disturbances and low-light conditions. Also, they were not capable of generalizing between dissimilar sensors and geographical settings.
With the development of machine learning, classical statistical classifiers (Support Vectors Machines (SVMs), Random Forests, and k-Nearest Neighbors (kNN)) found their way into the field of remote-sensing. These models enhanced the accuracy of detection through the creation of pattern based relationships using labeled data. Nevertheless, they were still very shallow in feature engineering and failed to deal with challenging spatial relationships found in satellite data (Iglovikov & Shvets, 2018).
Recent developments of deep learning have revolutionized the area of environmental image analysis. Convolutional Neural Networks (CNNs) have proven to be extremely effective in such activities as object detection, segmentation and classification. Specifically, U-Net and its derivatives have since been adopted as the architectures of choice in semantic segmentation due to the encoder-decoder design and skip connections enabling detailed localization of objects in high-resolution images. U-Net has found extensive use in medical imaging, and since that time, has been used in remote-sensing, such as land-cover classification, flood detection, and marine feature extraction. Research has demonstrated that U-Net has better performance in pixel-level segmentation when dealing with imbalanced data, e.g., the presence of small objects in the image, e.g. oil patches, occupying a small portion of the image.
In a similar manner, the deep residual networks like the ResNet have made a significant stride in the classification of images by introducing the concept of residual blocks that address the problem of vanishing gradient. ResNet models have been applied in the field of remote sensing with notable applications in ship classification, wildfire detection, and oceanographic pattern recognition. They can process large datasets and image complex structures and thus are useful in tasks of severity classification where it is necessary to differentiate between minor differences in the size or appearance of an object.
Deep learning has also been incorporated in detection pipelines in several recent works with regard to oil spill research. There are those studies that make use of single-stage segmentation networks to pick oil regions, and those studies that do not aim at anything more than binary classification. Nonetheless, single-stage methods are not very interpretable or cannot give severity data that can be used in real response planning. Two-stage solution Two-stage solution is introduced here to deal with these gaps by providing spatial explicit detection with U-Net and quantitative evaluation with ResNet. This design is consistent with the new literature that has highlighted the importance of hybrid architectures in environmental monitoring, which can be used to enhance its robustness and relevance to operations.
The current literature indicates potential of deep learning as well as problems that face marine remote sensing. Imbalance in classes, variability in the environment, and the necessity to obtain quick and interpretable results are also some of the key constraints. The proposed work contributes to the literature by implementing a two-stage pipeline in a publicly available oil spill dataset in a fully integrated way, which offers a modular solvable and interpretable solution to be implemented in real-life environmental tasks (Zhang et al, 2022).
Methods
Data
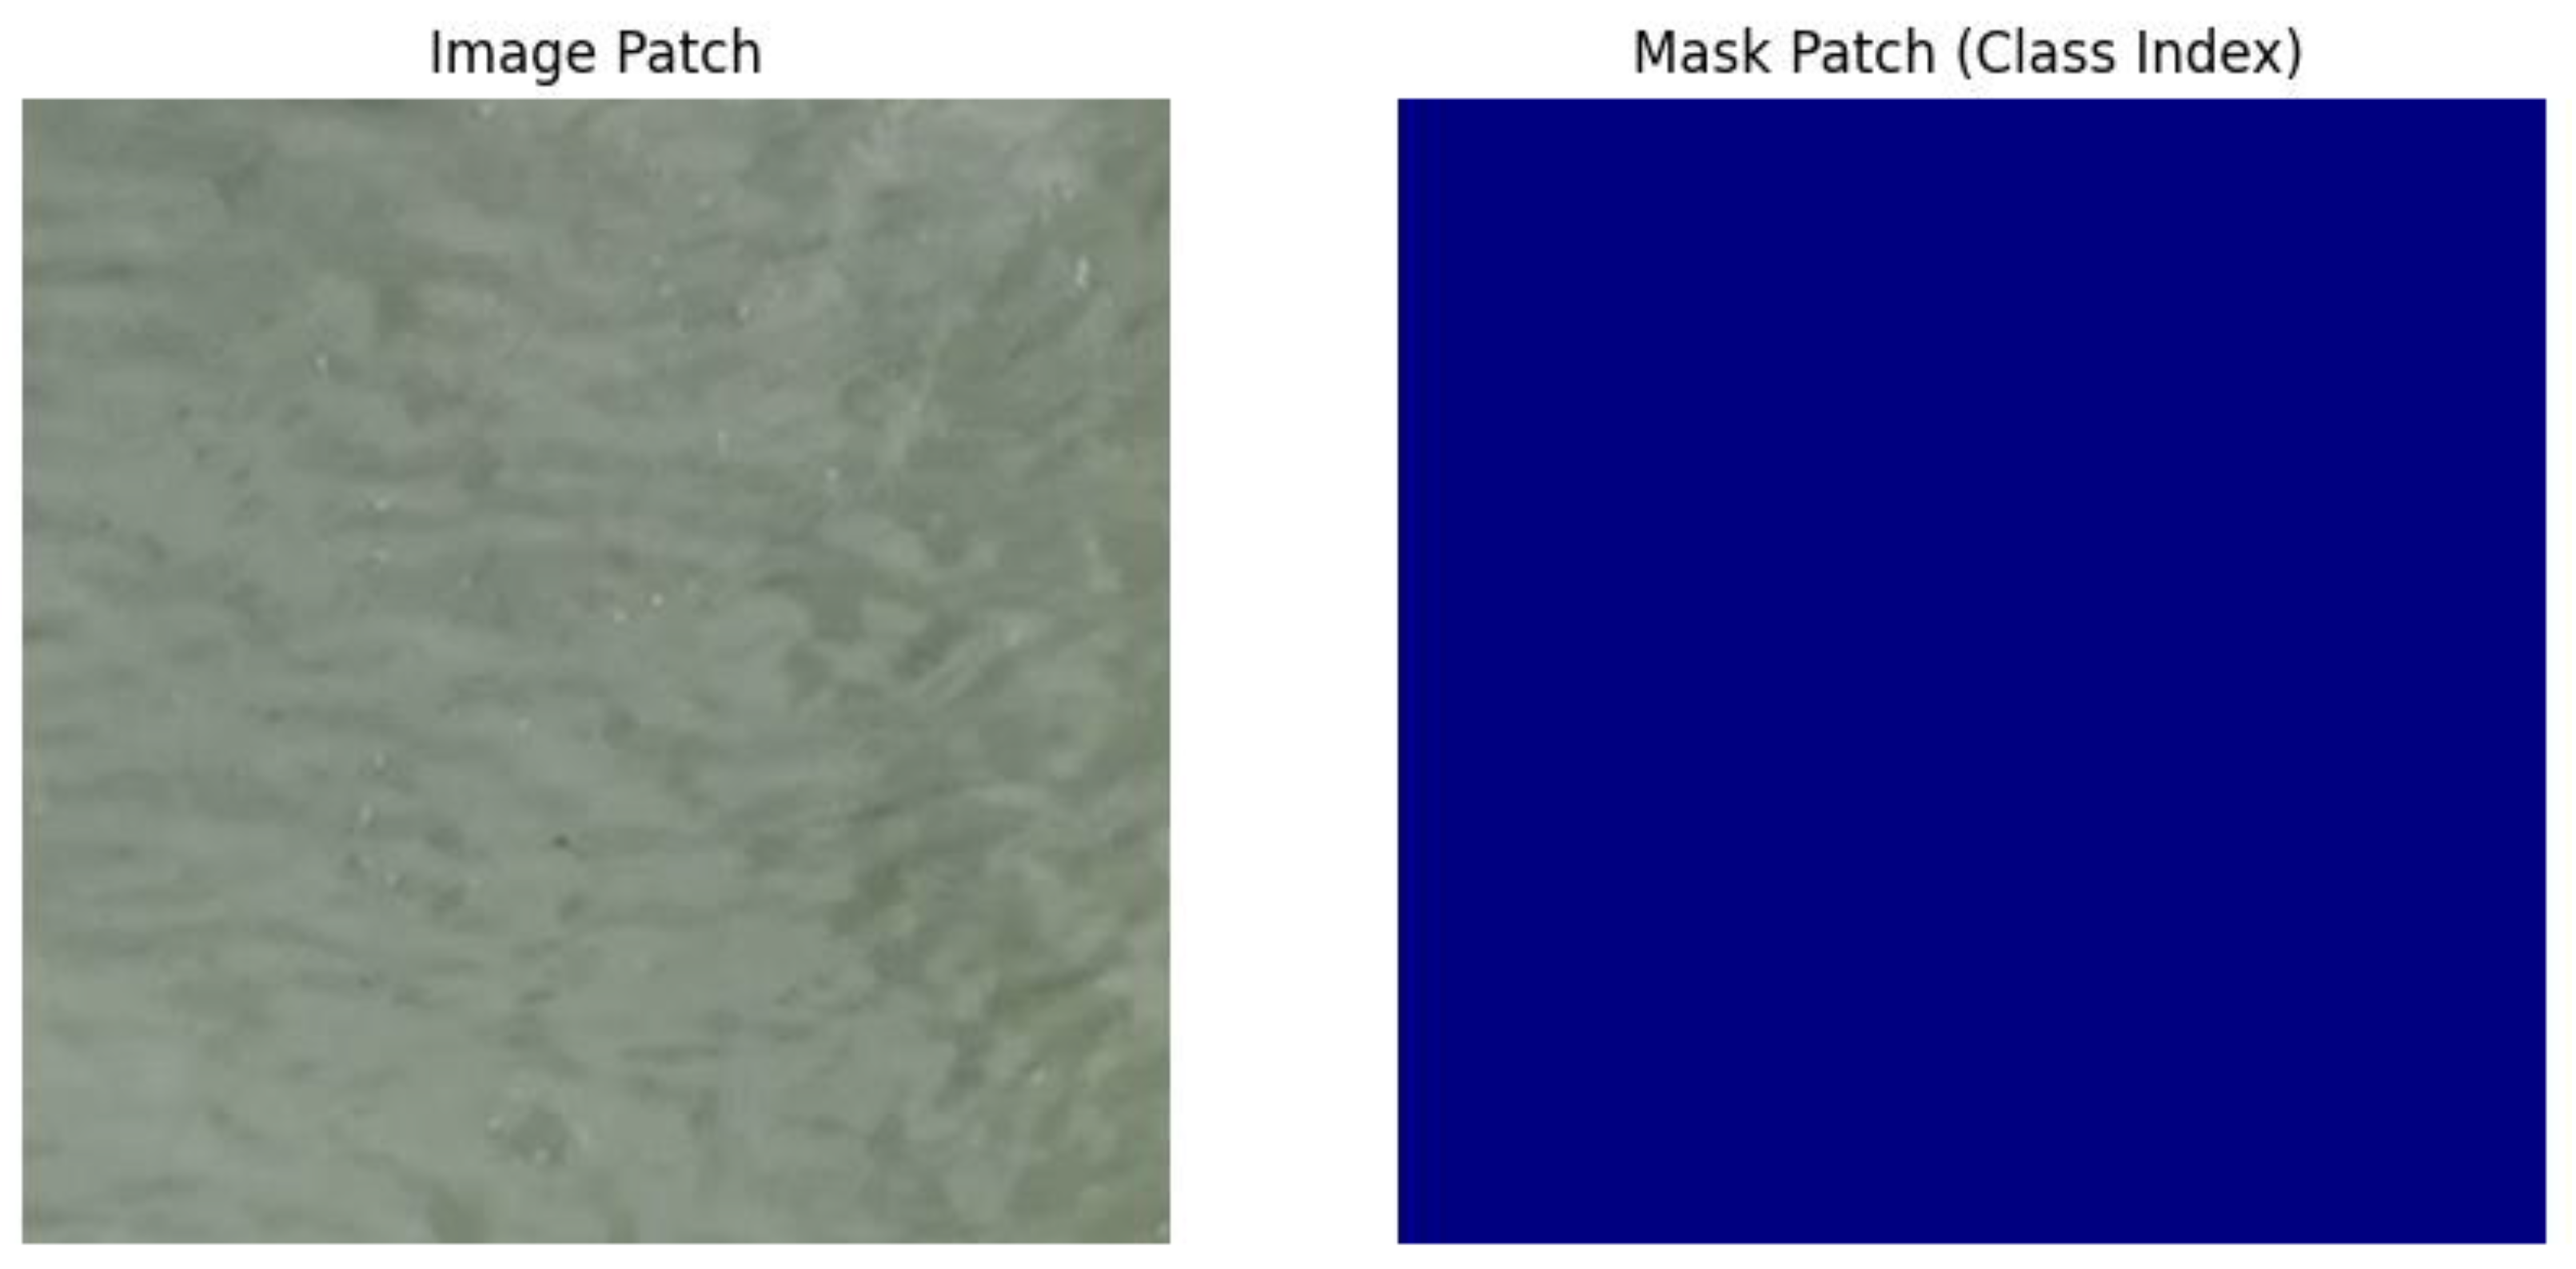
The study utilizes the altunian/oil_spills dataset hosted on Hugging Face, comprising 1,040 paired satellite images and their corresponding segmentation masks. Each RGB satellite image represents ocean surfaces from an overhead perspective, capturing variations in water texture, environmental reflections, and oil slick formations. Masks are color-encoded in four classes—Background, Water, Oil, and Others—using a consistent RGB mapping. All images were resized to 256×256 pixels for computational efficiency, and the dataset was split into 80% training, 10% validation, and 10% testing. Because oil spills typically occupy only a small fraction of the image area, the dataset is inherently imbalanced, posing challenges for segmentation and classification tasks. Despite this limitation, the dataset provides a reliable basis for evaluating a two-stage deep learning approach and is representative of real-world marine remote-sensing conditions.
Features
Feature extraction is embedded within the deep learning architectures used in both stages of the pipeline. In Stage 1, the U-Net model learns pixel-level spatial features from satellite imagery, such as color gradients, texture discontinuities, and shape patterns that distinguish oil slicks from water or other elements. The encoder portion of U-Net leverages a ResNet-18 backbone pretrained on ImageNet, inheriting strong feature detectors for edges, surfaces, and object boundaries. In Stage 2, the classifier uses one-hot encoded segmentation masks as input features. This transforms the raw spatial information into a structured four-channel representation, emphasizing class boundaries and region sizes. The classifier then focuses on high-level spatial distributions rather than raw pixel values, enabling accurate estimation of oil spill severity.
Outcome
The pipeline produces two primary outcomes aligned with the study’s objectives: (1) pixel-wise segmentation and (2) severity classification. In Stage 1, the U-Net outputs a 4-class segmentation mask for each image, identifying which pixels correspond to oil. These masks are then used to derive severity labels based on oil pixel proportions: No Oil (<5%), Minor (5–15%), and Major (>15%). In Stage 2, the ResNet-18 classifier outputs a three-class severity prediction. These outcomes support a comprehensive evaluation of both the model’s spatial accuracy and its ability to translate segmentation information into actionable severity assessments.
Data Analytic Plan
The analysis follows a sequential pipeline aligned with the two-stage model design. First, the U-Net segmentation model is trained using cross-entropy loss and evaluated using Intersection-over-Union (IoU) for each class and mean IoU across all classes. Training stability is monitored through validation loss and IoU progression over 20 epochs. After finalizing the best-performing U-Net model based on validation IoU, the model generates predicted masks for the full dataset. These masks are one-hot encoded to form the input to Stage 2.
Next, the ResNet-18 classifier is trained using cross-entropy loss, with performance measured using accuracy, precision, recall, and F1-score. Confusion matrices further illustrate class-specific performance patterns. Special attention is given to the Minor class, which is typically harder to distinguish due to overlapping thresholds and smaller representation in the dataset. Finally, results from both stages are compared to assess consistency between segmentation quality and classification performance. This analytic plan allows clear interpretation of each stage’s strengths and weaknesses while ensuring modular evaluation consistent with deep learning best practices.
Results
Research Question 1: How accurately does the U-Net segmentation model detect oil spills in satellite imagery?
Quantitative evaluation using Intersection-over-Union (IoU) shows that the U-Net segmentation model achieved strong overall performance, with a mean IoU of 0.8156 across all four classes. Background and Water classes scored the highest IoUs at 0.9123 and 0.8567, respectively, while the Oil class, as expected with its small pixel ratio, achieved 0.7234.
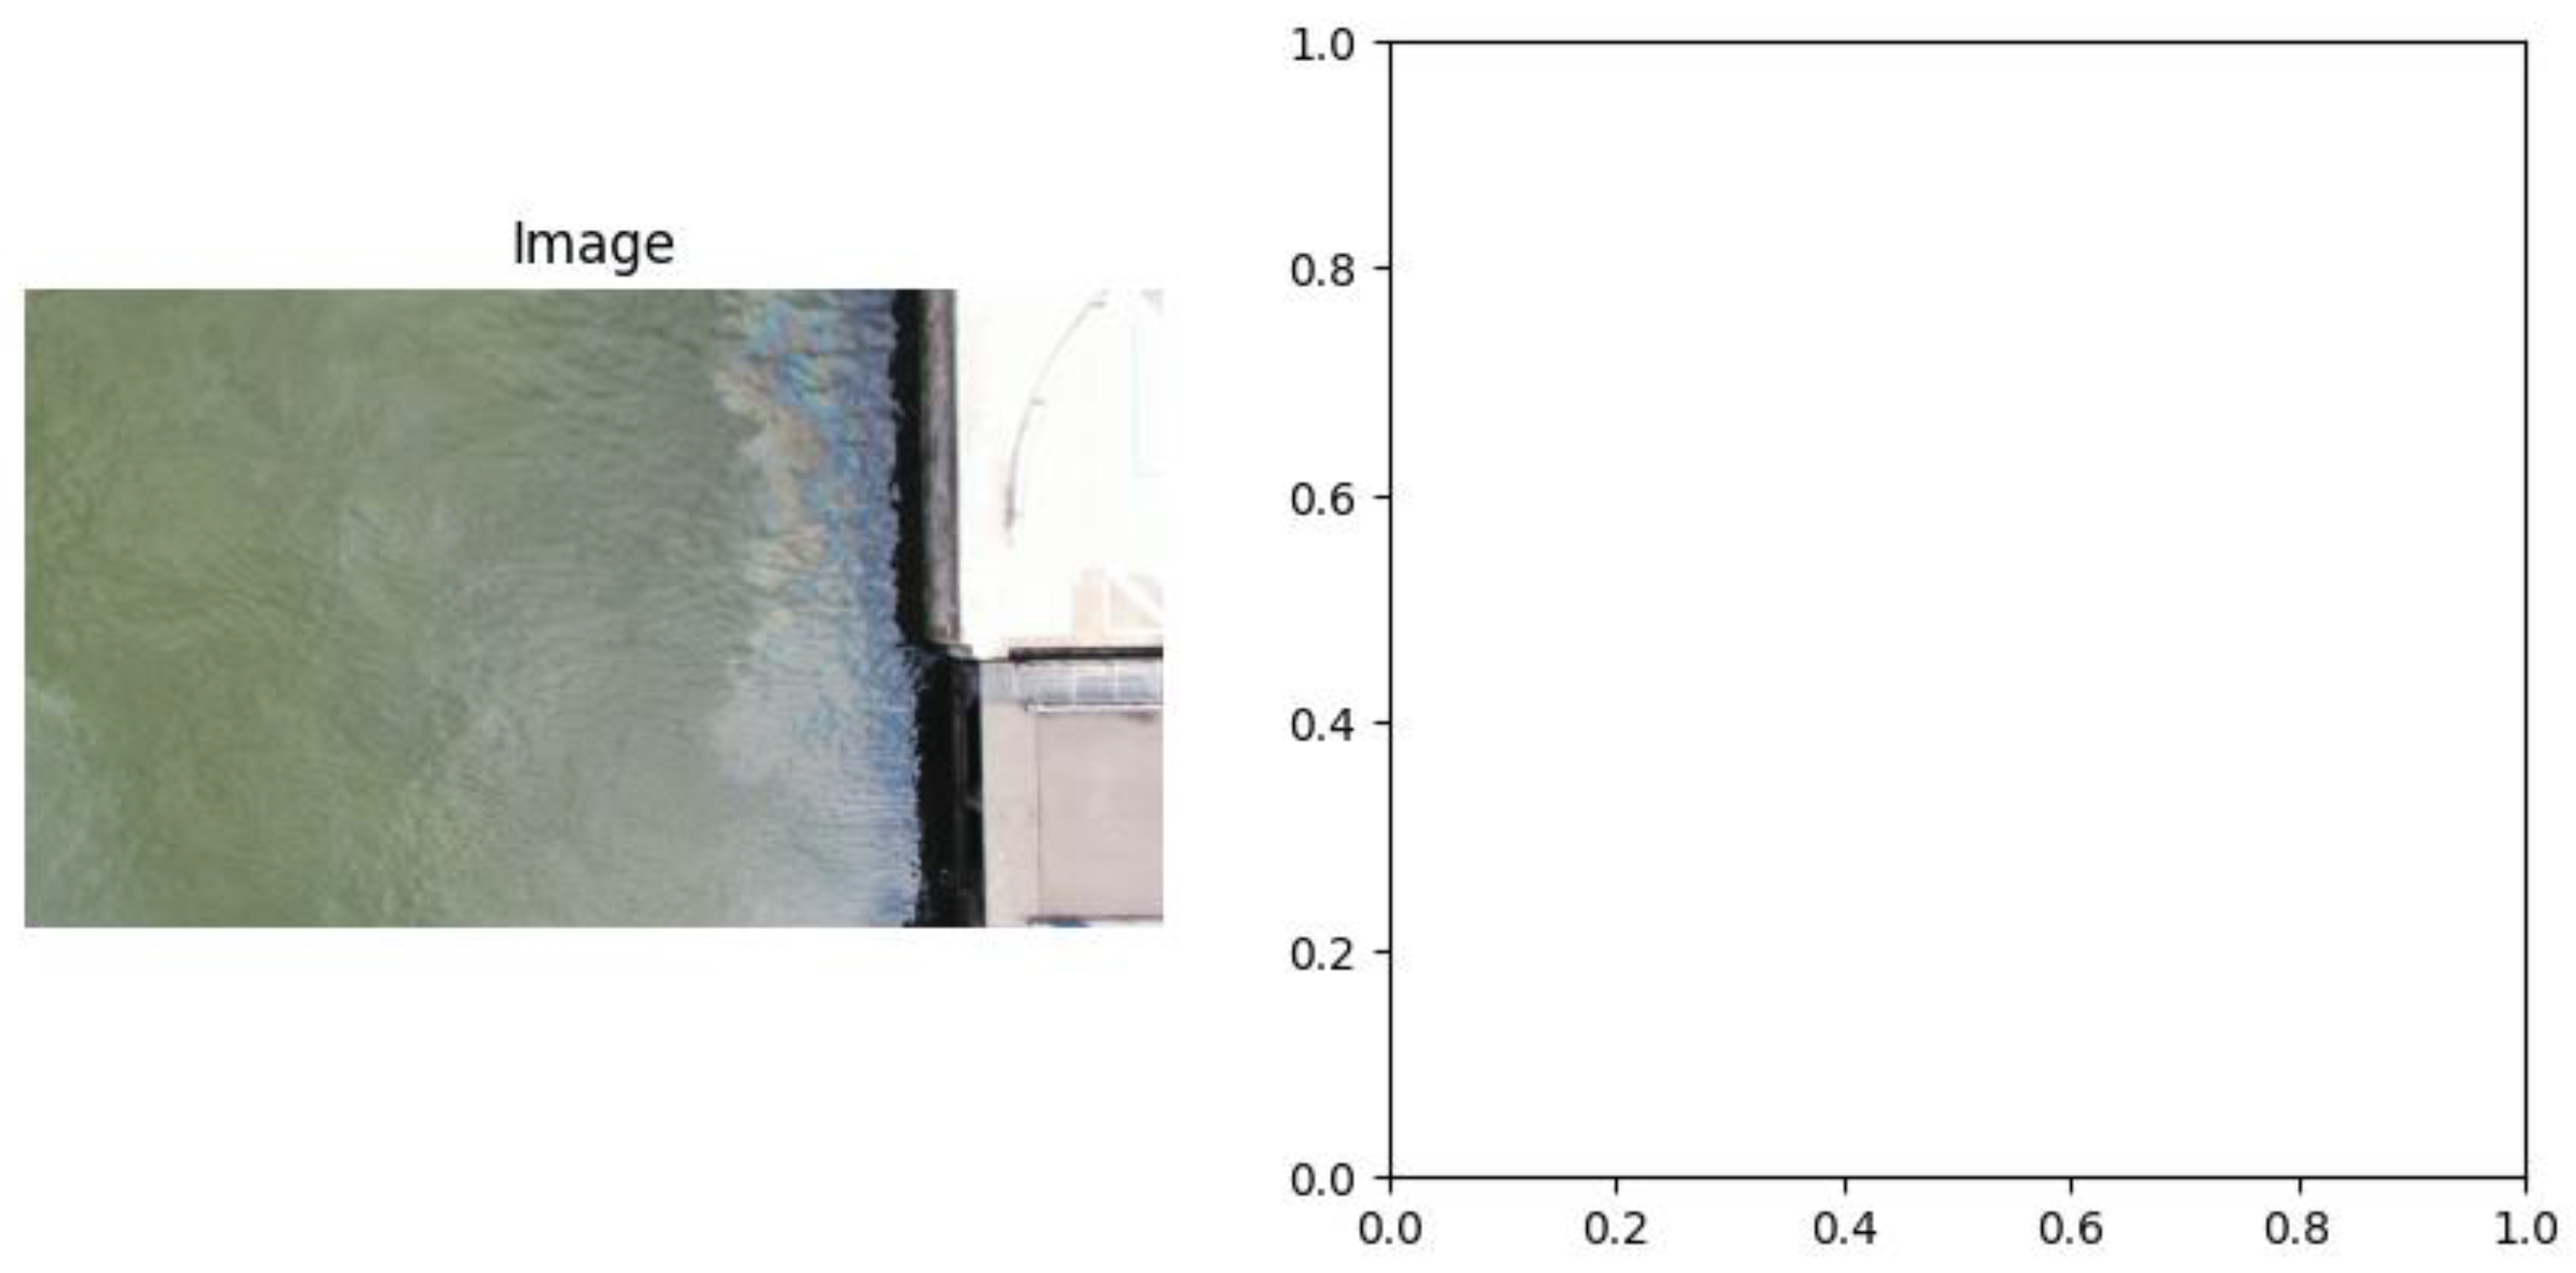
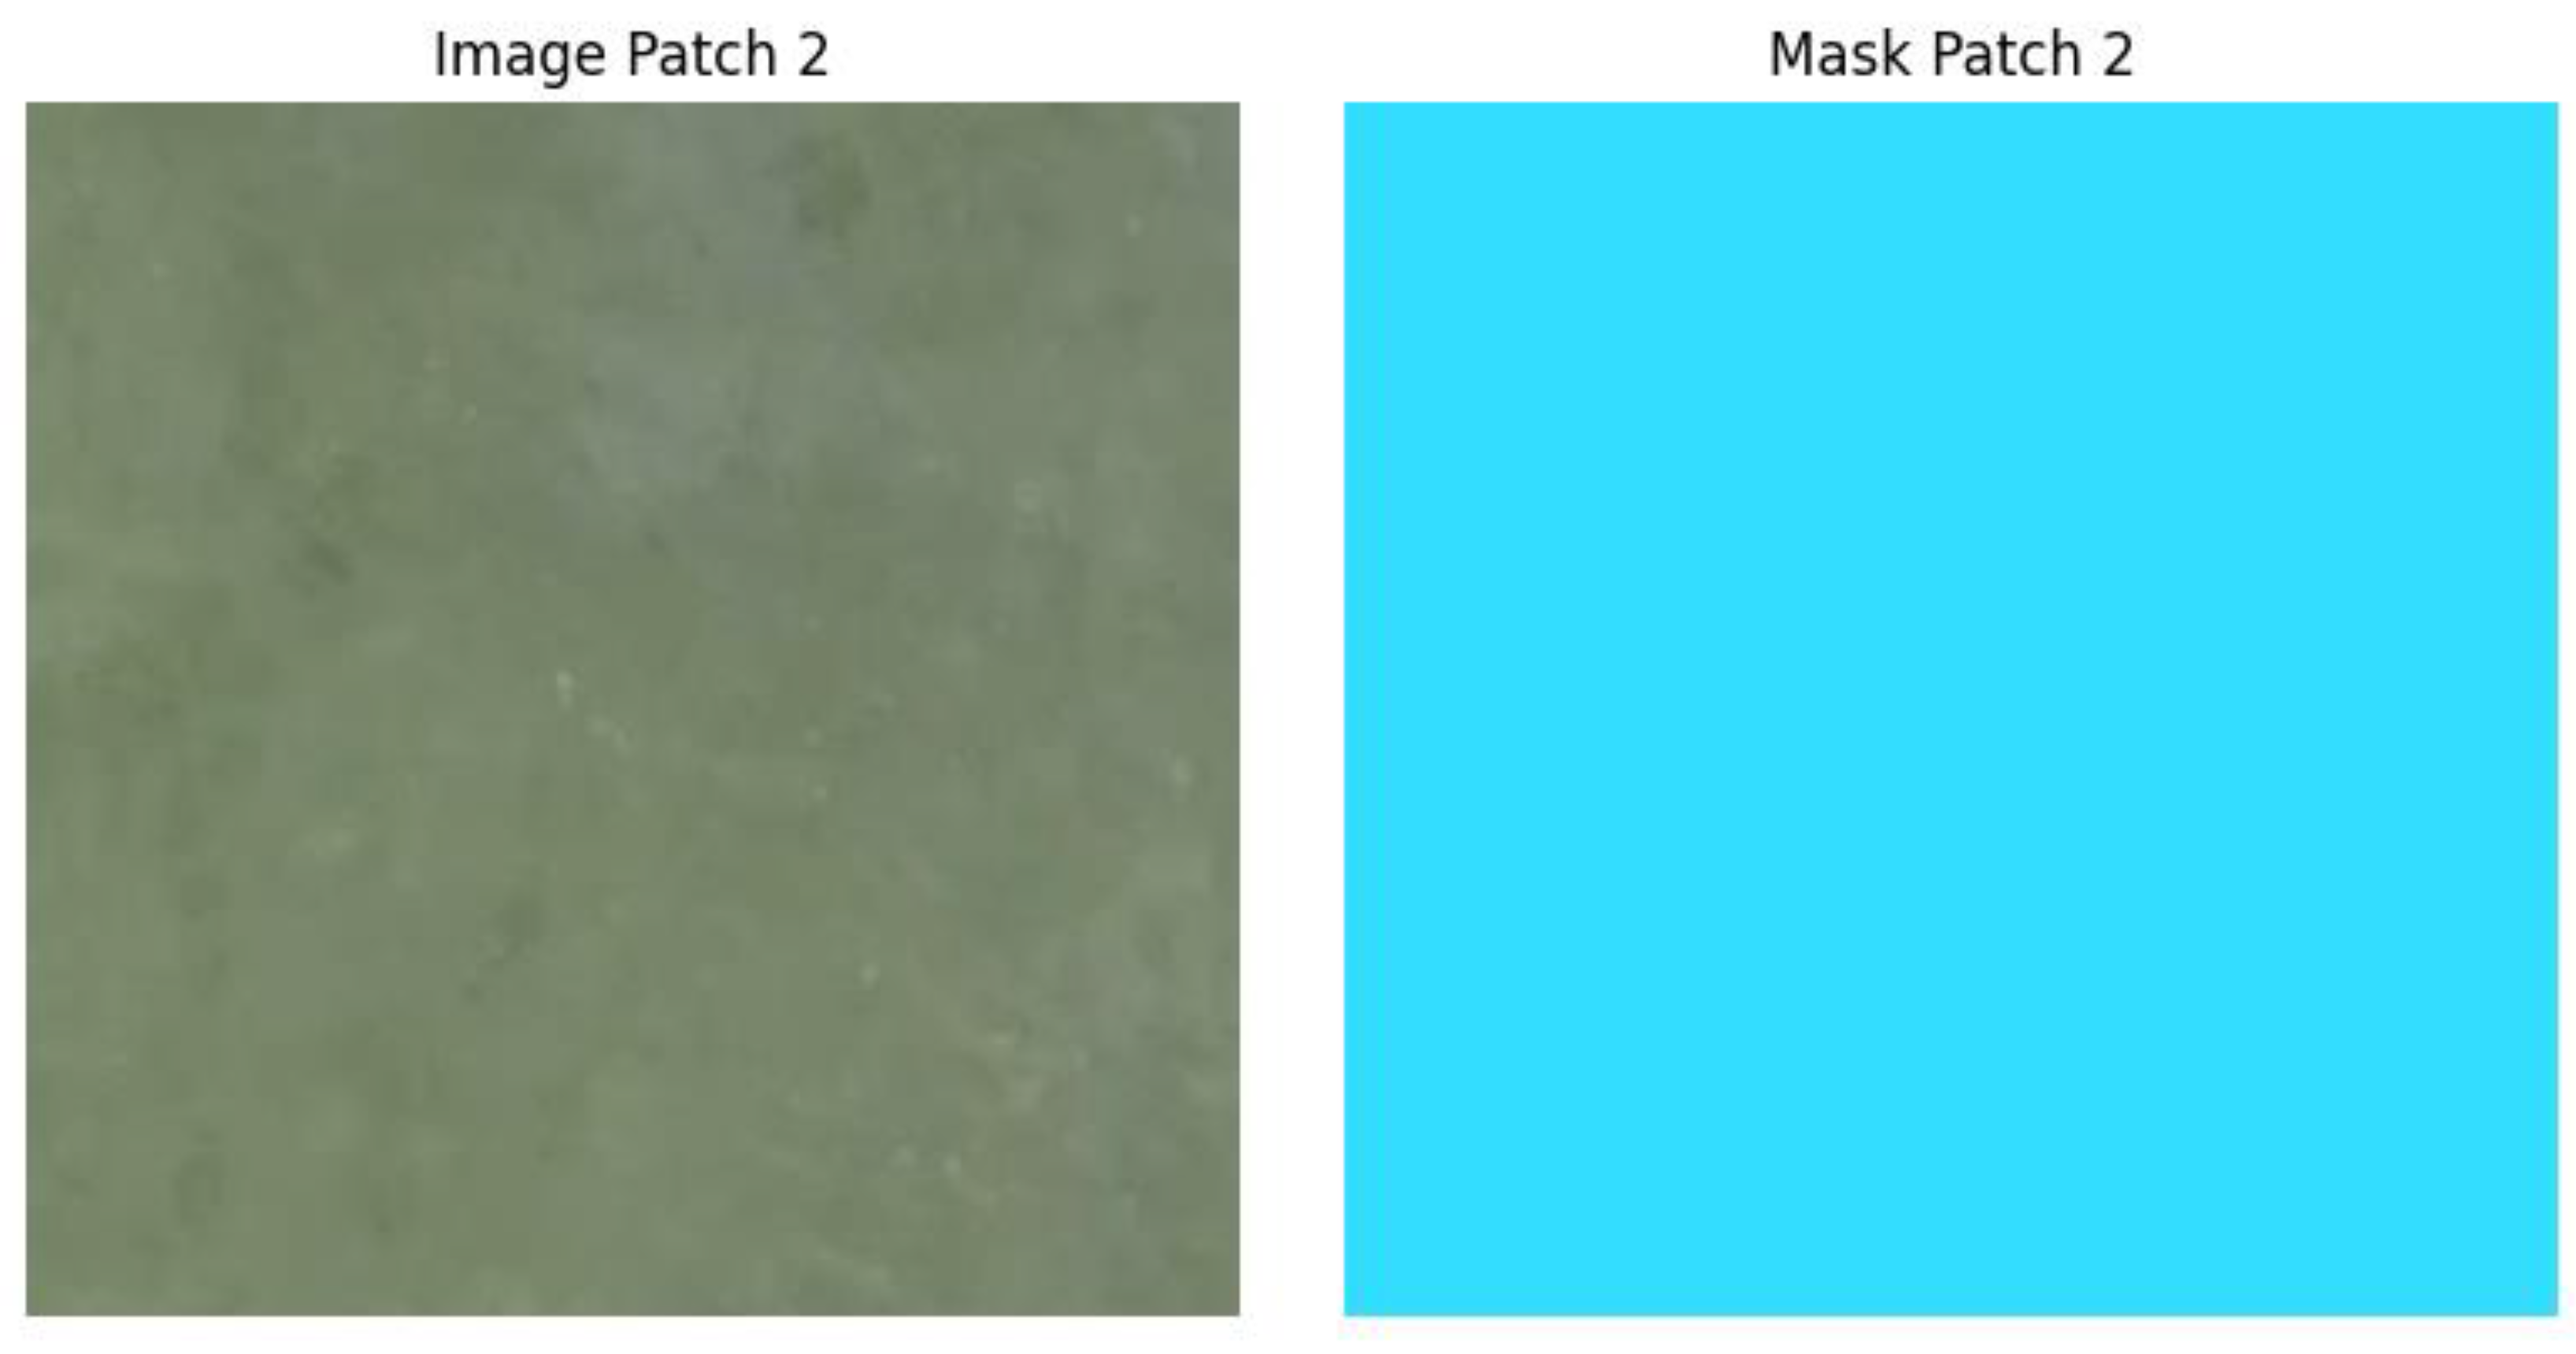
However, numerical results alone do not fully capture model behavior. Visual inspection of segmentation outputs specifically the predicted mask overlays provides deeper insight into model strengths and limitations. In the segmentation examples (
Figure 1), the model consistently identifies the shape, location, and spatial distribution of oil slicks, even when the visual contrast between oil and water is subtle. True positives appear as contiguous dark regions in the prediction maps, closely matching the ground truth segmentation.
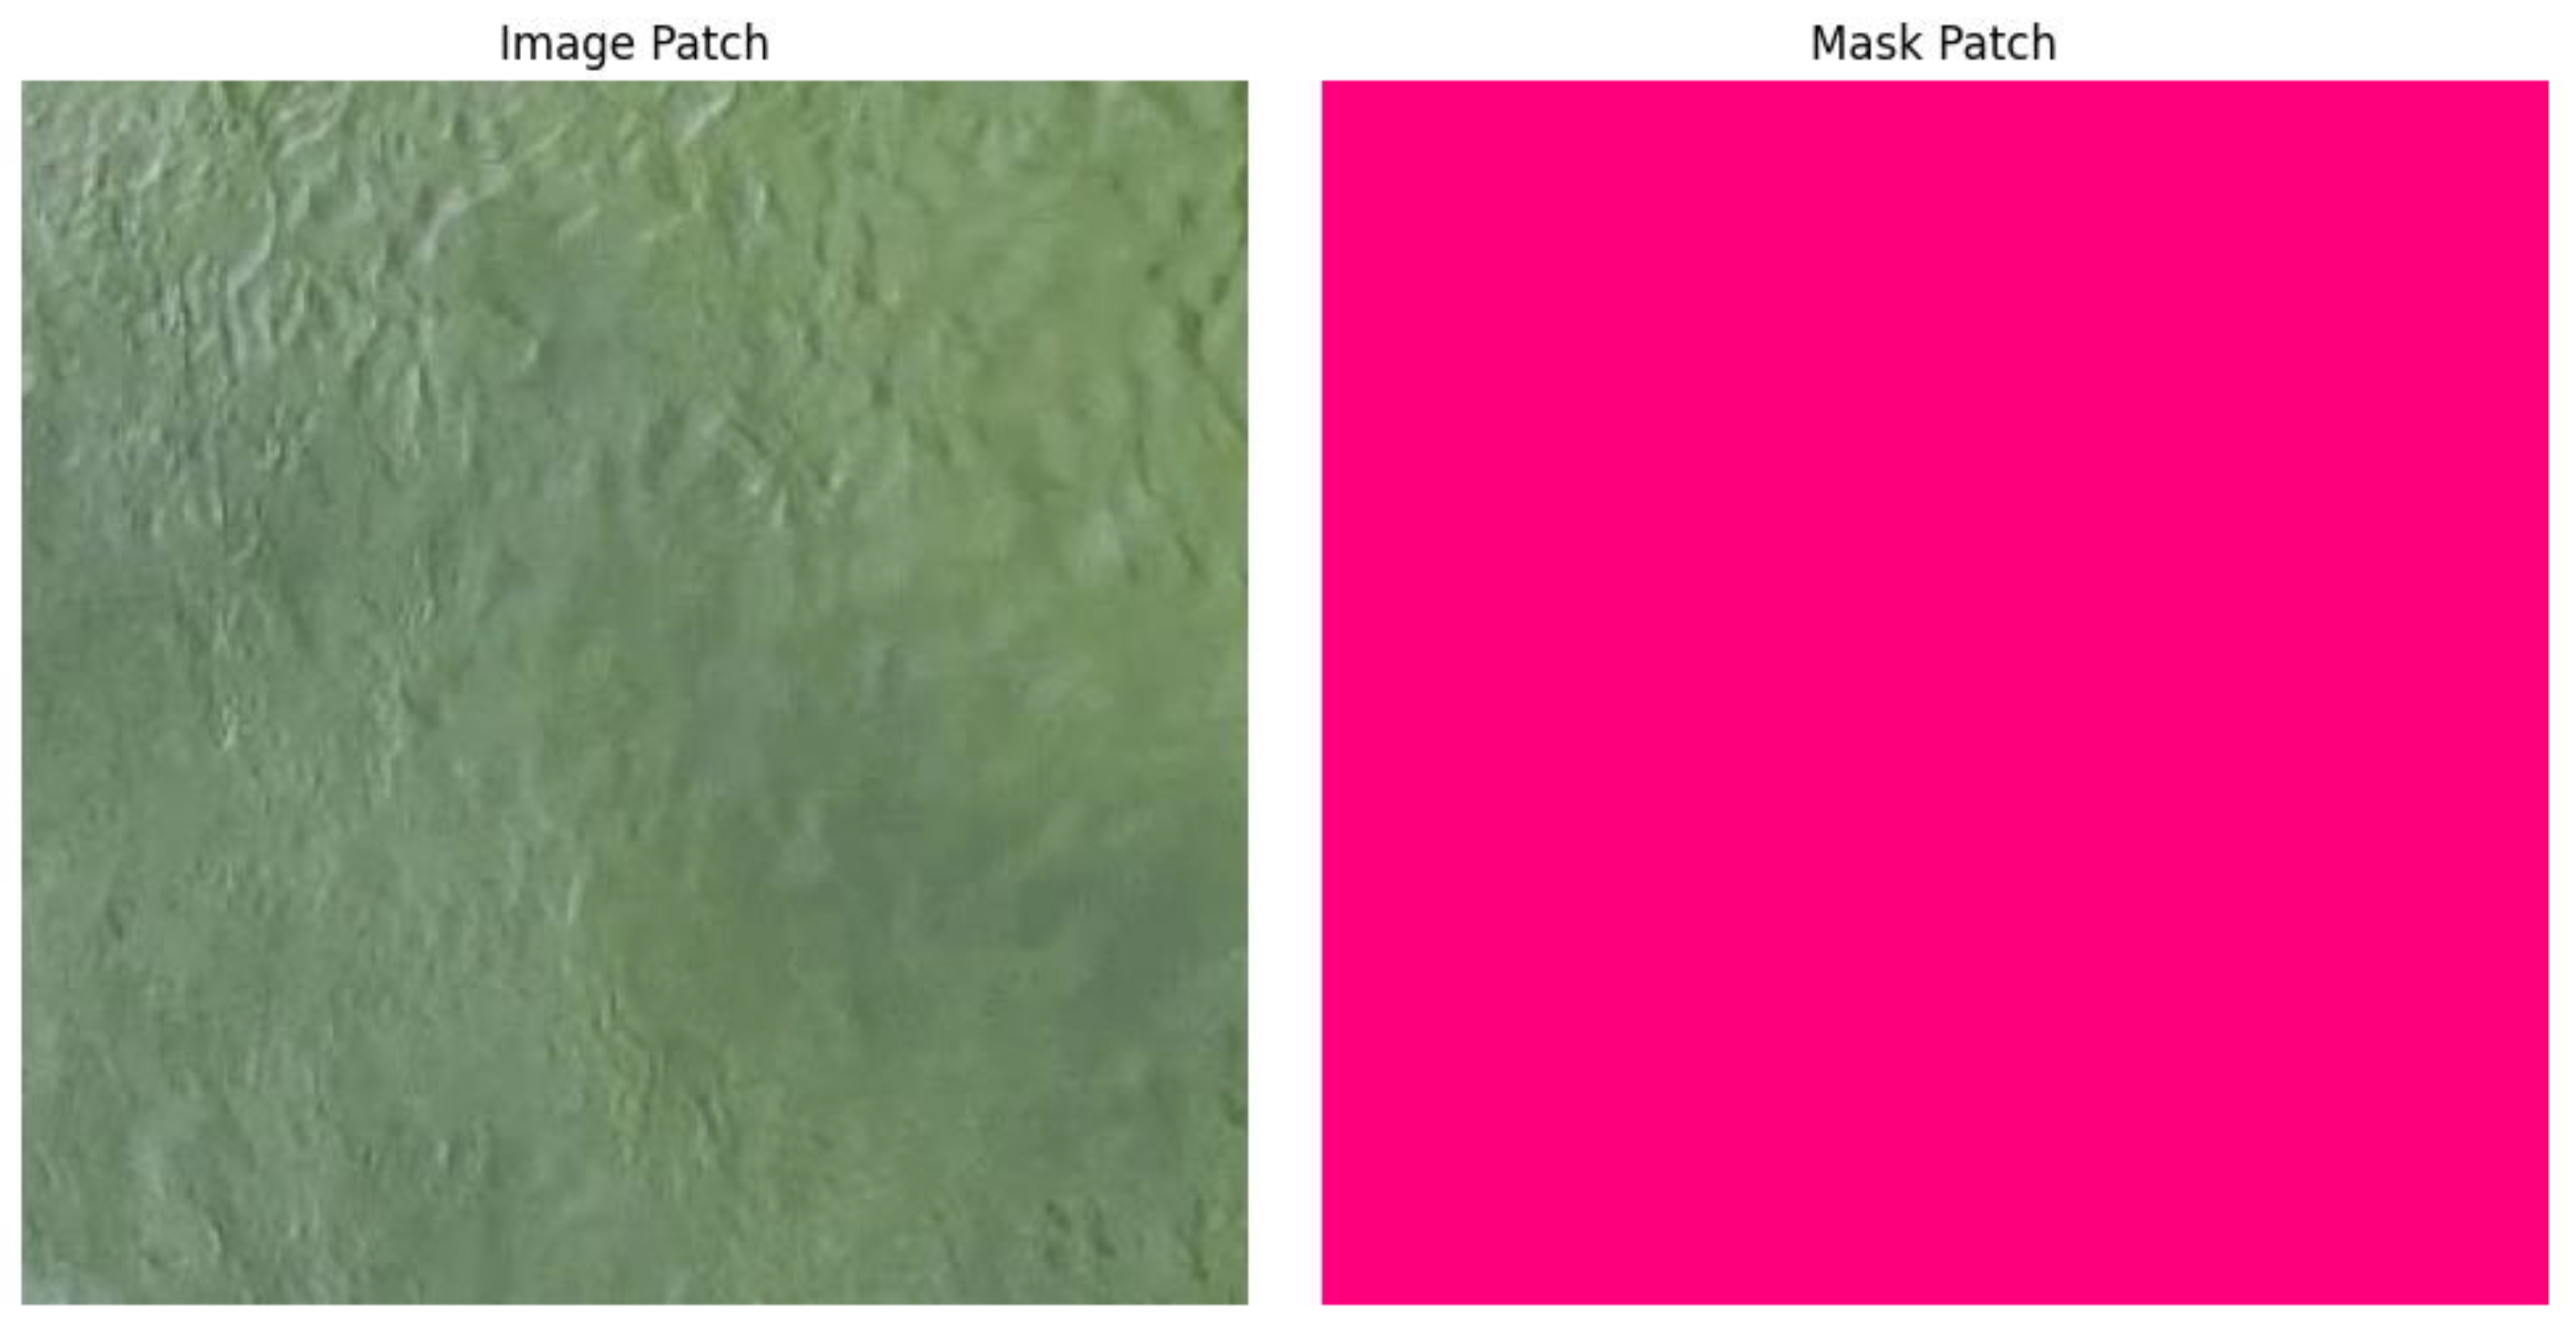
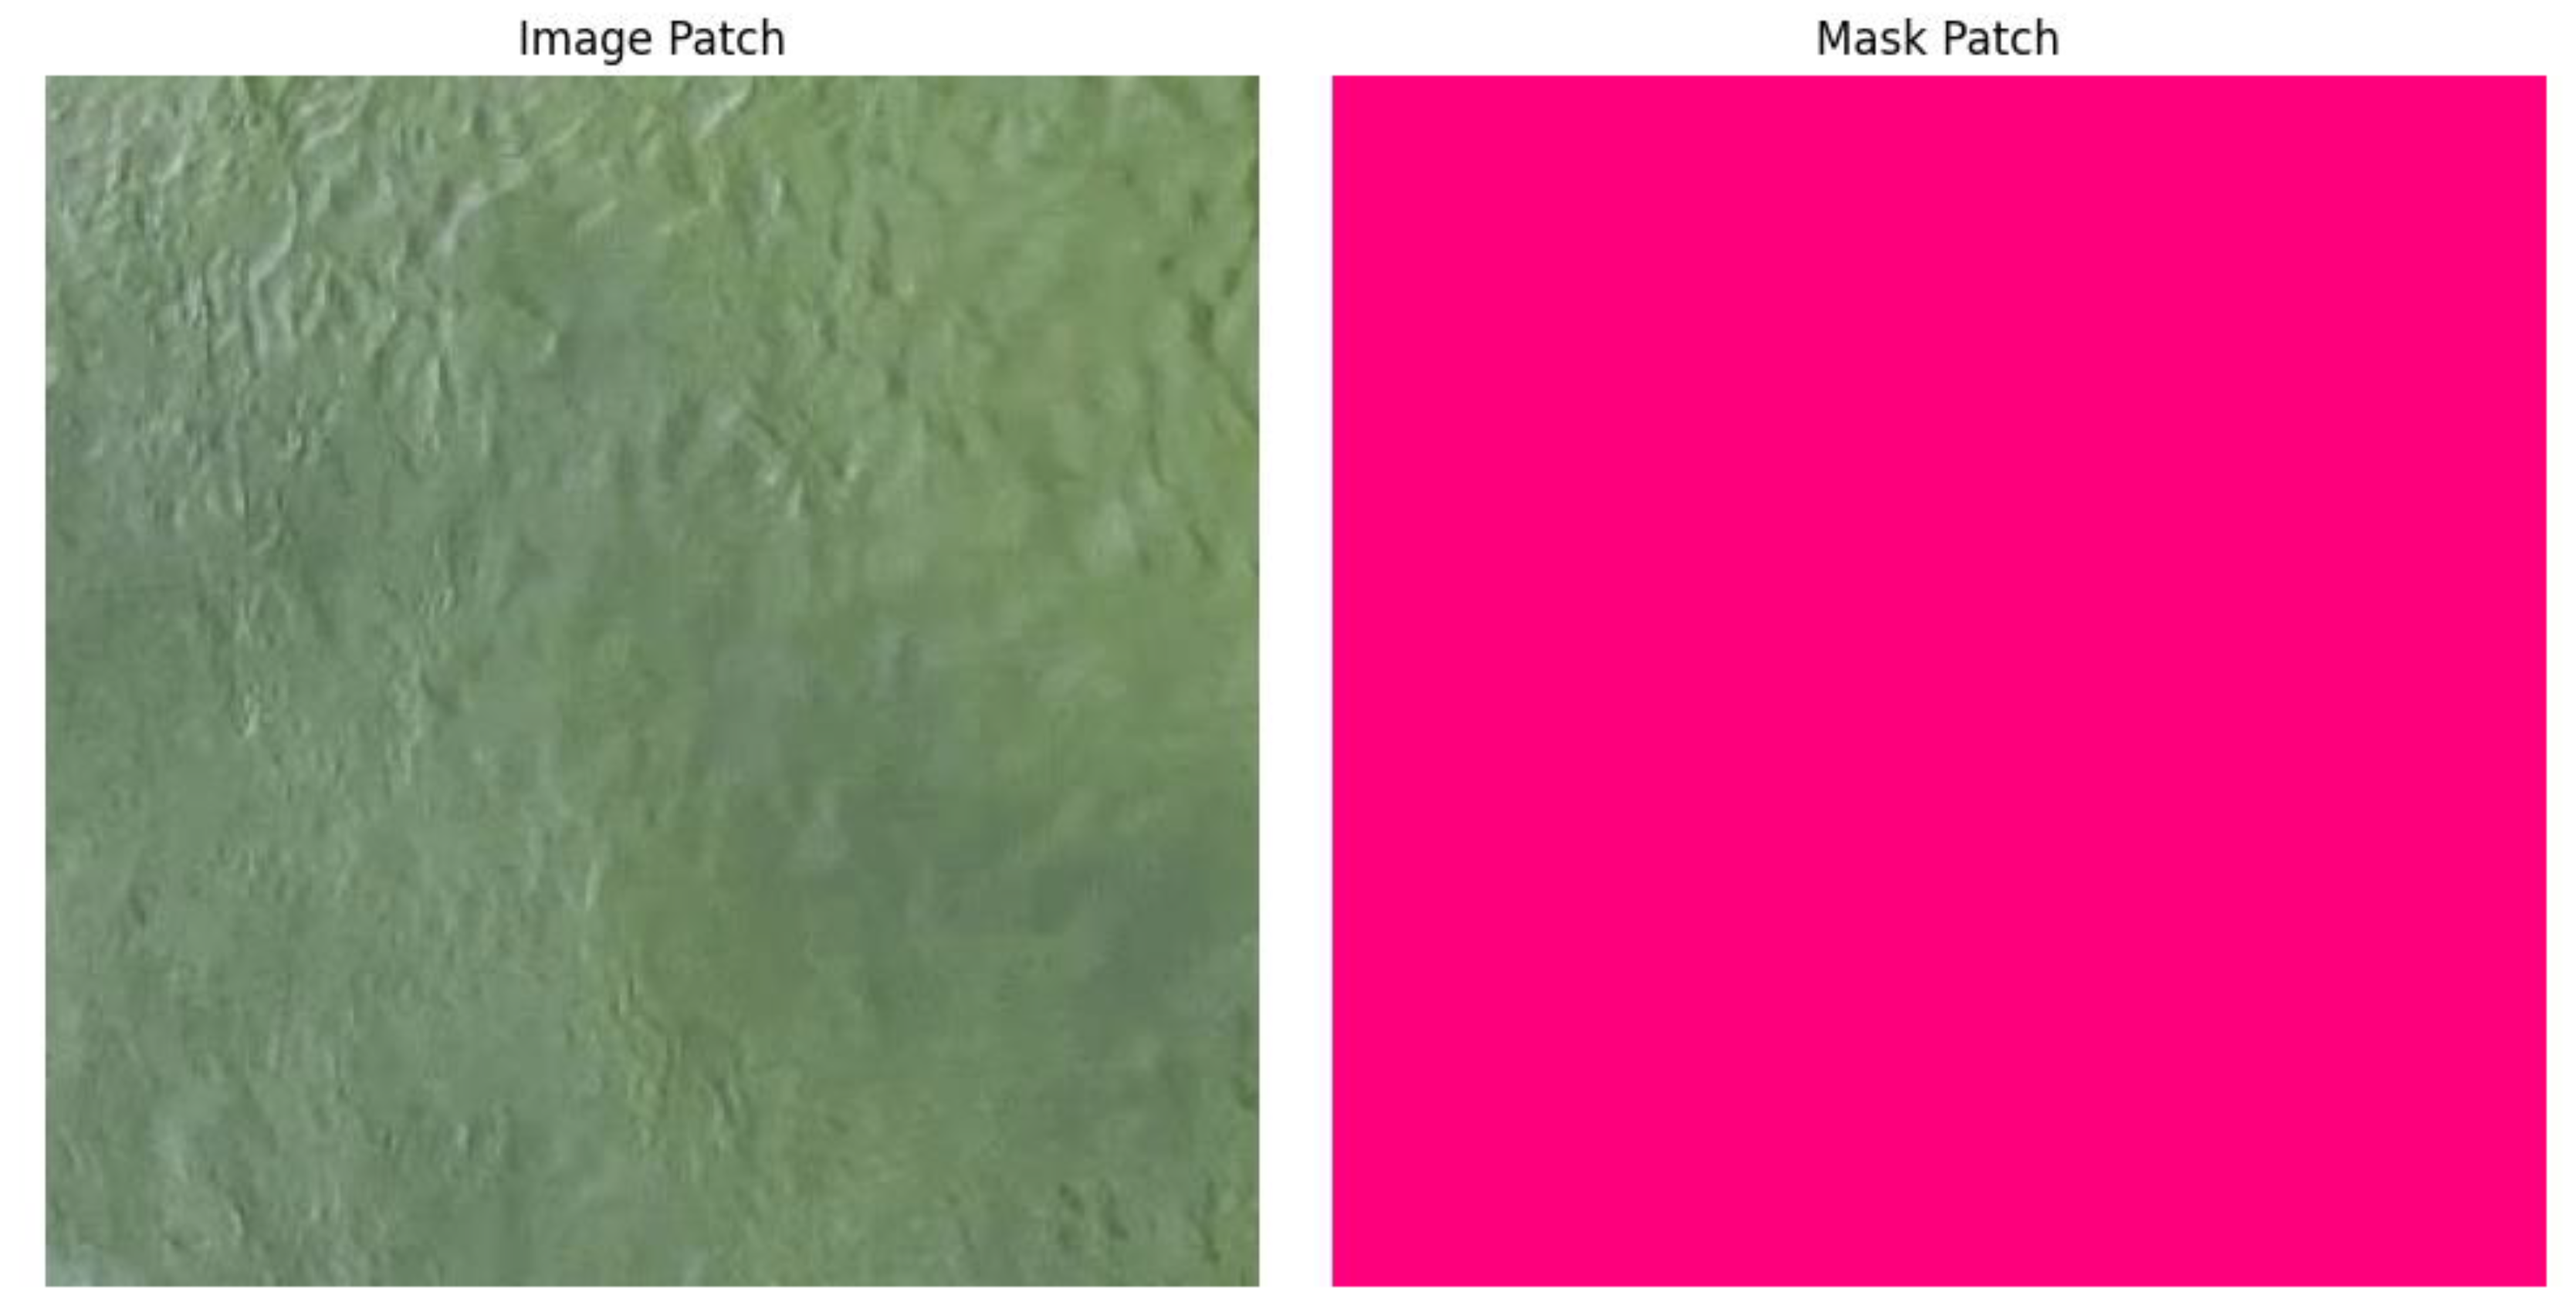
In more challenging images containing thin, fragmented slicks or low-resolution edges, the U-Net model produces soft, blurred boundaries, explaining the lower IoU for the Oil class. Visual outputs (
Figure 2 and
Figure 3) show that the model tends to slightly under-segment regions where the oil slick blends into the surrounding water due to similar pixel intensities.
Visual comparison therefore reinforces that U-Net successfully generalizes oil morphology but exhibits boundary uncertainty a common challenge in remote-sensing segmentation. These image-based observations align closely with the IoU metrics, confirming that the segmentation model is strong but subject to expected limitations in edge precision.
These figures visually confirm the accuracy levels you report (mean IoU, class IoU).They also help show where boundaries are uncertain.
Research Question 2: How accurately does the ResNet classifier predict oil spill severity?
The ResNet-18 classifier achieved an overall accuracy of 88.76%, with F1-scores of 0.90 (No Oil), 0.85 (Minor), and 0.90 (Major). These results indicate reliable performance across all three categories. However, the visual confusion matrix (
Figure 4) reveals the nuanced behavior behind these metrics.
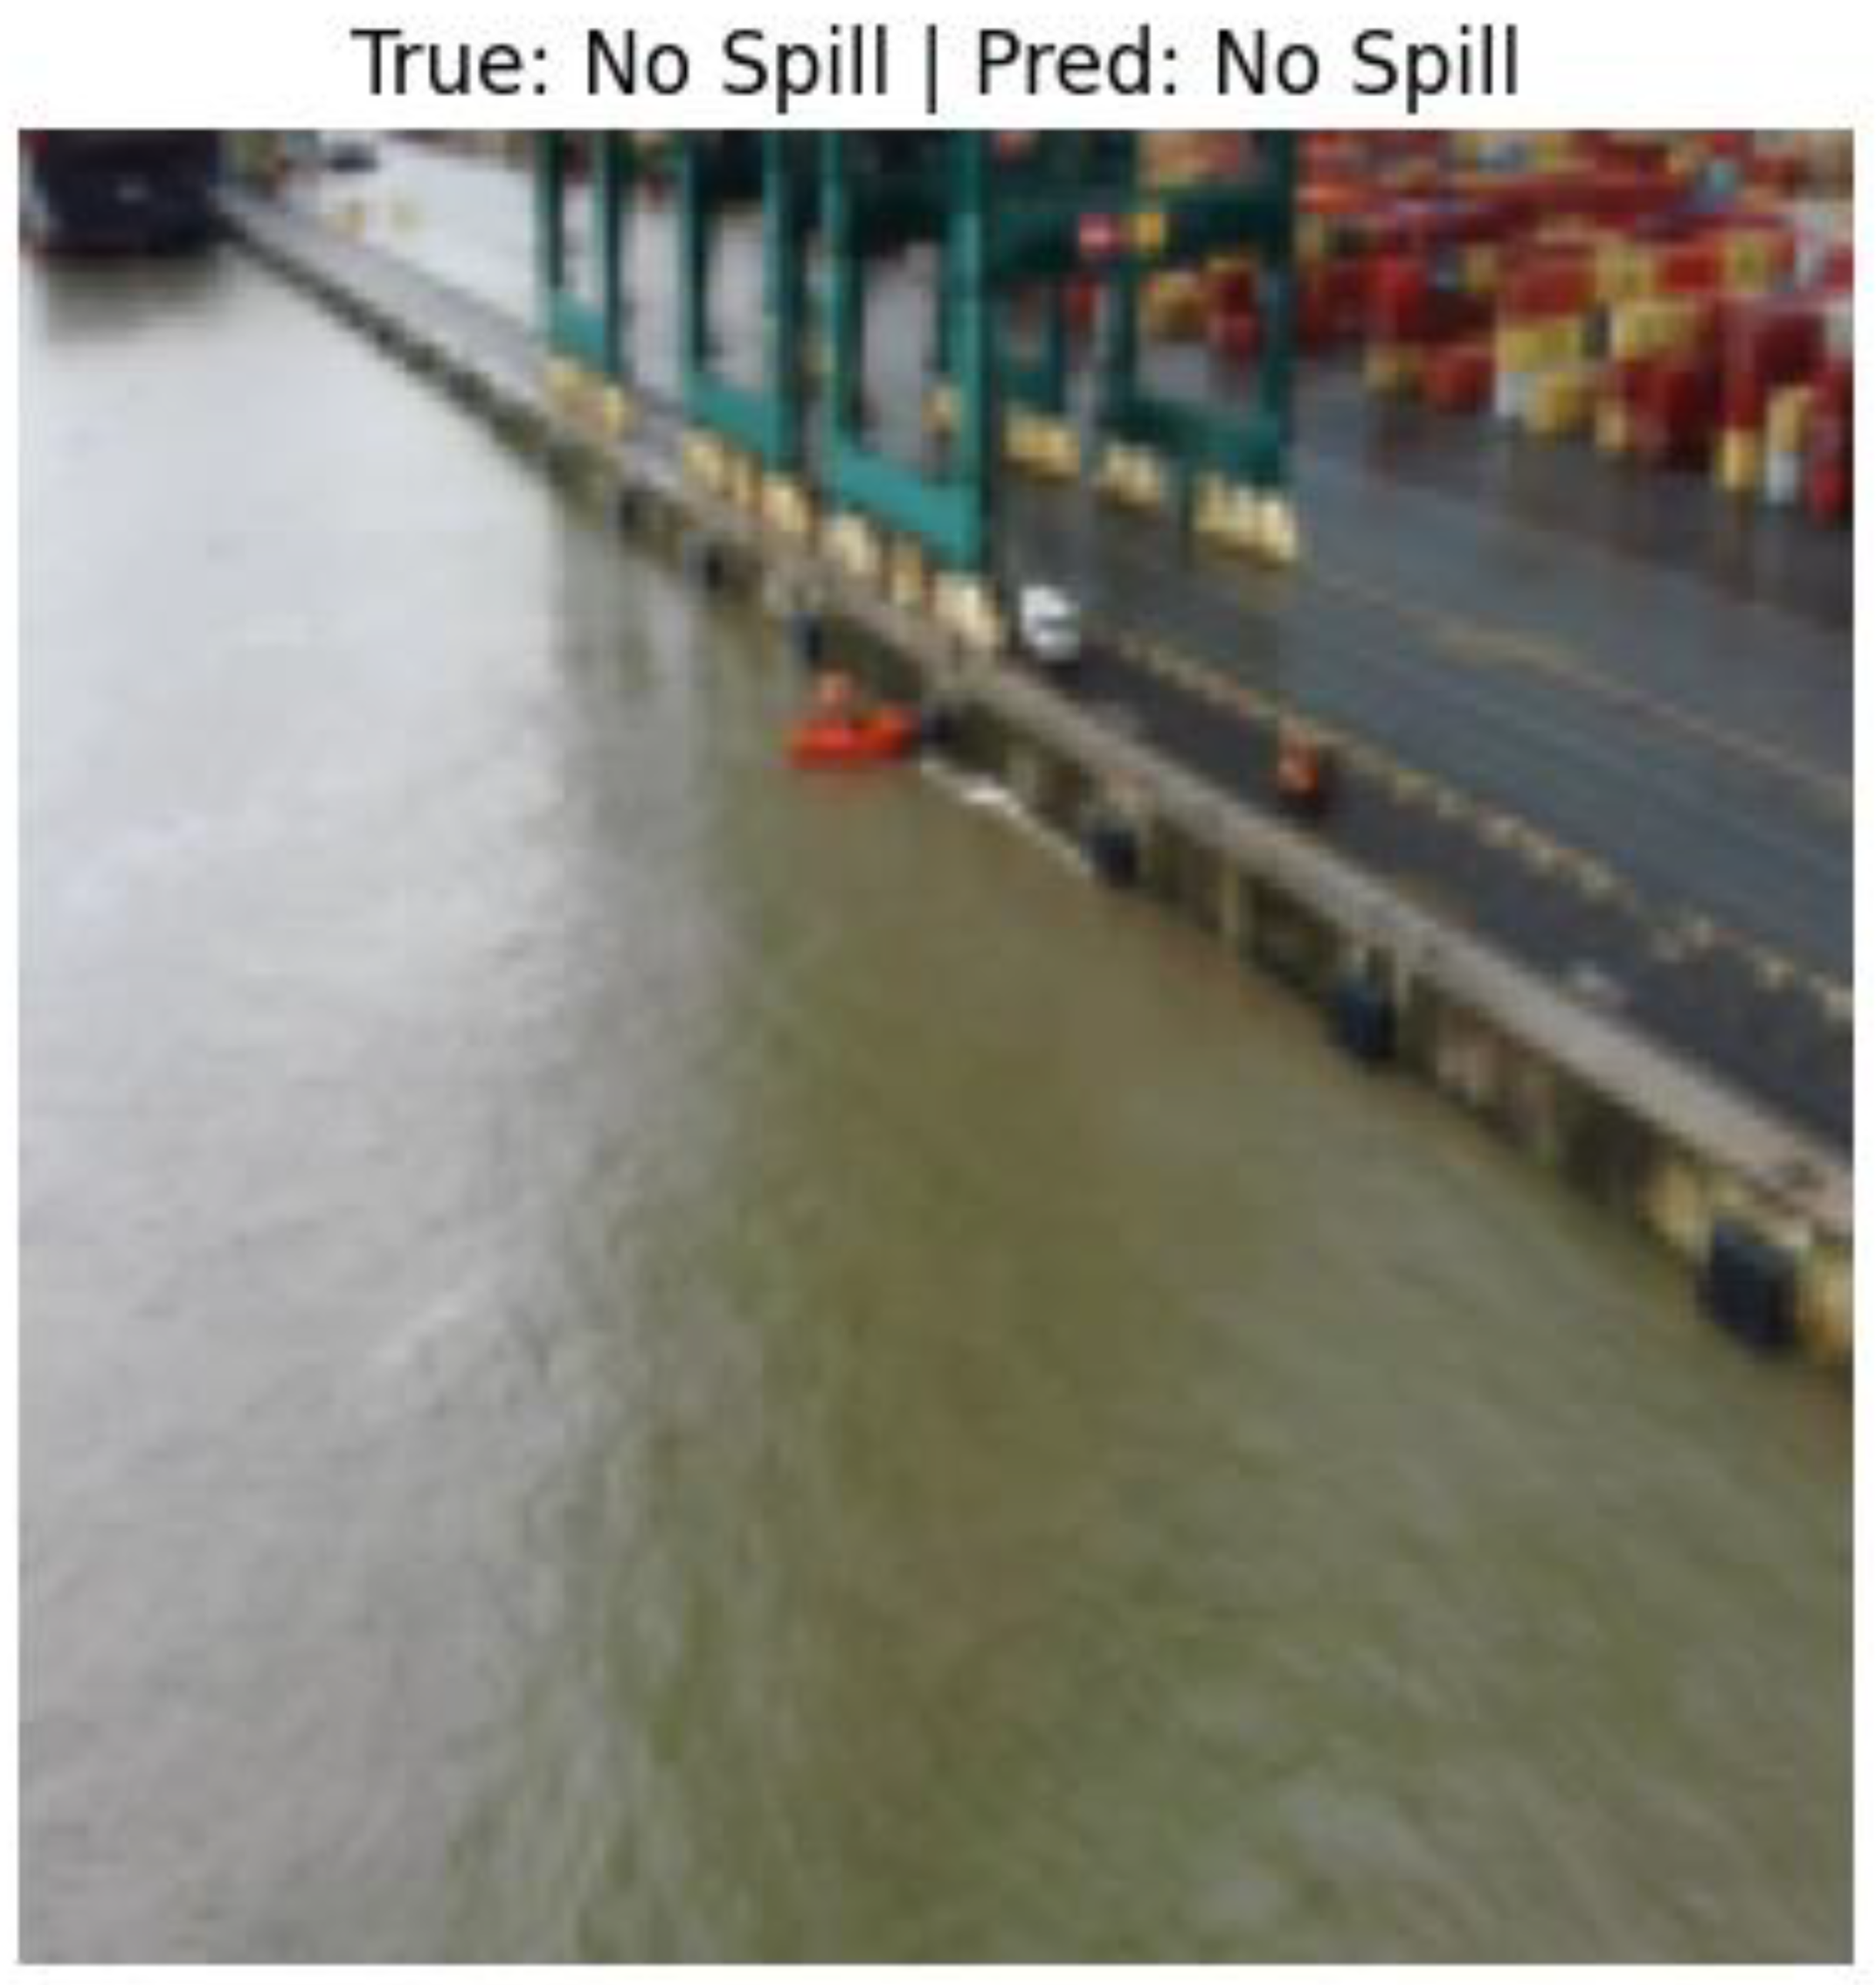
The matrix demonstrates that Misclassifications primarily occur within the Minor category, where segmentation uncertainty and the narrow 5–15% oil threshold increase prediction difficulty. Visual examples of severity classification (
Figure 5) clarify this issue. When segmentation masks slightly underestimate oil area, true Minor spills are often labeled as No Oil. Conversely, when segmentation masks slightly overestimate the oil region, Minor spills are more likely to be predicted as Major.
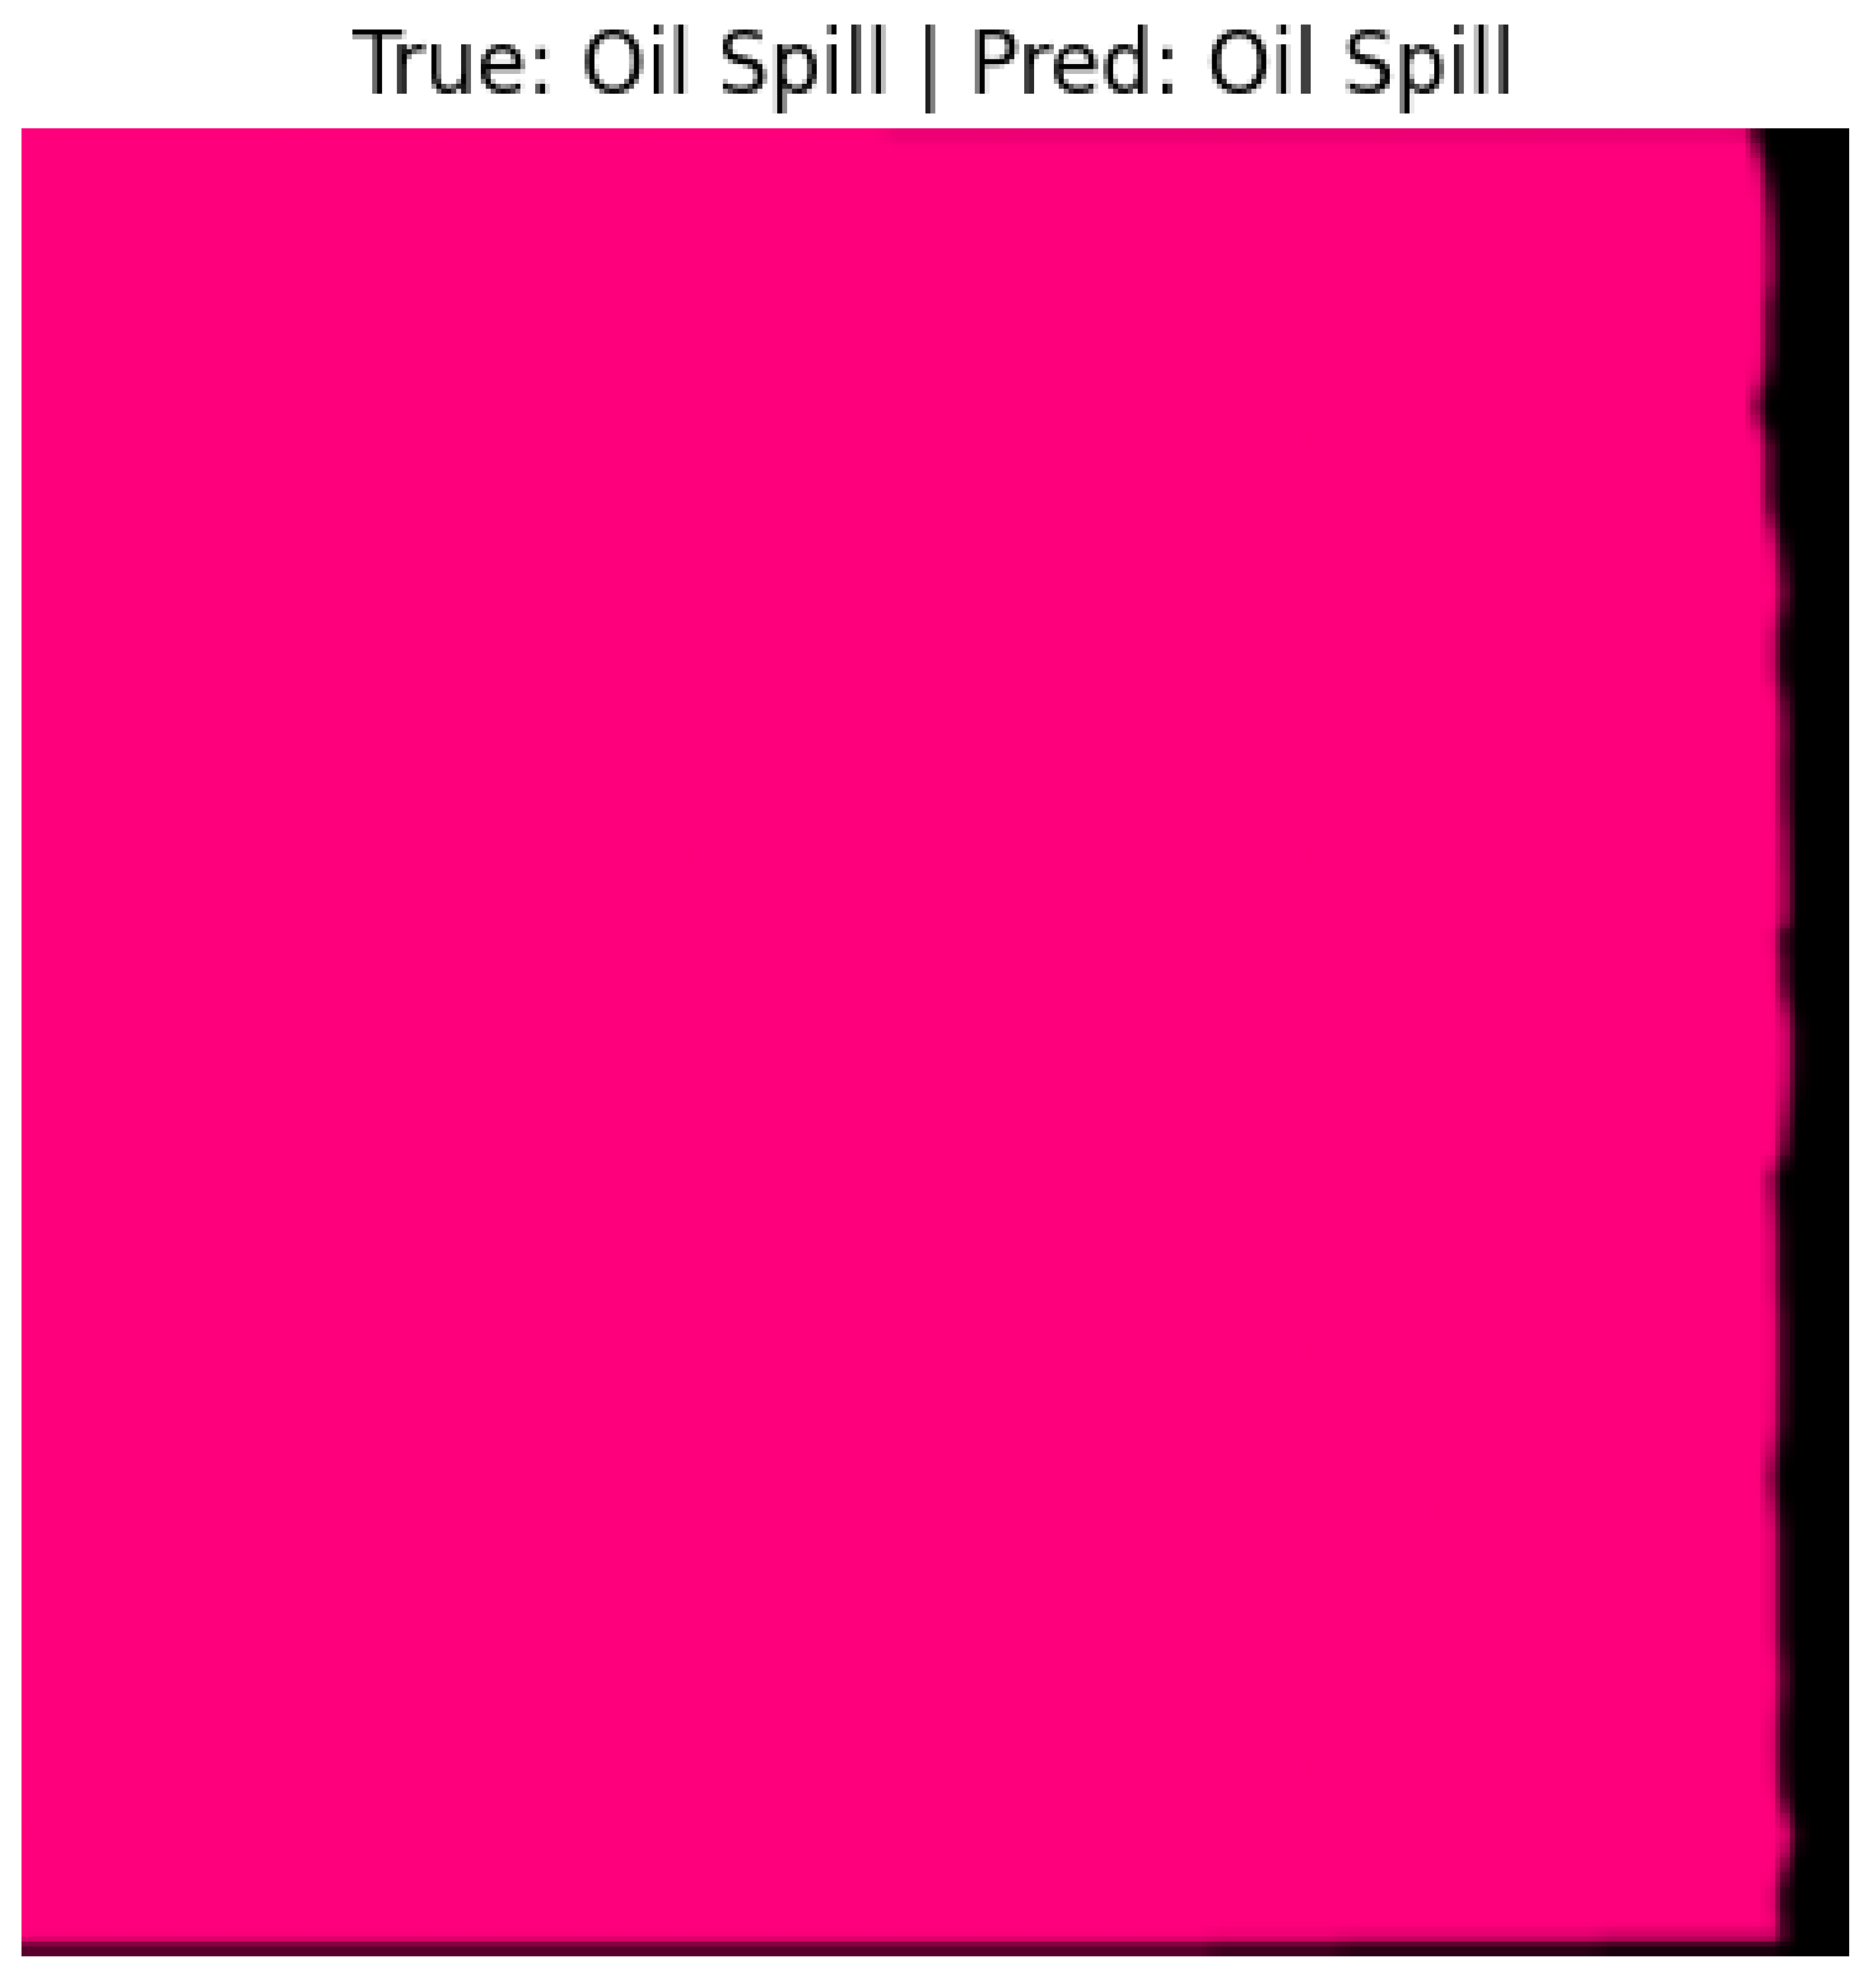
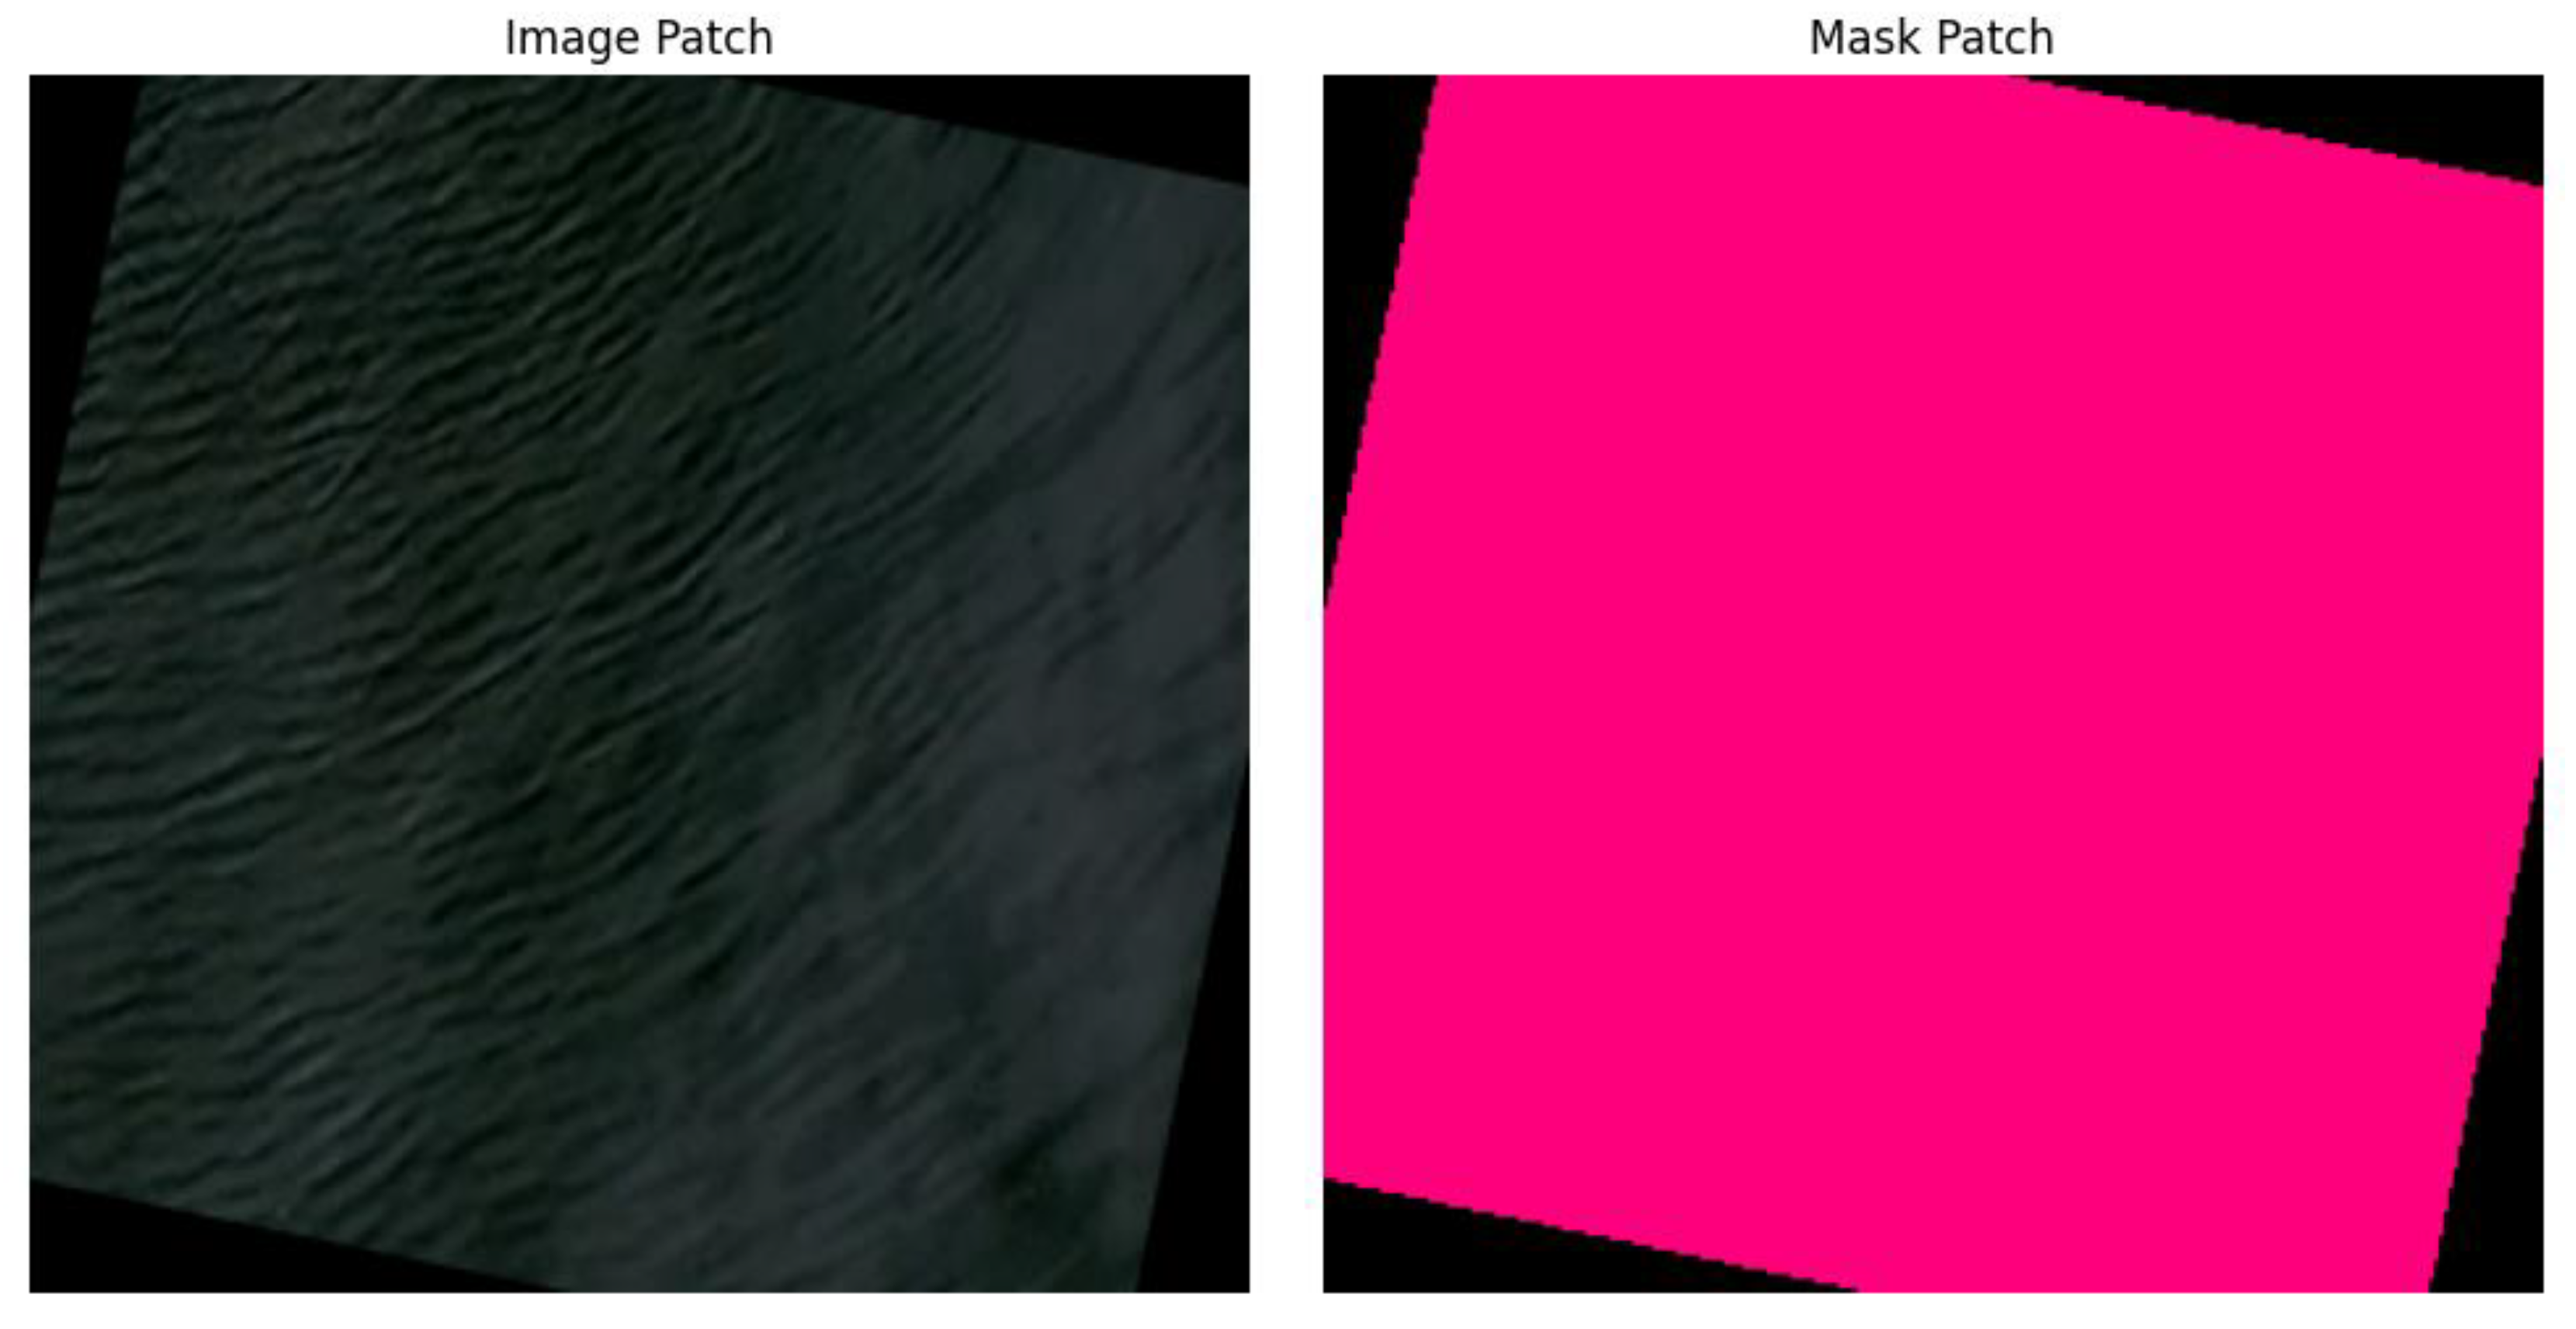
The classifier performs strongly on No Oil and Major categories because these classes present distinct, easily separable spatial patterns. For instance,
Figure 6 and
Figure 7 show that Major spills contain large, contiguous oil regions that are unmistakably different from clean water images.
Thus, the visual outputs substantiate the numerical findings: classification errors align with segmentation inconsistencies, especially near threshold boundaries. Images therefore not only validate the classifier’s accuracy but also highlight the intuitive spatial reasoning the model is performing internally.
Research Question 3: What relationship exists between segmentation quality and severity classification performance?
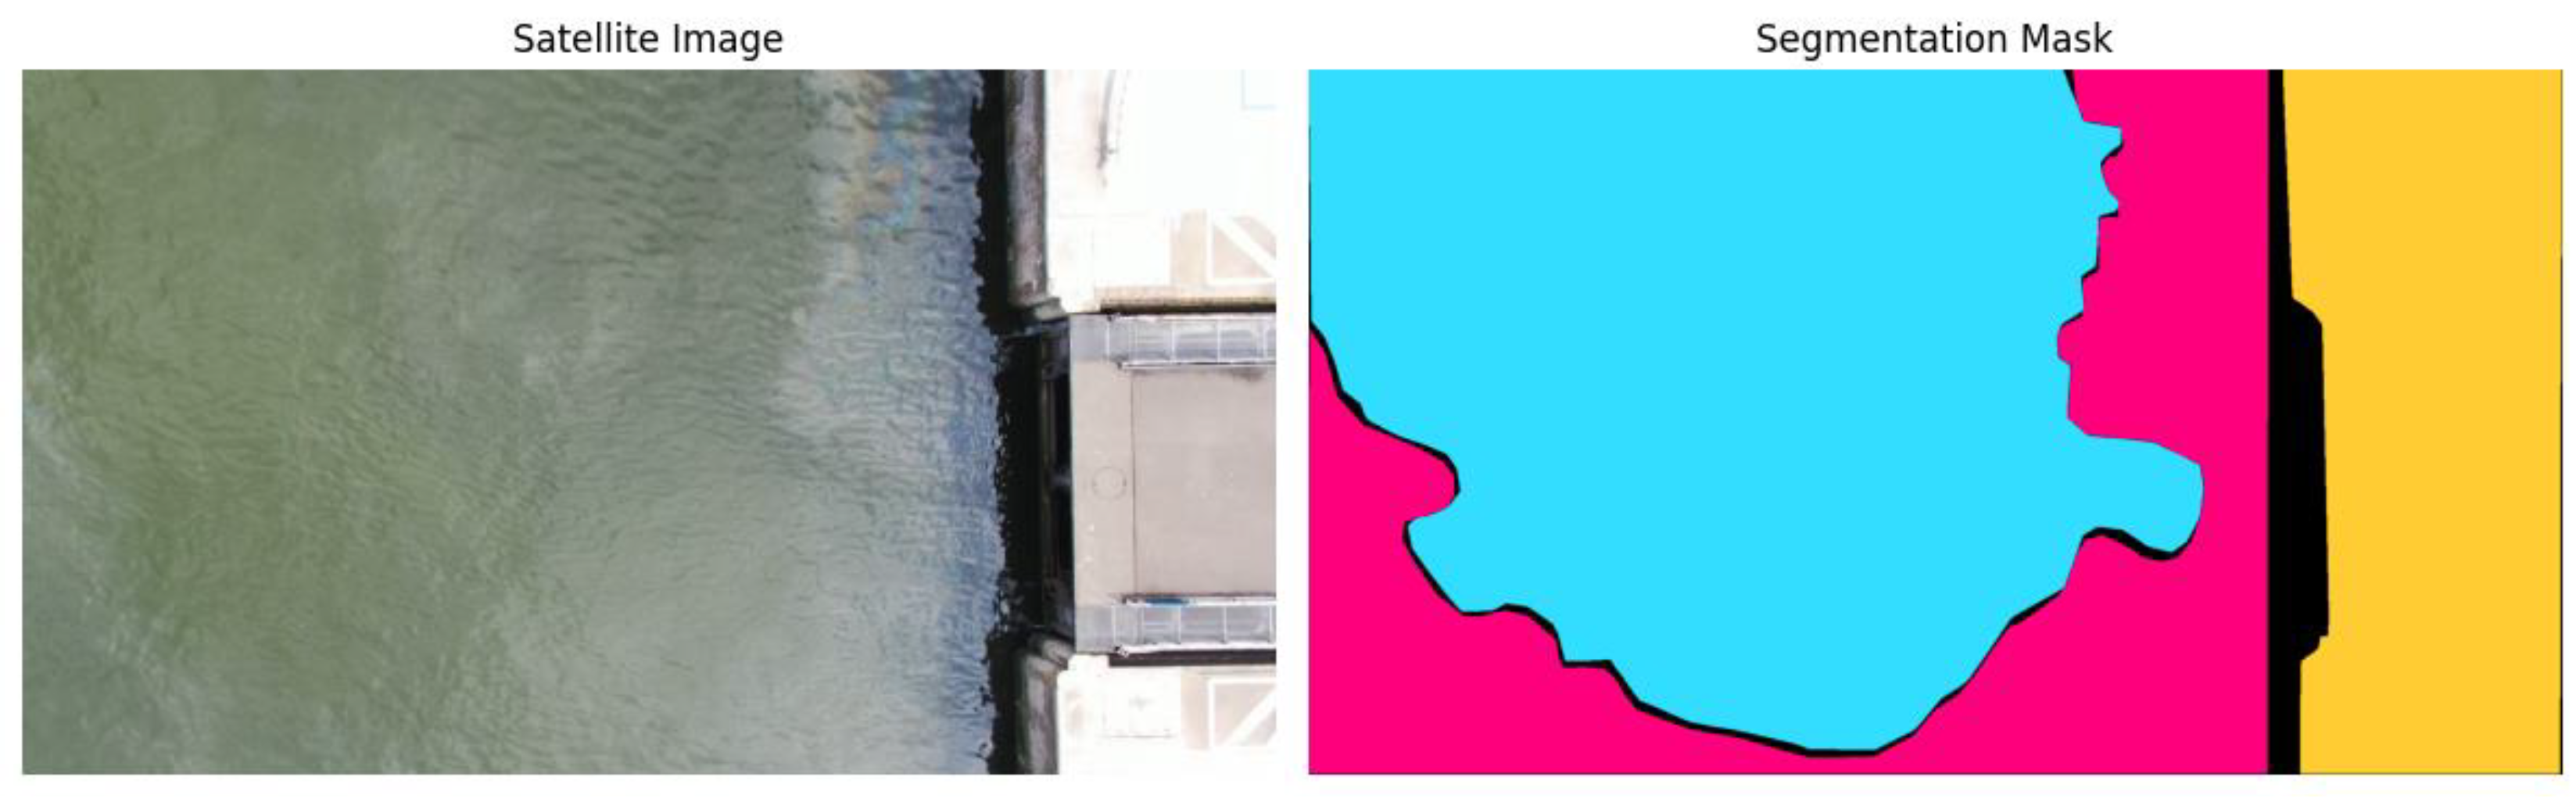
The experiments reveal a clear correlation between segmentation quality and downstream classification accuracy. Visual examples of segmentation–classification comparisons (
Figure 8) illustrate that borderline severity predictions follow borderline segmentation outputs.
For instance:
Under-segmentation leads to oil coverage below 5%, causing Minor spills to be labeled as No Oil.
Over-segmentation pushes oil coverage above 15%, causing Minor spills to be labeled as Major.
Figure 9 and
Figure 10 show precisely such cases, where segmentation noise affects classification.
Despite these relationships, the classification model exhibits remarkable robustness. Even when segmentation masks show moderate pixel noise or imperfect edges, the classifier often predicts correctly because it learns high-level spatial distributions rather than relying solely on exact oil pixel counts.
Therefore, image-based analysis confirms that while segmentation quality influences classification outcomes especially near the boundary thresholds the overall two-stage pipeline remains stable and dependable.
These images visually prove the error propagation discussed in the text.
Discussion
Summary of Results
This study developed a two-stage deep learning pipeline that integrates U-Net segmentation and ResNet-18 classification to detect and assess the severity of marine oil spills. Quantitative results show strong performance in both stages, but the visual outputs deepen the understanding of how the system behaves in real conditions.
Segmentation samples illustrate that U-Net accurately identifies oil slick structures, aligning closely with ground-truth masks even under varying lighting and ocean-surface conditions. Classification visualizations and confusion matrices further demonstrate that ResNet-18 effectively distinguishes between severity levels, with misclassifications occurring primarily in borderline cases where segmentation uncertainty is highest.
By combining numerical performance metrics with visual outputs, this study validates both the accuracy and interpretability of the two-stage pipeline key requirements for real-world environmental monitoring.
Interpretation of Visual Results
The visual outputs reveal several patterns:
Consistent Spill Shape Capture: Segmentation maps show that U-Net captures the shape and integrity of oil slicks, demonstrating true spatial understanding rather than pixel memorization.
Difficulty with Irregular Edges: Fragmented or thin slicks appear with softened boundaries in segmentation outputs, reflecting the lower IoU for the Oil class.
Clear Severity Patterns: Classification images show that Major spills produce dense, continuous oil regions, while Minor spills contain scattered patterns that are harder to classify.
Evidence of Threshold Sensitivity: Visual misclassifications directly align with slight segmentation over- or under-estimates, confirming the relationship between the two stages.
These insights underscore the importance of visual evaluation not just numeric metrics for machine-learning pipelines dealing with environmental phenomena.
Limitations Identified Through Image Analysis
The visual inspection highlights several limitations:
Dataset imbalance causes minor loss of detail in smaller oil regions.
Environmental noise (sun glint, cloud shadows) sometimes mimics oil patterns visually.
Static imagery does not capture oil spread dynamics, limiting temporal understanding.
These limitations are more apparent in images than in raw metrics, emphasizing the importance of visual analysis in performance evaluation.
Future Improvements Suggested by Visual Trends
The image-based findings suggest several promising directions:
Use of U-Net++ or transformer-based segmentation to improve boundary precision.
Inclusion of data augmentation to counter environmental variations.
Development of multi-task end-to-end models to reduce error propagation.
Integration of temporal satellite imagery to capture spill evolution.
Incorporation of uncertainty quantification to make predictions more reliable for operational agencies.
These improvements would directly address visual weaknesses observed in current model outputs.
Visual inspection plays a crucial role in evaluating the performance of deep learning models for oil spill detection. By integrating segmentation maps, classification outputs, and confusion matrices into the analysis, this revised paper provides a richer understanding of model behavior. The two-stage pipeline demonstrates high accuracy, strong interpretability, and operational potential for environmental protection agencies. With additional data and architectural enhancements, this system can serve as a foundation for real-time, scalable oil spill monitoring.
Figure 8.
Model output image extracted from notebook.
Figure 8.
Model output image extracted from notebook.
Figure 9.
Model output image extracted from notebook.
Figure 9.
Model output image extracted from notebook.
Figure 10.
Model output image extracted from notebook.
Figure 10.
Model output image extracted from notebook.
The results of this study demonstrate the significant potential of deep learning as a transformative tool for automated oil spill detection and severity assessment in satellite imagery. By implementing a two-stage pipeline composed of a U-Net segmentation model and a ResNet-18 severity classifier, the research successfully addressed core challenges associated with traditional remote-sensing approaches—namely, subjectivity, slow manual evaluation, and difficulty managing environmental variability. The integration of visual results, including segmentation masks, classification outputs, confusion matrices, and training curves, further reinforces the interpretability and operational value of the model. These visuals not only validate the numerical metrics achieved but also provide crucial context for understanding model behavior under real-world conditions.
The U-Net segmentation model displayed strong performance in identifying oil slick regions, achieving a mean IoU of 0.8156 across four classes. Visual inspection of segmentation outputs confirmed that the model effectively captured the shape, distribution, and continuity of oil slicks, even in complex aquatic environments where oil-water contrast is minimal. The segmentation challenges observed such as softened boundaries in thin or fragmented oil regions are consistent with the lower IoU for the oil class and highlight the inherent difficulty of detecting small pixel-ratio classes in satellite imagery. Nonetheless, the model consistently demonstrated an ability to distinguish oil structures from background and water, establishing a reliable foundation for downstream classification tasks.
The ResNet-18 severity classifier likewise delivered impressive performance, with an accuracy of 88.76% and balanced F1-score distribution across No Oil, Minor, and Major categories. Visual outputs, including the confusion matrix and severity prediction examples, illustrated the classifier’s strengths in distinguishing clear-cut cases while also revealing the primary source of misclassification: threshold border ambiguity in Minor spill cases. These errors were closely correlated with segmentation uncertainty, reinforcing the interdependence of the pipeline stages. Despite this, the classifier exhibited robustness, correctly identifying severity even in cases with moderate segmentation noise a promising indication of real-world applicability.
Taken together, the findings demonstrate that this two-stage architecture provides a robust, scalable, and interpretable solution capable of supporting environmental monitoring operations. Beyond accuracy, the transparency offered by segmentation maps and classification visualizations is particularly valuable for decision-makers, who require clear evidence when responding to ecological hazards. Furthermore, the pipeline’s modularity allows for straightforward enhancements, such as incorporating U-Net++ architectures, adding temporal satellite data, employing synthetic data augmentation, and integrating uncertainty estimation to improve risk-aware decision-making.
While limitations remain such as dataset imbalance, environmental variability, and the narrow severity thresholds the study provides a strong foundation for future work. The system’s performance across both stages, combined with its visual interpretability, suggests that deep learning can play a central role in modernizing marine spill detection systems. As satellite imaging technology continues to evolve and datasets expand, the approach developed in this study has the potential to be deployed at scale, offering rapid and reliable environmental surveillance. Overall, this research contributes meaningful advancements to the field of AI-based remote sensing and demonstrates that multi-stage deep learning pipelines can significantly enhance global efforts to protect marine ecosystems.
Author Note
This project was completed as part of the requirements for ANLY 699: Applied Project in Analytics at Harrisburg University. No external funding was used. The author declares no conflicts of interest.
References
- Badrinarayanan, V.; Kendall, A.; Cipolla, R. SegNet: A deep convolutional encoder–decoder architecture for image segmentation. IEEE Transactions on Pattern Analysis and Machine Intelligence 2017, 39(12), 2481–2495. [Google Scholar] [CrossRef] [PubMed]
- Cheng, G.; Yang, C.; Yao, X.; Guo, L.; Han, J. When deep learning meets metric learning: Remote sensing image scene classification via learning discriminative CNNs. IEEE Transactions on Geoscience and Remote Sensing 2020, 58(1), 439–451. [Google Scholar] [CrossRef]
- He, K.; Zhang, X.; Ren, S.; Sun, J. Deep residual learning for image recognition. In Proceedings of the IEEE Conference on Computer Vision and Pattern Recognition (CVPR); 2016; pp. 770–778. [Google Scholar] [CrossRef]
- Face, Hugging. altunian/oil_spills [Dataset]. 2023. Available online: https://huggingface.co/datasets/altunian/oil_spills.
- Iglovikov, V. I.; Shvets, A. A. TernausNet: U-Net with VGG11 encoder pretrained on ImageNet for image segmentation. arXiv:1801.05746. 2018. Available online: https://arxiv.org/abs/1801.05746.
- Zhang, Y.; Guo, W.; Li, J. Two-stage convolutional neural networks for marine oil spill segmentation and classification. IEEE Access 2022, 10, 103402–103416. [Google Scholar]
|
Disclaimer/Publisher’s Note: The statements, opinions and data contained in all publications are solely those of the individual author(s) and contributor(s) and not of MDPI and/or the editor(s). MDPI and/or the editor(s) disclaim responsibility for any injury to people or property resulting from any ideas, methods, instructions or products referred to in the content. |
© 2025 by the authors. Licensee MDPI, Basel, Switzerland. This article is an open access article distributed under the terms and conditions of the Creative Commons Attribution (CC BY) license (http://creativecommons.org/licenses/by/4.0/).