
Submitted:
27 November 2025
Posted:
01 December 2025
You are already at the latest version
Abstract
This paper presents a study focused on ensuring acoustic comfort in rooms intended for educational purposes. In educational environments, students can concentrate more effectively when sound disturbances that may distract from the learning process are minimized. Enhancing the acoustic conditions leads to improved performance and allows students to complete their activities in a calmer environment. The importance of determining the reverberation time is emphasized, as it is a key criterion in assessing the acoustic quality of enclosed spaces. The measured values were adjusted according to the standards STAS 9783/0-84 and Normative C125-2013. Three commercially available solutions were proposed to optimize the acoustic comfort of the studied room, and the most suitable solution was selected. The chosen option complies with the requirements of STAS 9783/0-84 and Normative C125-2013, thus ensuring a high level of acoustic comfort. From an interior design perspective, this solution also harmonizes best with the existing environment, particularly with the color tones of the existing HPL panels.
Keywords:
acoustic comfort
; acoustic quality
; reverberation time
; educational room
; educational process
; acoustic measurements
; acoustic optimization
1. Introduction
The duration of reverberation is defined as the time required for the sound to “disappear” into the surrounding environment after the source has stopped emitting. To quantify this, the T60 parameter is used, which represents the time necessary for the sound pressure level to decrease by 60 dB after the abrupt interruption of the test signal [1].
The concept of reverberation time was first investigated by Wallace Clement Sabine in the late 19th century at Harvard University. Using organ pipes and a stopwatch, he measured the time required for the sound level to decay by approximately 60 dB. Based on his observations, Sabine established that the reverberation time is directly proportional to the volume of the room and inversely proportional to the total sound absorption within it [2].
In educational spaces, appropriate control of reverberation is essential for improving students’ concentration and overall academic performance. High levels of reverberation can interfere with speech intelligibility and lead to cognitive fatigue. Therefore, reducing unwanted acoustic effects is critical in learning environments.
Acoustic measurements and theoretical analyses conducted in the studied room revealed that the reverberation time exceeded the acceptable limits imposed by current regulations. However, after applying the proposed acoustic treatment solutions in a theoretical model, the reverberation time values were brought within permissible thresholds. As a result, the necessary acoustic comfort to support effective teaching and learning activities was achieved.
The data available on the Web of Science platform were processed between August 30 and August 31, 2025, in order to assess the scientific impact of the topic “acoustic comfort.” Based on a comparative search using the keywords “acoustic comfort” and “acoustic comfort classrooms,” the analysis concentrated on scientific publications from the most recent ten years (2015–2024), as shown in Figure 1. Only roughly 9% of the 1,760 papers that were found to address the topic of acoustic comfort in general looked specifically at the acoustic conditions in classrooms. This comparatively low percentage points to a significant research gap and emphasizes the need for more thorough investigations into the connection between classroom acoustics and how they affect instruction, learning, and speech and sound perception [3,4,5].
The following research areas, in descending order, had the majority of scientific articles related to the topics of interest mentioned above in: engineering, construction building technology, acoustics, environmental sciences & ecology, and science & technology other topics, according to data from the same platform. With comparatively comparable percentages for the two categories examined (51% and 57%, respectively), SDG 11—Sustainable Cities and Communities—was most often cited in relation to alignment with the Sustainable Development Goals (SDGs). SDG 3—Good Health and Well-Being came in second with 37% and 43%, respectively. This distribution emphasizes the research’s prevailing emphasis on the urban and technological aspects as well as its connection to users’ health and well-being. The study [6] supports the information by emphasizing the significance of implementing the Sustainable Development Goals (SDGs) and the commitment with Agenda 2030 [7].
According to Figure 2, which shows the countries that prioritize acoustic comfort research, Asia—especially China—makes the largest contributions, followed by Europe, which is led by Italy (14%), the United Kingdom (9%), and Germany (5%). In South America, research is mostly represented by Brazil (5%), and Australia contributes 4% of the publications on this topic. In North America, the United States (8%) and Canada (3%) have noteworthy outputs. Despite the differences in output, all continents are actively engaged in research on acoustic comfort, highlighting a global recognition of its importance and a diverse range of approaches to the topic.
Acoustic comfort is critical for learning and student well-being; however, research on classroom environments remains unevenly distributed (Figure 3), with substantial gaps across many regions. Targeted, cross-regional studies are required to develop effective, globally adaptable design strategies and guidelines that ensure inclusive, healthy, and efficient learning spaces [3,4,5,8].
According to the study [9], most nations have set background noise levels for classrooms between 30 and 35 dB(A). Standards for other acoustic parameters, however, differ, in part because of linguistic factors. Regulations regarding reverberation times also differ. Additionally, in countries like South Africa and India, there are no set rules. According to the same study, children’s ability to understand speech in loud, reverberant environments reaches maturity around the age of eleven, with primary students facing greater difficulties than older kids. Other works (e.g., [8]) also emphasize the acoustic performance of classrooms and teachers’ comfort in school environments.
In summary, the objective of this research is to determine whether the classroom complies with the acoustic standards set forth by Romanian current laws and whether the suggested acoustic treatments can improve the environment for productive teaching and learning.
2. Materials and Methods
The classroom under study is designed to host lectures, scientific conferences, and various academic events, with a seating capacity of 187. The main surface materials present in the room include plaster, wood, parquet, and high-pressure laminate (HPL) plywood. Additionally, the space is equipped with standard educational furniture, a television, video projector, speakers, and a blackboard.
The plan dimensions of the room are 15 × 9 meters, with a variable ceiling height of approximately 3.30 meters. Based on these dimensions, the total volume of the room was calculated to be 458.5 m³.
The absorption coefficients were selected in accordance with the requirements of SR EN ISO 11654:1997 Acoustics — Sound absorbers for use in buildings — Rating of sound absorption and were specified for each standard frequency band (125 Hz, 250 Hz, 500 Hz, 1000 Hz, 2000 Hz, 4000 Hz).
The absorption coefficients selected for the materials present in the room are presented in Table 1, Table 2 and Table 3.
The acoustic measurements were conducted using equipment manufactured by Brüel & Kjær, comprising the following components: a sound level meter, a power amplifier (Audio Power Amplifier 100 W Stereo, Type 2716-C), an omnidirectional sound source (OmniPower Sound Source, Type 4292-L), as well as tripods and connection cables for the instrumentation. For the assessment, 18 microphone positions and one sound source position were employed (Figure 4).
All measurements were carried out in accordance with the SREN ISO 3382-2 standard, Acoustics – Measurement of room acoustic parameters – Part 2: Reverberation time in ordinary rooms [10].
3. Results
Measurements were conducted at 18 microphone positions, as illustrated in Figure 4. Reverberation time values were recorded for the six standardized frequencies: 125 Hz, 250 Hz, 500 Hz, 1000 Hz, 2000 Hz, and 4000 Hz, as presented in Table 4, Table 5, Table 6, Table 7, Table 8 and Table 9 . For the purpose of result interpretation, the average reverberation time was calculated for each frequency, as presented in Table 10.
Wallace Clement Sabine developed a model grounded in the statistical theory of the sound field. The model assumes that the sound energy density is uniform at any point within the room and that the probability of sound incidence is equal in all directions. It employs the concepts of average sound wavelength and average waveform time. According to statistical theory, the decay of sound energy in a room after the sound source is turned off follows an exponential trend. This decay is characterized by a constant parameter known as the reverberation time (T). Sabine’s approach was used to derive the well-known Sabine and Eyring formulas, which are widely applied today to determine the reverberation time in rooms with known volume and absorption properties [2].
Based on his research, Sabine described the reverberation phenomenon and proposed an empirical formula for calculating reverberation time [2]. Considering sound absorption through air transmission, he derived the equation presented in reference [2].
Numerous studies have demonstrated that reverberation time can be used as a rapid estimator for various acoustic parameters and indices describing a room’s acoustic quality. Consequently, reverberation time remains a key factor in the design of lecture halls, concert halls, and similar spaces [2].
In this study, reverberation time values were calculated using Sabine’s formula, as summarized in Table 11.
Table 11 also shows that the differences between the calculated and measured reverberation time values are very small (under 5–10%). This indicates that the measurements were performed accurately and that the calculations closely reflect the actual conditions.
4. Discussion
The reverberation time values presented in Table 11 were analyzed in accordance with the requirements of STAS 9783/0-84 [10]. The interpretation of the data is graphically represented in Figure 5, Figure 6, Figure 7 and Figure 8, which illustrate the variation of reverberation time across the six standardized frequencies and validate the accuracy of the theoretical and measured values.
A comparative study was also carried out between the requirements of standard STAS 9783/0-84 [10] and those of the C125-2013 regulation [11]. This comparative analysis is presented in Figure 9.
Figure 5 shows that, according to STAS 9783/0-84 [10], the acoustic performance of the unoccupied classroom does not meet the required standards, highlighting the need for rehabilitation.
As shown in Figure 6, in the scenario where the classroom is 50% occupied, the lower and upper limits specified by the STAS 9783/0-84 [10] standard are met only at the frequency of 125 Hz. For the remaining frequencies analyzed, the reverberation times fall outside the permissible range. Consequently, acoustic rehabilitation of the classroom is necessary under 50% occupancy conditions. Since the upper limit imposed by the standard is exceeded, the use of sound-absorbing materials is required in order to ensure appropriate acoustic comfort.
As illustrated in Figure 7, the Tf/Tm ratio curve remains within the upper and lower thresholds specified by the STAS 9783/0-84 [10] standard. This result demonstrates that the complete upholstering of classroom seating constitutes an acoustically effective intervention, capable of ensuring compliance with reverberation time requirements and providing the necessary acoustic comfort for public listening environments.
Based on the measurements performed, reverberation time values were obtained for the six standardized octave-band center frequencies. The results indicate that the measured reverberation times do not comply with the limits specified in STAS 9783/0-84 [10]. Consequently, three acoustic rehabilitation solutions involving treatments applied to the rear wall of the room were analyzed (Figure 8a, Figure 8b, and Figure 8c), with the aim of achieving the required acoustic comfort. The rear wall of the classroom was selected for the installation of acoustic panels, as it provided the largest unobstructed surface among all walls and represents a common and practical choice, particularly in lecture halls, classrooms, and conference rooms. This choice was motivated by the fact that the rear wall often reflects sound waves directly into the room, potentially causing undesirable echoes and increased reverberation time.
In all proposed configurations, the complete upholstering of the seating was also included as a complementary measure.
Based on the calculations performed, the proposed acoustic treatment solutions are as follows: (S1) 11 panels of the Mega Acoustic FiberPro 120 Binary Bean Natura type [12]; (S2) 11 panels of the Razor 25 mm Acoustic Panel type [13]; (S3) 31 panels of the KusWave 3D polyester fiber acoustic panel type [14] (Figure 8).
An economic analysis was also carried out for each proposed solution (Table 12).
The analysis was conducted in September 2025 using up-to-date market prices for materials, with labor costs explicitly included, providing a comprehensive assessment of each proposed solution’s overall feasibility.
As presented in Table 12, Solution 2 exhibits the greatest economic advantage, based on a comprehensive assessment of material costs and labor requirements.
A comparative analysis was conducted between the calculation methods specified in STAS 9783/0-84 [10] and those outlined in Normative C125-2013 [11], as illustrated in Figure 9.
As evidenced by the data presented in Figure 9 all three solutions ensure compliance with the acoustic comfort requirements specified in STAS 9783/0-84 [10] and Normative C125-2013 [11].
Additionally, a comparative analysis was conducted between the calculation methodologies defined by STAS 9783/0-84 [10] and Normative C125-2013 [11]. The results indicate that, when all chairs in the classroom are upholstered, the acoustic parameters meet the conditions imposed by both technical standards (Figure 9).
These findings highlight the effectiveness of targeted acoustic treatments, particularly when combined with upholstered seating, in achieving compliance with national acoustic standards in educational spaces.
Implementing appropriate acoustic treatments in combination with upholstered seating offers a practical and effective means to satisfy regulatory standards and improve the acoustic environment within classrooms.
Based on the findings of the present study and existing literature, including Puglisi et al. (2015) [15], several recommendations can be made to optimize classroom acoustics. Optimizing reverberation time is critical and can be achieved through the use of acoustic panels and appropriate classroom design tailored to room dimensions and volume. Additionally, monitoring teachers’ vocal effort and providing ergonomic interventions, such as microphones or scheduled vocal breaks, can enhance vocal comfort and reduce the risk of voice strain. Finally, students’ age differences and special educational needs should be considered when implementing acoustic interventions to ensure an inclusive and effective learning environment.
In line with previous research in this field, room mode analysis and measured reverberation times were employed to assess the acoustic quality of study rooms. The results indicate that the classrooms exhibit suboptimal sound conditions, leading to student annoyance, discomfort, anxiety, and stress, in addition to reduced speech intelligibility and comprehension difficulties [16].
Future research should focus on three main areas: listening, learning, and well-being.
Most existing studies have concentrated on speech perception, which, although an important starting point, does not fully capture higher order listening processes. Future investigations should therefore extend to listening comprehension and communication skills, as these are fundamental for effective classroom interaction and knowledge acquisition. Comprehension refers to the reception of information, meaning, or intent, while communication represents the transfer of such information between individuals and requires active participation. Understanding how acoustic treatment influences these skills is crucial for establishing optimal acoustic conditions in educational environments [17].
With respect to learning, only a limited number of studies have examined outcomes such as attention and reading performance. Further research is needed to explore additional cognitive processes, including memory, and broader academic outcomes, such as literacy and numeracy performance. Moreover, learning behaviors—such as motivation and persistence—should also be investigated, as the classroom remains the primary environment for students’ cognitive and academic development [17].
Regarding well-being, existing studies rely predominantly on subjective measures, which are vulnerable to response biases. Future studies should integrate objective physiological indicators, such as cortisol levels, to provide more robust evidence. Furthermore, emotional well-being should be examined in connection with mental health outcomes, including anxiety and depression, which are increasingly relevant in contemporary educational contexts [17].
Several methodological aspects must also be addressed. The types of acoustic treatments (e.g., material, thickness, absorption/diffusion properties, frequency ranges) and their placement (ceiling, walls, or other surfaces) should be systematically evaluated, along with the extent of surface coverage. Techniques such as acoustic modeling and auralisation can support the design and retrofitting of classrooms to create optimal listening conditions. Collaboration between researchers and acoustic engineers would enhance the methodological rigor and practical impact of such studies [17].
In addition, the acoustic parameters measured should extend beyond overall reverberation time to include a broader set of indices. Assessing the impact of these parameters may yield valuable insights into the acoustic conditions most conducive to listening, learning, and well-being [17].
Finally, research should consider the diversity of classroom activities (lectures, group work, independent study), the realism of background noise conditions, and the full age range of learners, from preschool children to adults. Particular attention should be given to students with special educational needs, such as those with hearing loss, non-native language backgrounds, or autism spectrum disorders, who may require more favorable acoustic environments than typically developing peers [17].
These findings emphasize the need for proper acoustic design and continuous monitoring of classroom sound environments to support learning outcomes, teachers’ vocal health, and students’ well-being. A recent meta-analysis [18] shows that higher noise levels are associated with reduced student performance, highlighting the importance of considering noise as a critical factor in educational settings and implementing effective noise-reduction strategies.
Acoustic comfort is a critical factor in the execution of classroom activities, particularly those demanding high levels of concentration and active participation. Optimal acoustic conditions are essential for an effective teaching–learning process. Inadequate acoustic design can negatively impact students’ cognitive performance as well as increase the physical and mental strain on instructors. Conversely, classrooms with well-designed acoustics facilitate a more interactive and efficient learning environment [19].
In the context of education for sustainable development, it is essential to raise awareness of the adverse effects generated by the increasingly noisy and disruptive society in which we live, as well as to emphasize the benefits of tranquility and balance [20].
5. Conclusions
Compliance with normative limits confirms conformity with acoustic comfort requirements, whereas exceeding these limits indicates the need for implementing corrective acoustic measures.
The objective of the present study was to ensure acoustic comfort within an educational space. Based on both theoretical calculations and practical measurements of reverberation time, three acoustic treatment solutions were proposed to comply with the requirements set forth by STAS 9783/0-84 and Normative C125-2013.
Considering technical performance, economic feasibility, and aesthetic aspects, the optimal solution was identified as Solution 2, which involves upholstering all seats and installing 11 units of The Razor 25 mm Acoustic Panels.
The study found that the results obtained through calculations based on STAS 9783/0-84 and Normative C125-2013 were highly consistent. According to STAS 9783/0-84, acoustic comfort is achieved by meeting the specified reverberation time values under both 50% and 100% occupancy conditions. In contrast, Normative C125-2013 requires that reverberation times do not exceed maximum permissible limits to ensure acoustic comfort.
In addition to the three solutions presented in the previous chapter, the complete upholstery of all seating within the room was also implemented, a measure that contributes significantly to enhancing the acoustic performance of the space. This additional intervention, together with the previously proposed solutions, ensures full compliance with the acoustic criteria established by both standards, thereby confirming their effectiveness in providing an appropriate acoustic environment for educational spaces.
References
- Vedantu. What is Reverberation? Definition, Types of Reverb and Applications of Reverberation. Available online: https://www.vedantu.com/physics/reverberation (accessed on 7 July 2025).
- Nowoświat, A.; Olechowska, M. Investigation Studies on the Application of Reverberation Time. Faculty of Civil Engineering, Silesian University of Technology, Poland, March 2016.
- Bhandari, N.; Tadepalli, S.; Gopalakrishnan, P.; et al. Investigation of acoustic comfort, productivity, and engagement in naturally ventilated university classrooms: Role of background noise and students’ noise sensitivity. Build. Environ. 2023, 249, 111131. [Google Scholar] [CrossRef]
- Yan, F.; Zhang, Y.; Yu, T.; Li, X.; Wei, J. Conceptual framework of acoustic comfort design enablers for a classroom: A systematic review. J. Build. Eng. 2024, 95, 110160. [Google Scholar] [CrossRef]
- Romanian Journal of Acoustics and Vibration. Article 255. Available online: https://rjav.sra.ro/index.php/rjav/article/view/255/110 (accessed on 30 August 2025).
- Sánchez-Guevara Sánchez, C.; Neila González, J.; Bedoya Frutos, C.; Fernández Bandera, C.; López-Mesa, B.; et al. The relevance of sustainable development goals for building sustainability assessment. Sustainability 2019, 11(13), 3573. [Google Scholar] [CrossRef]
- United Nations. Transforming our world: The 2030 Agenda for Sustainable Development; Resolution adopted by the General Assembly on 25 September 2015. Available online: https://docs.un.org/en/A/RES/70/1 (accessed on 30 August 2025).
- Tong, Y.G.; Md Amin, N.D.; Othman, M.H.; Abas, N.H.; Ewon, U.; Mohd Zaim, M.A.Z. Assessments of acoustical performance of classrooms and teachers’ acoustical comfort in the school environment—A case study. Int. J. Integr. Eng. 2022, 14(6), 406–414. [Google Scholar] [CrossRef]
- Shield, B.; Dockrell, J.; et al. Background noise levels and reverberation in classrooms worldwide. J. Build. Eng. 2024; in press. [Google Scholar] [CrossRef]
- SR EN ISO 3382-2:2008; Acoustics — Measurement of Room Acoustic Parameters — Part 2: Reverberation Time in Ordinary Rooms. Romanian Standards Association (ASRO): Bucharest, Romania, 2008.
- Ministry of Development, Public Works and Administration (MDLPA). Normative on Acoustics in Buildings and Urban Areas, Indicative C125-2013; Bucharest, Romania, 2013.
- Muziker. Mega Acoustic FiberPro 120 Binary Bean Natural Absorbing Panel. Available online: https://www.muziker.ro/mega-acoustic-fiberpro120-binary-bean (accessed on 7 July 2025).
- GIK Acoustics Europe. The Razor 25 mm Acoustic Panel. Available online: https://gikacoustics.net/ (accessed on 7 July 2025).
- Kingkus. 3D Bella Acoustic Panel. Available online: https://www.kingkus.com/product/3dbella (accessed on 7 July 2025).
- Puglisi, G.E.; Cantor Cutiva, L.C.; Pavese, L.; Castellana, A.; Bona, M.; Fasolis, S.; Lorenzatti, V.; Carullo, A.; Burdorf, A.; Bronuzzi, F.; Astolfi, A. Acoustic comfort in high-school classrooms for students and teachers. Energy Procedia 2015, 78, 3096–3101. [Google Scholar] [CrossRef]
- Ibrahim, S.A.J. Room mode analysis for classrooms: a case study in the College of Engineering. IOP Conf. Ser.: Mater. Sci. Eng. 2020, 870, 012061. [Google Scholar] [CrossRef]
- Mealings, K. The Effect of Classroom Acoustic Treatment on Listening, Learning, and Well-Being: A Scoping Review. Acoust. Aust. 2023, 51, 279–291. [Google Scholar] [CrossRef]
- Fretes, G.; Palau, R. The Impact of Noise on Learning in Children and Adolescents: A Meta-Analysis. Appl. Sci. 2025, 15, 4128. [Google Scholar] [CrossRef]
- Ibrahim, S.A.J. Reviewing the Effects of Noise Pollution on Students (College and University). AIP Conf. Proc. 2023, 2591, 030056. [Google Scholar] [CrossRef]
- Montiel, I.; Mayoral, A. M.; Navarro Pedreño, J.; Maiques, S. Acoustic Comfort in Learning Spaces: Moving Towards Sustainable Development Goals. Sustainability 2019, 11(13), 3573. [Google Scholar] [CrossRef]
Figure 1.
Number of scientific articles from 2015 to 2024.
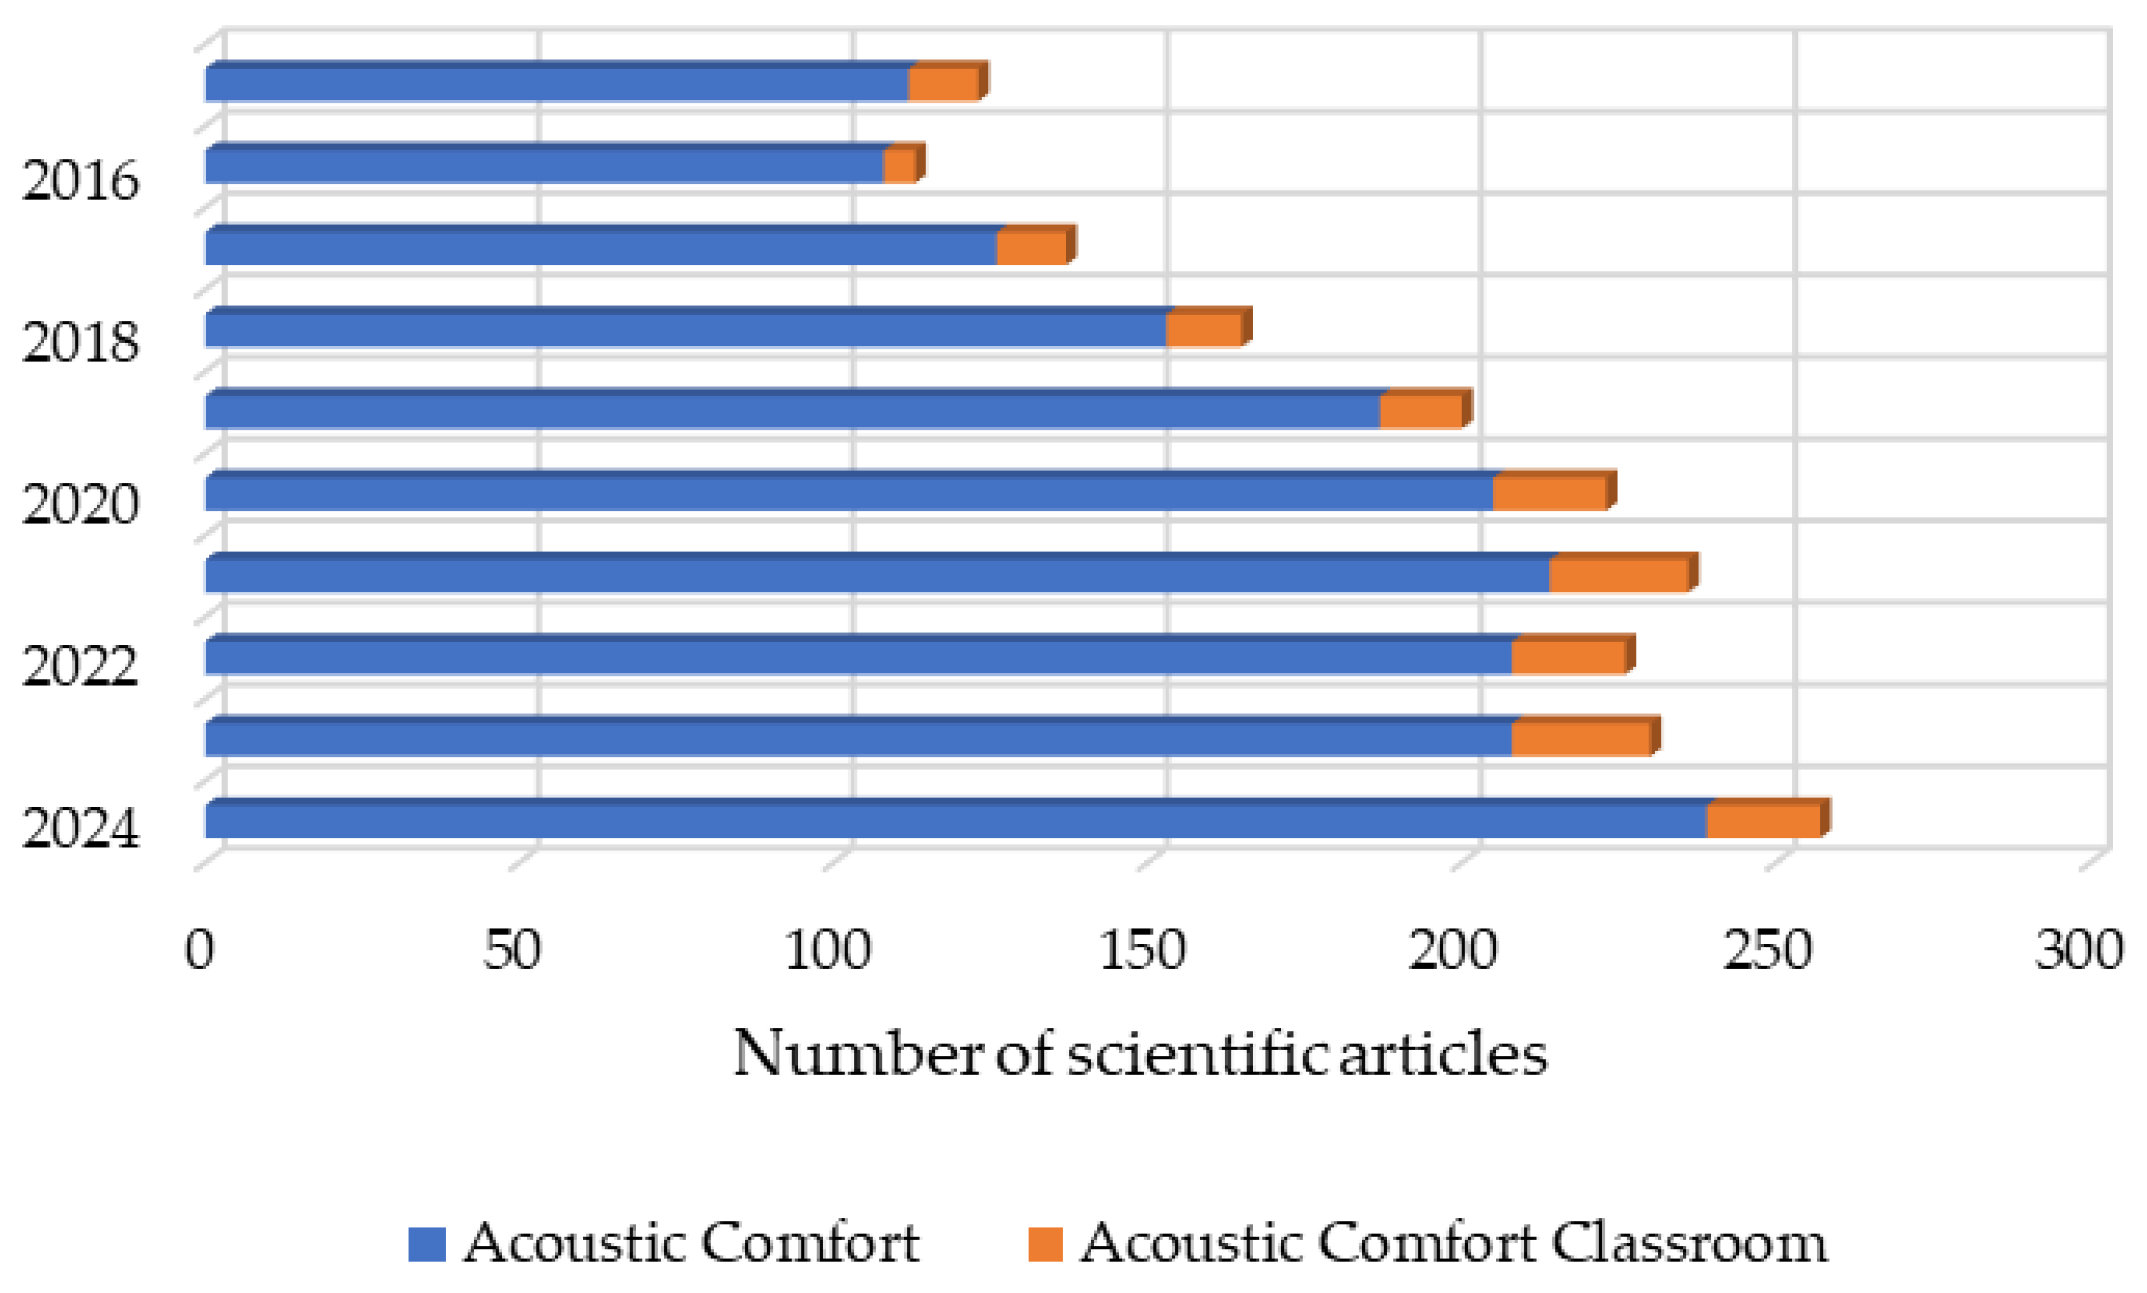
Figure 2.
Number of scientific articles from 2015 to 2024 in the world related to acoustic comfort.
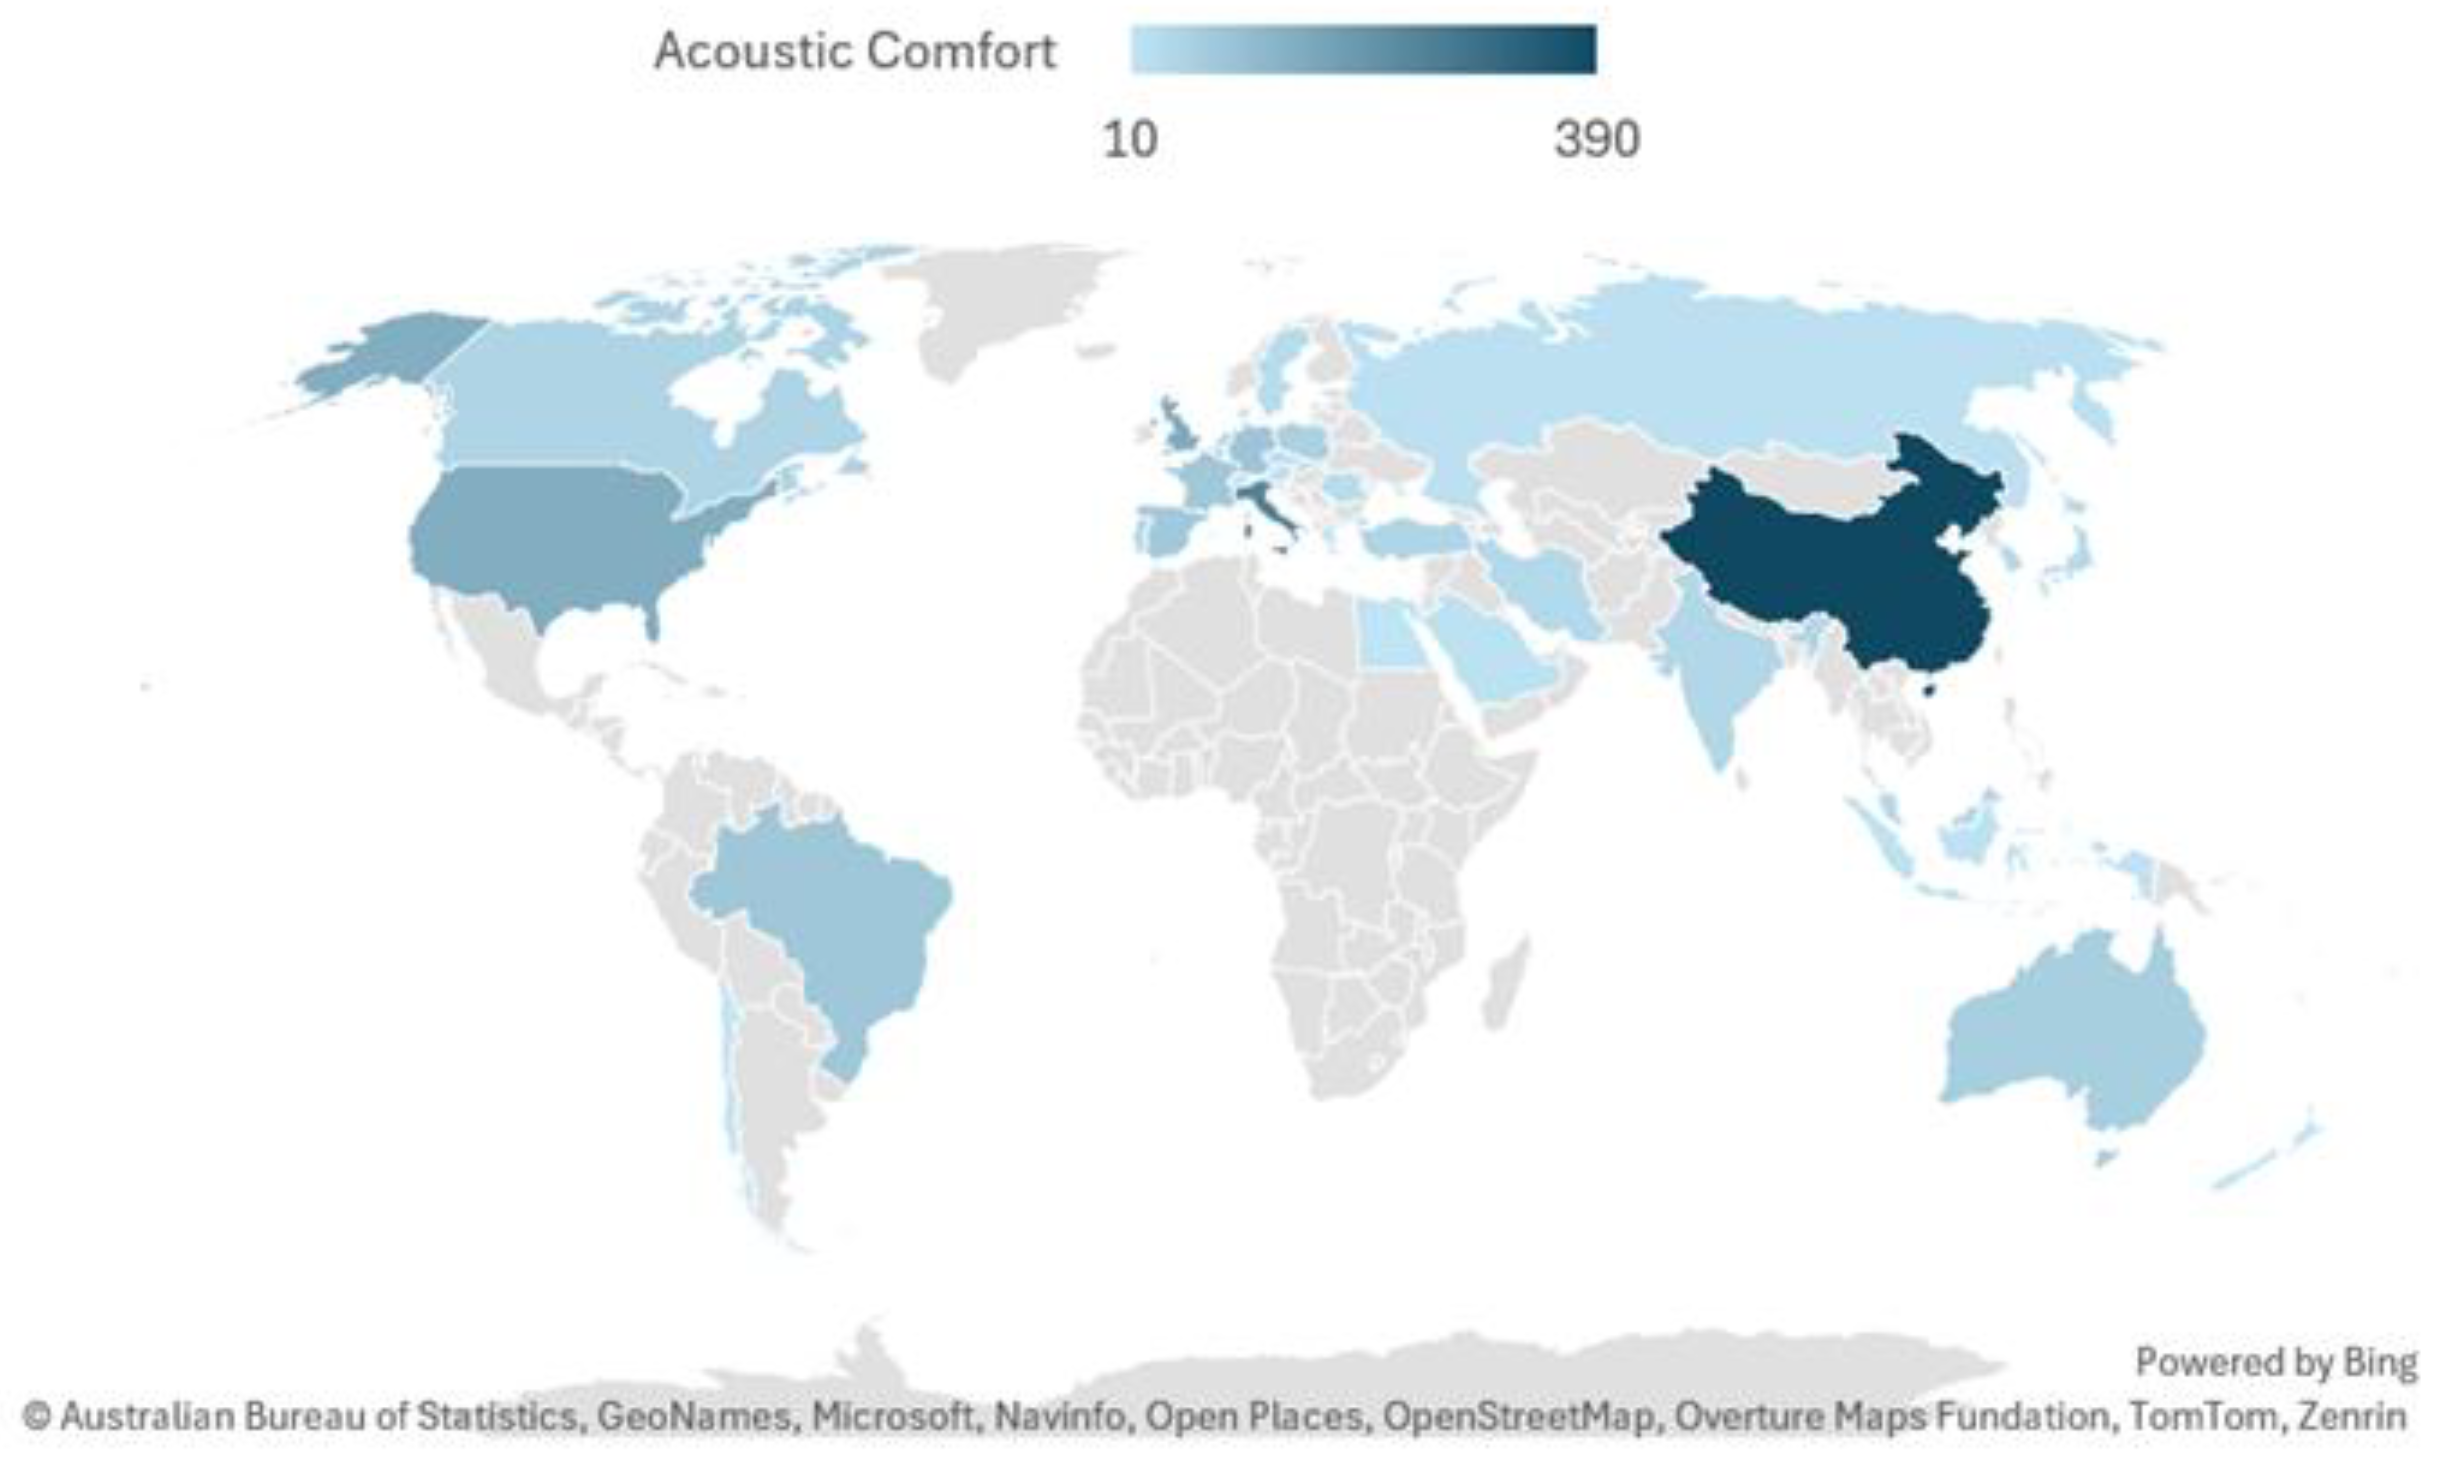
Figure 3.
The topic of acoustic comfort classroom in scientific publications from 2015–2024.
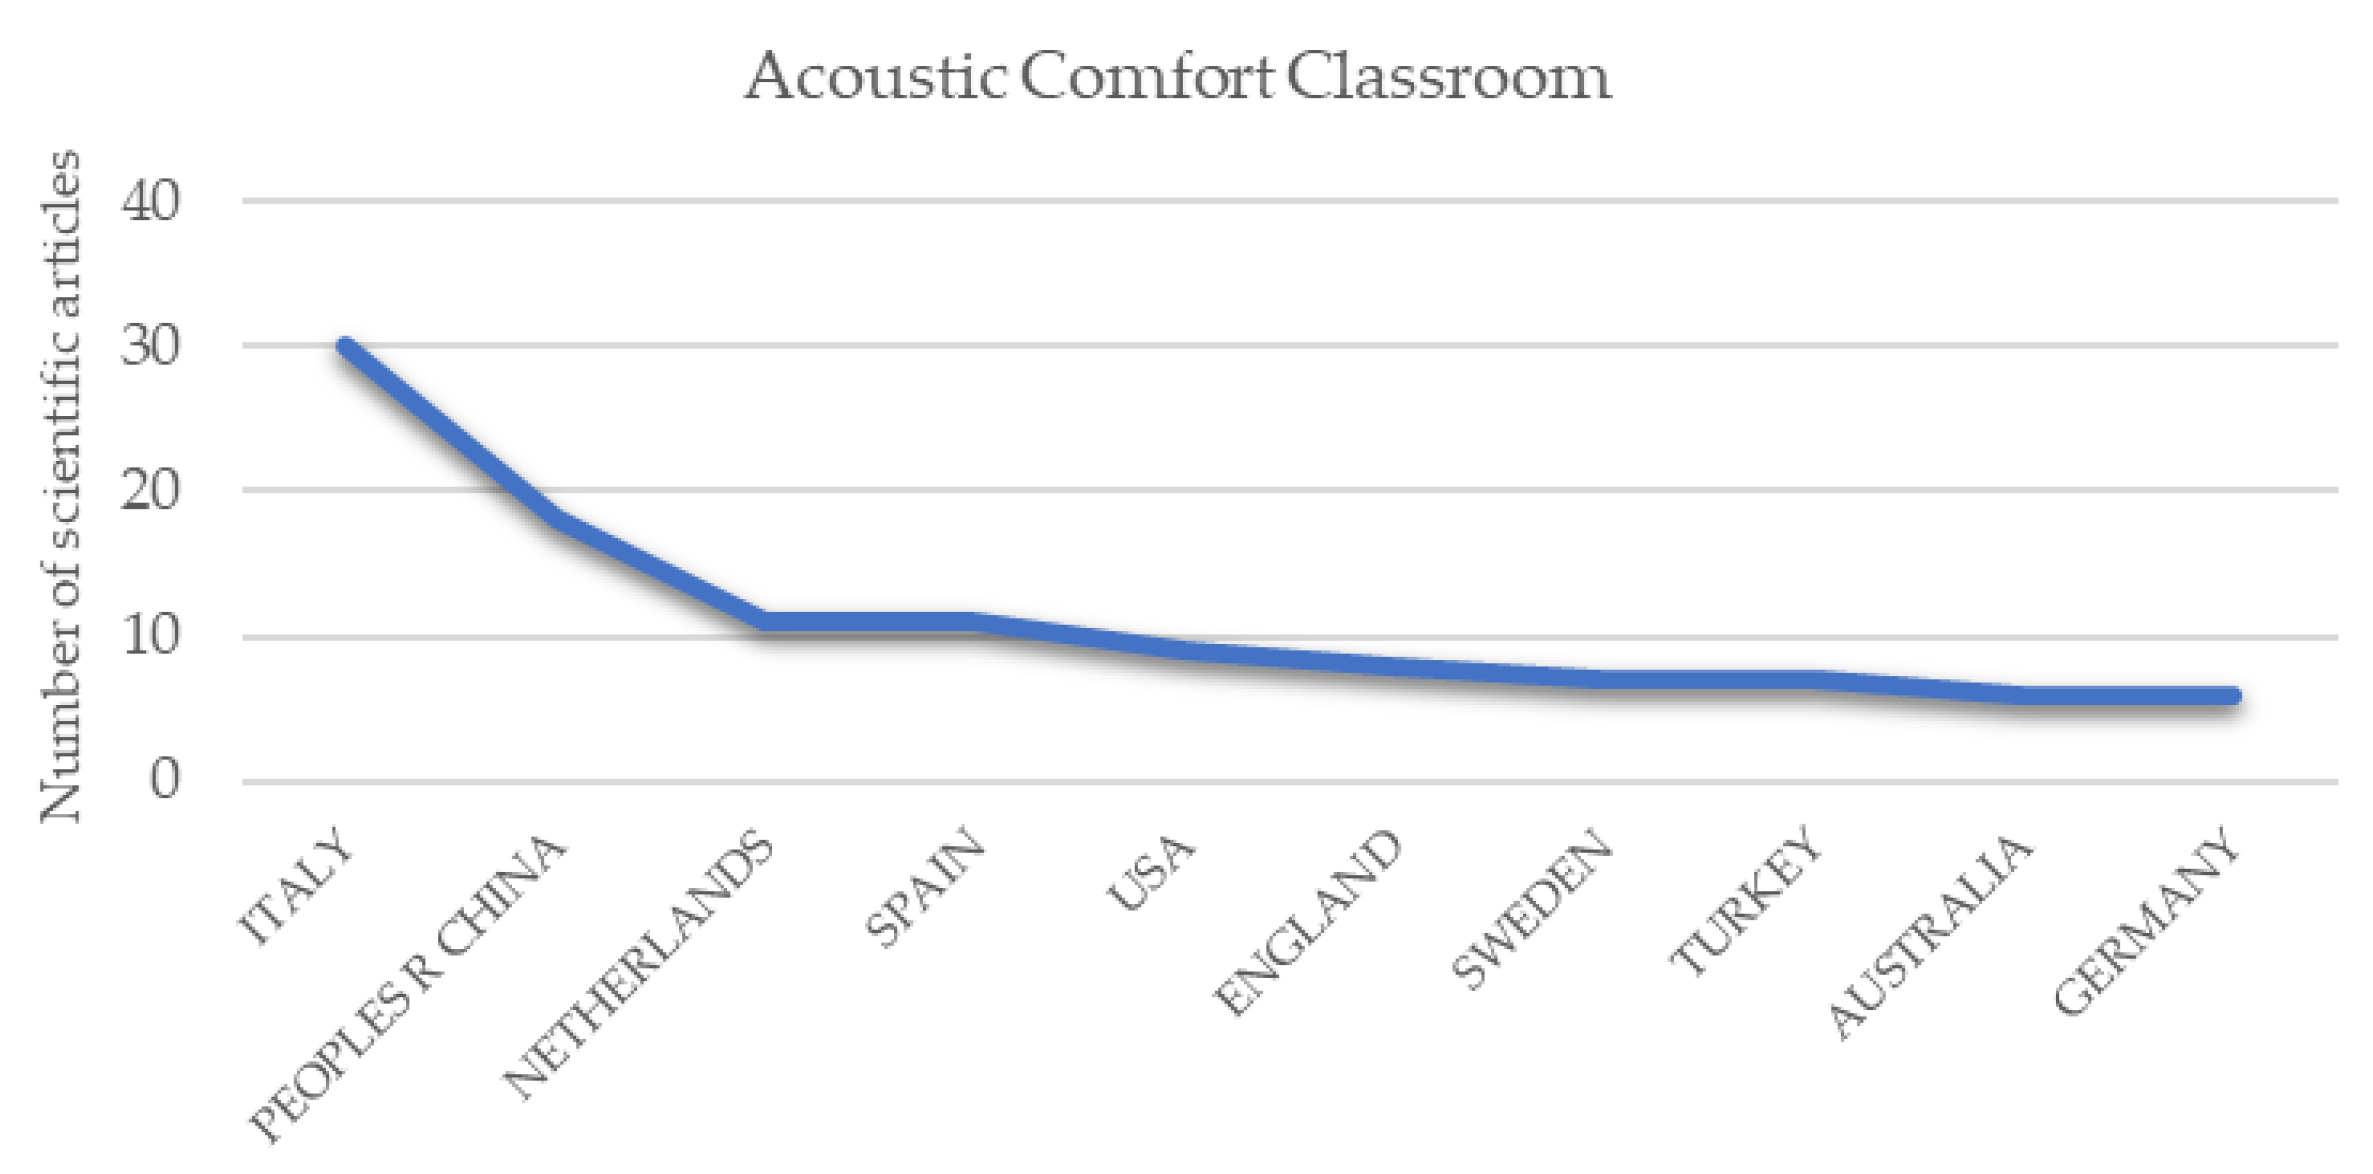
Figure 4.
The 18 microphones positions and 1 source position were considered.
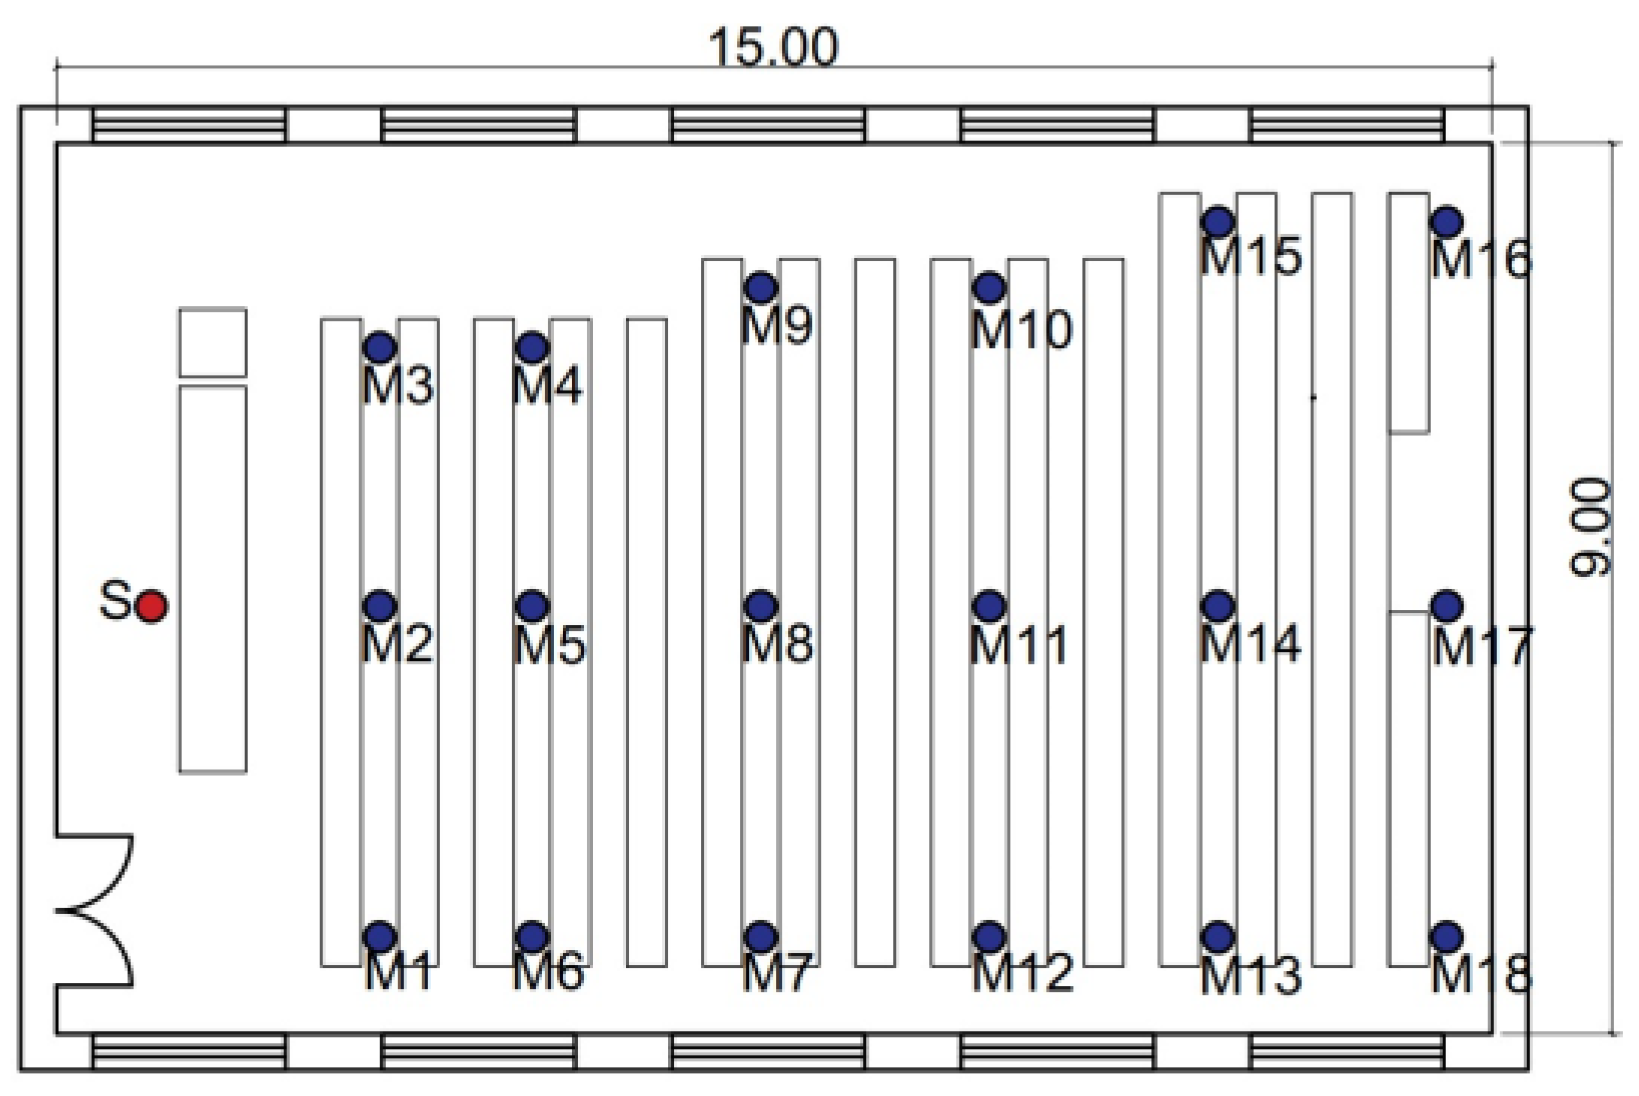
Figure 5.
The graphs corresponding to the unoccupied classroom case are presented as follows: (a) reverberation time values measured using Brüel & Kjær equipment; (b) reverberation time values calculated using Sabine’s formula.
Figure 5.
The graphs corresponding to the unoccupied classroom case are presented as follows: (a) reverberation time values measured using Brüel & Kjær equipment; (b) reverberation time values calculated using Sabine’s formula.
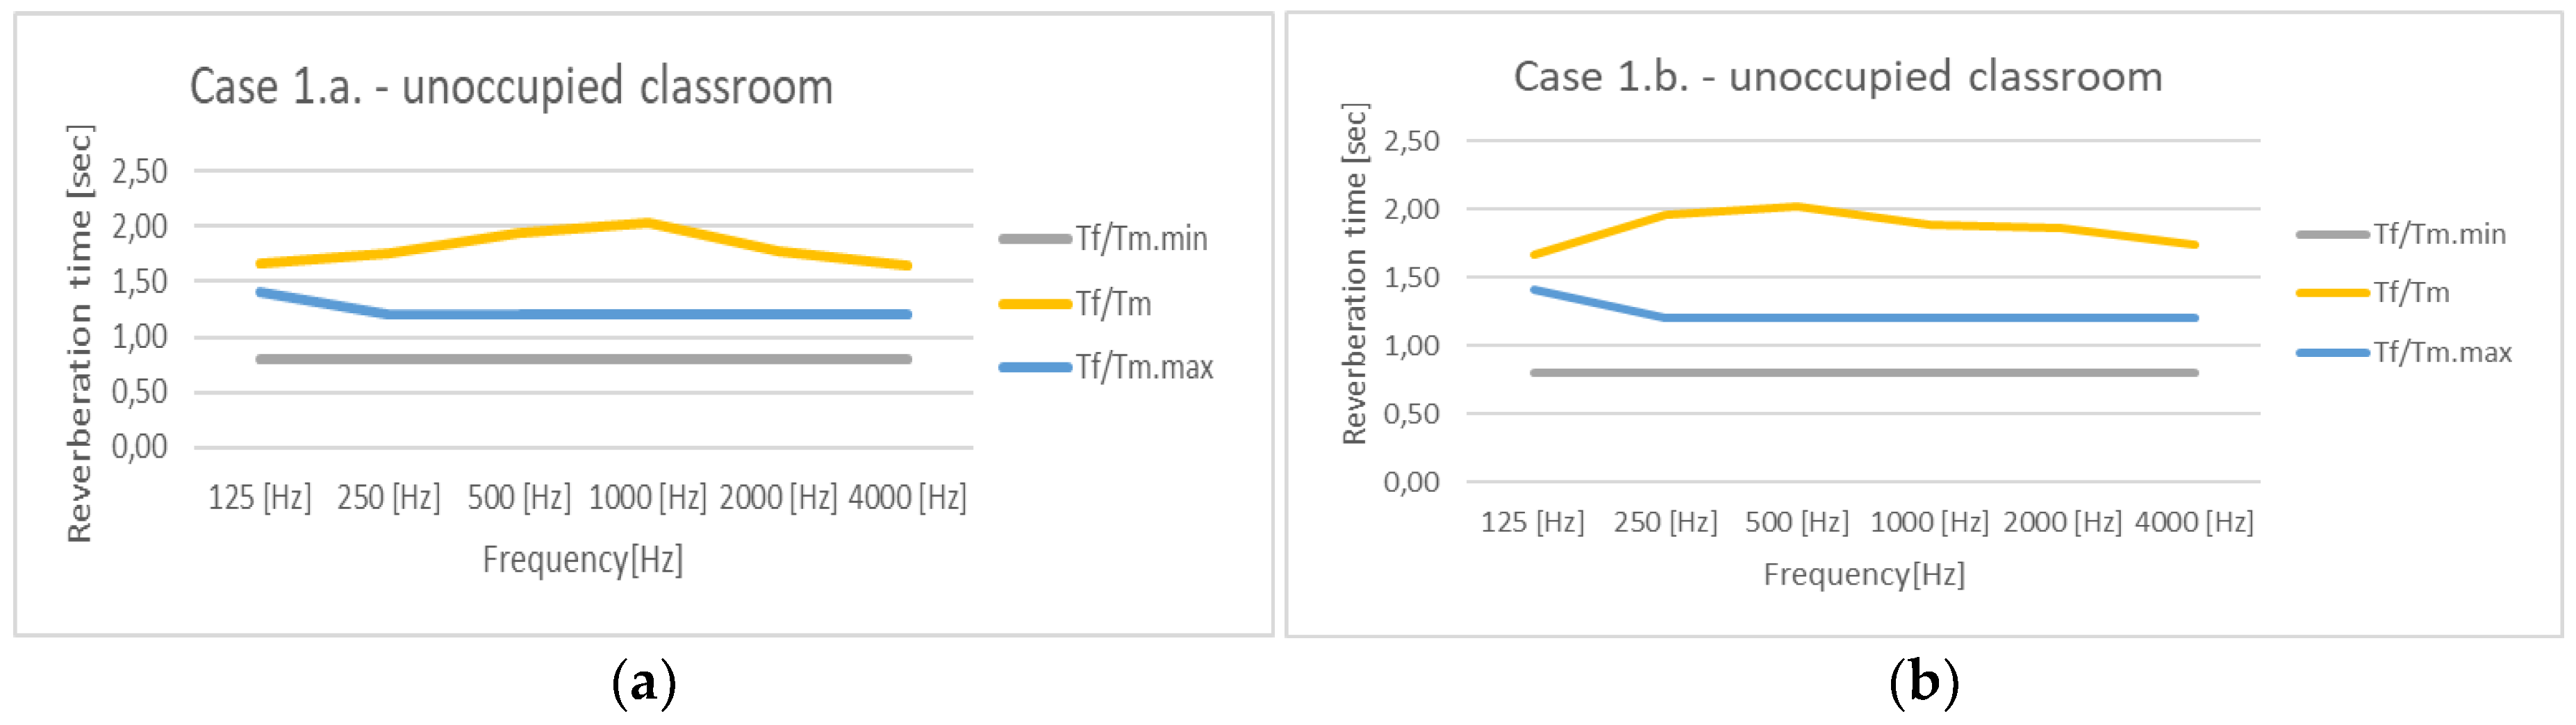
Figure 6.
Comparative Analysis of Results for the Classroom Occupied at 50% Capacity.
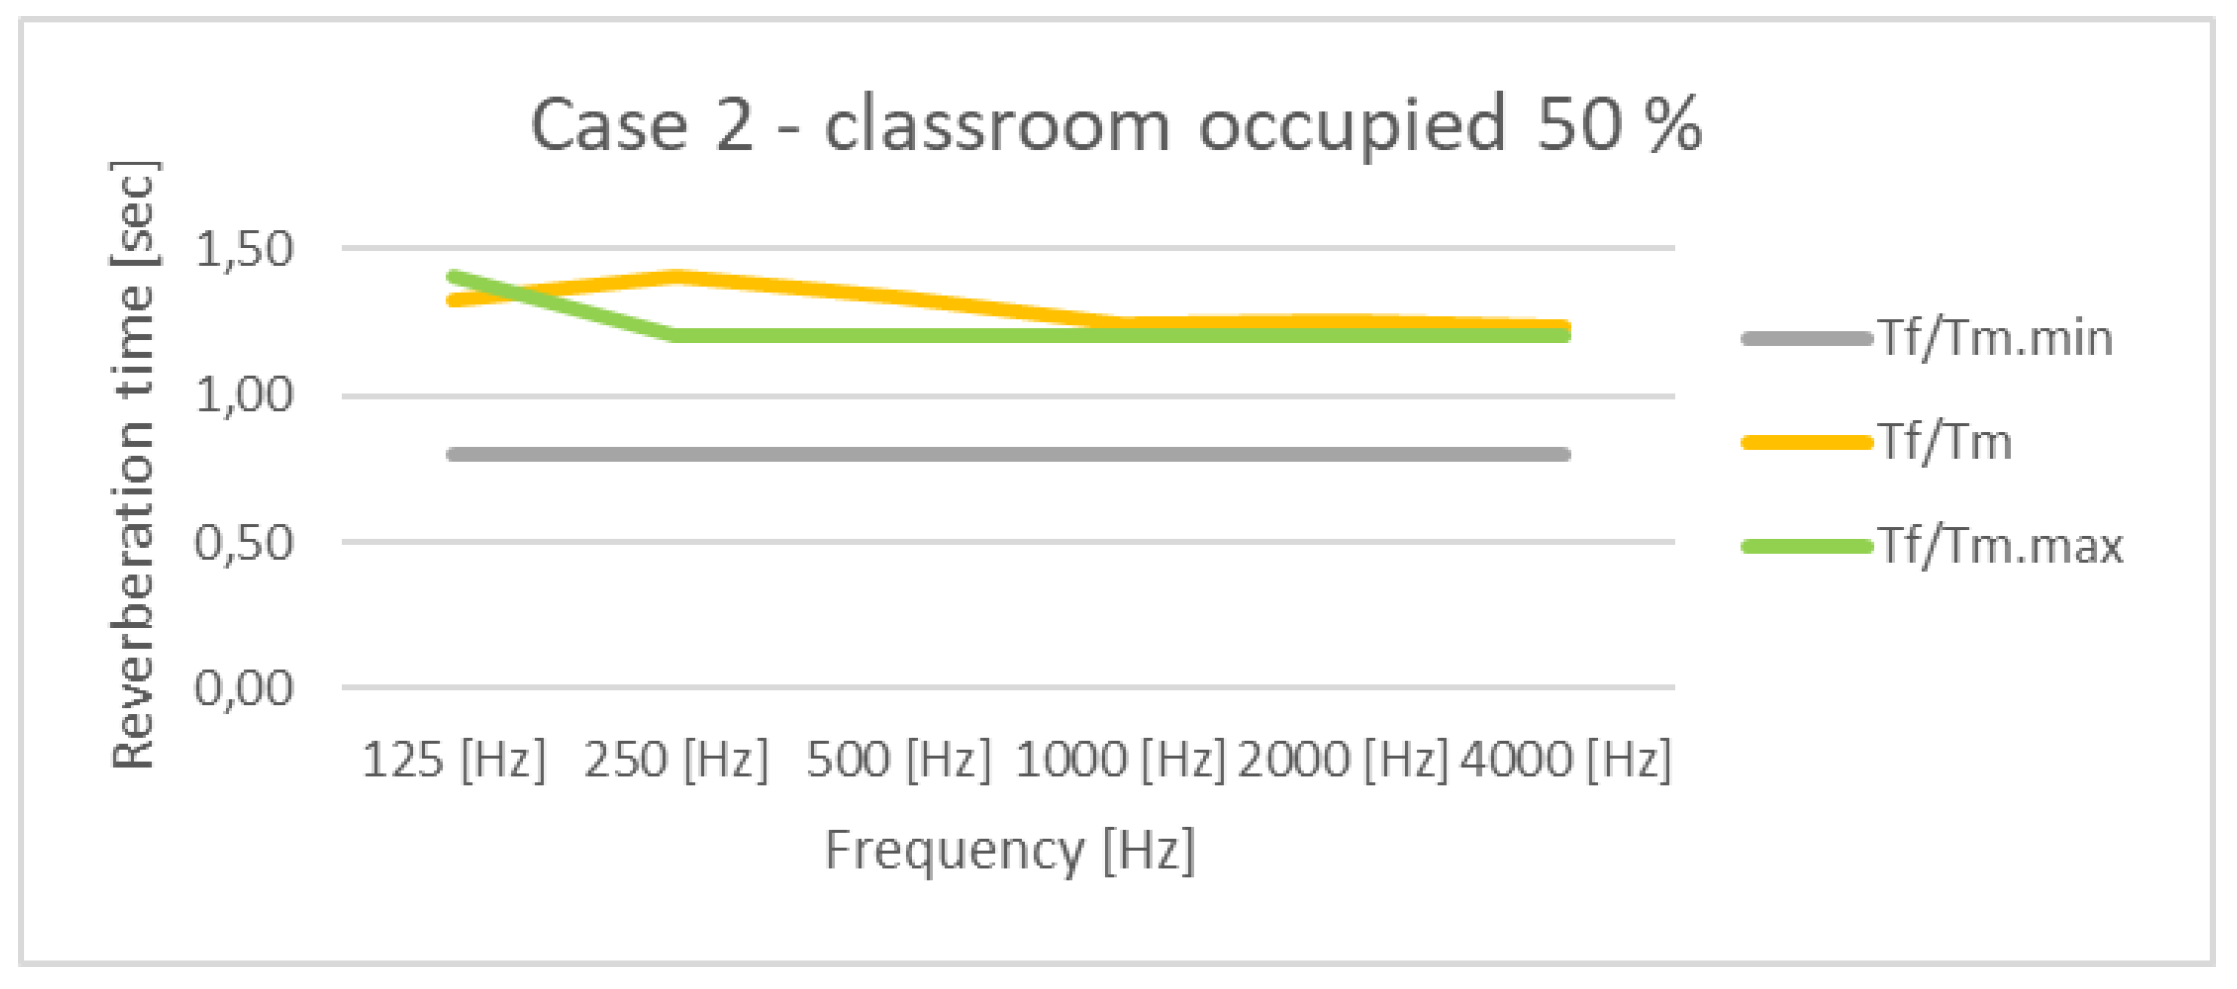
Figure 7.
Comparative Analysis of Results for the Classroom Occupied at 100% Capacity.
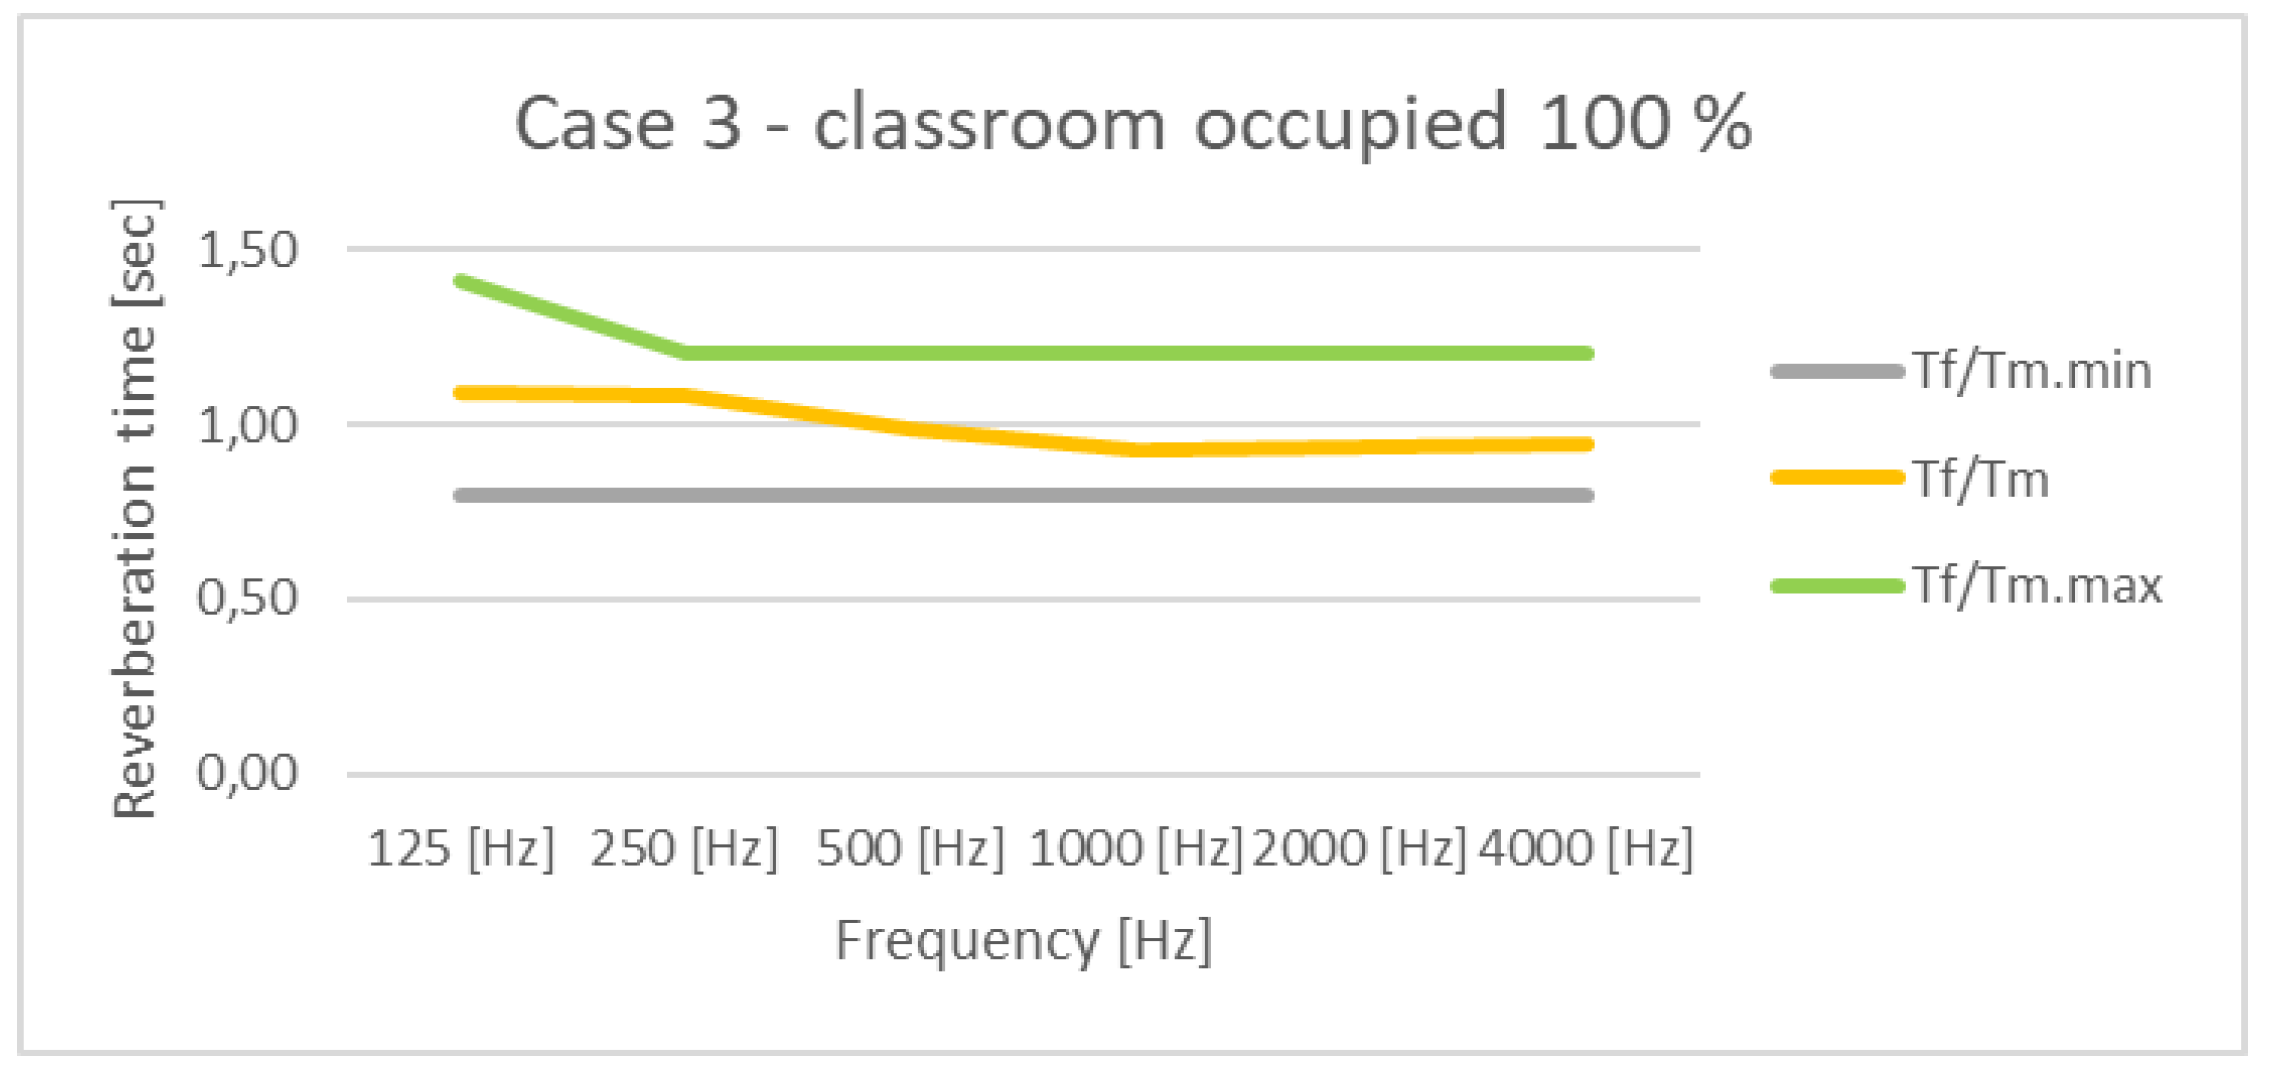
Figure 8.
Distribution of acoustic panels on the rear wall of the classroom for the three configurations: (a) S1 – 11 units of Mega Acoustic FiberPro 120 Binary Bean Natura panels [12]; (b) S2 – 11 units of The Razor 25 mm Acoustic Panels [13]; (c) S3 – 31 units of KusWave 3D polyester fiber acoustic panels [14].
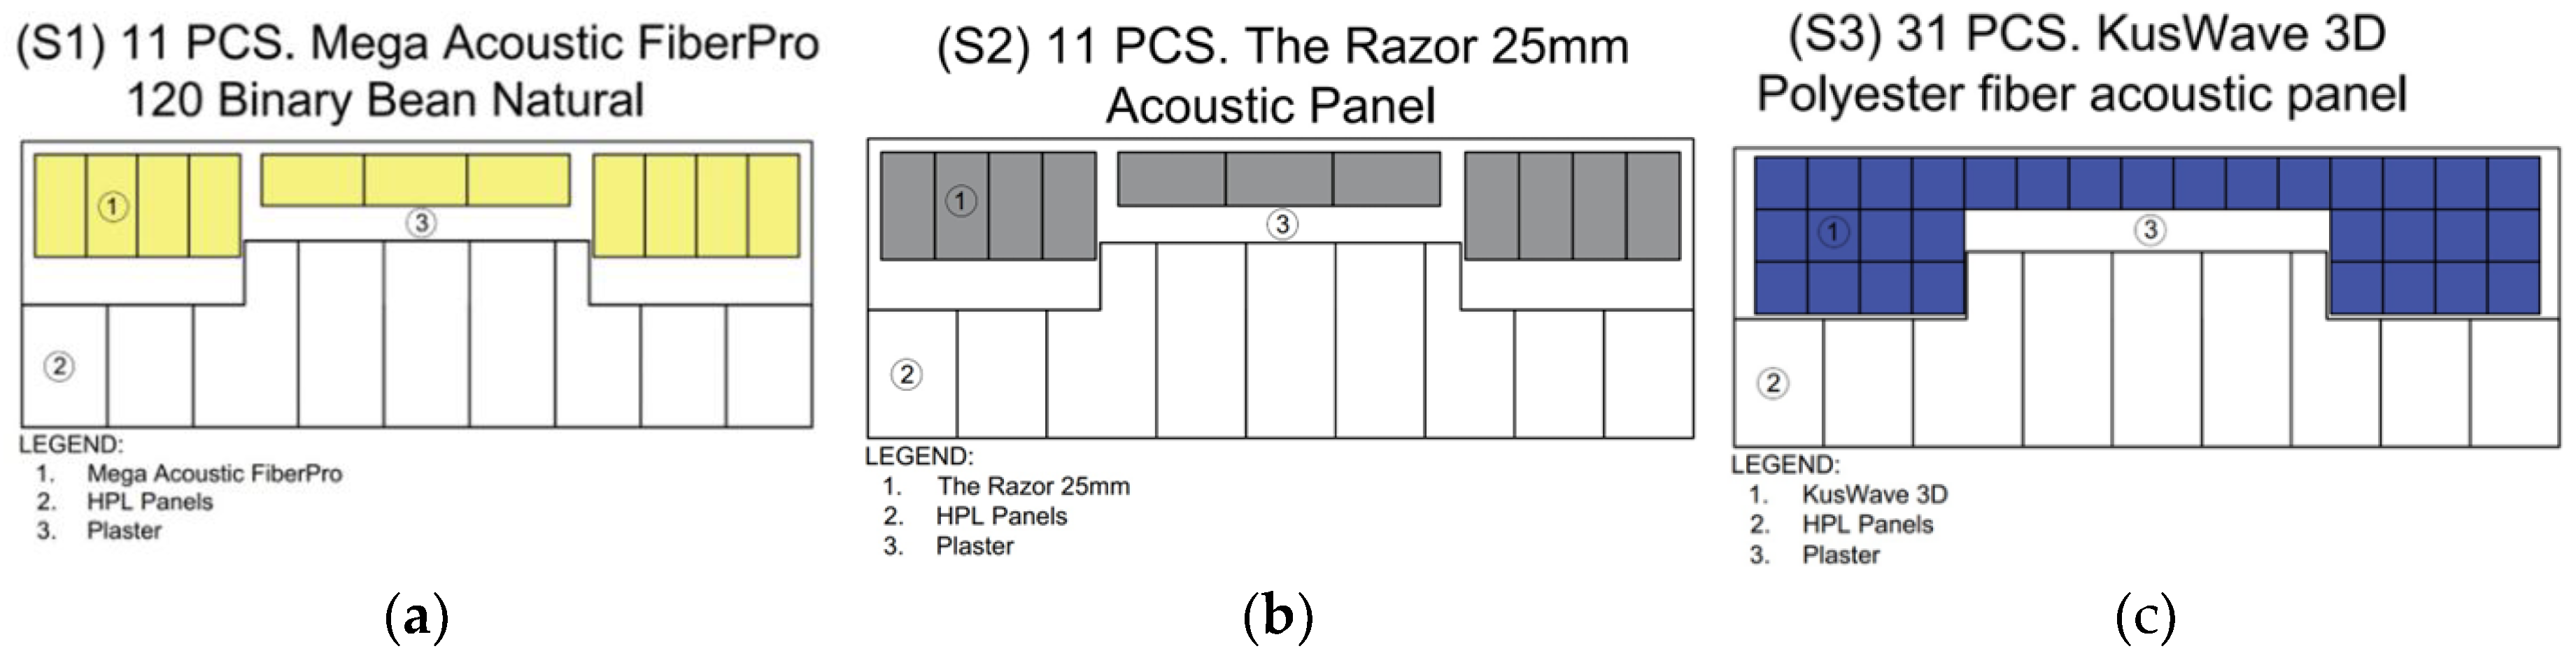
Figure 9.
The results obtained according to the procedures outlined in (a) STAS 9783/0-84 [10] and (b) Normative C125-2013 [11]; S1 denotes the first proposed solution, S2 the second, and S3 the third. Each of these solutions was evaluated under two classroom occupancy scenarios: 50% and 100%.
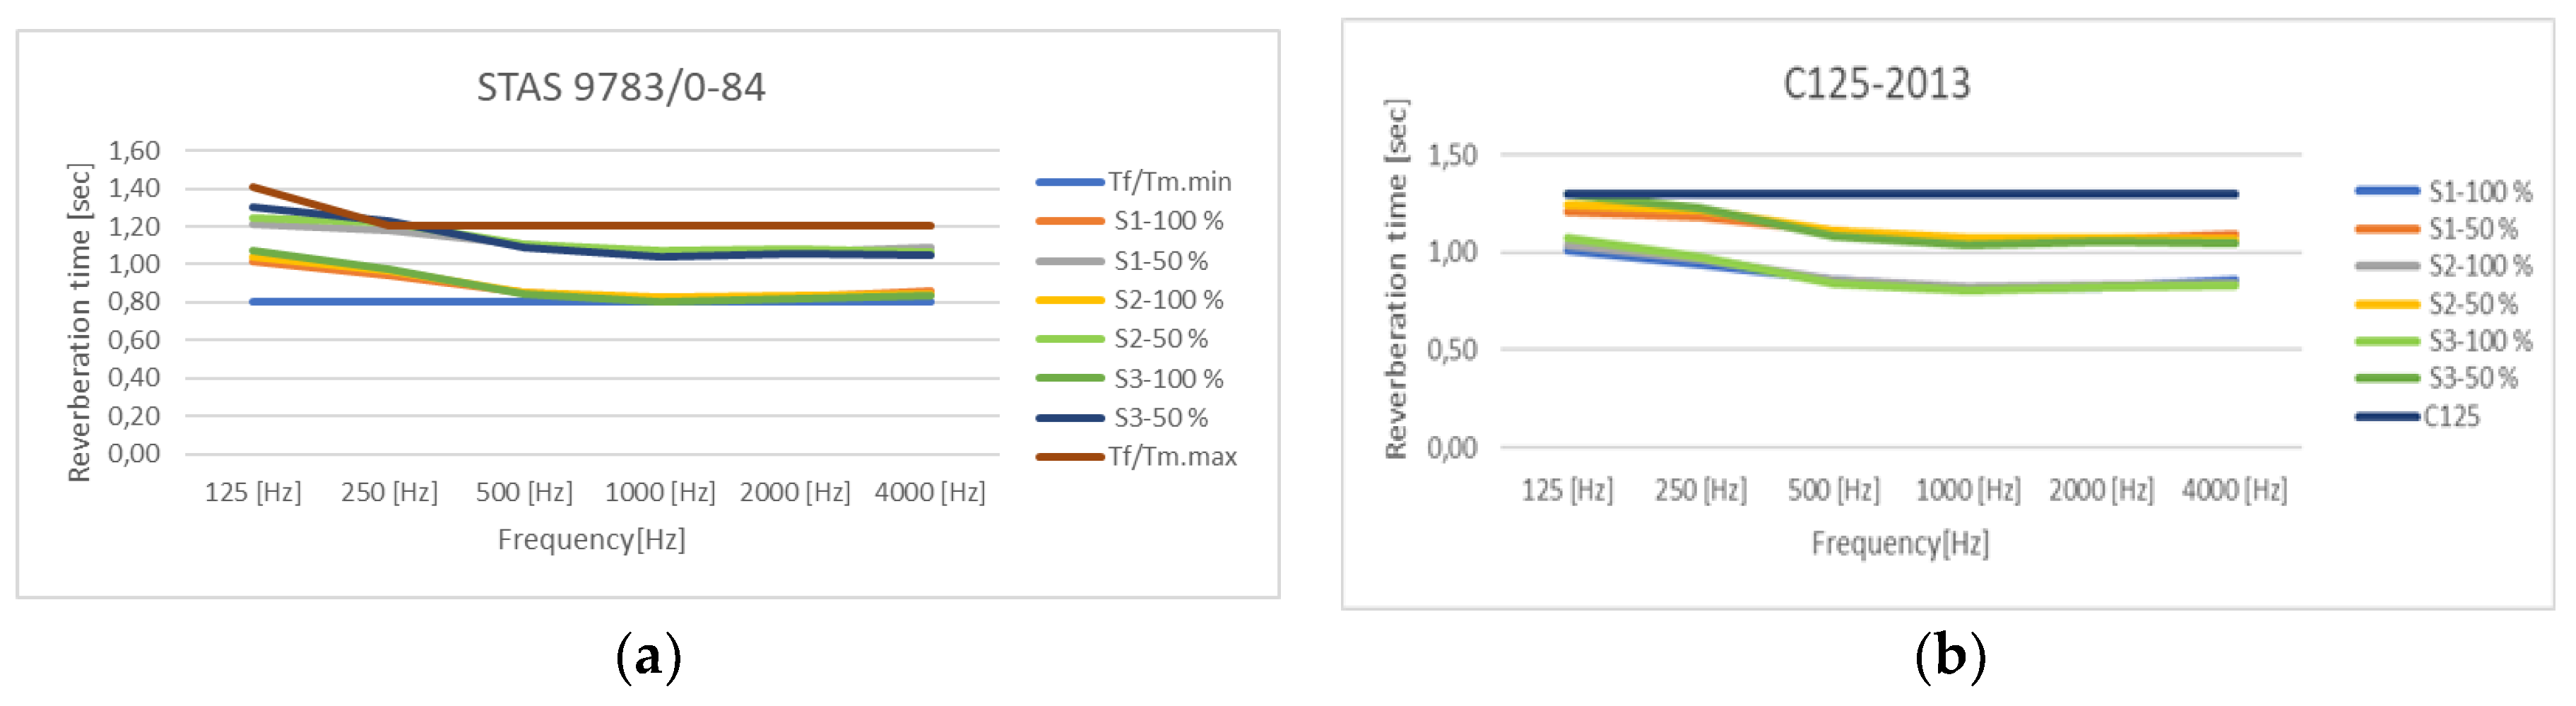

Table 1.
The absorption coefficients at the standard frequencies of 125 and 250 Hz.
| The materials | The absorption coefficients at the 125 Hz |
The absorption coefficients at the 250 Hz |
|---|---|---|
| Wooden door | 0,02 | 0,02 |
| Double-glass window, 2–3 mm glass, 10 mm air gap | 0,15 | 0,05 |
| Plaster of at least 20 mm, applied in 2 layers | 0,02 | 0,02 |
| Chairs / benches / desks | 0,02 | 0,02 |
| Parquet flooring | 0,04 | 0,04 |
| Radiators | 0,05 | 0,10 |
| Air conditioning units, speakers, TV, projector, lighting fixtures | 0,15 | 0,20 |
| Blackboard | 0,01 | 0,01 |
| HPL cladding | 0,40 | 0,35 |
| Person in the room | 0,35 | 0,41 |
Table 2.
The absorption coefficients at the standard frequencies of 500 and 1000 Hz.
| The materials | The absorption coefficients at the 500 Hz |
The absorption coefficients at the 1000 Hz |
|---|---|---|
| Wooden door | 0,03 | 0,04 |
| Double-glass window, 2–3 mm glass, 10 mm air gap | 0,03 | 0,03 |
| Plaster of at least 20 mm, applied in 2 layers | 0,02 | 0,04 |
| Chairs / benches / desks | 0,03 | 0,04 |
| Parquet flooring | 0,06 | 0,08 |
| Radiators | 0,10 | 0,10 |
| Air conditioning units, speakers, TV, projector, lighting fixtures | 0,25 | 0,30 |
| Blackboard | 0,01 | 0,02 |
| HPL cladding | 0,25 | 0,10 |
| Person in the room | 0,42 | 0,46 |
Table 3.
The absorption coefficients at the standard frequencies of 2000 and 4000 Hz.
| The materials | The absorption coefficients at the 1000 Hz |
The absorption coefficients at the 4000 Hz |
|---|---|---|
| Wooden door | 0,04 | 0,05 |
| Double-glass window, 2–3 mm glass, 10 mm air gap | 0,02 | 0,02 |
| Plaster of at least 20 mm, applied in 2 layers | 0,04 | 0,04 |
| Chairs / benches / desks | 0,04 | 0,05 |
| Parquet flooring | 0,08 | 0,10 |
| Radiators | 0,07 | 0,02 |
| Air conditioning units, speakers, TV, projector, lighting fixtures | 0,40 | 0,50 |
| Blackboard | 0,02 | 0,02 |
| HPL cladding | 0,10 | 0,05 |
| Person in the room | 0,49 | 0,50 |
Table 4.
Measured reverberation time values for microphone position M1.
| Frequencies [Hz] | T20 [s] | T30 [s] |
|---|---|---|
| 125 | 1,49 | 1,53 |
| 250 | 1,90 | 1,95 |
| 500 | 1,83 | 2,07 |
| 1000 | 2,35 | 2,22 |
| 2000 | 1,91 | 1,88 |
| 4000 | 1,81 | 1,80 |
Table 5.
Measured reverberation time values for microphone position M5.
| Frequencies [Hz] | T20 [s] | T30 [s] |
|---|---|---|
| 125 | 1,97 | 1,31 |
| 250 | 1,68 | 1,54 |
| 500 | 2,69 | 2,17 |
| 1000 | 2,26 | 2,17 |
| 2000 | 2,08 | 1,97 |
| 4000 | 1,86 | 1,77 |
Table 6.
Measured reverberation time values for microphone position M9.
| Frequencies [Hz] | T20 [s] | T30 [s] |
|---|---|---|
| 125 | 2,65 | 1,85 |
| 250 | 1,73 | 1,68 |
| 500 | 1,96 | 2,07 |
| 1000 | 2,05 | 2,07 |
| 2000 | 1,94 | 1,93 |
| 4000 | 1,92 | 1,81 |
Table 7.
Measured reverberation time values for microphone position M11.
| Frequencies [Hz] | T20 [s] | T30 [s] |
|---|---|---|
| 125 | 2,41 | 2,10 |
| 250 | 2,31 | 2,13 |
| 500 | 1,88 | 1,94 |
| 1000 | 2,20 | 2,11 |
| 2000 | 1,87 | 1,84 |
| 4000 | 1,82 | 1,77 |
Table 8.
Measured reverberation time values for microphone position M13.
| Frequencies [Hz] | T20 [s] | T30 [s] |
|---|---|---|
| 125 | 1,50 | 1,11 |
| 250 | 2,02 | 1,74 |
| 500 | 1,84 | 2,05 |
| 1000 | 2,45 | 2,28 |
| 2000 | 1,88 | 1,94 |
| 4000 | 1,81 | 1,73 |
Table 9.
Measured reverberation time values for microphone position M17.
| Frequencies [Hz] | T20 [s] | T30 [s] |
|---|---|---|
| 125 | 1,17 | 1,66 |
| 250 | 1,49 | 1,68 |
| 500 | 2,39 | 2,15 |
| 1000 | 2,09 | 2,11 |
| 2000 | 1,97 | 1,87 |
| 4000 | 1,78 | 1,73 |
Table 10.
The average reverberation time of the measured results.
| Frequencies [Hz] | T20 [s] | T30 [s] |
|---|---|---|
| 125 | 1,83 | 1,60 |
| 250 | 1,93 | 1,76 |
| 500 | 2,14 | 2,11 |
| 1000 | 2,24 | 2,17 |
| 2000 | 1,95 | 1,93 |
| 4000 | 1,82 | 1,78 |
Table 11.
The reverberation time values calculated using Sabine’s formula were compared with those obtained through measurements.
Table 11.
The reverberation time values calculated using Sabine’s formula were compared with those obtained through measurements.
| Frequencies [Hz] | T = 0,163·V/A [sec] * | T20 [s] | T30 [s] |
|---|---|---|---|
| 125 | 1,46 | 1,83 | 1,60 |
| 250 | 1,54 | 1,93 | 1,76 |
| 500 | 1,47 | 2,14 | 2,11 |
| 1000 | 1,37 | 2,24 | 2,17 |
| 2000 | 1,38 | 1,95 | 1,93 |
| 4000 | 1,36 | 1,82 | 1,78 |
* The reverberation time values were calculated using Sabine's formula.
Table 12.
Economic analysis of proposed solutions.
| Solutions | Cost [euro] |
|---|---|
| S1 | 1912 |
| S2 | 1210 |
| S3 | 1550 |
Disclaimer/Publisher’s Note: The statements, opinions and data contained in all publications are solely those of the individual author(s) and contributor(s) and not of MDPI and/or the editor(s). MDPI and/or the editor(s) disclaim responsibility for any injury to people or property resulting from any ideas, methods, instructions or products referred to in the content. |
© 2025 by the authors. Licensee MDPI, Basel, Switzerland. This article is an open access article distributed under the terms and conditions of the Creative Commons Attribution (CC BY) license (http://creativecommons.org/licenses/by/4.0/).
Copyright: This open access article is published under a Creative Commons CC BY 4.0 license, which permit the free download, distribution, and reuse, provided that the author and preprint are cited in any reuse.


