
Submitted:
24 November 2025
Posted:
26 November 2025
You are already at the latest version
Abstract
To investigate the influence of different tip clearances on the hydraulic performance and cavitation characteristics of a cryogenic inducer, this study builds upon previous research by employing the SST k-ω turbulence model and modifying the empirical coefficients for evaporation and condensation in the Zwart cavitation model. Numerical simulations of the full flow field within an LNG cryogenic inducer were conducted. The results yielded cavitation performance curves, pressure distributions at incipient cavitation, vapor volume fraction contours, and leakage flow streamlines for various tip clearances. The impact of tip clearance on the overall hydraulic performance and cavitation behavior of the LNG inducer was systematically examined, with particular attention given to the microscopic evolution of the Tip Leakage Vortex (TLV) during the initial stages of cavitation. Experimental findings indicate that as the tip clearance increases, the tip leakage flow intensifies, leading to greater energy losses within the inducer and a consequent slight reduction in pump head and efficiency. A critical clearance value, δ, exists within the range of 0.4 mm to 0.6 mm, which governs the development pattern of the TLV. When the clearance is smaller than δ, the TLV forms more rapidly, and cavitation development is significantly more sensitive to increases in tip clearance. Conversely, when the clearance exceeds δ, the formation of the TLV is delayed, and cavitation progression becomes less responsive to further increases in tip clearance.
Keywords:
cryopump
; tip clearance of inducer
; tip clearance flow
; tip cavitation
1. Introduction
In recent years, liquefied natural gas (LNG) has been viewed as a clean energy alternative in global energy consumption. It is considered one of the three pillars of energy sources, together with oil and coal. China’s LNG imports primarily originate from Australia, Qatar and other countries and are transported to domestic coastal LNG receiving stations by LNG ships. The LNG cryopump is needed to pressurise low-temperature liquid LNG to achieve its production, transportation and storage. The LNG cryogenic delivery pump is a crucial device in the LNG industry. However, due to its extremely high speed, the required cavitation margin (NPSHr) of LNG cryopumps is larger than that of conventional industrial pumps. Meanwhile, the LNG cryopump is prone to cavitation while working due to the harsh transportation conditions of the cryogenic medium. It lowers the LNG cryopump transportation efficiency, noise and energy loss[1,2,3,4]. To enhance the pump’s cavitation resistance, an inducer is typically installed upstream of the main impeller. This configuration effectively improves the flow conditions by mitigating flow non-uniformity and suppressing cavitation caused by inadequate inlet pressure, thereby increasing the operational stability and reliability of the pump under high-efficiency conditions[5,6,7,8,9,10,11].
Centrifugal pumps with front inducers have recently been the subject of several research works. Trupen Parikh et al.[12] demonstrated that the installation of an inducer upstream of a centrifugal pump can effectively enhance its hydraulic performance. Kong et al.[13] investigated the cavitation characteristics of variable–pitch inducers based on fundamental hydraulic design principles, systematically analyzing the influence of pitch variation on inducer performance while providing practical implementation cases of variable–pitch inducers. Cui et al.[14,15,16] developed a high–speed visualization test rig for inducer cavitation studies, employing high–speed imaging technology to meticulously document the dynamic evolution process of cavitation clouds. Their work elucidated the vapor cavity evolution mechanisms across different cavitation stages, offering visual evidence for understanding unsteady cavitation flow characteristics. Li et al.[17] conducted parametric studies on inducer deflection angles in centrifugal pumps, concluding that a 5°deflection angle yields optimal hydraulic efficiency. Chen et al.[18] studied the impact of varying blade inclination angles of the meridian section of the inducer on the external characteristics of a centrifugal pump. They revealed that when the inclination angle exceeds a certain value, it greatly affects the cavitation performance of the inducer. Zhang et al. Zhao et al. and Dou et al.[19,20,21] performed visual experiments and numerical simulation research on two–blade and three–blade inducers. They discovered that the cavitation performance of three–blade inducers was superior to that of two–blade inducers. Wang et al.[22] installed an annular groove at the leading edge of the inducer inlet. Numerical simulation determined that the annular groove increased the leakage of the inducer tip, enhanced the inlet backflow, and transferred the low–pressure zone from the blade inlet to the middle and rear sections of the flow channel. As a result, the cavitation zone’s position changed.
With advancements in achieving superior casting and machining accuracies, the tip clearance of the inducer has become controllable in practical applications. Many scholars have researched the influence of tip clearance on an inducer’s performance. ZHANG et al.[23,24,25] implemented high–speed imaging systems to comprehensively capture tip leakage vortex cavitation phenomena in axial flow pumps. Through comparative validation between experimental measurements and numerical simulation results, their research established critical foundations for optimizing numerical models of cavitation dynamics. Guo et al.[26,27] studied the inducer of high–speed centrifugal pumps under different clearances. They found that the tip clearance significantly affects the pressure distribution and pulsation in the inducer channel within a certain range. Xiang et al.[28] conducted visual experimental research on inducers with different tip clearances. They identified three cavitation instability phenomena: super–synchronous rotation cavitation, synchronous rotation cavitation and cavitation surge. Meanwhile, the cavitation area under large clearance was smaller, but the flow channel blockage was more severe when cavitation deteriorated. Karakas et al.[29] found that with the increase in tip clearance, the pressure loss caused by the tip leakage vortex and secondary flow will decrease the inducer’s cavitation performance. Dreyer[30] made the tip clearance dimensionless and revealed that when the tip clearance dimensionless number is 0.3, the average vortex intensity of the tip leakage vortex reaches the maximum value. Several studies by scholars demonstrate that the cavitation phenomenon of the inducer is closely related to tip clearance.
Many existing studies have confirmed that tip clearance is a key factor influencing the inducer’s cavitation behavior, primarily through its impact on tip leakage vortex dynamics. The clearance-induced vortex structures are closely related to the formation and persistence of local low-pressure zones, which serve as favorable sites for cavitation inception and strongly affect its subsequent development. These tip leakage vortices, typically generated due to the pressure difference between the pressure and suction surfaces near the blade tip, interact intricately with the main flow and the surrounding turbulence structures, resulting in complex unsteady flow patterns near the tip region. However, due to the strong coupling of turbulence, fluid compressibility, and multiphase phase-change interactions, the physical mechanism governing the spatiotemporal evolution of tip leakage vortices under cryogenic and multiphase flow conditions remains poorly understood. Particularly in LNG pumps, where extremely low temperatures and high phase-change sensitivity coexist, these effects become more pronounced. The cryogenic environment modifies both the fluid properties (e.g., vapor pressure, density, and viscosity) and the cavitation dynamics, leading to a significantly different behavior of leakage vortices compared to room-temperature scenarios. Although considerable efforts have been made to investigate the influence of tip clearance on inducer performance, most of these studies have been conducted under simplified or isothermal conditions, lacking a detailed resolution of the internal structure and evolution mechanism of tip leakage vortices in cryogenic multiphase environments. As a result, the underlying flow-induced instability mechanisms triggered by clearance variations, particularly in the context of LNG pump operation, remain unclear. Existing literature tends to emphasize macroscopic performance indicators such as head drop and cavitation number, while the role of clearance-induced secondary vortices in modulating the onset, growth, and collapse of cavitation bubbles has not been systematically resolved. Furthermore, the dynamic transition process of cavitation under different tip clearance conditions—especially the evolution from partial cavity to full cavitation collapse—has yet to be quantitatively characterized in a cryogenic multiphase framework.
In this study, numerical simulations were first conducted based on experimental results to systematically analyze the effects of different tip clearance sizes on leakage vortex formation and cavitation development in LNG inducers. Subsequently, a three-dimensional multiphase flow model was established to capture the interaction between tip clearance leakage flow and the main flow, revealing the coupling mechanisms between clearance variation, local pressure distribution, cavitation volume evolution, and leakage vortex structure formation. Finally, the study further explored the unsteady evolution mechanism of leakage flow-induced cavitation under various clearance conditions and its nonlinear impact on pump performance degradation, providing theoretical support for inducer structural optimization and cavitation suppression.
2. Experimental Object and Numerical Calculation Method
2.1. Subjects
The experimental object of this paper is an LNG cryopump, and Figure 1 depicts its overall assembly. Hydraulic components primarily include the inducer, inducer guide vane, impeller and impeller guide vane. The conveying medium is low-temperature liquid nitrogen, the fluid enters the LNG pump along the path indicated by the red arrow, then flows sequentially through the inducer, the inducer diffuser, and the multi-stage impellers where it is pressurized, and is ultimately discharged as high-pressure fluid through the outlet pipeline. The medium density is 780 kg/m3, the design flow rate is 308 m3/h, the design head is 1926 m and the design speed is 3000 r/min. Figure 2 shows the model structure of the inducer and centrifugal impeller, and Table 1 and Table 2 present the specific parameters.
2.2. Experimental System
Figure 3(a) illustrates the experimental test system used for the performance evaluation of the LNG pump. The test setup primarily comprises an LNG cryogenic pump, an electromagnetic flowmeter, temperature and pressure sensors, and a set of supporting data acquisition and control software. Among these components, pressure sensors are strategically installed on both the inlet and outlet pipelines of the LNG pump to accurately measure the inlet and outlet pressures during operation. The temperature sensor is positioned within the LNG storage pool, enabling continuous monitoring of the medium temperature to ensure accurate thermodynamic conditions. The flow rate is determined through the use of an electromagnetic flowmeter, which provides high-precision, real-time measurement of liquid nitrogen flow within the closed-loop system. Additionally, the test software platform allows for real-time monitoring, control, and adjustment of flow through valve regulation, thereby ensuring operational flexibility and experimental repeatability. Under stable operating conditions of the LNG pump, the system is capable of recording multiple key performance parameters, including flow rate, inlet and outlet pressure, medium temperature, motor voltage and current, as well as the total motor power. These measurements provide a comprehensive dataset for validating numerical simulations and evaluating the pump’s operational performance under cryogenic conditions.
Figure 3 (b) display the cryogenic LNG pump system and site. The flow, head and power of the pump were examined, mainly focusing on the operations of various components in the pump.The flow rate-head-efficiency experimental results obtained from this test rig can be used to validate the accuracy of subsequent numerical simulation results.
2.3. Reliability Verification of Numerical Simulation
Due to the limitation of test conditions, the pump speed established in the experiment is 1500 r/min, and the head under different flow conditions at this speed is measured. Figure 4 shows the numerical calculation and experimental results. This figure shows that the errors between the head calculated by numerical calculation and the head measured by experiment are less than 2.6%, and the efficiency error is less than 2.0%.
The working condition of the pump with a rated speed of 3000 r/min is obtained (Table 3) using equations (1) and (2) of the similarity conversion algorithm.
Figure 5 presents a comparison between the numerical simulation results and experimental measurements obtained at the rated rotational speed of 3000 r/min. As shown in the figure, the deviation between the numerically predicted head and the experimentally measured head is 1.6%, while the deviation in efficiency is approximately 2.8%. These relatively small discrepancies indicate a high level of agreement between the simulation and experimental data. Furthermore, the numerical and experimental results exhibit consistent trends across the operating range, suggesting that the computational model accurately captures the flow physics within the pump. This close alignment effectively validates the reliability and precision of the numerical calculation method employed in this study, confirming its applicability for subsequent performance prediction and flow field analysis.
2.4. Model Simplification
According to the previous research, the bubbles produced by cavitation have collapsed at the end of the working face of the first-stage centrifugal impeller, and no cavitation phenomenon was observed in the second-stage impeller and the rear impeller[31]. This paper simplifies the original LNG pump model to reduce calculation costs, the study focuses exclusively on the first and second stage impellers along with their corresponding diffusers. Subsequent impeller stages, where cavitation does not occur, are excluded from the investigation. The specific simplified model is shown in Figure 6.
During the formation of the impeller clearance, the size of the gap can be adjusted by altering either the outer or inner diameter of the impeller. When the clearance is created by increasing the size of the impeller chamber, the resulting gap can be considered minimal relative to the impeller diameter; therefore, its impact on overall performance is negligible. Furthermore, this method of enlarging the impeller chamber diameter avoids compromising the hydraulic profile of the impeller, ensuring the normal operation of the pump system. Accordingly, this study adopted the approach of increasing the impeller chamber diameter to establish five distinct clearance sizes: 0.2 mm, 0.4 mm, 0.6 mm, 0.8 mm, and 1 mm, facilitating a systematic investigation into their effects on pump performance. These variations in clearance enable a comprehensive analysis of how different impeller gaps influence hydrodynamic characteristics, efficiency, and operational stability, thereby providing a theoretical basis for optimizing pump design and performance.
2.5. Mesh Division and Mesh Independence Verification
To enhance the accuracy of numerical calculations, TurboGrid software is employed to generate a structured hexahedral mesh for the inducer’s flow domain, ensuring high-quality grid topology and reduced numerical diffusion. In particular, local mesh refinement is conducted in regions near the wall surfaces and within the tip clearance to capture detailed flow characteristics and boundary layer behavior. Simultaneously, ICEM software is utilized to discretize the inlet and outlet channels, along with the front and rear casing basins, into structured hexahedral grids to maintain geometric consistency and mesh continuity. For complex flow regions such as the impeller, guide vanes, and other internal fluid components, an unstructured tetrahedral mesh is adopted to accommodate intricate geometries and streamline the meshing process. In order to mitigate numerical artifacts such as backflow or reverse pressure waves at the domain boundaries, the inlet and outlet sections are appropriately extended. This ensures a fully developed flow field and provides sufficient buffer zones for accurate simulation. The overall computational fluid domain and the detailed mesh configuration of the inducer are illustrated in Figure 7.
To ensure the reliability of the simulation results, a grid independence study is conducted by analyzing the variation in pump head with increasing grid density. The comparison results are presented in Table 4. It is observed that as the total grid number increases to 2.08×10⁶, the head variation becomes negligible, indicating that the solution has reached mesh independence. Therefore, a total grid count of approximately 2.00×10⁶ is selected for the subsequent numerical simulations to balance computational efficiency and solution accuracy.
2.6. Turbulence Model
To accurately capture the flow details of the low-viscosity, high-intensity shear turbulence within the inducer clearance layer, the present numerical simulation employs the Shear Stress Transport (SST) k-ω turbulence model. This model incorporates the effects of turbulent shear stress transport in adverse pressure gradient boundary layers and its influence on the turbulent viscosity, for which it provides a reformed formulation. It enables reliable prediction of the onset and extent of flow separation under adverse pressure gradients. It has been proved that the rotating machinery simulation agrees with the experimental results[32,33,34,35]. The equations of turbulent kinetic energy k and turbulent kinetic energy ω dissipation are:
where the density of fluid medium is ,σk3, σω3, α3 and β3 are linear combinations of corresponding coefficients of the k–ω model and k–ε model. F1 is a mixed function based on the distance from local grid nodes to walls.
2.7. Cavitation Model
Due to the highly complex nature of the cavitation initiation mechanism within tip leakage vortices, the Zwart cavitation model is based on the Rayleigh-Plesset equation, ignoring the second derivative of bubble radius with respect to time and surface tension, it exhibits satisfactory numerical stability throughout the computation process. It is widely used in the numerical simulations of rotating machinery cavitation and has excellent convergence[36,37,38,39,40]. The corresponding equation is defined as follows:
where and is the evaporation source term and condensation source term, respectively, and are the empirical coefficients of evaporation and condensation, respectively, taking the values 5 and 0.001[41]. Other parameters are bubble radius = 1 × 10⁻⁶ m and nucleation volume fraction = 5 × 10⁻⁴.\
2.8. Boundary Condition Setting
CFX software is utilized to carry out the numerical simulation of the flow field. In the computational setup, all solid walls are assumed to be hydraulically smooth and subject to a no-slip boundary condition, ensuring accurate prediction of boundary layer effects. To replicate the cryogenic working environment encountered during actual operation, the working medium is specified as low-temperature liquid nitrogen, with a set temperature of 83.06 K. At the inlet boundary, a mass flow rate of 66.35 kg/s is imposed using a velocity inlet condition, while the outlet is defined as a pressure outlet to allow for free outflow. The rotational speed of the rotor components is specified as 3000 r/min, and the reference pressure throughout the domain is set to 0 Pa. In this study, the focus is solely on investigating the influence of tip clearance on cavitation characteristics. The effect of temperature variation on the cavitation pressure is not considered. Instead, a fixed cavitation pressure of 188,940 Pa is adopted to standardize the evaluation conditions.
Under cavitating flow conditions, the volume fraction of the liquid phase at the inlet is set to 1, while the gas phase volume fraction is set to 0, ensuring a fully liquid inflow. The dynamic-static interface between the rotating and stationary domains is defined using the “frozen rotor” approach, which enables a steady-state approximation of the rotor-stator interaction. The convergence criterion for the residuals is set to 1 × 10⁻⁵ to ensure the accuracy and stability of the simulation results.
Figure 8 illustrates the schematic diagram of the chord length coefficient (λ). In this context, the chord length coefficient is a normalized parameter used to represent the relative position along the blade profile, where λ = 0 corresponds to the leading edge (blade inlet) and λ = 1 corresponds to the trailing edge (blade outlet). The chordwise direction is defined from the impeller inlet toward the outlet. During operation, the primary flow within the inducer predominantly follows an axial trajectory, which aligns closely with the blade chord direction from inlet to outlet, highlighting the axial-dominant nature of the internal flow field.
3. Calculation Results and Data Analysis
3.1. Cavitation Characteristic Curve and Efficiency Analysis
To investigate the influence of different tip clearances on the critical net positive suction head point of the LNG pump, it is first necessary to perform an analysis of the overall performance curves under varying tip clearance conditions. Figure 9 presents a graph of cavitation performance under different inducer tip clearances. This figure shows that cavitation intensifies when the inlet pressure is less than 210,000 Pa, and bubbles gradually block the flow channel, resulting in a rapid drop in the head. In engineering, the NPSHA corresponding to the head drop of 3% is usually taken as the critical cavitation allowance of the pump. Except for the gap of 0.2mm, the head at the cavitation initiation point is slightly higher than that without cavitation. This phenomenon is attributed to the microbubbles attached to the blade surface during the initial cavitation, which reduces the roughness of the blade surface, decreases the friction loss between the medium and the blade while doing work, and slightly increases the head.
Pump head is a key performance parameter. To investigate the variation trend of the head in the LNG pump under different tip clearances, the head values under non-cavitating conditions were specifically isolated for analysis across the various clearance sizes. Figure 10 depicts the headline diagram of the model pump under different tip clearances. In the absence of cavitation, the head decreases gradually when the gap size increases from 0.2mm to 1 mm. When the gap increases by 0.2mm, the head decreases by about 1 m.
To further investigate the phenomenon of head reduction with increasing tip clearance, a more detailed analysis of the internal flow within the inducer is required. Figure 11 presents a streamlined diagram of gap leakage flow under different gaps. Under the clearance of 0.2mm–0.4mm, the leakage flow generated by the tip clearance of long blades can still be integrated into the main flow direction before reaching the next blade. At this time, the flow rate and kinetic energy of leakage flow are small; hence, mainstream can quickly integrate them. When the gap increases to 0.6mm, a small amount of secondary flow begins to appear due to the increase in the leakage flow rate, accompanied by an increase in kinetic energy of leakage flow and the weakening of mainstream integration. Before reaching the next blade, the mainstream cannot integrate all leakage flow, and the unintegrated leakage flow continues to pass through the next blade’s gap and consume mainstream energy, causing a slight decrease in the head. However, due to the existence of short blades, when the chord length coefficient λ = 0.8, the leakage flow can be performed by the short blades so that the flow direction of the leakage flow is the same as that of the main flow. When the gap increases to 1mm, the position of the secondary flow is more forward, and the head decreases more.
Figure 12 illustrates the efficiency characteristic curves of the model pump under varying inducer tip clearances. As the tip clearance increases, the leakage flow through the inducer tip region correspondingly grows, leading to greater secondary flow intensity and enhanced energy dissipation associated with the change in flow direction of the leakage stream. This additional energy consumption manifests as an almost linear reduction in the overall efficiency of the model pump. Nevertheless, the magnitude of efficiency decline remains minimal; specifically, when the clearance increases from 0.2 mm to 1.0 mm, the efficiency drop is less than 1%. This limited sensitivity is attributed to the fact that the primary work output of the model pump is generated by the final two-stage impellers, while the inducer primarily functions to elevate the inlet pressure of the centrifugal stages, ensuring stable operation under low-pressure suction conditions. Consequently, the inducer contributes relatively little to the total energy consumption, and its efficiency loss exerts only a minor influence on the overall performance of the pump.
As demonstrated by the aforementioned research, the clearance size not only affects the pump’s energy efficiency but also directly influences its operational stability and cavitation resistance in practical applications. Consequently, the design of the pump’s diffuser clearance must carefully consider operational conditions, load requirements, and potential cavitation risks to optimize overall performance and prolong its service life.
3.2. Analysis of Pressure Distribution in the Flow Channel
The radial coefficient is introduced as a dimensionless number r* to observe the effect of tip clearance on the internal pressure of the induced runner:
where r is the distance from the selected position to the hub; R is the distance from blade tip to hub. When the radial coefficients are 0.1, 0.5 and 0.9(As shown in Figure 13 at the position), the pressure distribution nephograms in the flow field are compared. The three radial coefficients represent the position of the impeller hub, the middle part of the blade and the top of the blade, respectively.
The cavitation phenomenon in the inducer is intricately linked to the pressure distribution within the flow passage. Hence, investigating cavitation characteristics necessitates a prior analysis of the pressure field. Figure 14 presents a nephogram of the pressure distribution in the flow channel under the selected inlet pressure of 198,000 Pa. Under this inlet pressure, the inducers with different tip clearances are in the initial cavitation period, approaching the critical cavitation point. When the radial coefficient increases from r*=0.1 to r*=0.9, the area of the low-pressure area at the inlet decreases slightly. In contrast, the pressure in the high-pressure area at the outlet increases gradually because of the centrifugal force of blade rotation. The medium moves and accumulates to the outer edge, leading to a gradual increase of the pressure at the outer edge.
In this cavitation stage, both the inlet of the inducer and the impeller fall within the low-pressure region, which results in a reduction of the local cavitation pressure. The underlying mechanisms contributing to this phenomenon are primarily as follows:
(1) The pressure at the impeller inlet is directly and predominantly influenced by the external inlet pressure. Meanwhile, due to the rotational motion and energy input from the blades, the local flow undergoes drastic changes. This working effect of the blade causes a rapid acceleration of the fluid, which in turn leads to a sharp pressure drop in the inlet region, thereby inducing cavitation.
(2) On the low-pressure side of the blade, flake cavitation is further intensified by the presence of a tip leakage vortex. This vortex is generated by the radial leakage flow across the tip clearance, which interacts with the mainstream flow and forms a vertically oriented cavitation vortex. This vertical structure not only promotes bubble nucleation but also facilitates the accumulation of vapor bubbles within the flow channel, partially blocking the passage and altering the flow field. As the fluid continues to move downstream under the action of the long blade, the pressure within the passage gradually rises. This increasing pressure compresses the vapor bubbles, leading to their condensation and re-liquefaction. However, this process is accompanied by significant energy dissipation and pressure loss due to the abrupt phase transition and turbulent mixing caused by the collapse of cavitation structures.
When the tip clearance increases from 0.2mm to 0.4mm, the pressure changes most apparently, which is attributed to the larger proportion of the increased clearance to the overall clearance size, generating the largest proportion of the increased clearance leakage flow to the overall leakage flow, and the most evident pressure change. Figure 9 shows that the low-pressure zone on the blade pressure surface extends from chord length coefficient λ = 0.3 to λ = 0.4. At the impeller hub, when the tip clearance increases from 0.2mm to 0.4mm, the low-pressure area almost covers the whole low-pressure surface of the blade. Because of the flow change and vertical cavitation vortex caused by the work performed by the short blade at the end of the long blade, the low-pressure area begins to extend to the inlet of the short blade, resulting in the emergence of the low-pressure area at the inlet of the short blade. When the tip clearance increases from 0.6mm to 1mm, the ratio of the increased tip clearance to the overall clearance gradually decreases. The ratio of the increased leakage flow to the total leakage flow becomes smaller; therefore, the pressure changes in the flow passage under the three clearances of 0.6mm, 0.8mm and 1mm are less different.
3.3. Analysis of Cavitation Distribution in the Flow Channel
To further investigate the cavitation characteristics of the inducer at the critical NPSH condition, it is essential to examine the vapor distribution within the flow passage during cavitation inception. Figure 15 depicts an isosurface where bubbles account for 10% of the flow passages of each flow component when the inlet pressure is 198,000 Pa. Figure 15(a) shows that the most serious cavitation occurs at the inducer. A few bubbles appear at the inlet edge of the first-stage impeller blades. However, cavitation does not occur in the guide vane of the inducer and the second-stage impeller. It can be verified here that cavitation does not occur in the latter-stage impellers after being pressurised by the first-stage impeller, demonstrating that simplification of the model does not affect the research content.
Because the inducer is the first part to contact the medium, the medium flows around the blade inlet, the velocity in the tip clearance accelerates and the pressure is decreased due to the tip leakage vortex, which leads to the most serious cavitation position of the inducer. However, with the increase of the pressure of inducer blades on the medium, the bubbles can be crushed by the increased pressure before flowing out of the inducer and changing back to liquid state. When the medium enters the first-stage impeller, the rotating blade makes the low-temperature medium flow around the inlet of the blade, which causes the pressure drop and produces a small amount of airfoil cavitation. However, due to the pressurisation of the inducer, the cavitation range is very small. When the tip clearance of the inducer increases from 0.2mm to 1mm, the cavitation range of the first-stage impeller rises slightly due to the increase in the gap of the inducer, the increase in the flow rate of the tip leakage flow, and the increase in the energy consumed by the mainstream. All these actions lead to the gradual decrease of the pressure at the outlet of the inducer. Therefore, the cavitation degree at the inlet of the first-stage impeller increases slightly with the increase of tip clearance.
To further investigate the cavitation degree of a low-temperature medium in the inducer under different tip clearances, the isosurface with bubble volume accounting for 10% in the inducer was output separately. Figure 15 (b) shows the bubble distribution in the induction channel. The bubble distribution on the blade is basically consistent with the low-pressure area distribution on the blade in Figure 9. At the inlet end of the inducer, a large number of bubbles are generated to adhere to the low-pressure side surface of the blade due to the low-pressure caused by the medium flowing around the blade’s inlet. With the bubbles moving along the axis of the inducer, the bubbles move to the outer wall and accumulate under the action of rotating centrifugal force. In the range of chord length λ = 0.2–1, there are no bubbles near the hub. Bubbles on the blade surface with tip clearance of 0.2 mm–0.4 mm move along with the axial direction because the pressure in the flow channel gradually increases, and they collapse before the blade ends. When the tip clearance is 0.6mm–1mm, the high-pressure region moves backwards due to the enhancement of the tip leakage vortex, and the bubbles on the blade surface can collapse only when they reach the impeller outlet.
Under a tip clearance of 0.2 mm, within the chord length coefficient range λ = 0–0.25, it is difficult to form a distinct shear vortex zone through interaction with the main flow. This is mainly due to the small pressure differential between the pressure and suction surfaces, as well as the limited leakage flow rate. As a result, the tip leakage lacks the momentum necessary to induce strong shear or cavitation. When λ increases to around 0.25, the pressure difference increases sufficiently to enhance the leakage flow strength. The resulting leakage stream begins to interact with the mainstream to form a shear vortex region, triggering cavitation onset. In comparison, for larger tip clearances of 0.4-1.0 mm, the extended low-pressure region on the pressure surface delays the formation of cavitation associated with the tip leakage vortex. In these cases, the cavitation onset shifts downstream to the chord length range of λ = 0.3–0.4 due to the delayed velocity gradient formation and bubble growth in the enhanced leakage environment
3.4. Flow and Velocity Analysis of Clearance Leakage Flow
The clearance leakage flow under each clearance is monitored to further study the impact of clearance leakage flow on tip leakage vortex cavitation. Consequently, Figure 16 is developed.
Based on the data presented in Figure 16, it is evident that the tip clearance leakage flow exhibits an increase as the tip clearance expands from 0.2 mm to 1.0 mm. Furthermore, for every 0.2 mm increment in clearance magnitude, the corresponding increase in leakage flow remains approximately constant. This quasi-linear relationship between leakage flow rate and clearance dimension arises because the incremental enlargement of the clearance area is uniform throughout the progression. Consequently, the leakage flow rate demonstrates an essentially linear increase with the tip clearance dimension. This finding indicates that the leakage flow rate can be approximately predicted by a linear relationship with the clearance size, assuming the absence of abrupt nonlinear flow phenomena, thereby providing valuable guidance for clearance design in engineering applications.
To further investigate the evolution mechanism of the tip cavitation zone under varying tip clearances, Figure 17 presents a nephogram of leakage flow velocity in the blade tip region, captured on an axial plane with a chord length coefficient λ = 0.5 under an inlet pressure of 198,000 Pa. This figure illustrates the spatial distribution and evolution of the tip clearance leakage flow, along with the formation of the tip leakage vortex near the inducer blade tip. The origin of the leakage flow lies in the pressure difference between the pressure surface and the suction (low-pressure) surface of the blade. Under the influence of this pressure gradient and the fluid’s inherent viscosity, a portion of the working fluid leaks through the tip clearance, flowing in a direction opposite to the mainstream. This reverse flow interacts with the main flow and forms a distinct shear layer, known as the leakage shear layer. Notably, in the region near the casing wall, the leakage flow remains relatively unaffected by the mainstream flow due to the no-slip boundary condition and low momentum of the near-wall incoming flow. The local velocity reduction observed in this region is attributed to the convergence of the leakage stream with the horizontal component of the mainstream. Once convergence occurs, the combined fluid is redirected toward the hub side and subsequently migrates toward the suction surface of the blade. This redirected flow circulates back to interact with the outer leakage stream, thereby establishing a rotational structure-commonly referred to as the tip leakage vortex. This vortex formation behavior indicates that as the tip clearance flow intensifies with increased gap size, the resulting leakage stream acquires greater momentum, making it less prone to suppression by the near-wall flow. Consequently, the core region of the tip leakage vortex shifts away from the suction surface and migrates outward in the spanwise direction.
Furthermore, Figure 17 demonstrates that as the tip clearance increases from 0.2 mm to 1.0 mm, the tip leakage vortex gradually moves away from the blade’s suction surface. A primary contributing factor is the expansion of the area where the planar velocity component of the tip leakage flow exceeds 10 m/s. This trend reveals that both the flow rate and the kinetic energy of the leakage stream increase significantly with growing tip clearance. The corresponding red high-speed regions in the nephogram also extend longitudinally with larger clearance values, confirming that the leakage flow strengthens and penetrates further into the passage. At a minimal clearance of 0.2 mm, the near-wall main flow exerts a noticeable damping effect on the leakage stream, confining the vortex formation to regions close to the suction surface. As the clearance enlarges, the influence of the near-wall main flow diminishes due to the increasing leakage momentum, allowing the vortex structure to develop further from the blade surface.
In summary, variations in tip clearance not only influence the magnitude and velocity of the leakage flow but also govern the spatial location, extent, and structure of the tip leakage vortex. These changes directly affect flow instabilities, the onset location of low-pressure cores, and the intensity of cavitation phenomena, thereby playing a critical role in the overall hydrodynamic performance and cavitation resistance of LNG cryogenic pumps.
3.5. Vorticity Analysis of Blade Tip Leakage Vorticity
Figure 18 illustrates the vorticity nephogram of the blade tip region under an inlet pressure of 198,000 Pa, captured on an axial plane corresponding to a chord length coefficient λ = 0.5. As depicted in the figure, the maximum vorticity is observed within the leakage shear layer, which represents the region of most intense vortex activity across the entire tip leakage zone. This phenomenon primarily arises due to the strong interaction between the lateral tip leakage flow and the mainstream flow near the casing wall. Such interaction results in a steep velocity gradient in this region, which significantly intensifies the shear effect. The sharp velocity difference between the leakage stream and the adjacent main flow leads to a pronounced local variation in flow velocity, thereby inducing the highest level of vorticity within the leakage domain.
As the tip clearance increases from 0.2 mm to 0.8 mm, the region where the vorticity within the leakage shear layer exceeds 7500 s-1 becomes progressively broader. This expansion is directly attributed to the increased volume of leakage flow permitted by the enlarged tip gap. A larger clearance reduces the dominant control exerted by the main flow on the leakage stream, thereby allowing the leakage flow to develop more freely. This results in a broader passage for vortex formation and an increase in the lateral entrainment of the main flow, particularly near the casing wall. Consequently, a more extensive vortex region characterized by high shear and strong rotational motion emerges.
However, when the tip clearance further increases from 0.8 mm to 1.0 mm, the area of the leakage shear layer where the vorticity exceeds 7500 s-1 begins to shrink. This reduction is mainly due to the dynamic behavior of the converging flow interacting with the now more dominant leakage stream. As the converging main flow is entrained into the tip leakage vortex near the suction side of the blade, the intensified leakage flow creates a resistance to flow redirection, making it difficult to maintain the same rotational intensity. This leads to enhanced energy dissipation within the shear layer, which suppresses the generation and maintenance of high vorticity in the downstream region of the vortex structure.
Furthermore, when the tip clearance increases from 0.2 mm to 0.4 mm, both the area of tip leakage vorticity and the vorticity magnitude at the vortex core increase significantly. This trend is indicative of a regime where the leakage flow, although still limited in volume, undergoes sharp acceleration, enhancing vorticity generation due to the rapid shear formation. In contrast, as the clearance continues to grow from 0.4 mm to 1.0 mm, the total vortex area keeps expanding, but the peak vorticity at the vortex core shows a decreasing trend. This is because the stronger leakage flow in this range leads to a higher degree of convergence, which in turn reduces the ability of the flow to be redirected or destabilized, thereby diluting the core vorticity.
The increasingly concentrated converged flow near the hub becomes more inert to deflection forces, making the flow field more stabilized and reducing the intensity of localized vorticity. Hence, it can be inferred that there exists a critical threshold of tip clearance-most likely within the range of 0.2 mm to 0.6 mm. Below this threshold, the central vorticity of the tip leakage vortex increases with clearance due to the intensified shear effect. However, once this threshold is surpassed, further increases in tip clearance lead to greater energy loss and flow stabilization, thereby diminishing the core vorticity and weakening the vortex strength.
4. Conclusions
The experimental study and numerical simulation of LNG cryogenic multistage pump external characteristics are conducted in this paper. As a result, the accuracy of numerical calculation is verified. The external characteristics, cavitation performance and tip leakage vortex of the pump with five tip clearances of 0.2mm, 0.4mm, 0.6mm, 0.8mm and 1mm were assessed, and the following conclusions were obtained:
- The influence of the inducer with blade tip clearance on the external characteristics of the cryopump is determined. In the absence of cavitation, with the increase of tip clearance equivalence, the flow rate of tip leakage flow increases linearly, the area of tip leakage vortex increases, the leakage loss of inducer increases, and the head and efficiency of model pump decrease slightly. When the tip clearance is larger than 0.6mm, the primary flow cannot be integrated before the leakage flow reaches the next blade, and the unintegrated leakage flow continues to flow through the tip clearance of the next blade, creating a secondary clearance leakage flow and leading to the further consumption of mainstream energy in the inducer. However, because the inducer is mainly used in the model pump to provide a small amount of pressure for the inlet of the impeller and avoid cavitation in the impeller, the main work part of the model pump is the centrifugal impeller; therefore, the energy loss of the inducer has little impact on the whole.
- By decomposing the cavitation in the tip leakage region, it can be divided into clearance layer cavitation, shear flow cavitation and tip leakage vortex cavitation. When the tip clearance increases from 0.2mm to 1mm, the tip leakage flow increases. Its energy consumption increases at the same time. The low-pressure area of the inducer gradually extends inward. When the tip clearance is 0.2mm and 0.4mm, the cavitation bubbles can collapse in the flow passage, but when the tip clearance increases to 0.6mm to 1mm, the bubbles cover the whole low-pressure blade of the inducer. The area of tip leakage vortex and clearance shear layer increases, and the cavitation degree of 0.2mm-0.8mm tip leakage area gradually increases. However, when the tip clearance increases to 1mm, the central vorticity of the tip leakage vortex decreases and the cavitation degree of the tip leakage vortex improves.
- The relationship between tip clearance and tip leakage vortex is established. The strong vorticity area of tip leakage vortex increases with tip clearance. There is a certain clearance between 0.2mm and 0.6mm. When the tip clearance is less than this value, the impact of mainstream on tip leakage flow is still obvious; the tip leakage vortex forms faster, and the central vorticity of tip leakage vortex increases gradually. When the tip clearance is larger than this value, the weakening effect of the mainstream on tip leakage flow is weakened, the generation speed of the tip leakage vortex is slowed down, and the vorticity in the central region is gradually reduced.
Funding
The work was sponsored by National Key R&D Program Project (No.2025YFE0102900). The work was sponsored by the National Natural Science Foundation of China (No. 52376037). The Key Research and Development Program of Zhejiang Province (No. 2025C02030). Nanxun scholarsprogram of ZJWEU (RC2024010464).
Acknowledgments
The authors would like to acknowledge the technical and administrative support received during the preparation of this work.
Conflicts of Interest
The authors declare no conflicts of interest.
References
- Dong, Q.M.; Yang, C.J.; Kang, N. Current status and development of LNG cryogenic pumps in China and abroad. Pump Technology 2021, 2, 1–8. [Google Scholar]
- Pu, H.; Chen, J. Comparative study on LNG-FPSO liquefaction process schemes. Refrigeration Technology 2011, 31, 31–34. [Google Scholar]
- Ge, Y.Q.; Zhang, L.Q.; Zhao, L.; et al. Cascade utilization of LNG cold energy. Refrigeration Technology 2006, 26, 14–16. [Google Scholar]
- Song, H.D.; Guo, B.J.; Li, Y.H. Design and operational characteristics of low-specific-speed submerged LNG pumps. Fluid Machinery 2023, 51, 60–65. [Google Scholar]
- Song, W.W.; Shi, J.W.; Wei, L.C.; et al. Backflow vortex and cavitation characteristics in high-speed centrifugal pumps. Journal of Mechanical Engineering 2020, 56, 95–103. [Google Scholar]
- Xiang, L.; Chen, H.; Tan, Y.H.; et al. Experimental study on cavitation flow characteristics of inducers. Transactions of the Chinese Society for Agricultural Machinery 2019, 50, 125–132. [Google Scholar]
- Guo, X.M.; Zhu, Z.C.; Cui, B.L.; et al. Effects of the number of inducer blades on the anti-cavitation characteristics and external performance of a centrifugal pump. Journal of Mechanical Science and Technology 2016, 30, 3173–3181. [Google Scholar] [CrossRef]
- Guo, X.M.; Zhu, Z.C.; Cui, B.L.; et al. Effects of the short blade locations on the anti-cavitation performance of the splitter-bladed inducer and the pump. Journal of Chemical Engineering 2015, 23, 1095–1101. [Google Scholar] [CrossRef]
- Guo, X.M.; Zhu, Z.C.; Cui, B.L.; et al. The rotating cavitation performance of a centrifugal pump with a splitter-bladed inducer under different rotational speed. Journal of Turbo Jet-Engines 2015, 32, 275–283. [Google Scholar] [CrossRef]
- Guo, X.M.; Zhu, Z.C.; Cui, B.L.; et al. Anti-cavitation performance of a splitter-bladed inducer under different flow rates and different inlet pressures. Science China Technological Sciences 2015, 58, 2131–2138. [Google Scholar] [CrossRef]
- Guo, X.M.; Zhu, Z.C.; Cui, B.L.; et al. Numerical and experimental investigations on the cavitation characteristics of a high-speed centrifugal pump with a splitter-blade inducer. Journal of Mechanical Science and Technology 2015, 29, 259–267. [Google Scholar] [CrossRef]
- Parikh, T.; Mansour, M.; Thévenin, D. Investigations on the effect of tip clearance gap and inducer on the transport of air-water two-phase flow by centrifugal pumps. Chemical Engineering Science 2020, 218, 115554. [Google Scholar] [CrossRef]
- Kong, F.Y.; Huang, J.J.; Lu, Y.; et al. Development of variable-pitch inducers for centrifugal pumps. Drainage and Irrigation Machinery 2008, 26, 10–14. [Google Scholar]
- Cui, B.L.; Chen, J.; Li, X.J.; et al. Visualization experiments and numerical simulation of cavitation development in high-speed inducer centrifugal pumps. Transactions of the Chinese Society for Agricultural Machinery 2018, 49, 148–155. [Google Scholar]
- Cui, B.; Chen, J. Visual experiment and numerical simulation of cavitation instability in a high-speed inducer. Journal of Power and Energy 2020, 234, 470–480. [Google Scholar] [CrossRef]
- Cui, B.L.; Zhu, Z.C.; Lin, Y.G.; et al. Numerical simulation of internal flow in constant-pitch inducers. Journal of Mechanical Engineering 2010, 46, 158–163. [Google Scholar] [CrossRef]
- Li, R.N.; Bi, Z.; Li, Y.B.; et al. Effect of inducer deflection angle on cavitation performance of centrifugal pump impellers. Journal of Drainage and Irrigation Machinery Engineering 2016, 34, 461–469. [Google Scholar]
- Chen, X.R.; Jia, N.N.; Lv, B.R.; et al. Effect of meridian plane dip angle of the variable pitch inducer blade on cavitation performance of high-speed centrifugal pump. Journal of the Brazilian Society of Mechanical Sciences and Engineering 2020, 42, 217. [Google Scholar] [CrossRef]
- Zhang, H.; Xia, B.; Kong, F.Y.; et al. Experimental investigation of cavitation characteristics for a high-speed inducer with a great flow rate. Advances in Mechanical Engineering 2022, 14, 1–15. [Google Scholar] [CrossRef]
- Zhai, L.L.; Li, Y.F.; Cui, B.L.; et al. Studies of cavitation characteristics of inducers with different blade numbers. AIP Advances 2021, 11, 085216. [Google Scholar] [CrossRef]
- Dou, W.; Jiang, W.S.; Li, C.Q.; et al. Influence of inducers on cavitation flow fields in high-speed liquid oxygen pumps. Journal of Vibration and Shock 2024, 43, 280–286. [Google Scholar]
- Wang, J.; Chen, X.; Bi, C.Y.; et al. Effect of annular grooves on cavitation performance of inducers. Missiles and Space Vehicles 2023, 2, 47–51. [Google Scholar]
- Zhang, D.S.; Shi, W.D.; Pan, D.Z.; et al. Numerical and experimental investigation of tip leakage vortex cavitation patterns and mechanisms in an axial flow pump. ASME Journal of Fluids Engineering 2015, 137, 815–816. [Google Scholar] [CrossRef]
- Zhang, D.S.; Shi, W.D.; van Esch, B.P.M.; et al. Numerical and experimental investigation of tip leakage vortex trajectory and dynamics in an axial flow pump. Computers & Fluids 2015, 112, 61–71. [Google Scholar] [CrossRef]
- Zhang, D.S.; Pan, D.Z.; Shi, W.D.; et al. Cavitation flow field and blade load distribution characteristics in tip region of axial flow pumps. CIESC Journal 2014, 65, 501–507. [Google Scholar]
- Guo, X.M.; Jiang, C.Y.; Qian, H.; et al. The influence of tip clearance on the performance of a high-speed inducer centrifugal pump under different flow rates conditions. Processes 2023, 11, 239. [Google Scholar] [CrossRef]
- Guo, X.M.; Yang, S.D.; Li, X.J.; et al. The tip clearance cavitation mechanism of a high-speed centrifugal pump with a splitter-bladed inducer. Processes 2021, 9, 1576. [Google Scholar] [CrossRef]
- Xiang, L.; Tan, Y.H.; Chen, H.; et al. Experimental investigation of cavitation instabilities in inducer with different tip clearances. Chinese Journal of Aeronautics 2021, 34, 168–177. [Google Scholar] [CrossRef]
- Karakas, E.S.; Watanabe, H.; Aureli, M.; et al. Cavitation performance of constant and variable pitch helical inducers for centrifugal pumps: effect of inducer tip clearance. Journal of Fluids Engineering 2020, 142, 021101. [Google Scholar] [CrossRef]
- Dreyer, M.; Decaix, J.; Münch-Alligné, C.; et al. Mind the gap—tip leakage vortex in axial turbines. IOP Conference Series: Earth and Environmental Science 2014, 22, 052023. [Google Scholar] [CrossRef]
- Jiang, C.Y. Study on Internal Flow and Cavitation Characteristics of High-Head High-Power LNG Pumps. Ph.D. Dissertation, Ningxia University, Ningxia, China, 2023. [Google Scholar]
- Si, Q.R.; Yuan, S.Q.; Li, X.J.; et al. Numerical analysis of unsteady flow in centrifugal pump cavities under cavitation conditions. Transactions of the Chinese Society for Agricultural Machinery 2014, 45, 84–90. [Google Scholar]
- Zhang, D.S.; Wu, S.Q.; Shi, W.D.; et al. Application and validation of different turbulence models in simulating tip leakage vortices in axial flow pumps. Transactions of the Chinese Society of Agricultural Engineering 2013, 29, 46–52. [Google Scholar]
- Liu, Y.; Chang, L.L. Comparative study on application of different SST models in cylindrical flow simulations. Mechanical Design and Manufacturing Engineering 2024, 53, 31–35. [Google Scholar]
- Wang, F.J. Research progress on rotating turbulence models for fluid machinery. Transactions of the Chinese Society for Agricultural Machinery 2016, 47, 1–13. [Google Scholar]
- Zwart, P.J.; Gerber, A.G.; Belamri, T. A two-phase flow model for predicting cavitation dynamics. In Proceedings of the Fifth International Conference on Multiphase Flow, Yokohama, Japan, 30 May–4 June 2004; ICMF: Yokohama, Japan, 2004; pp. 152–163. [Google Scholar]
- Xu, Y.; Shao, C.L. Cavitation model modification and numerical study of internal flow in cryogenic liquid nitrogen pumps. Cryogenics 2019, 1, 25–30. [Google Scholar]
- Xue, R.; Wang, X.; Qu, L.F.; et al. Numerical study on internal flow characteristics of cryogenic liquid nitrogen atomization nozzles. Cryogenics 2020, 5, 25–31. [Google Scholar]
- Zhang, D.S.; Wan, F.L.; Xu, B.; et al. Modification of cavitation model considering thermodynamic effects and its applicability. Transactions of the Chinese Society for Agricultural Machinery 2019, 50, 138–146. [Google Scholar]
- Liu, H.L.; Liu, D.X.; Wang, Y.; et al. Evaluation of three cavitation models in centrifugal pump cavitation flow calculations. Transactions of the Chinese Society for Agricultural Machinery 2013, 28, 54–59. [Google Scholar]
- Shen, T.J.; Li, X.J.; Li, L.M.; et al. Evaluation of vorticity forces in thermos-sensitive cavitating flow considering the local compressibility. International Communications in Heat and Mass Transfer 2020, 118, 104818. [Google Scholar] [CrossRef]
Figure 1.
Assembly drawing of an LNG pump.
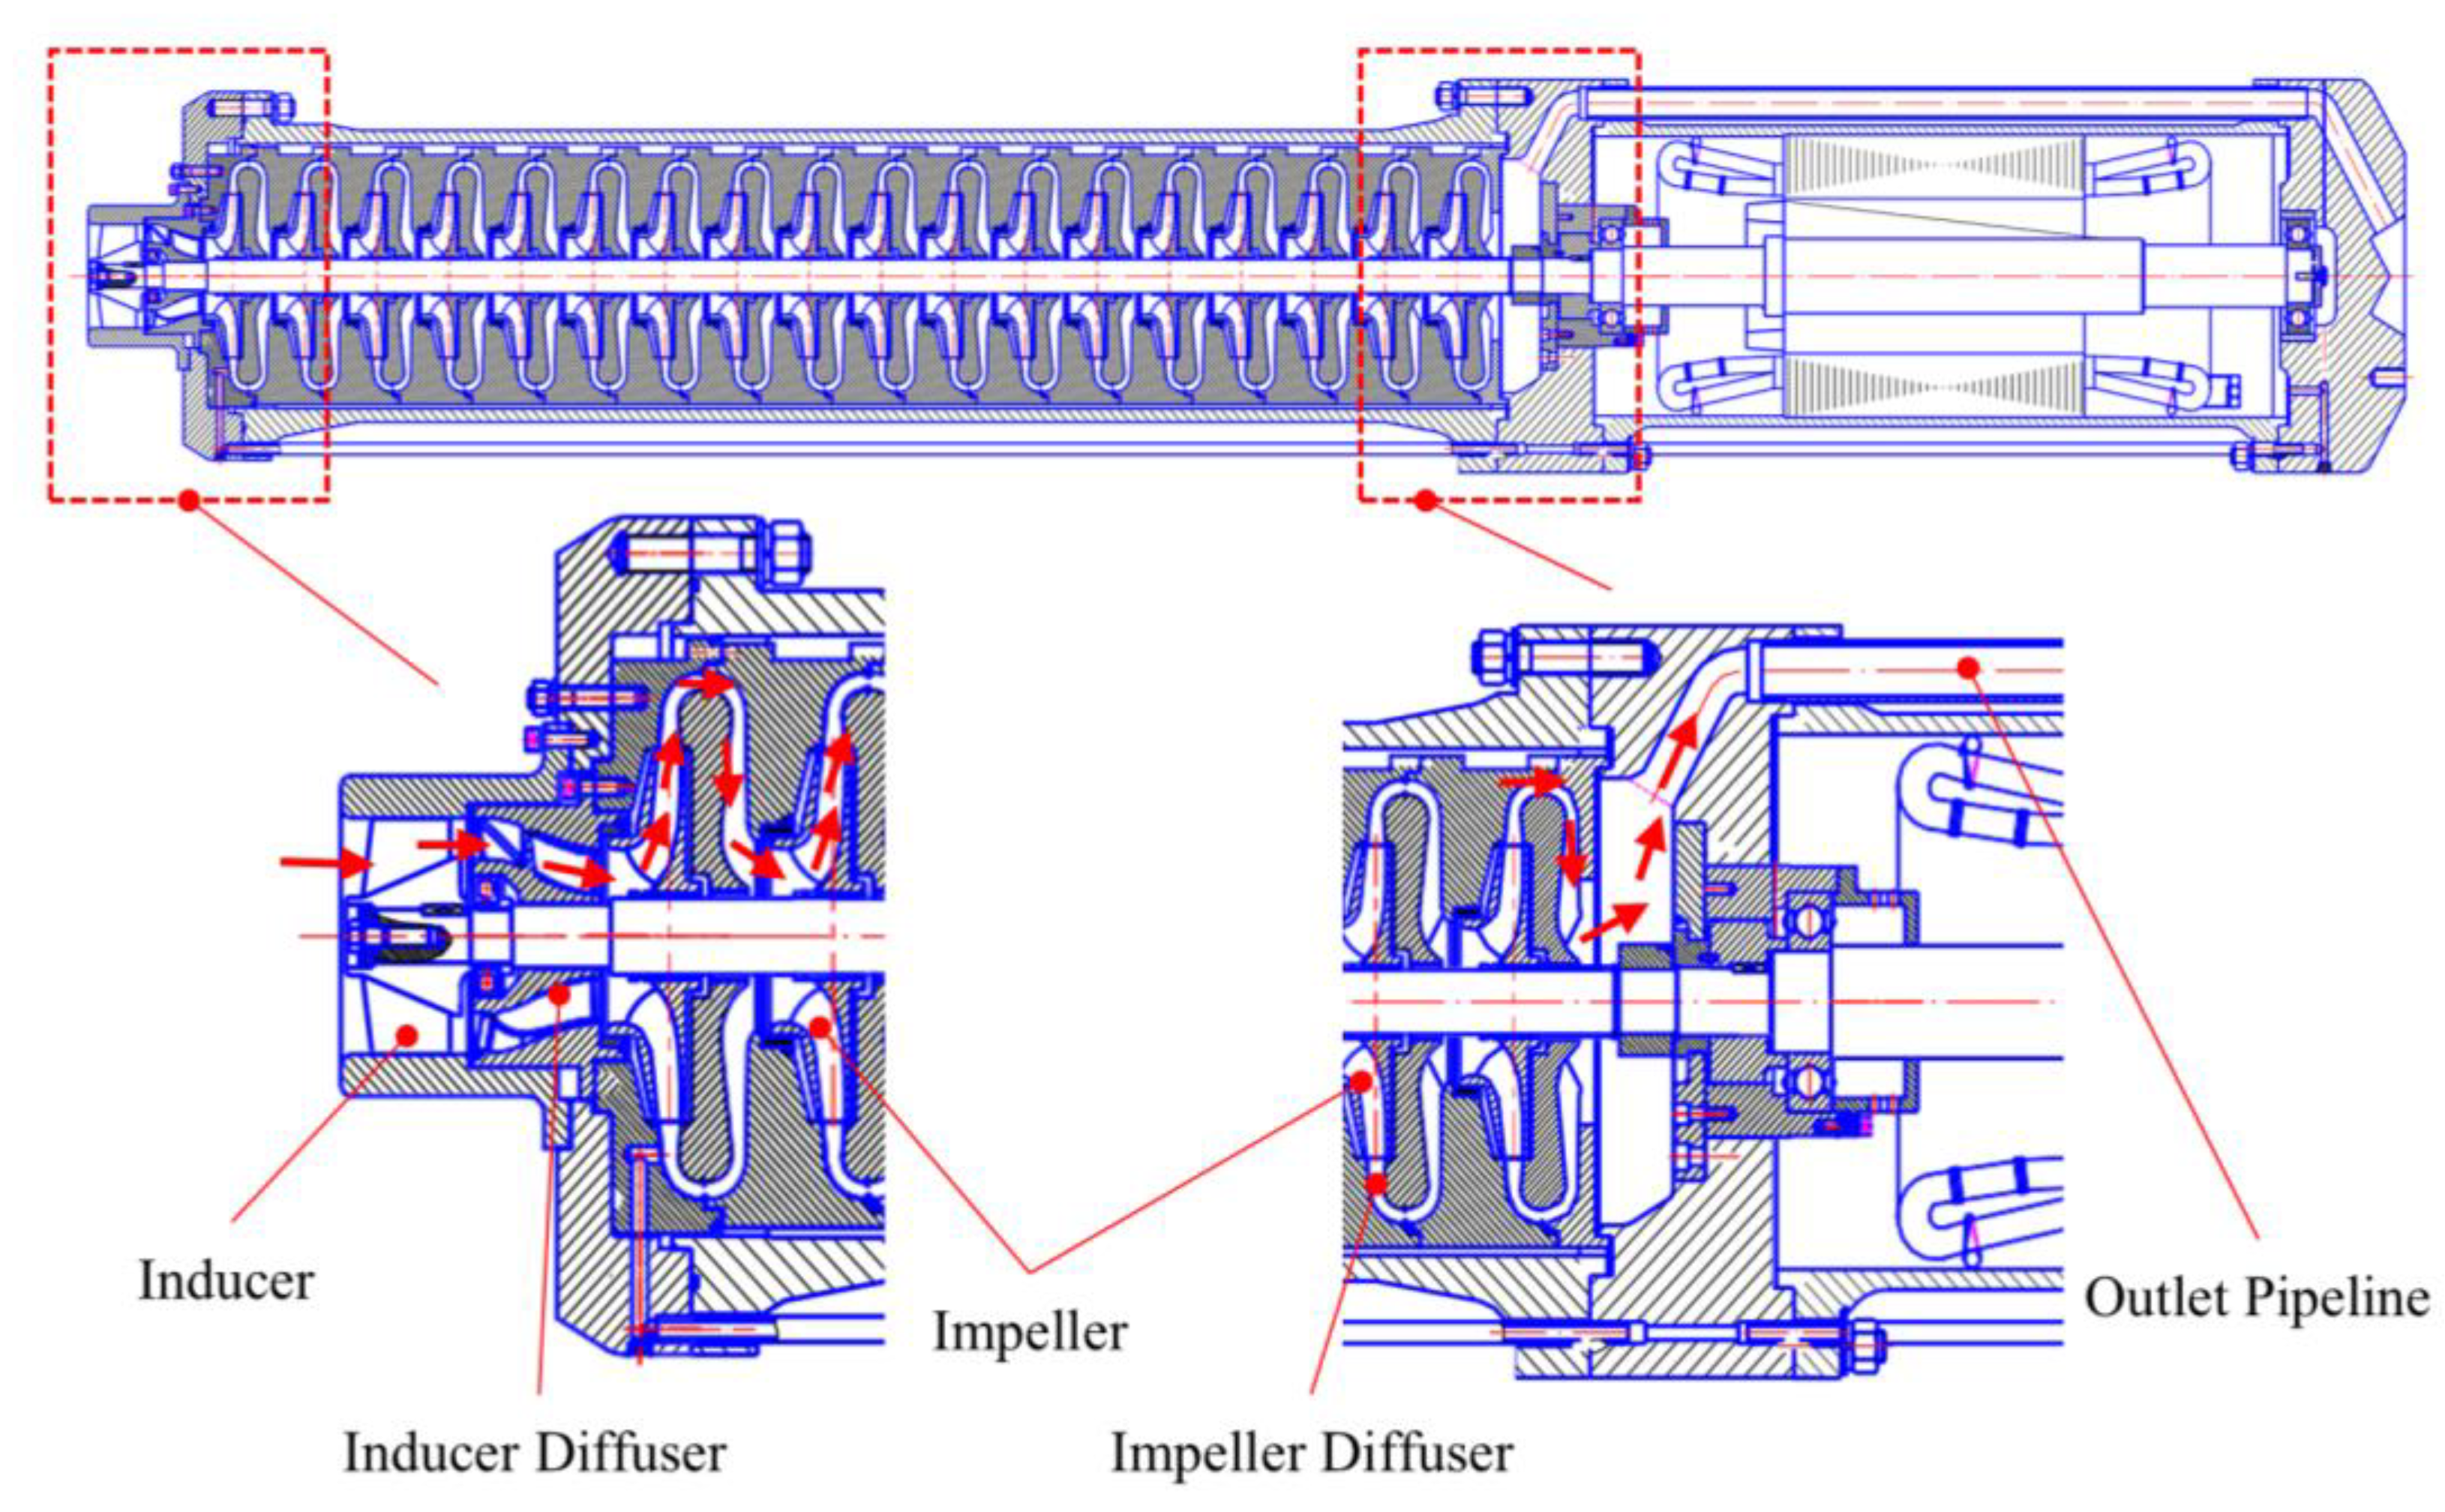
Figure 2.
Schematic diagram of the inducer and impeller structure. (a) Basic dimensions of inducers; (b) Basic dimensions of impellers.
Figure 2.
Schematic diagram of the inducer and impeller structure. (a) Basic dimensions of inducers; (b) Basic dimensions of impellers.
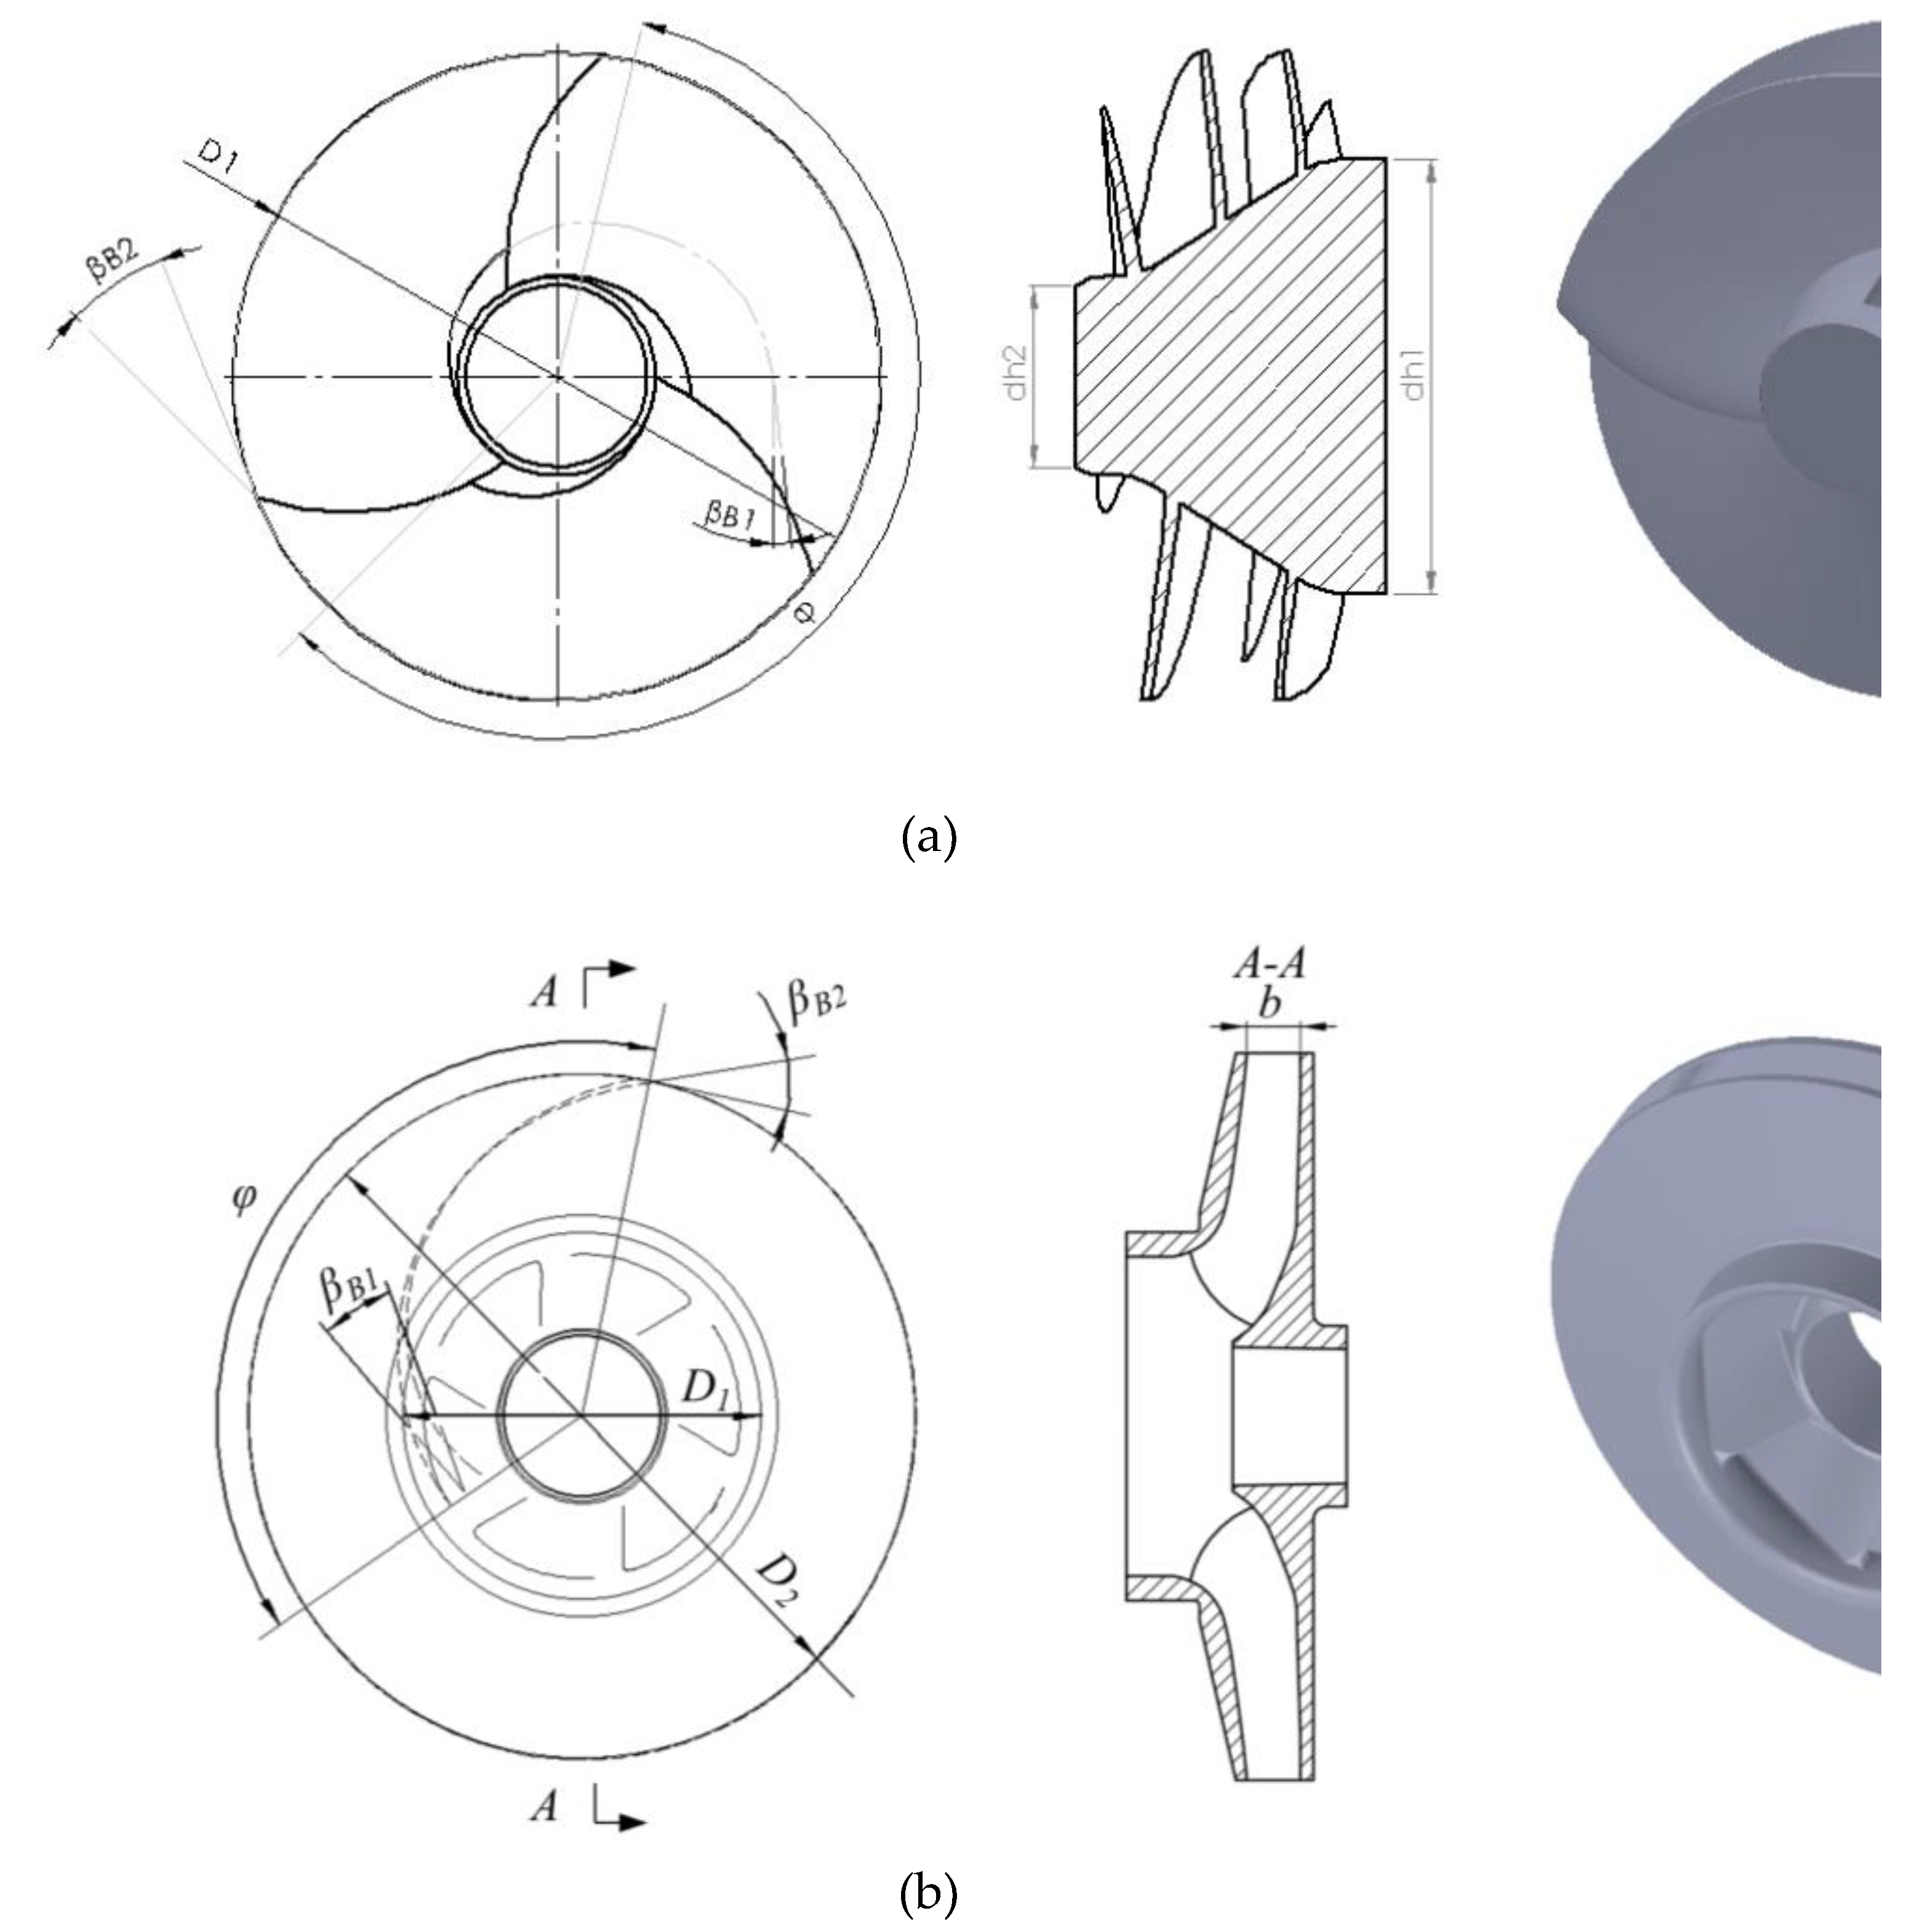
Figure 3.
Schematic diagram of the LNG pump experimental system. (a) Schematic diagram of the experimental test system; (b) Test Site Diagram.
Figure 3.
Schematic diagram of the LNG pump experimental system. (a) Schematic diagram of the experimental test system; (b) Test Site Diagram.
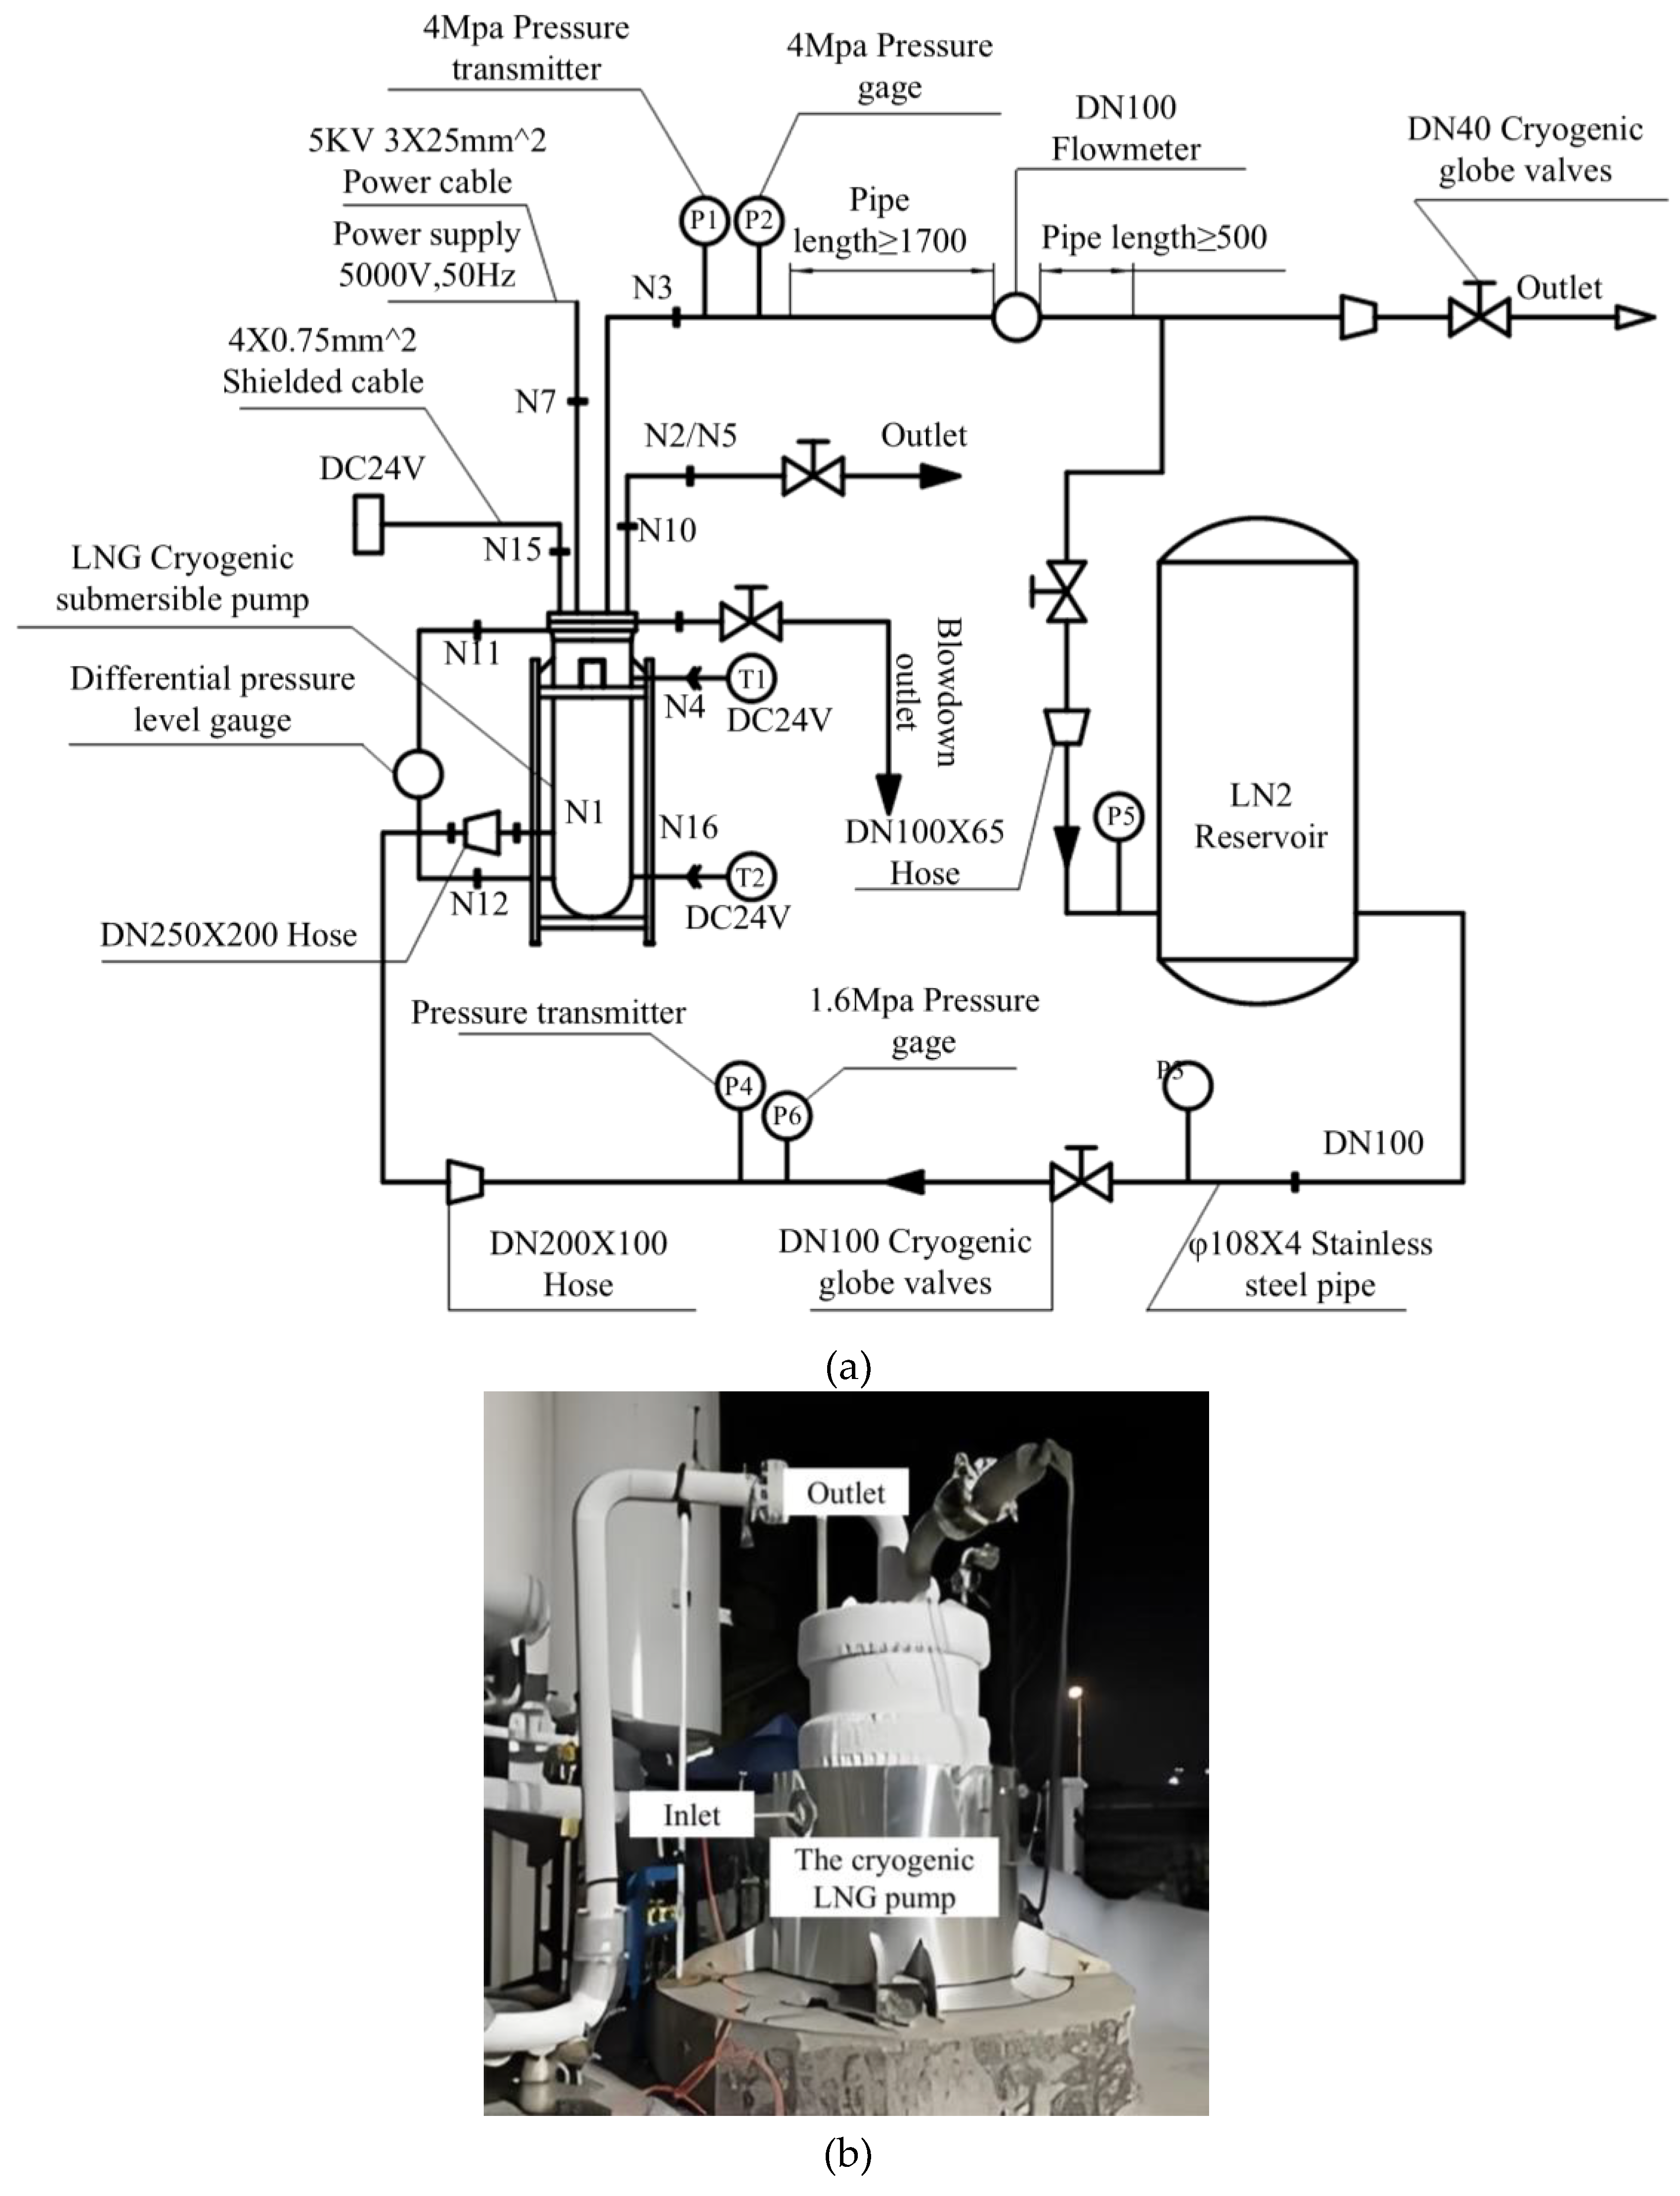
Figure 4.
Head and efficiency curve of pump at 1500rpm.
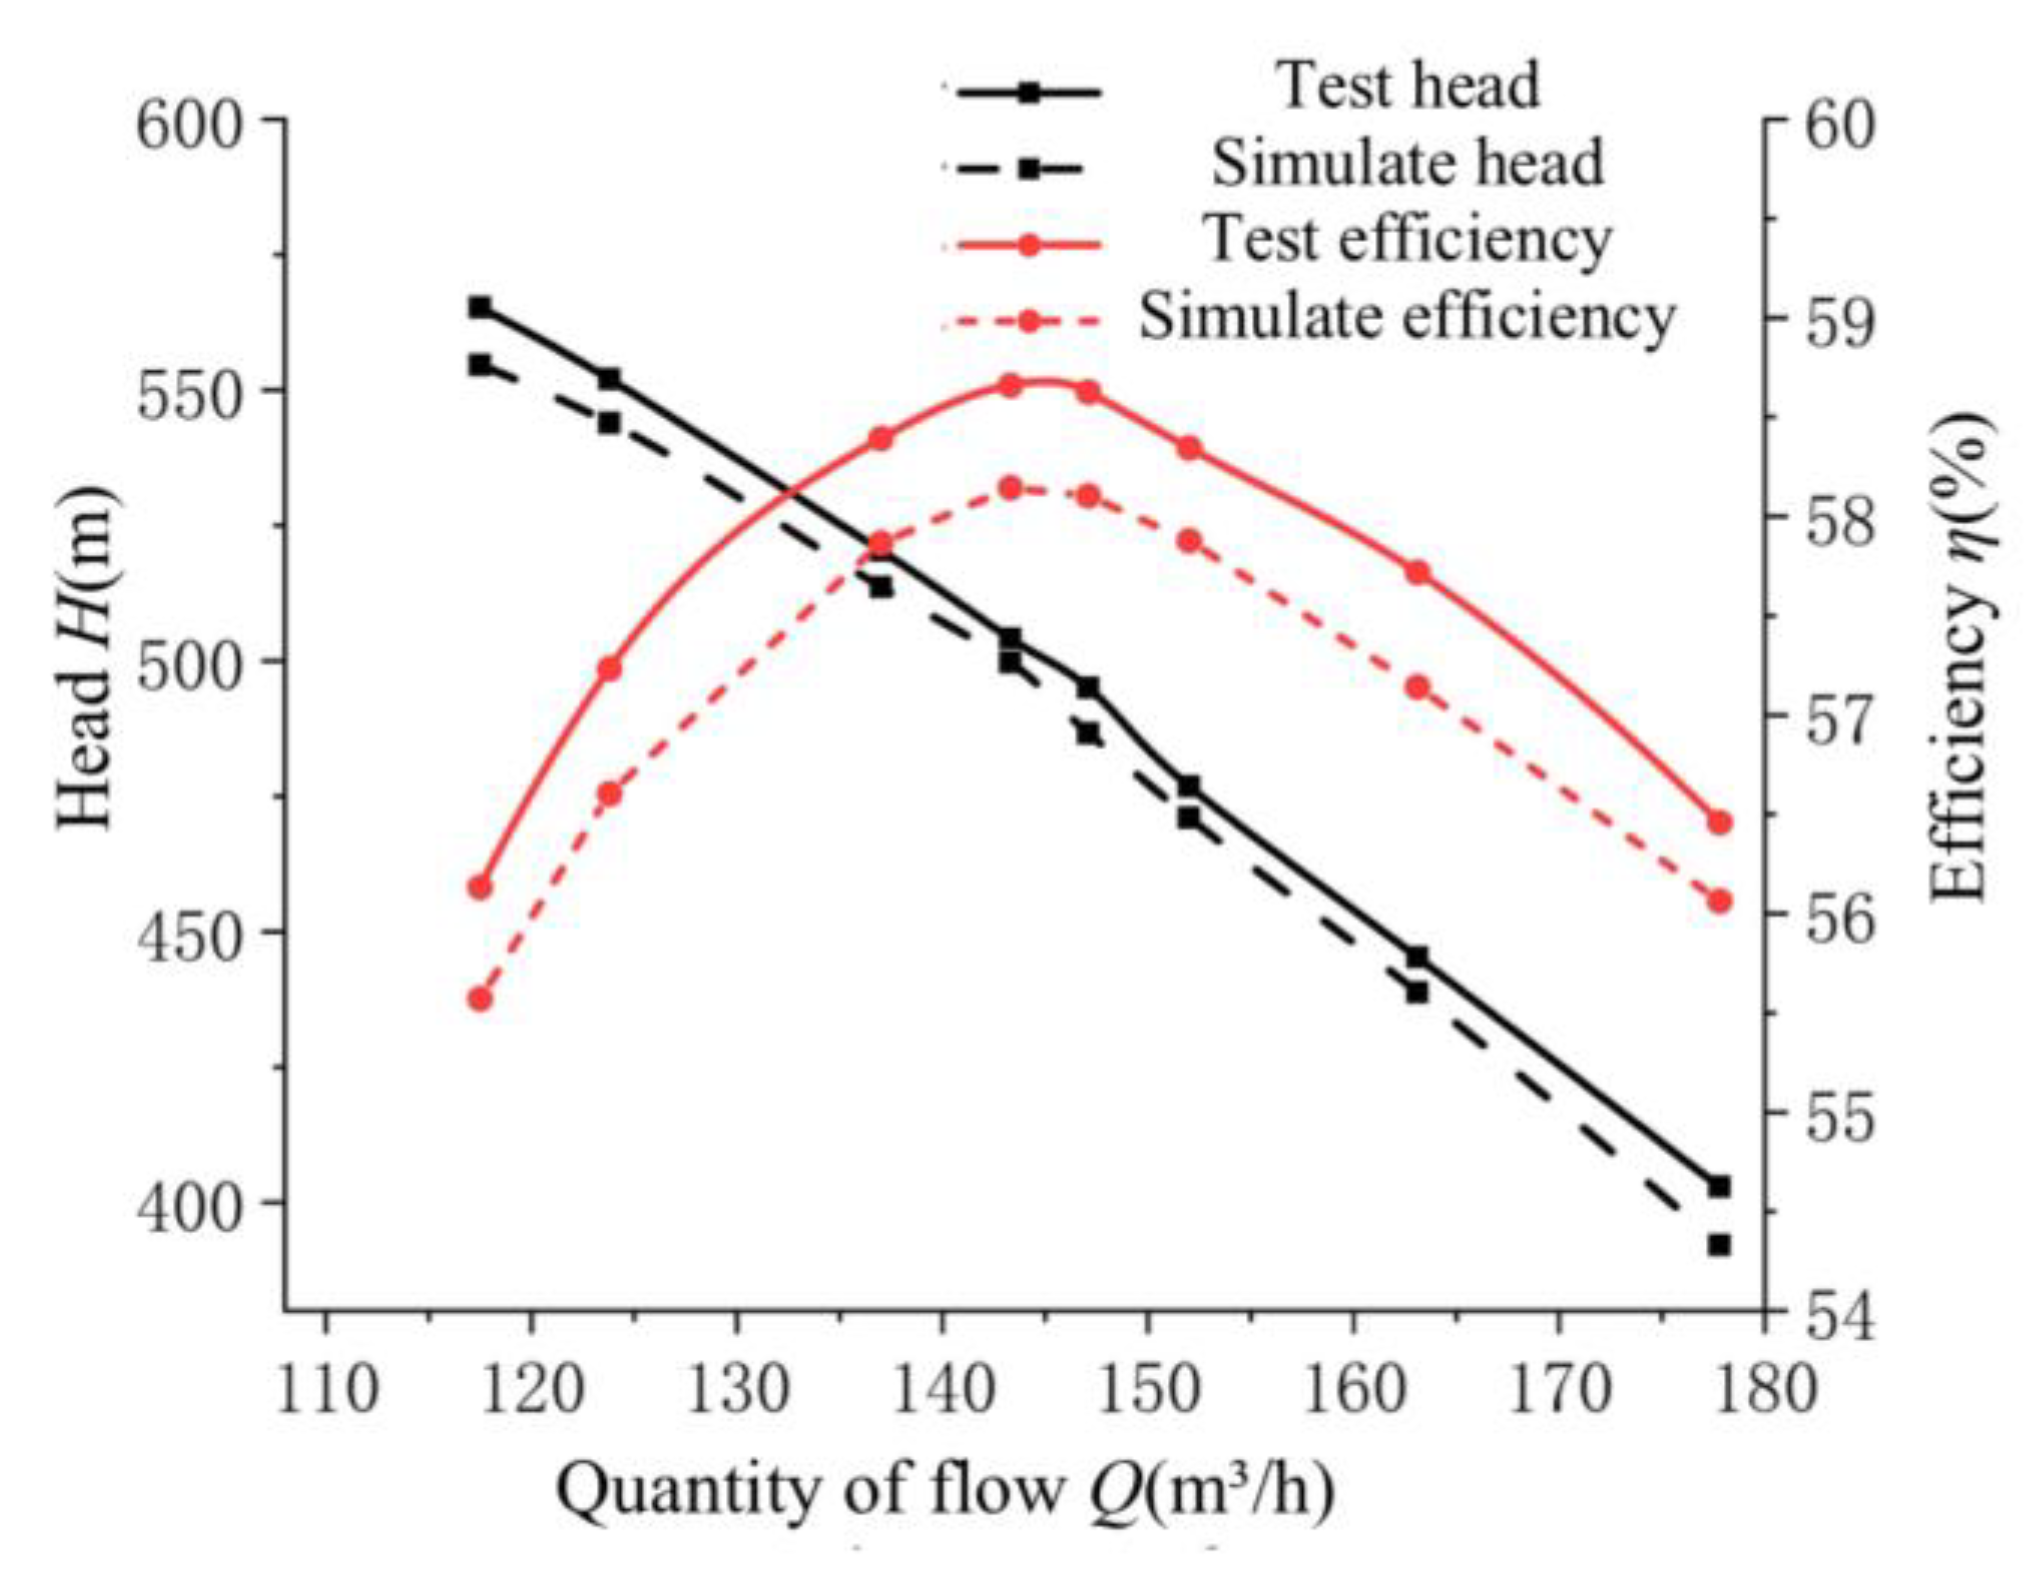
Figure 5.
Head and efficiency curve of the pump at 3000 rpm.
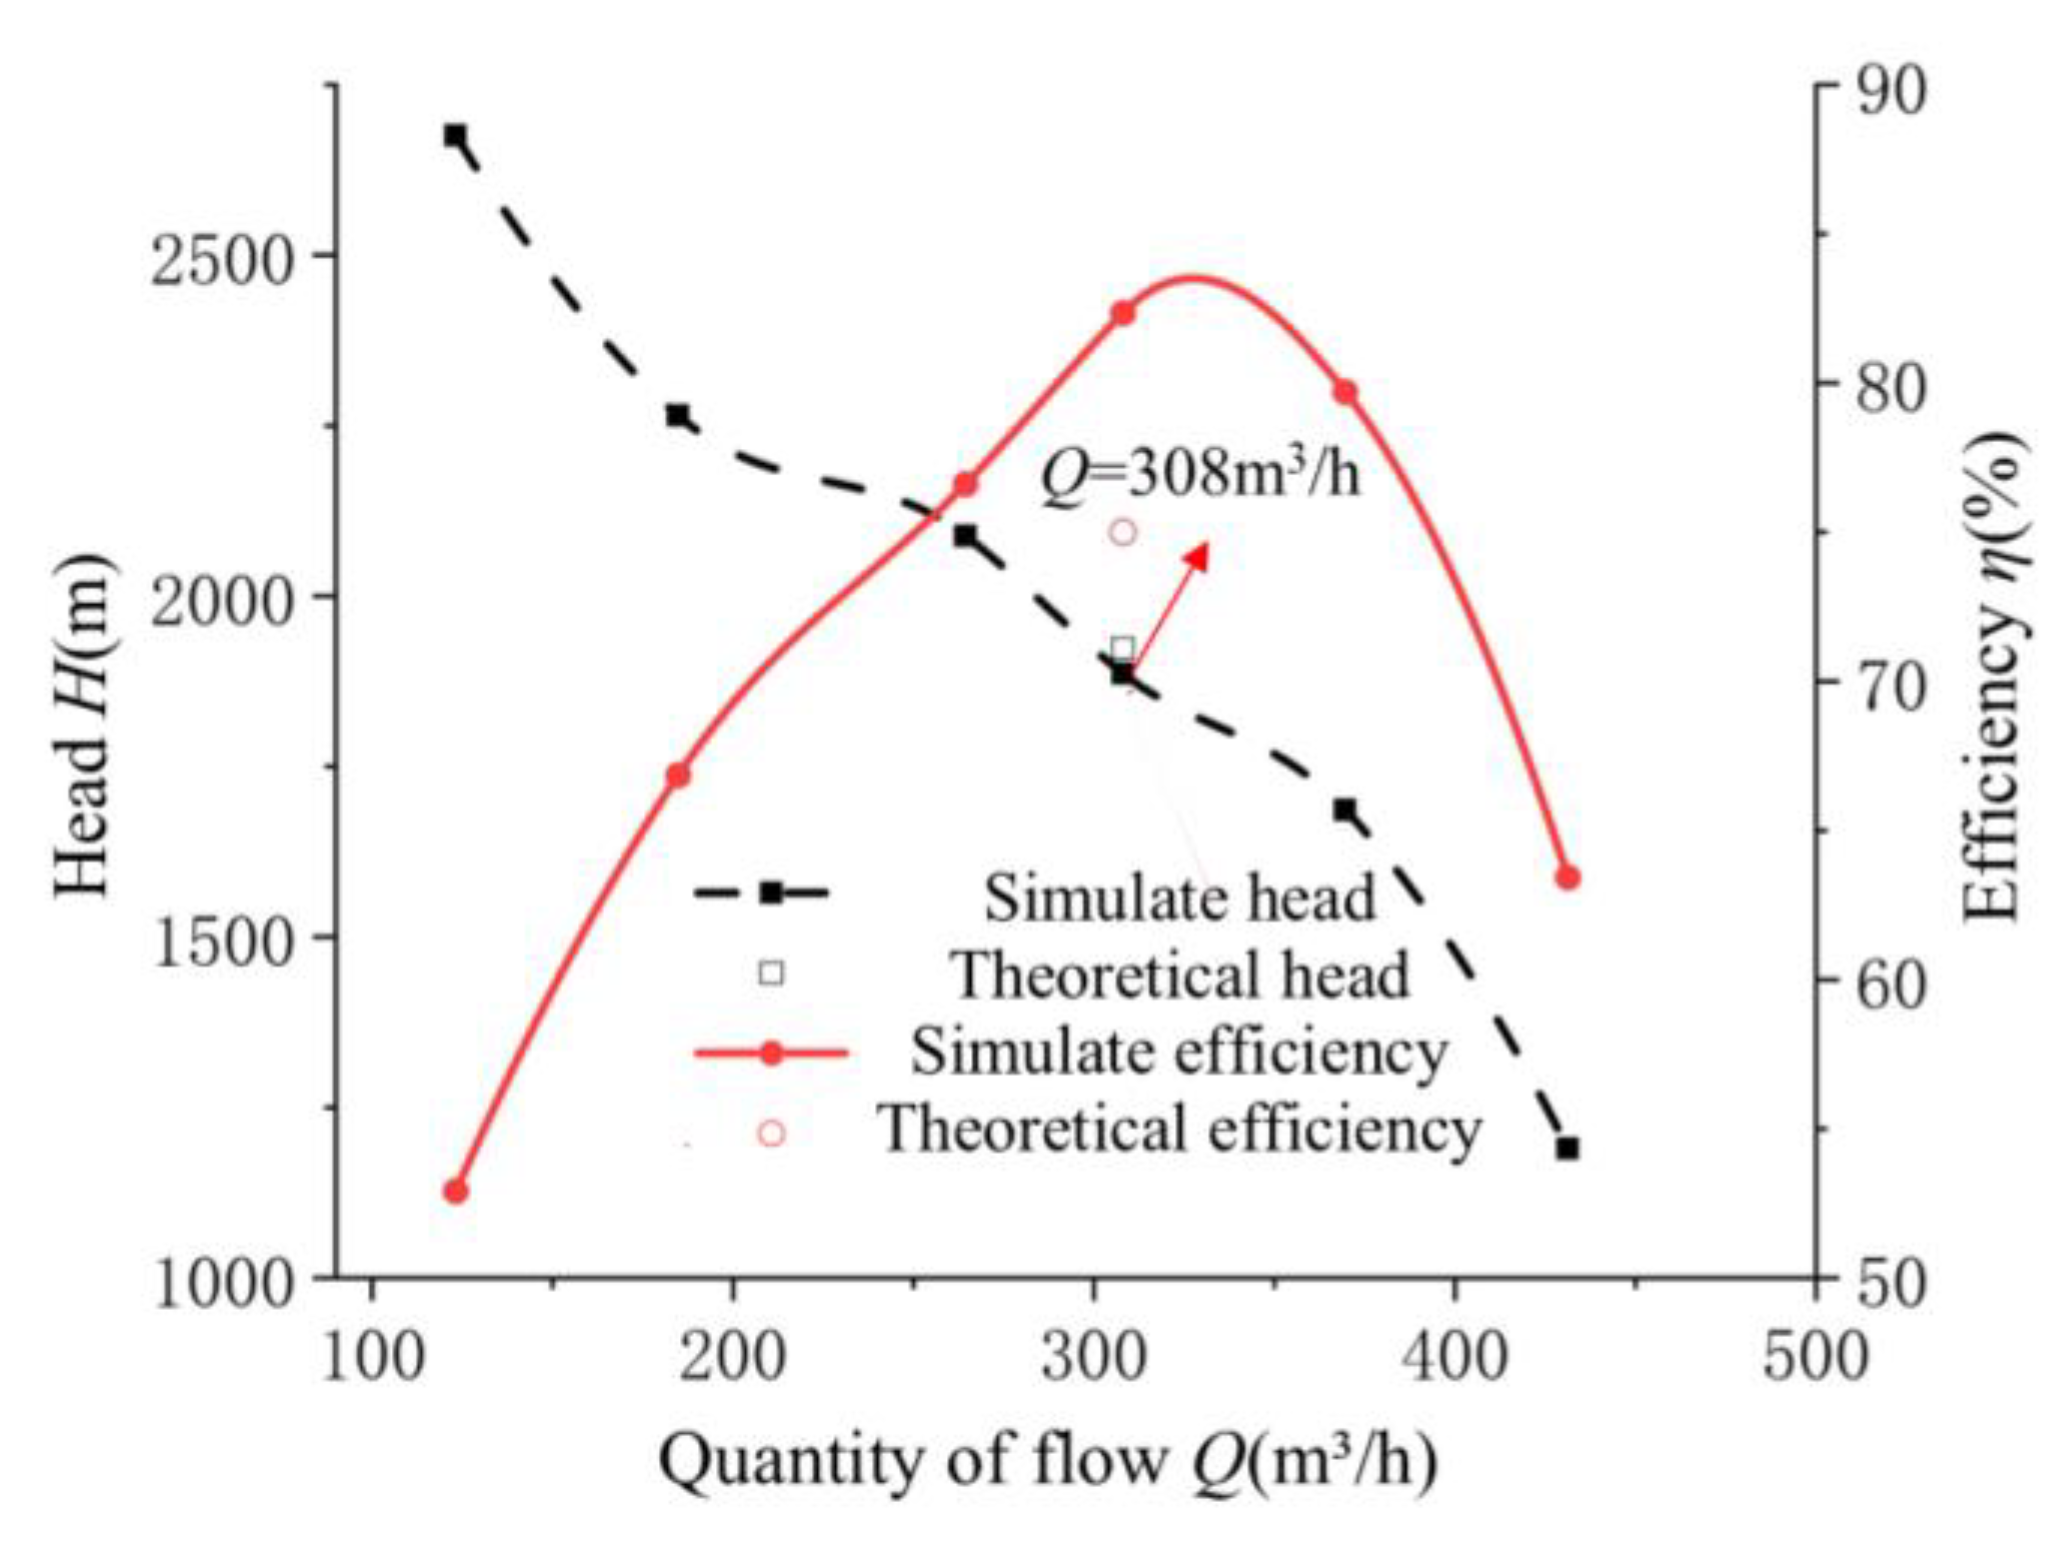
Figure 6.
Explosion diagram of main parts of the experimental model.
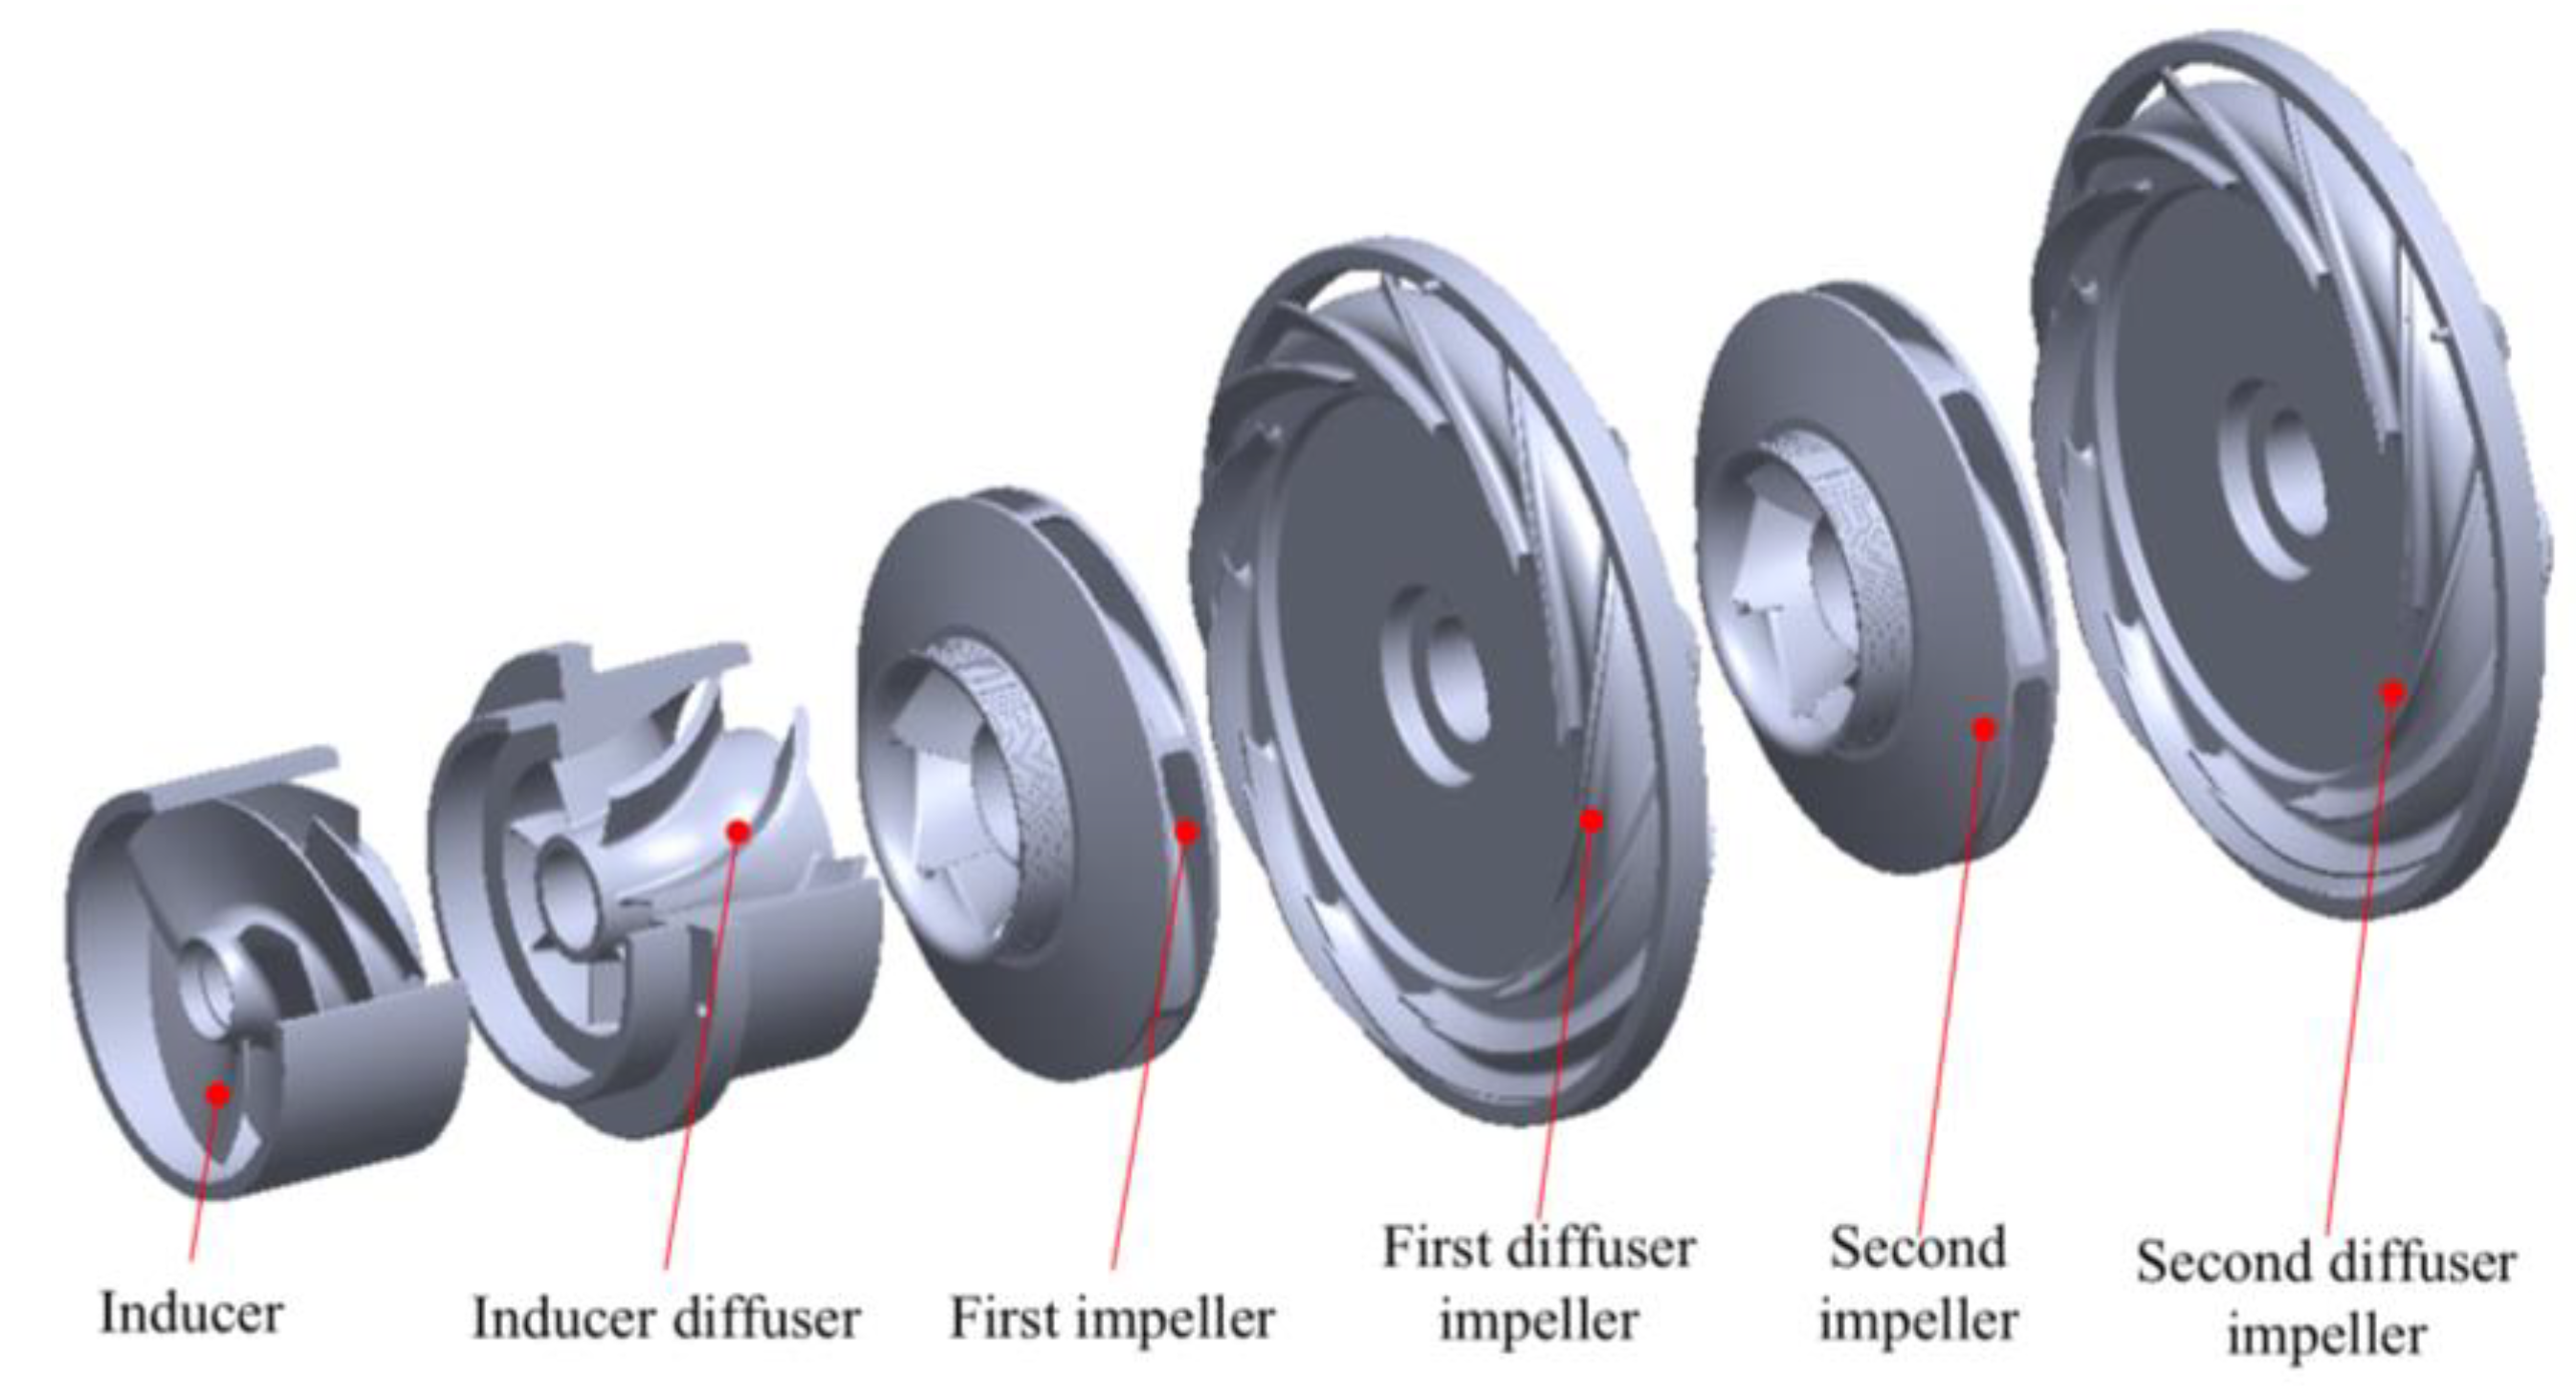
Figure 7.
Fluid calculation area and inducer grid division. (a) All fluid calculation areas; (b) Inducer meshing.
Figure 7.
Fluid calculation area and inducer grid division. (a) All fluid calculation areas; (b) Inducer meshing.
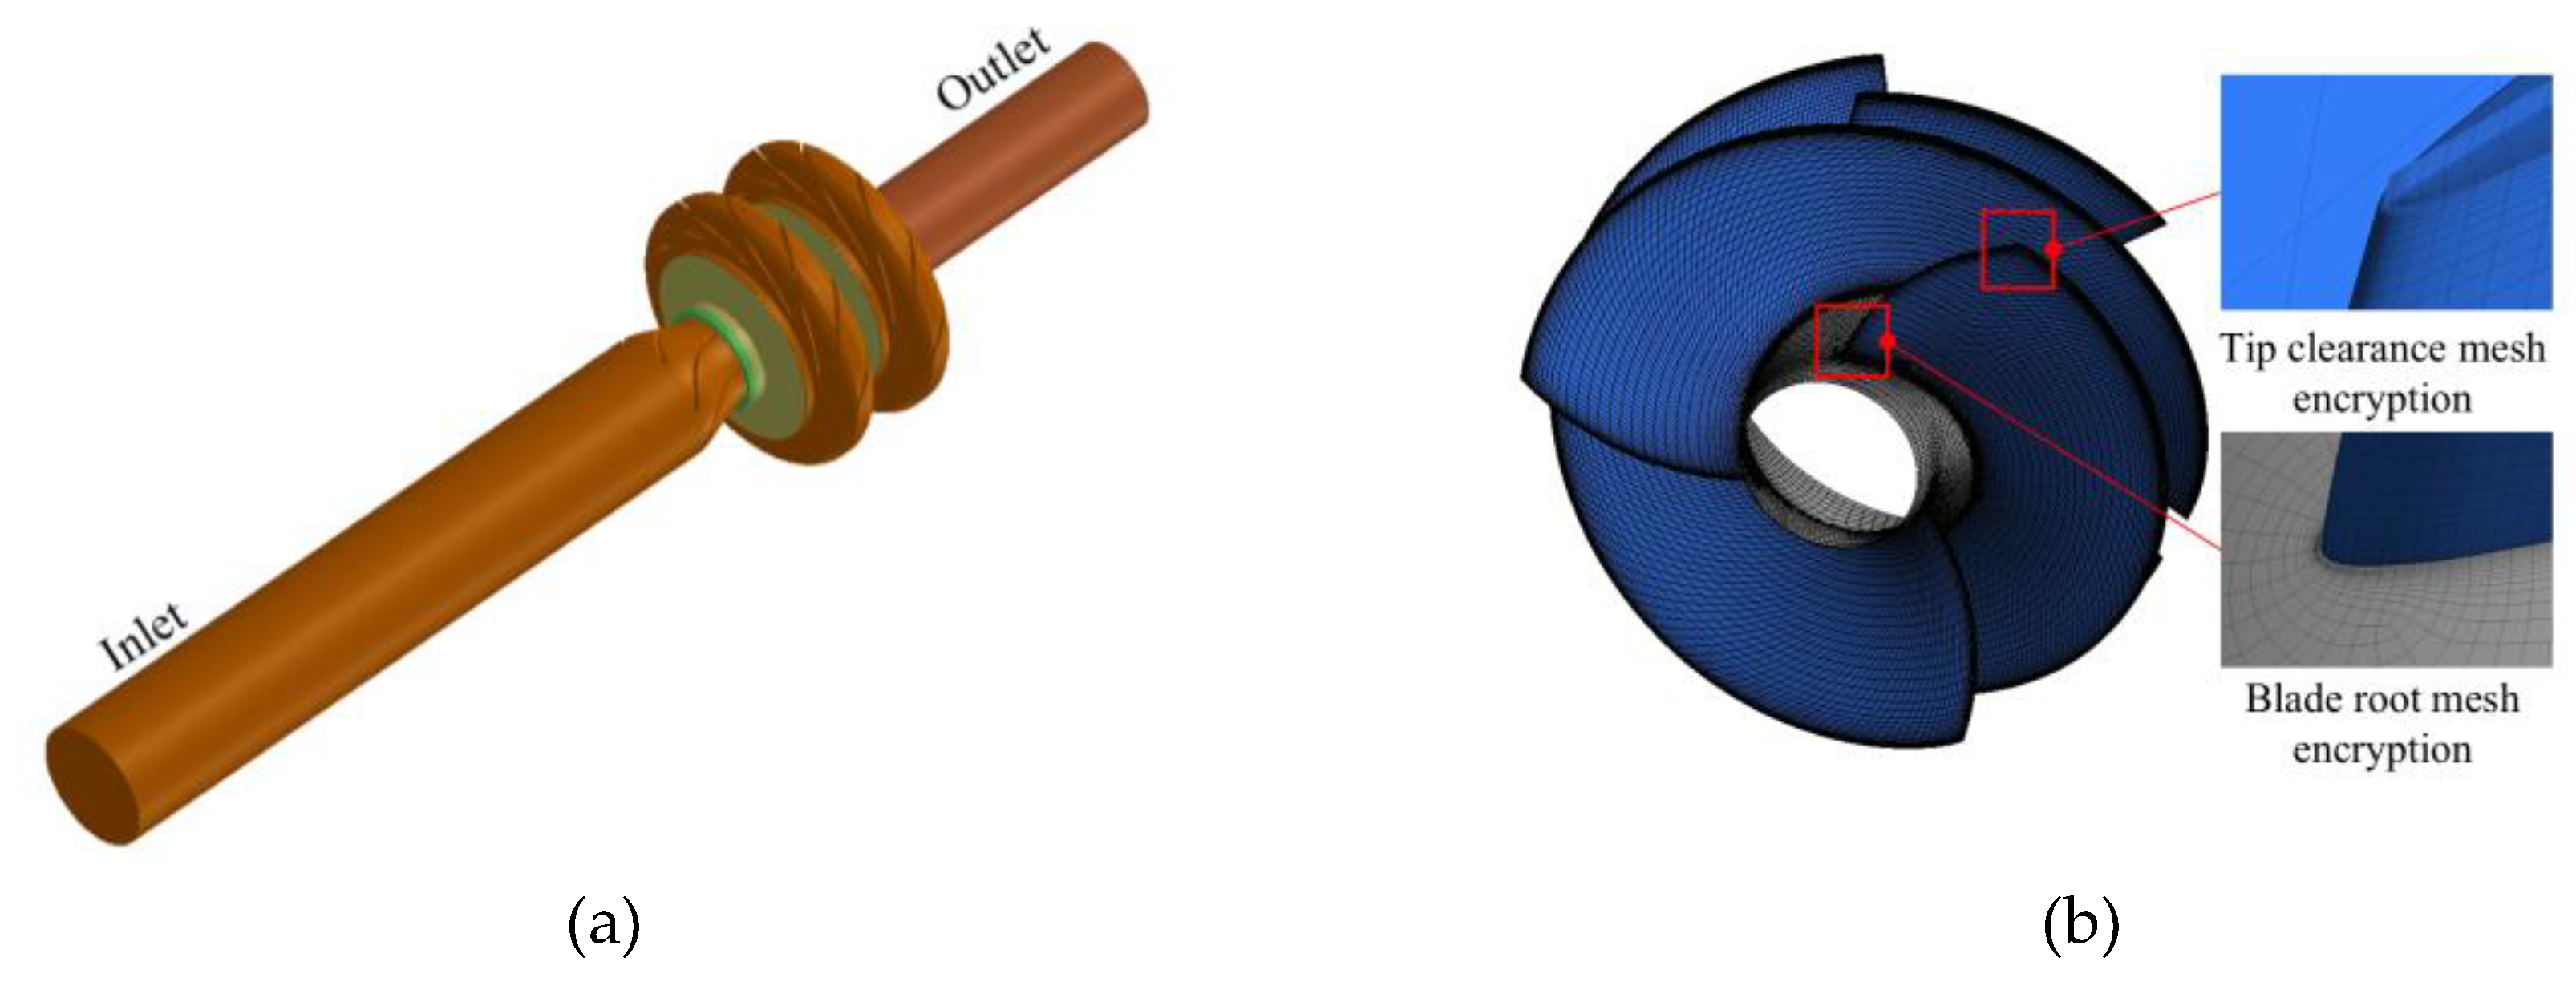
Figure 8.
Schematic diagram of the chord length coefficient.
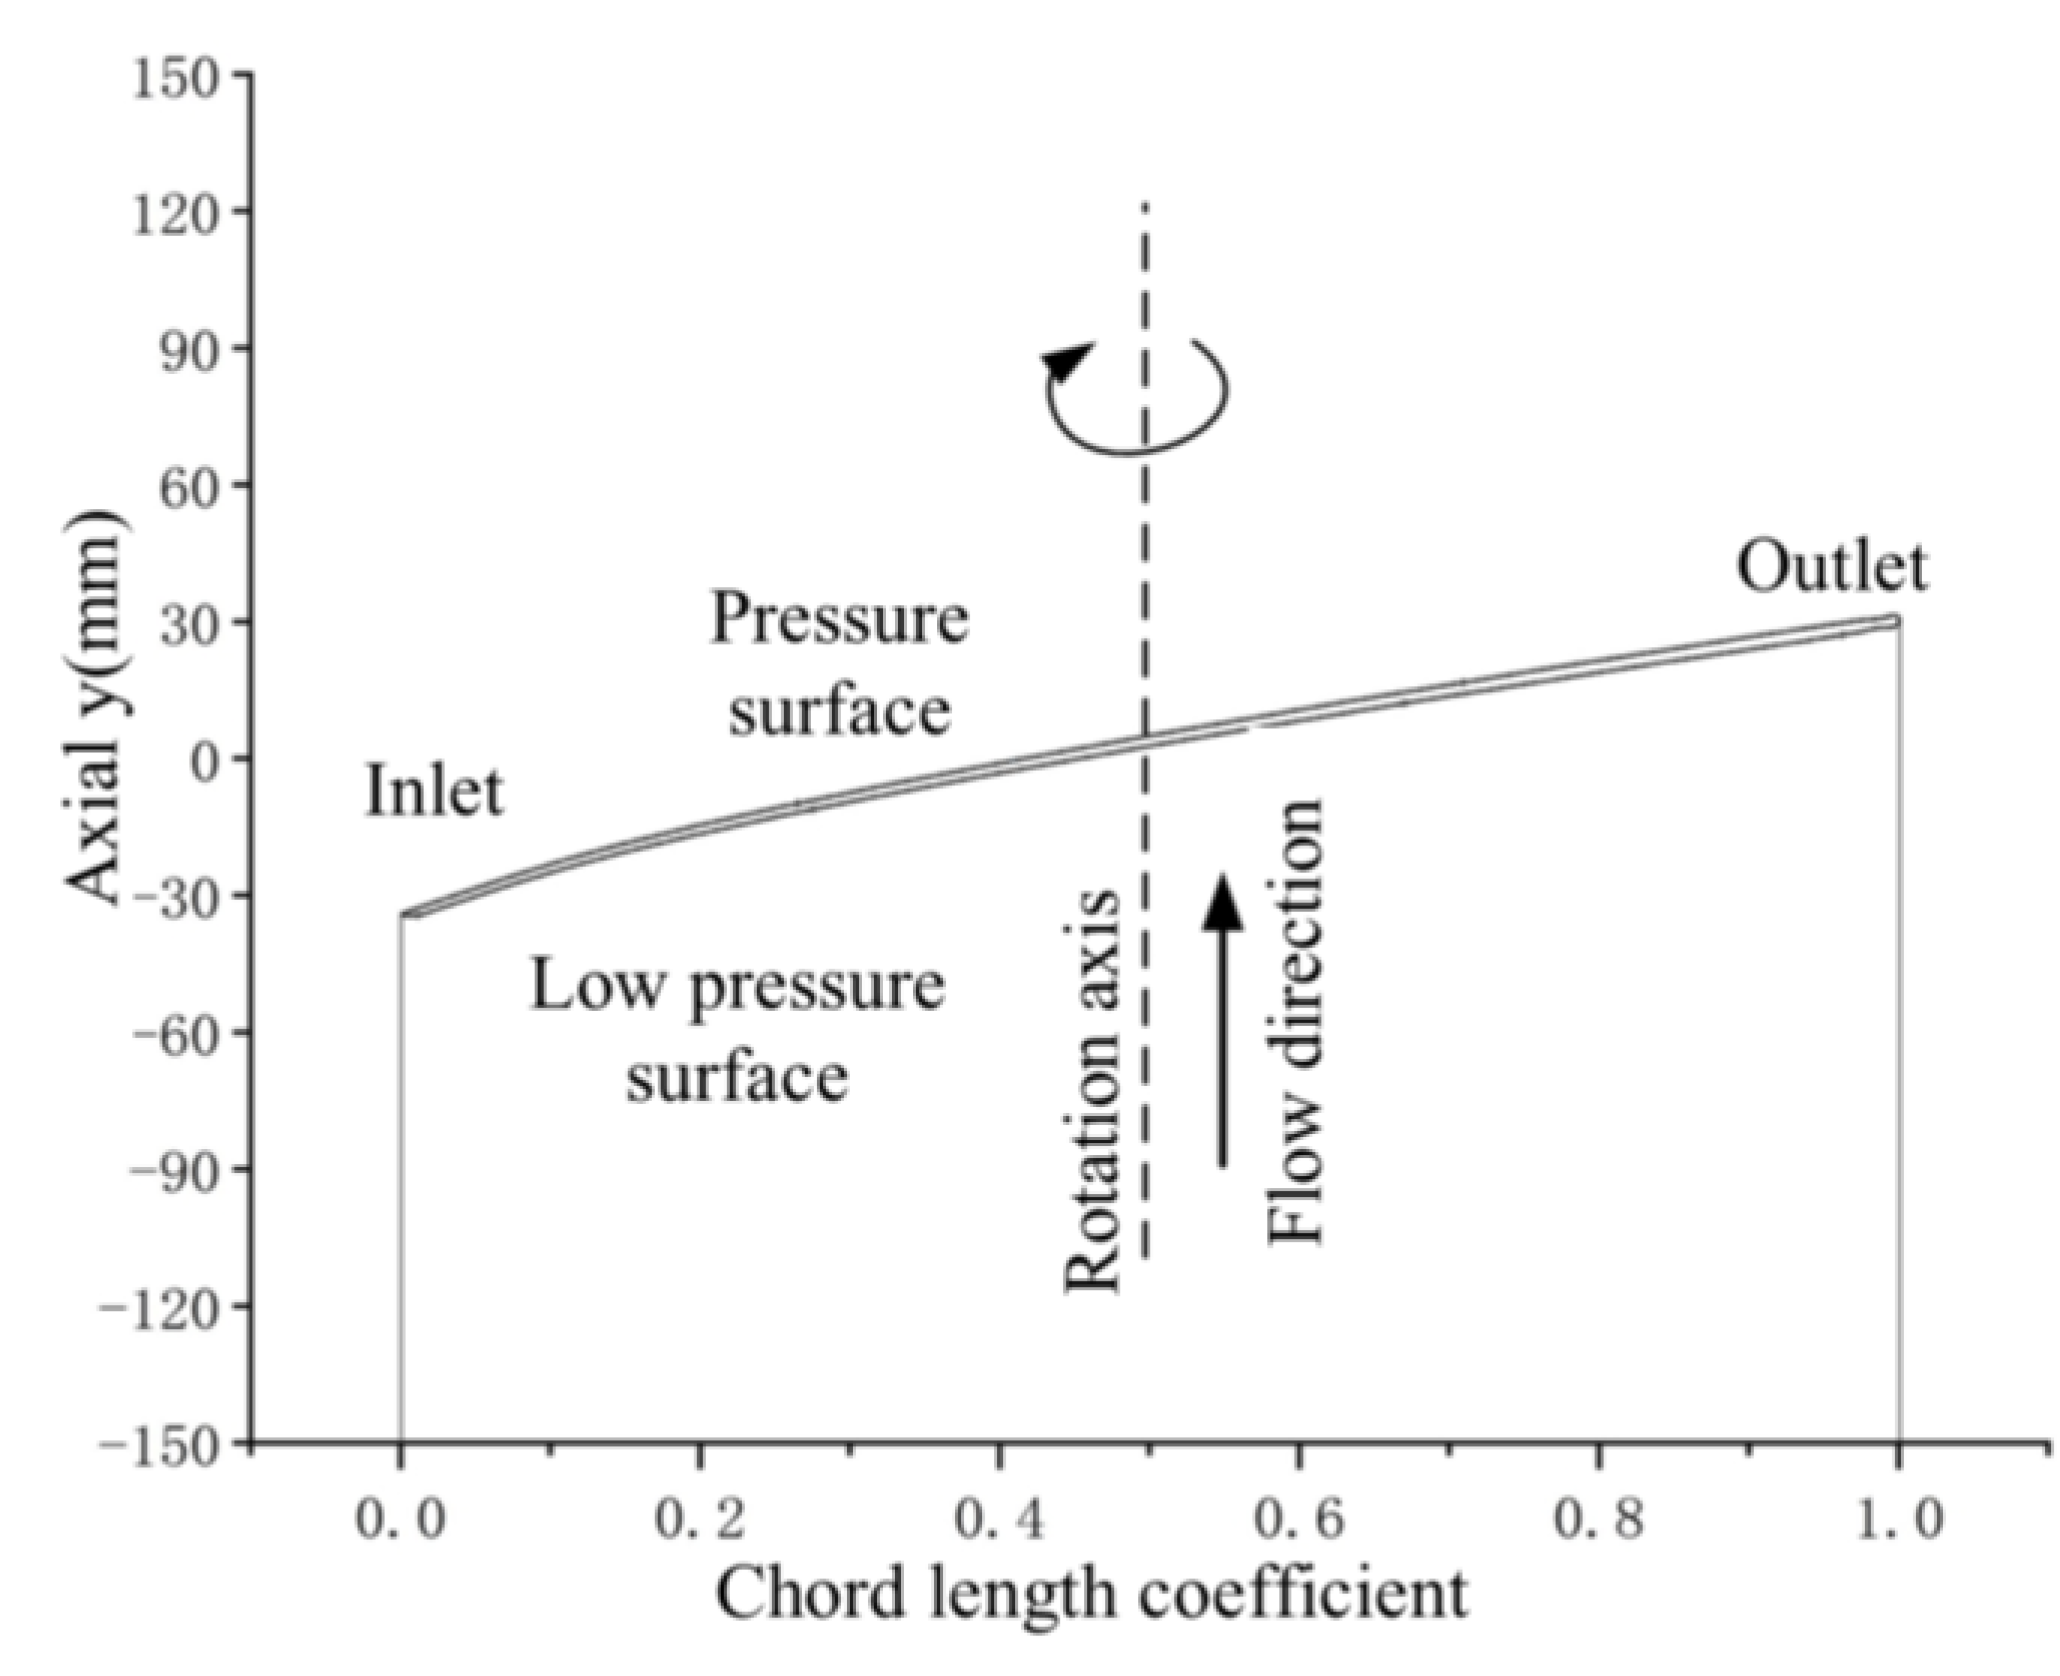
Figure 9.
Cavitation performance curves under different inducer tip clearances.
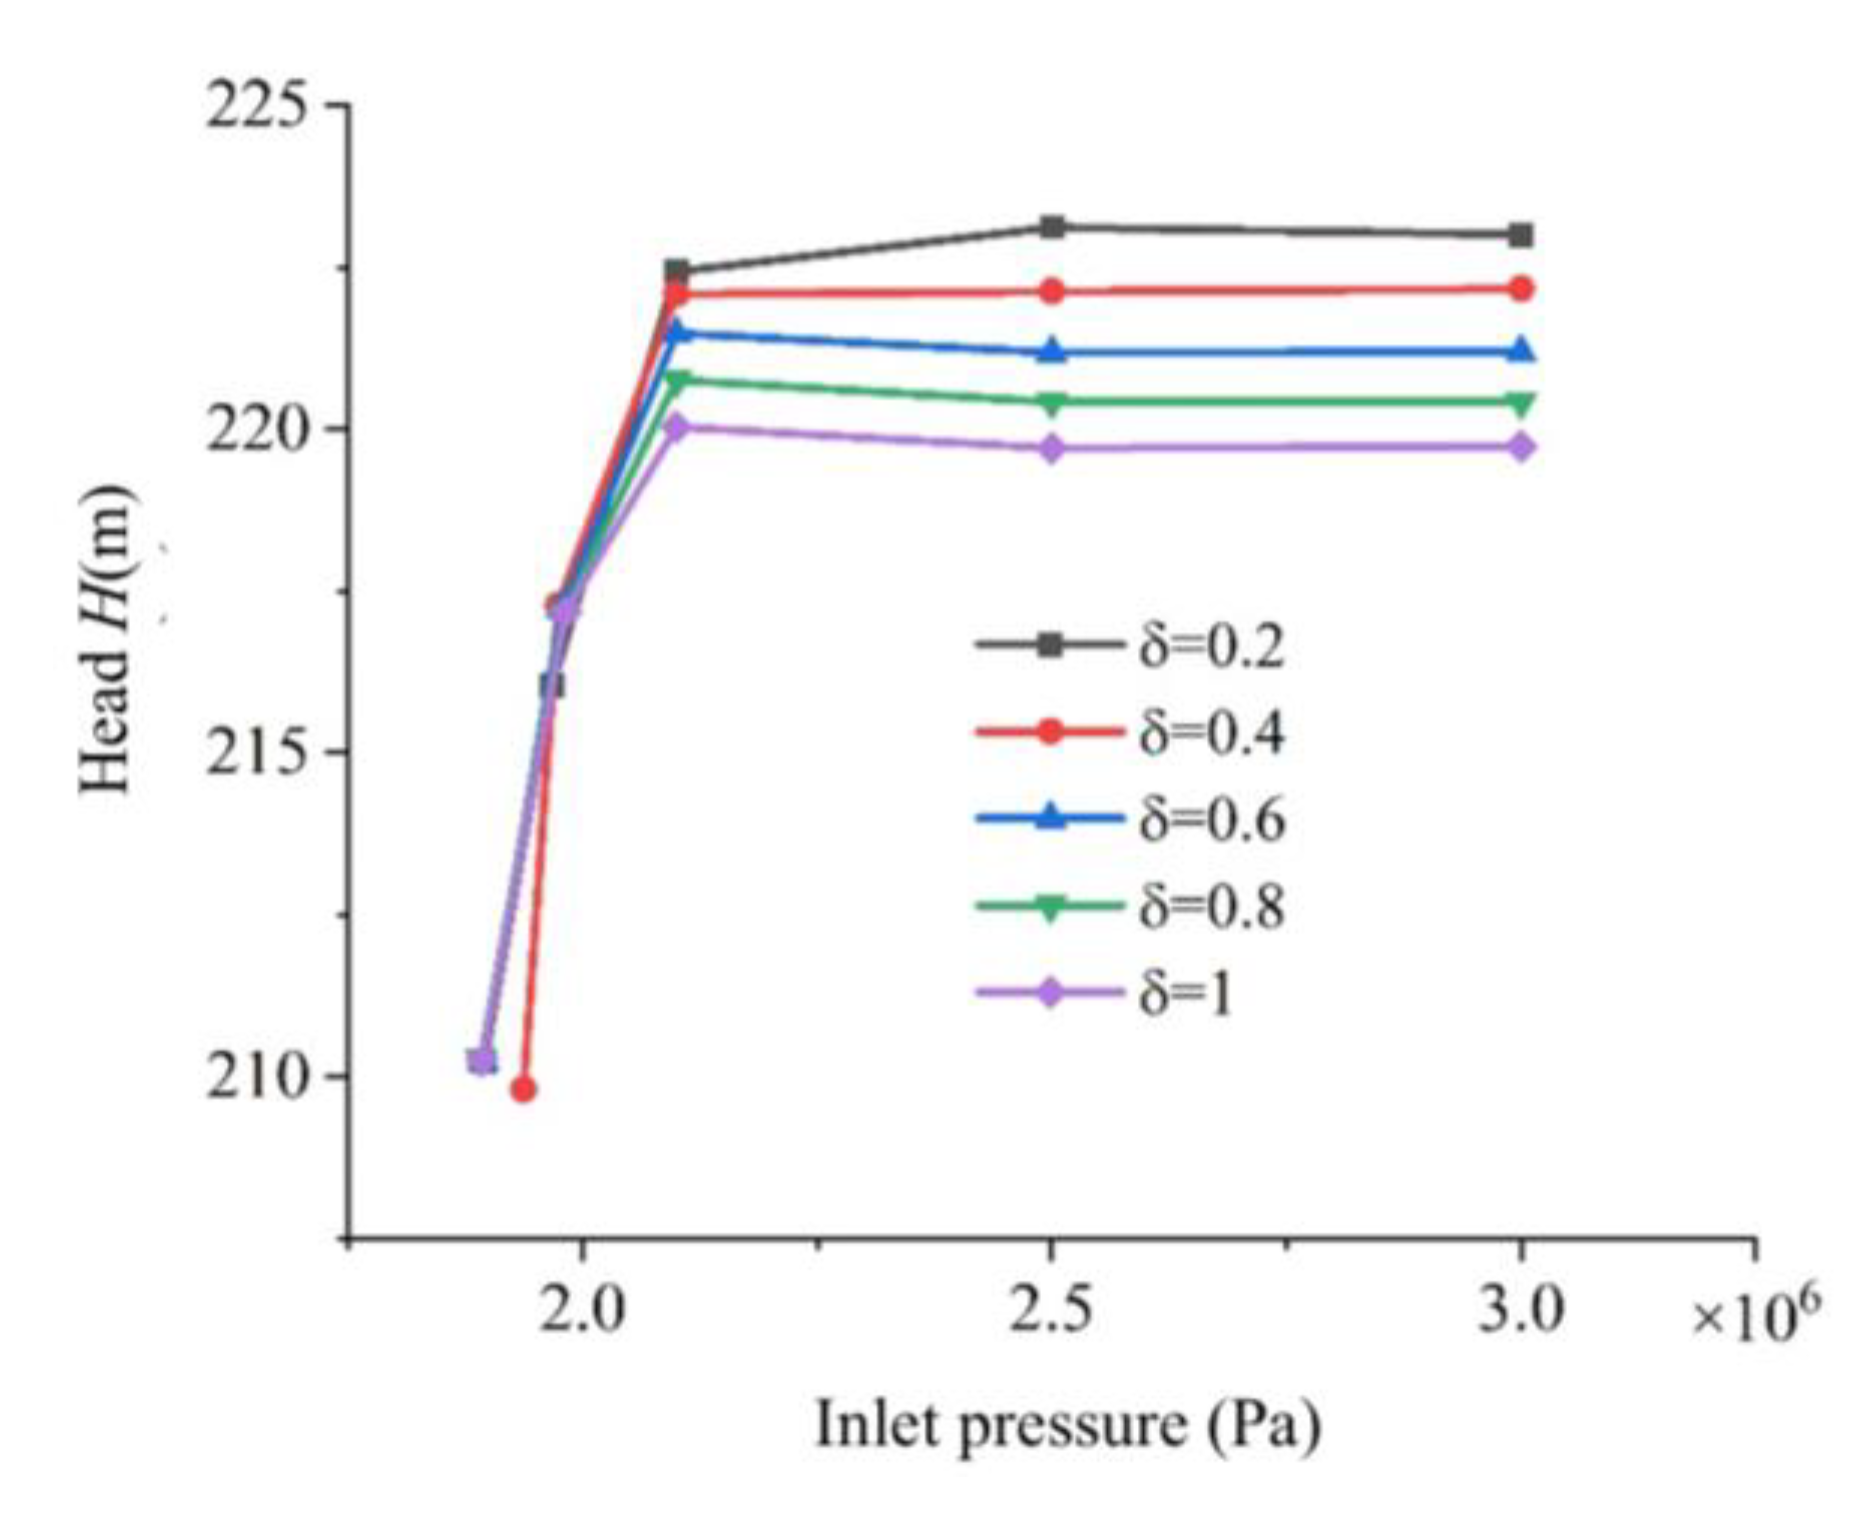
Figure 10.
Pump head under different tip clearances.
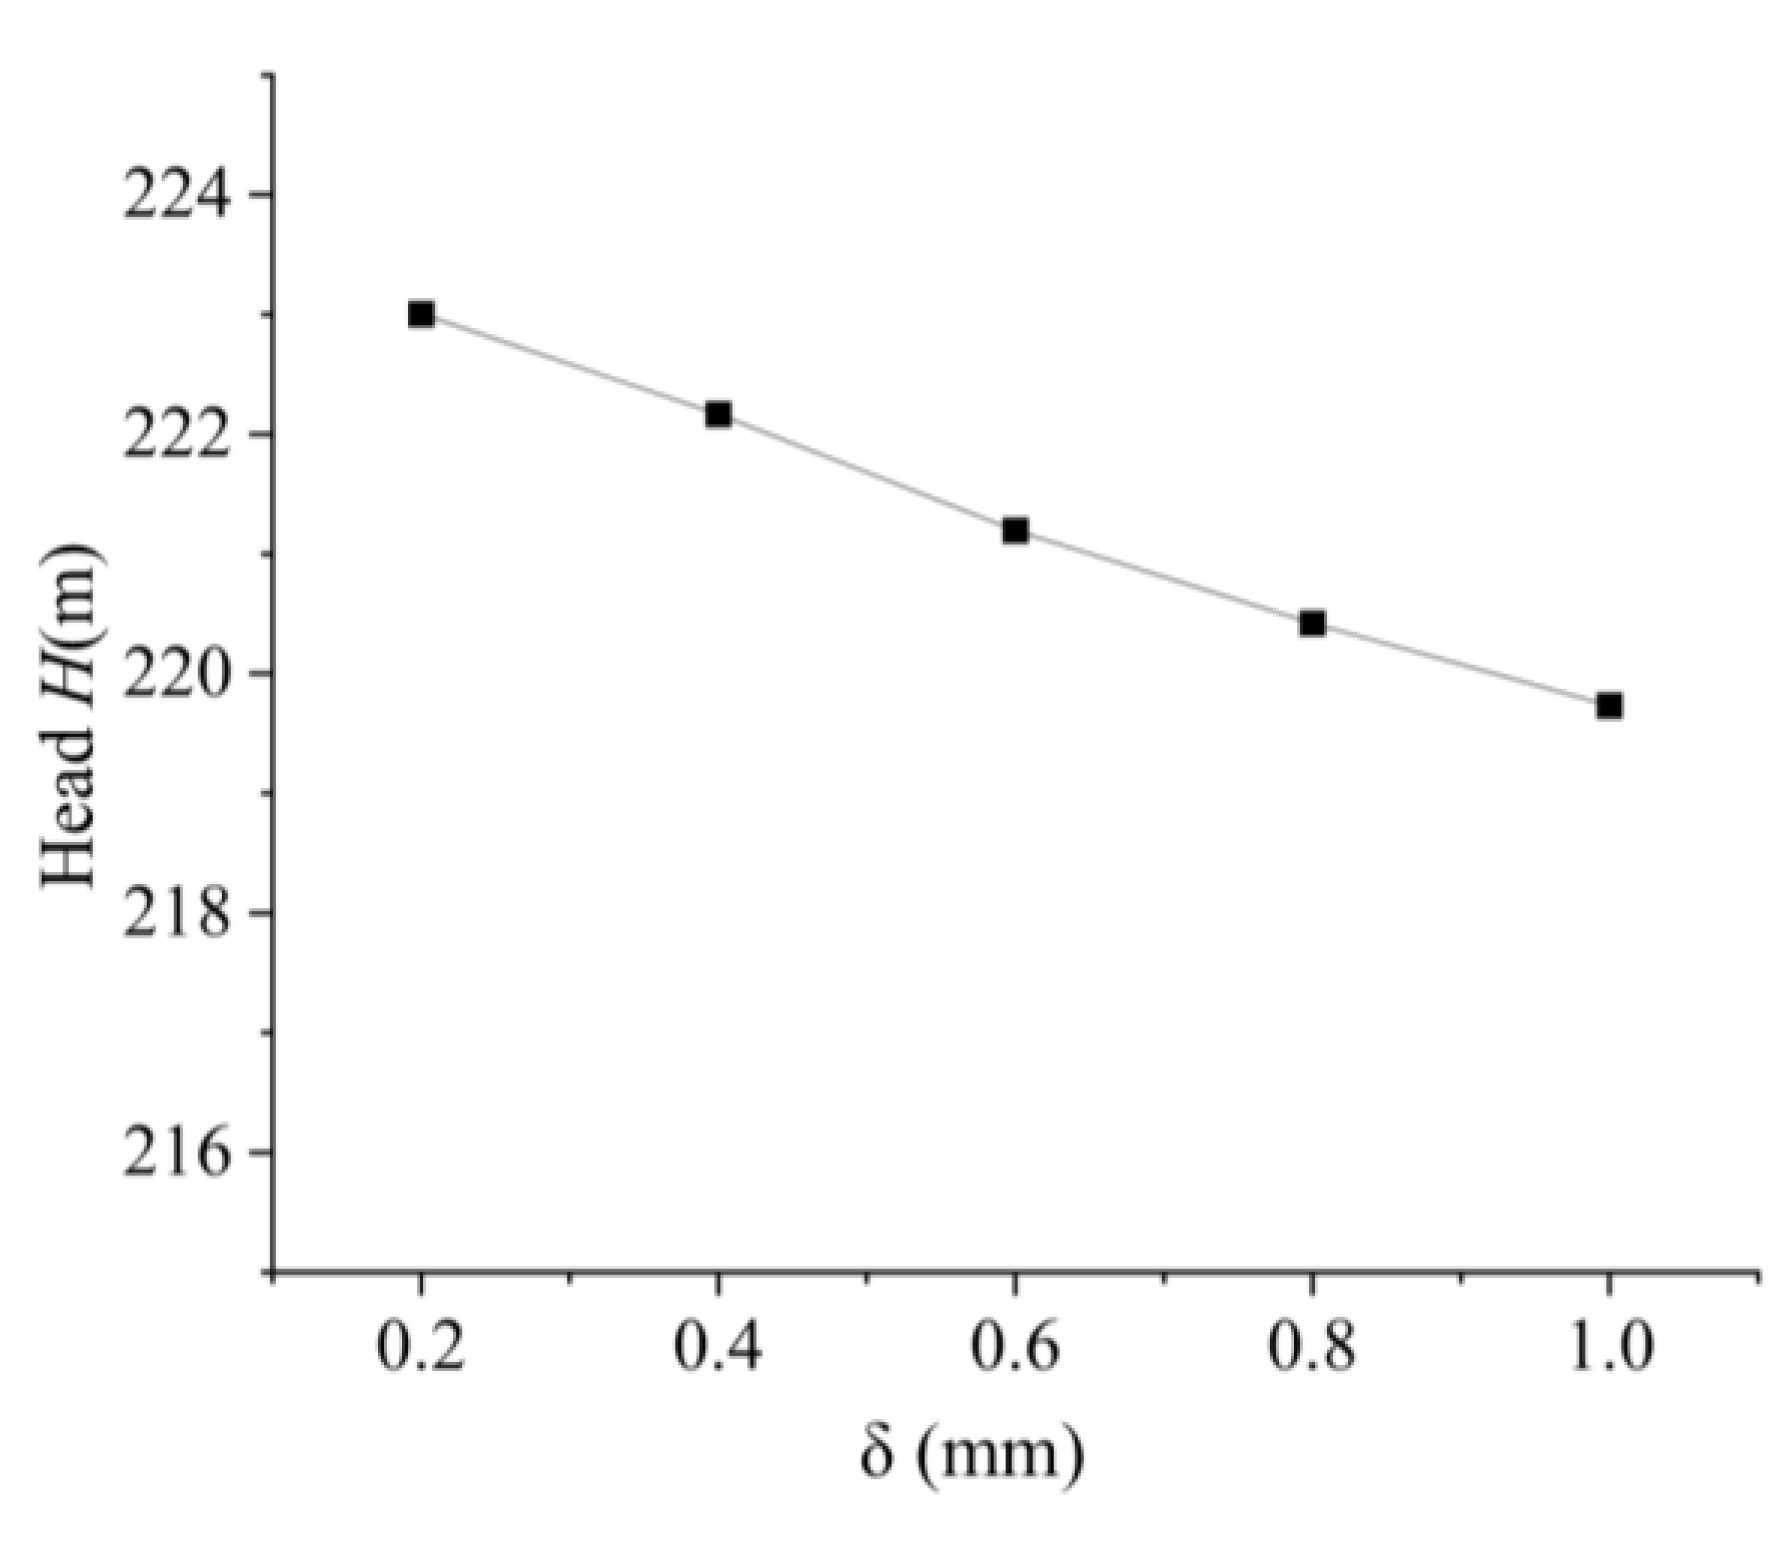
Figure 11.
Clearance leakage streamline diagram under different tip clearances.
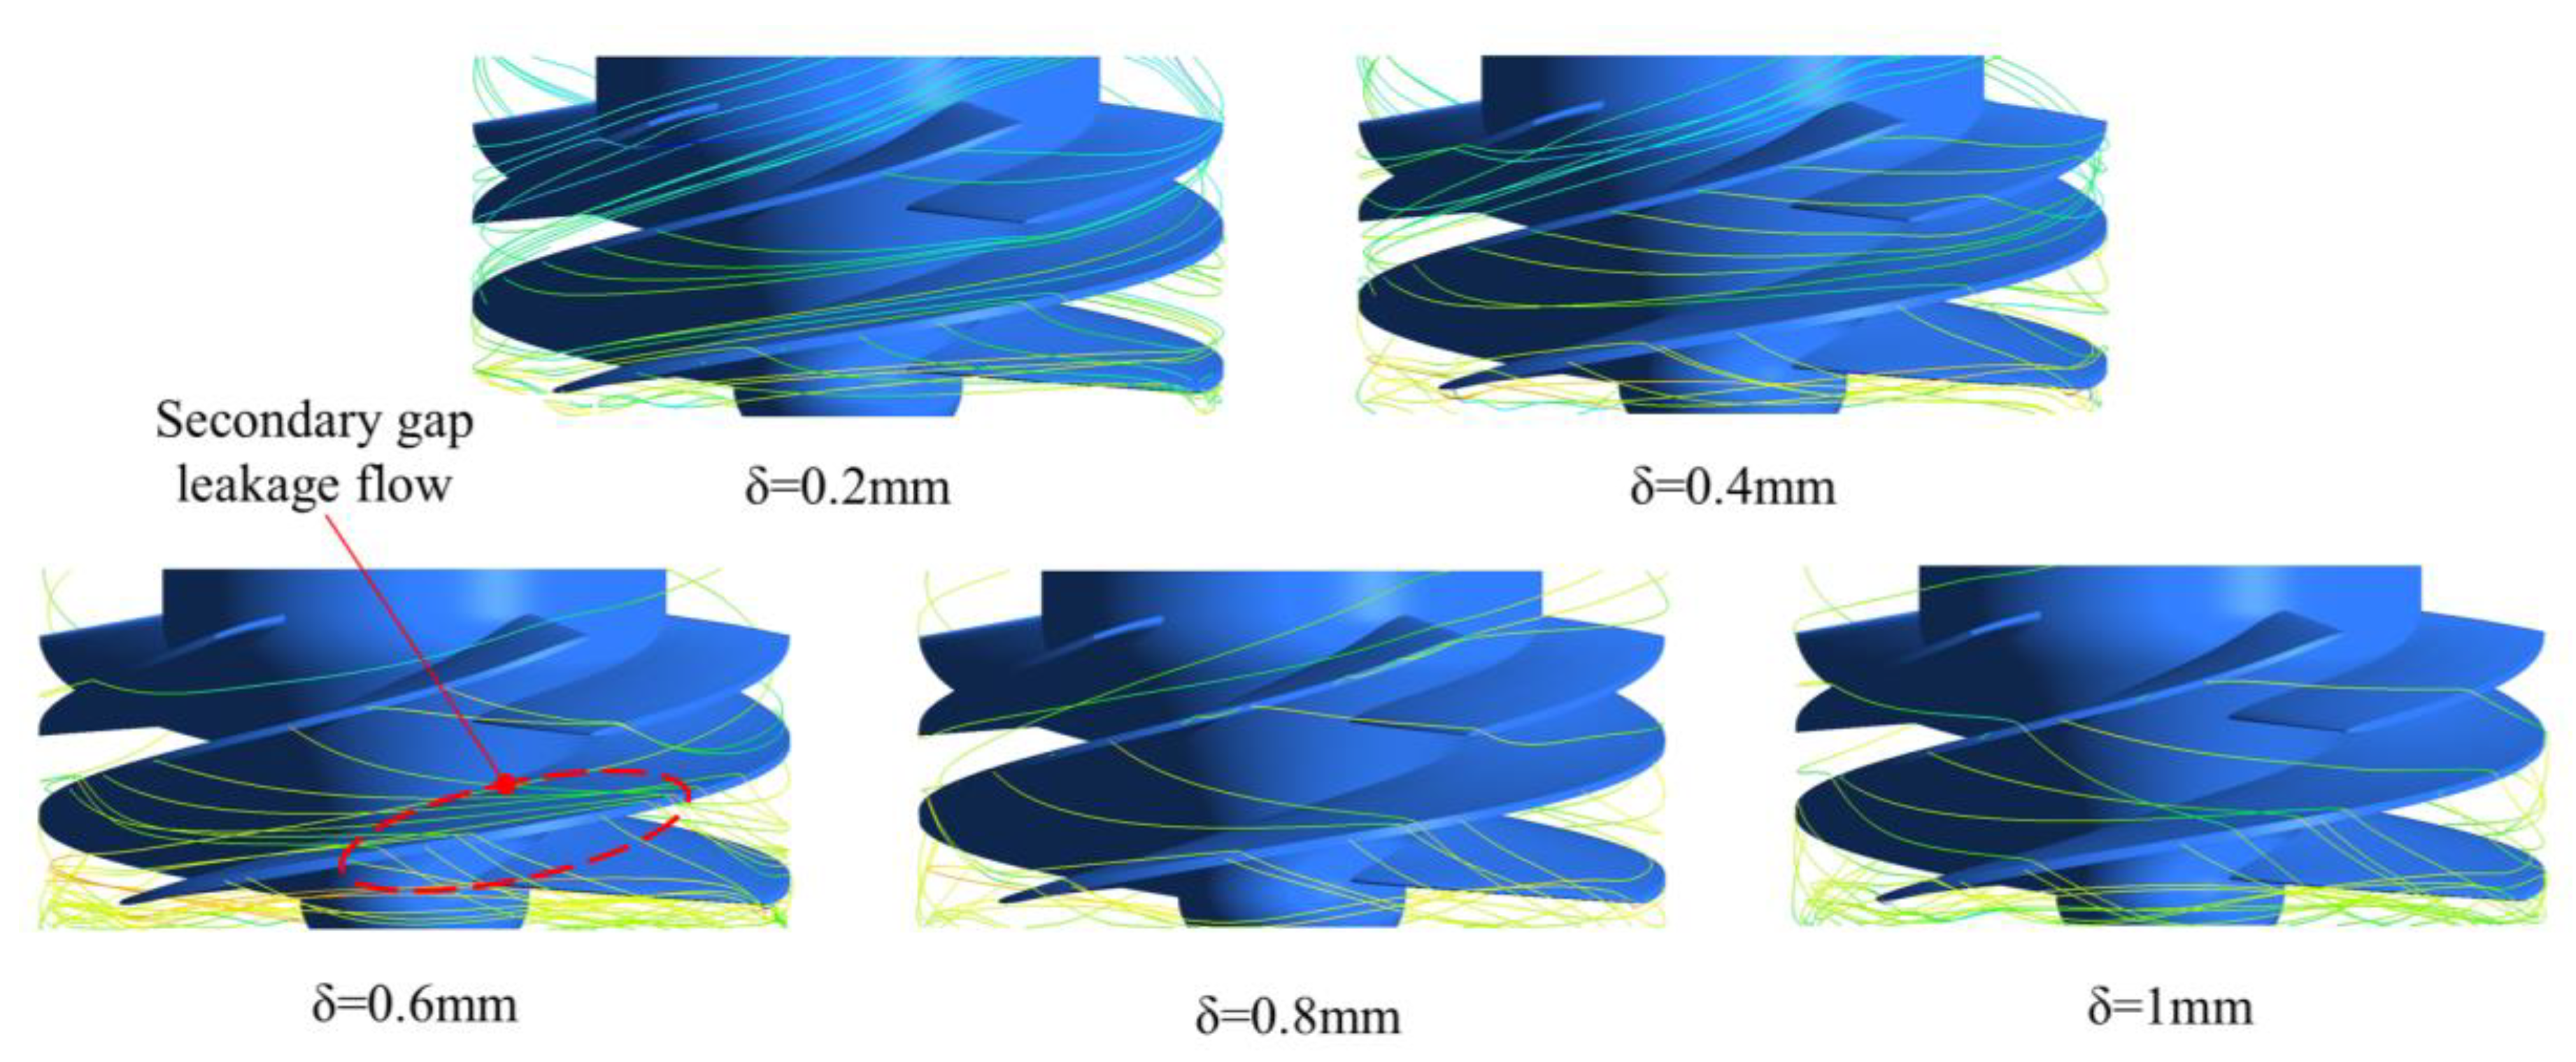
Figure 12.
Pump efficiency under different tip clearances.
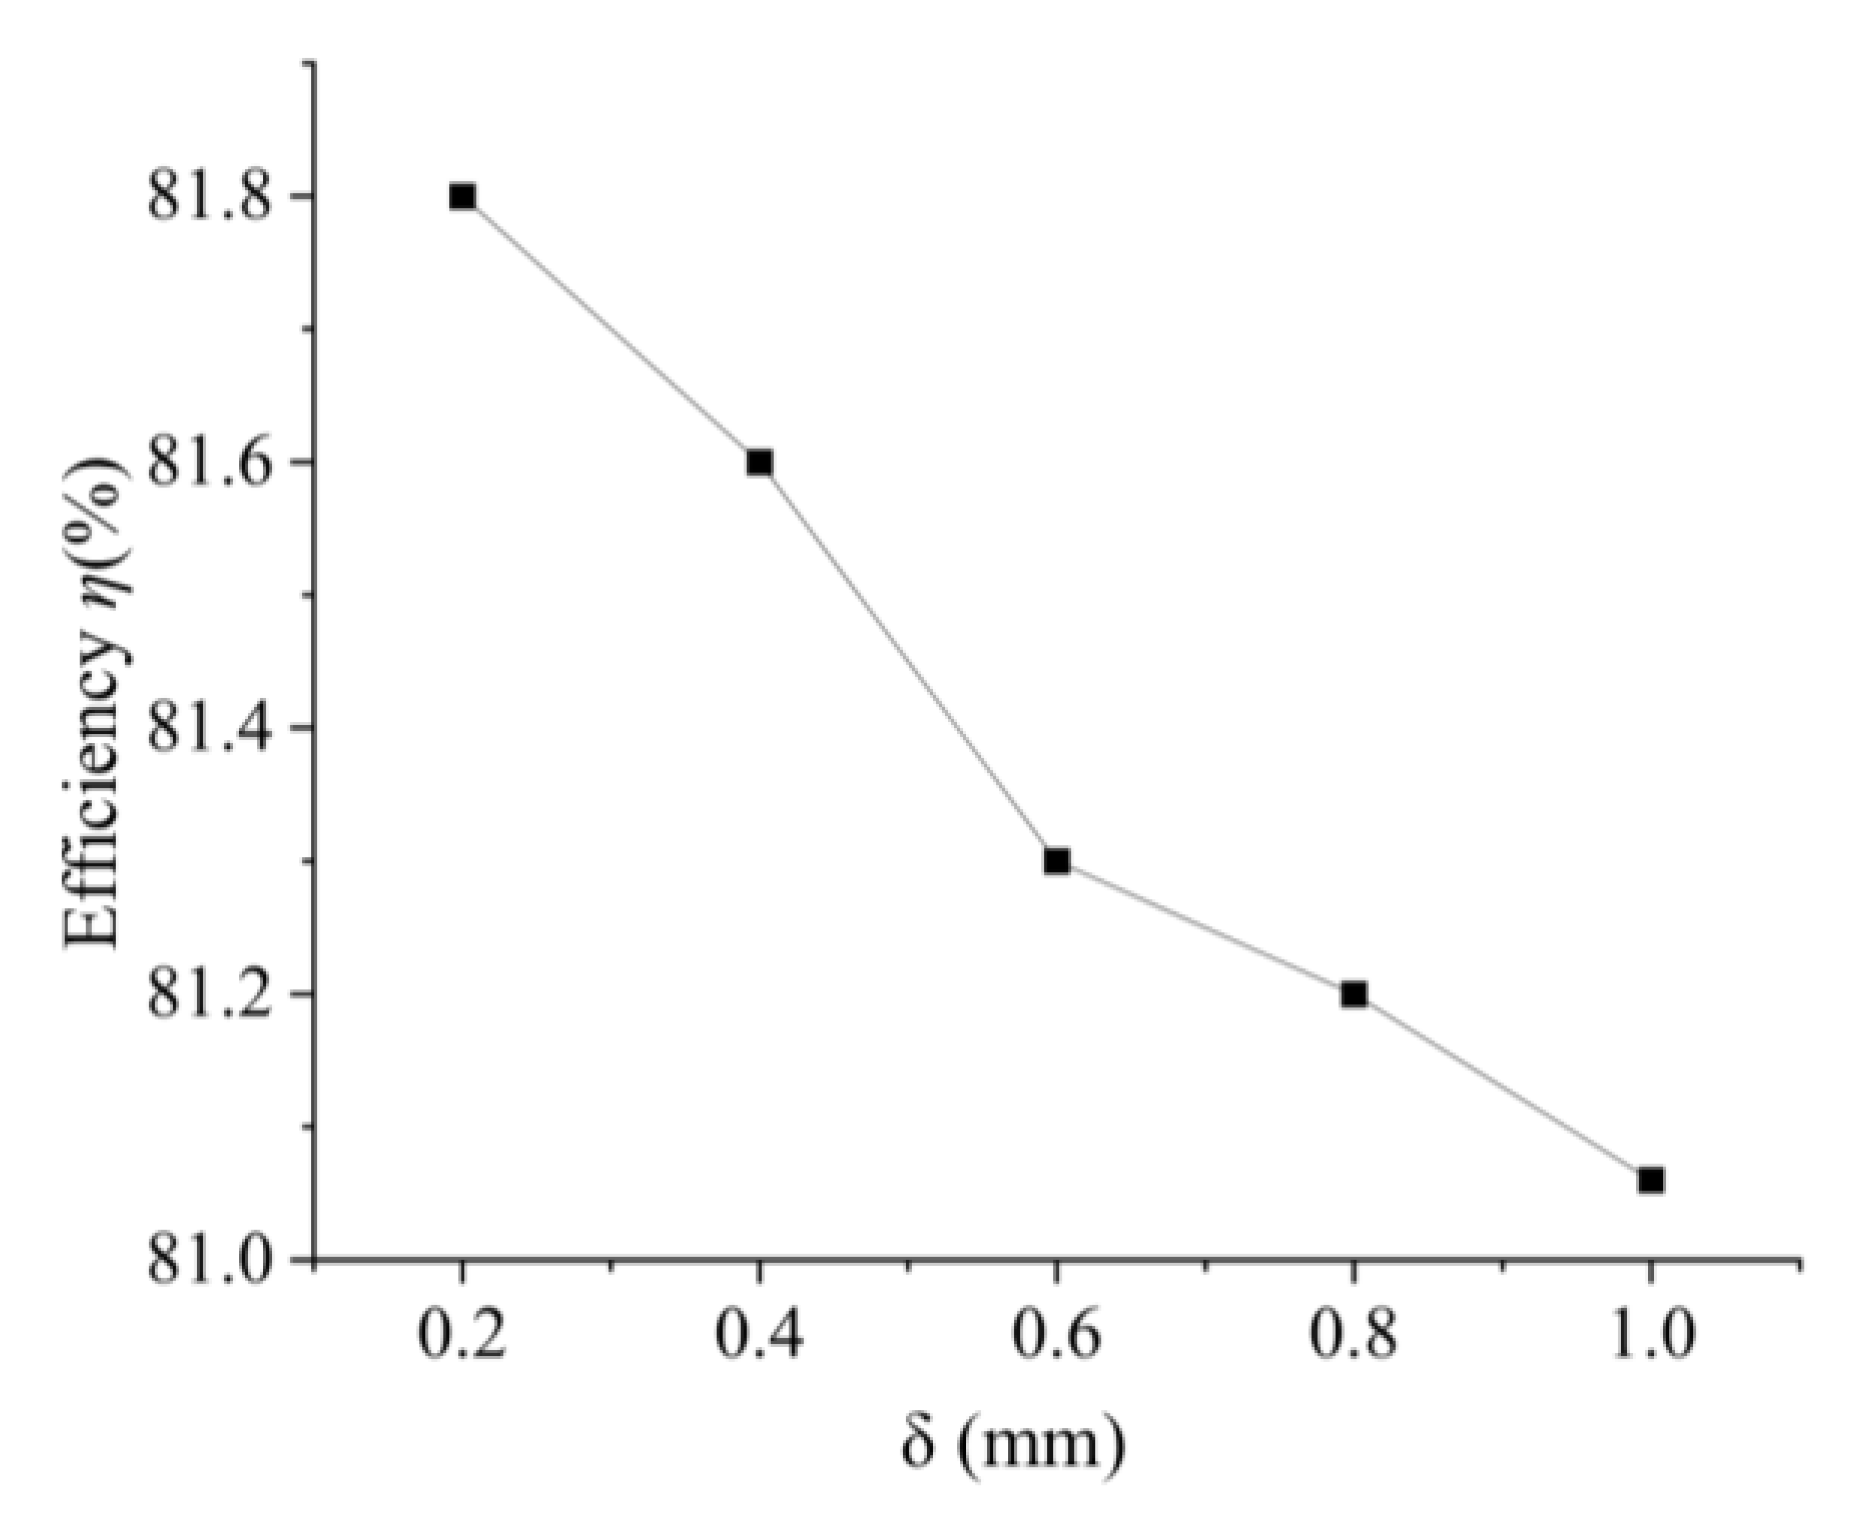
Figure 13.
Diagram of radial coefficients(0.1, 0.5, 0.9).
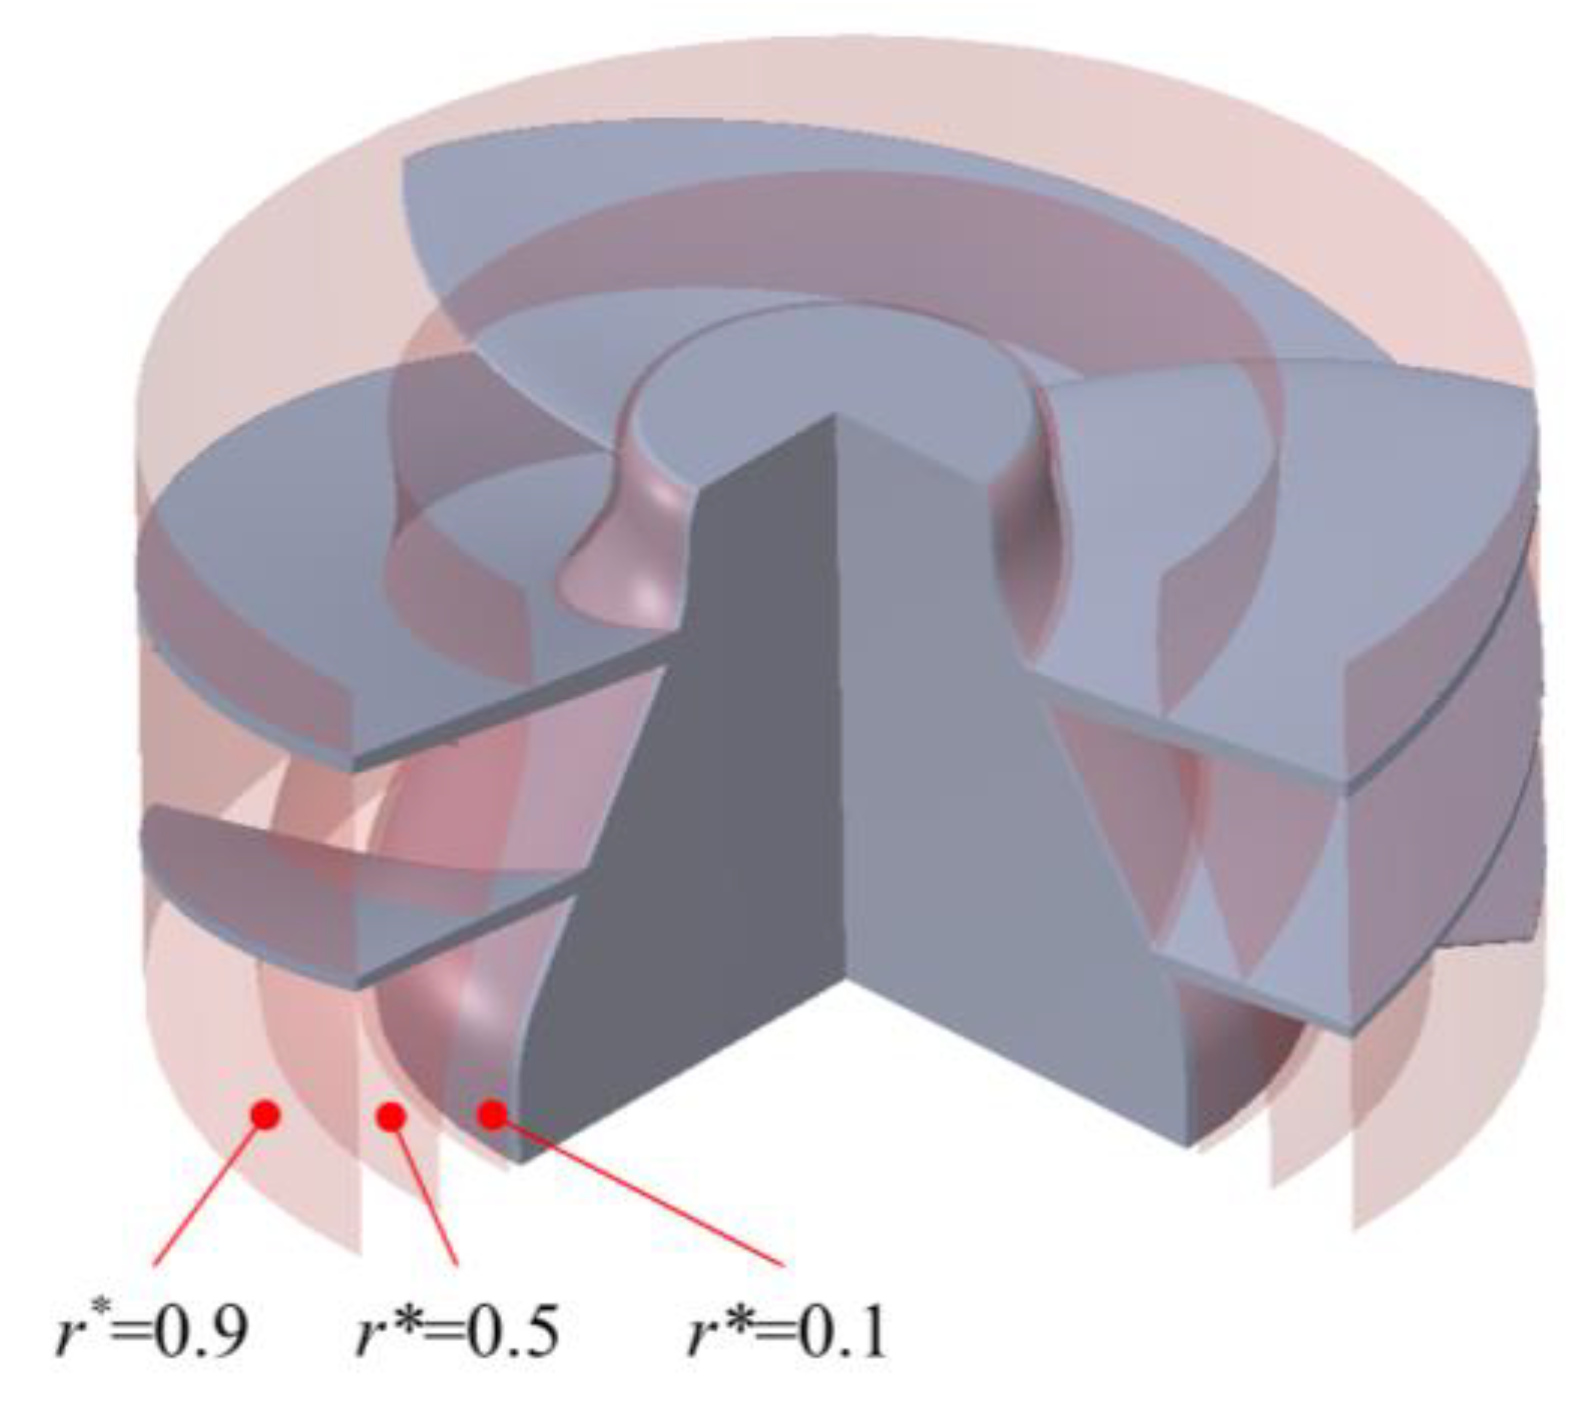
Figure 14.
Nephogram of pressure distribution in induced runner. (a) r*=0.1; (b) r*=0. 5; (c) r*=0. 9.
Figure 14.
Nephogram of pressure distribution in induced runner. (a) r*=0.1; (b) r*=0. 5; (c) r*=0. 9.
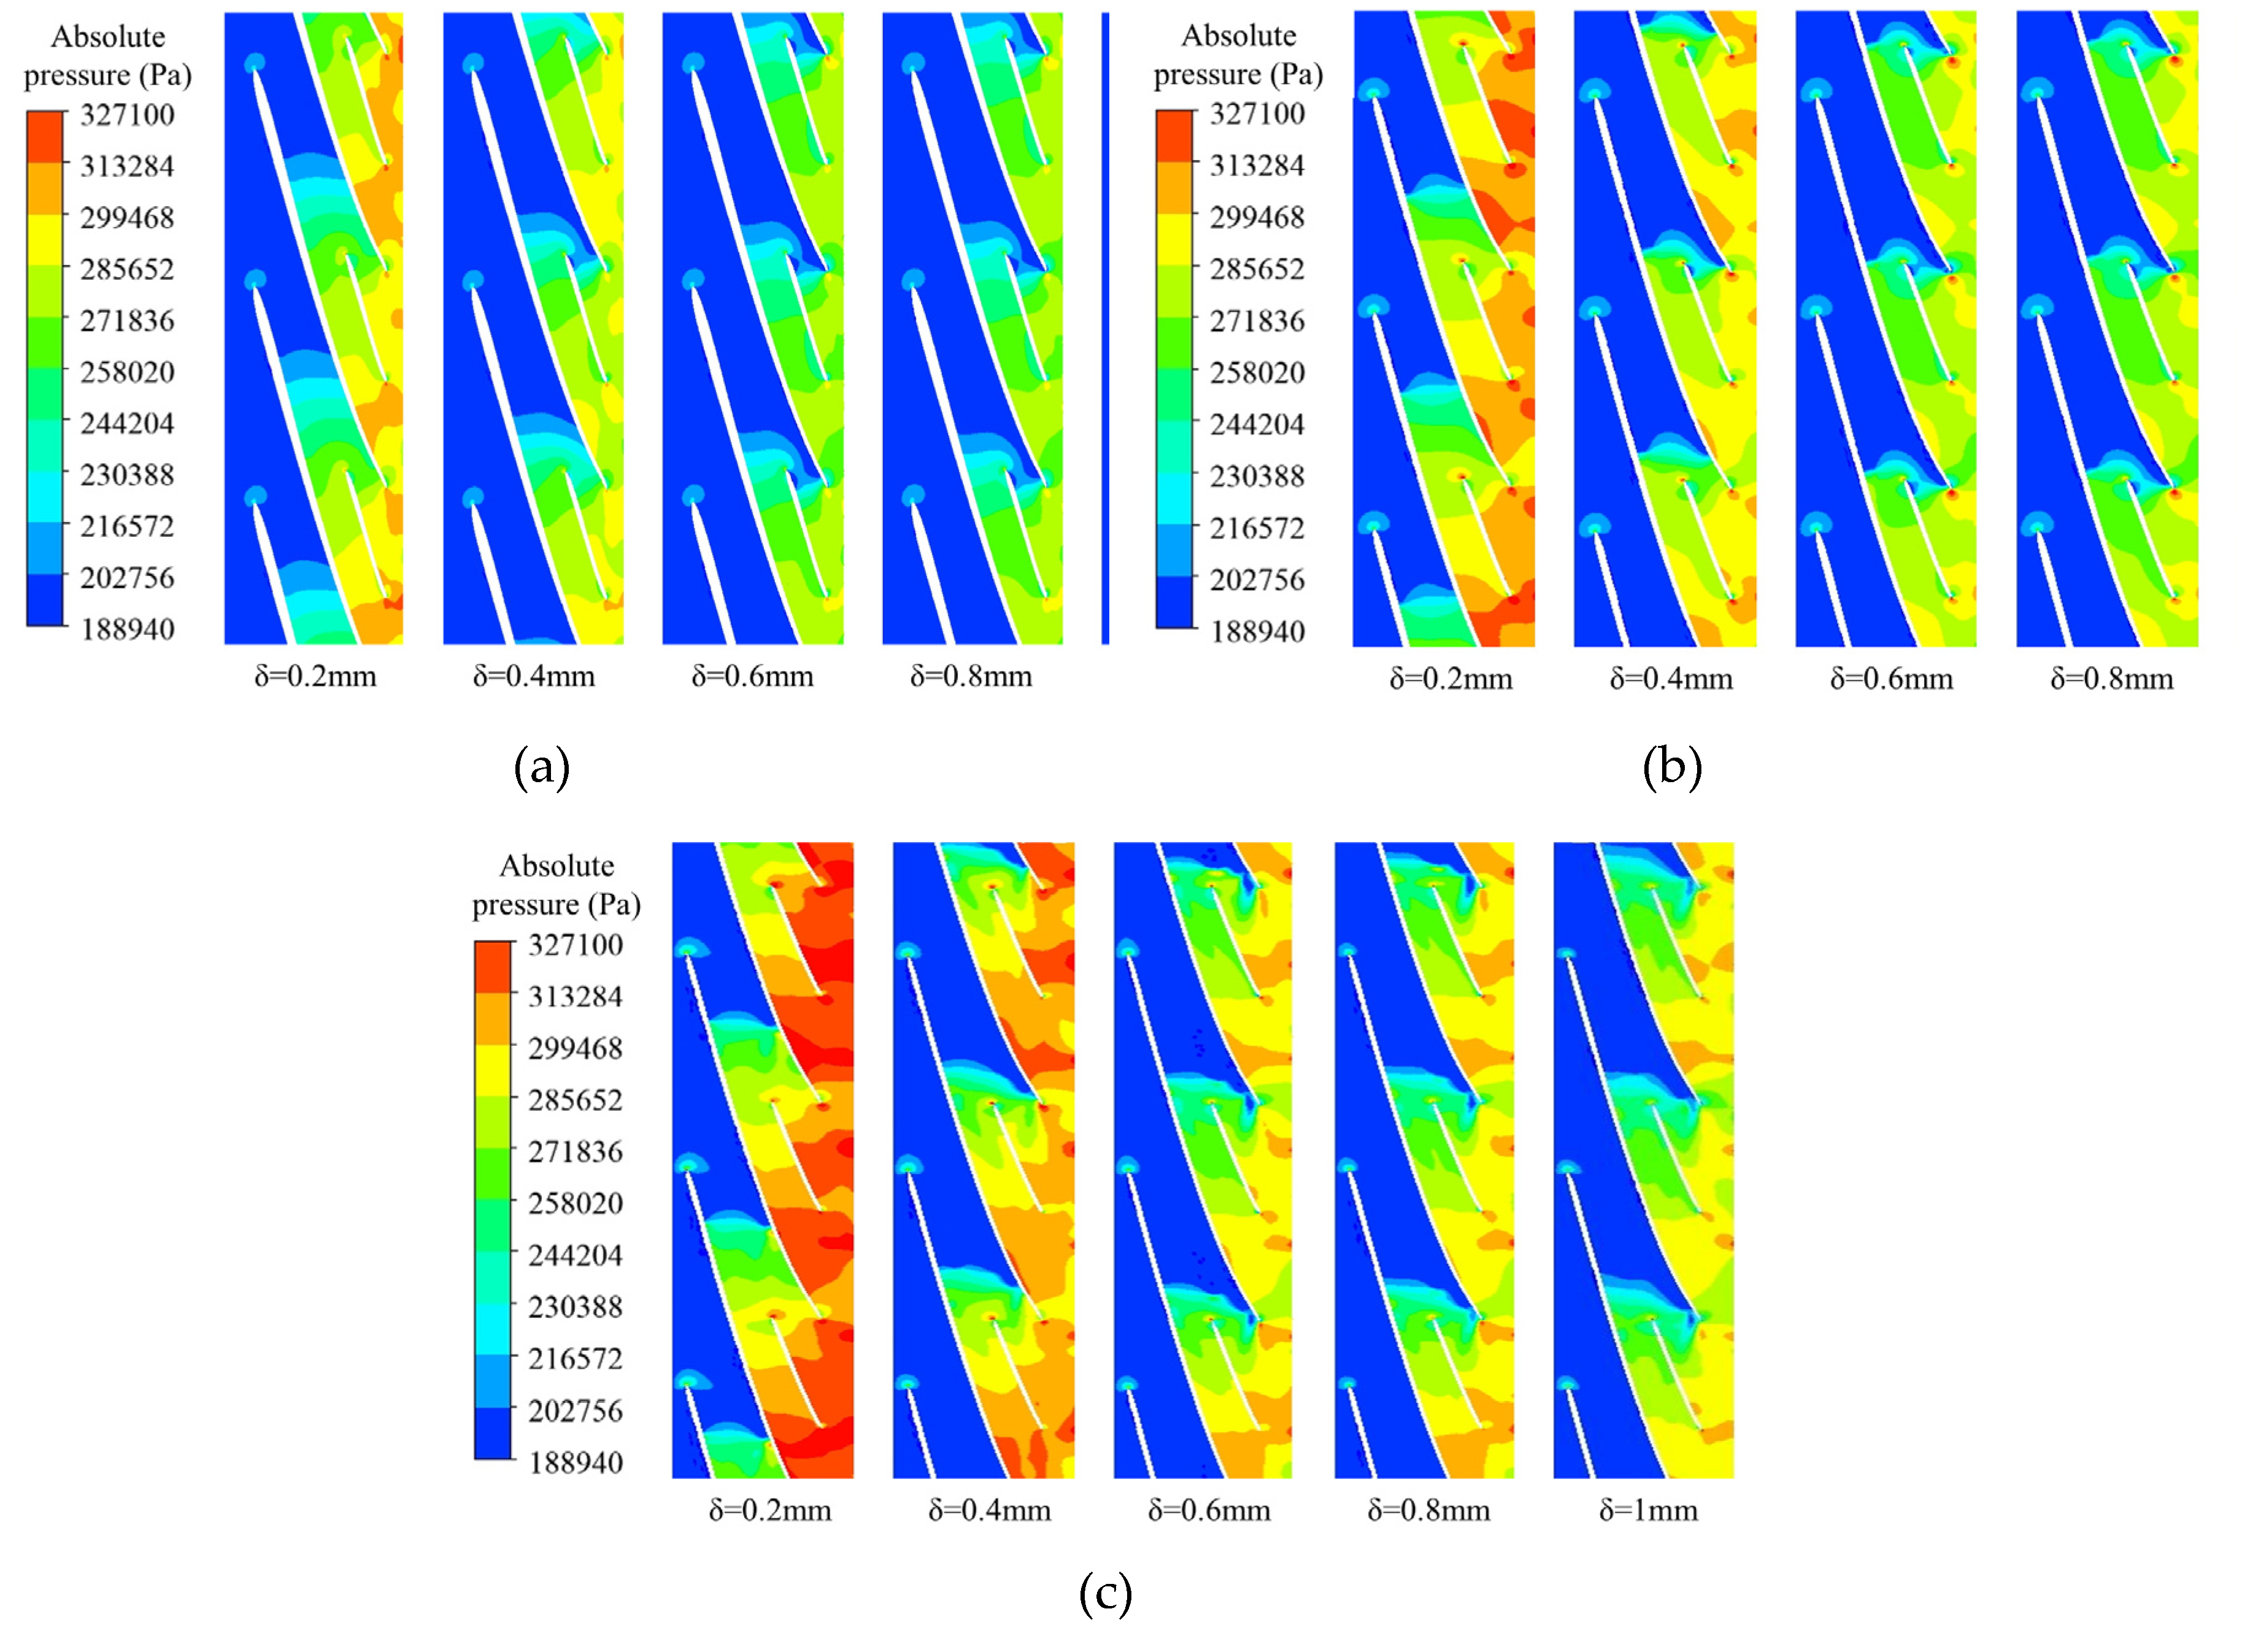
Figure 15.
Cavitation volume distribution in flow channel. If there are multiple panels, they should be listed as: (a) Bubble distribution of each flow component; (b) Bubble distribution of inducer.
Figure 15.
Cavitation volume distribution in flow channel. If there are multiple panels, they should be listed as: (a) Bubble distribution of each flow component; (b) Bubble distribution of inducer.
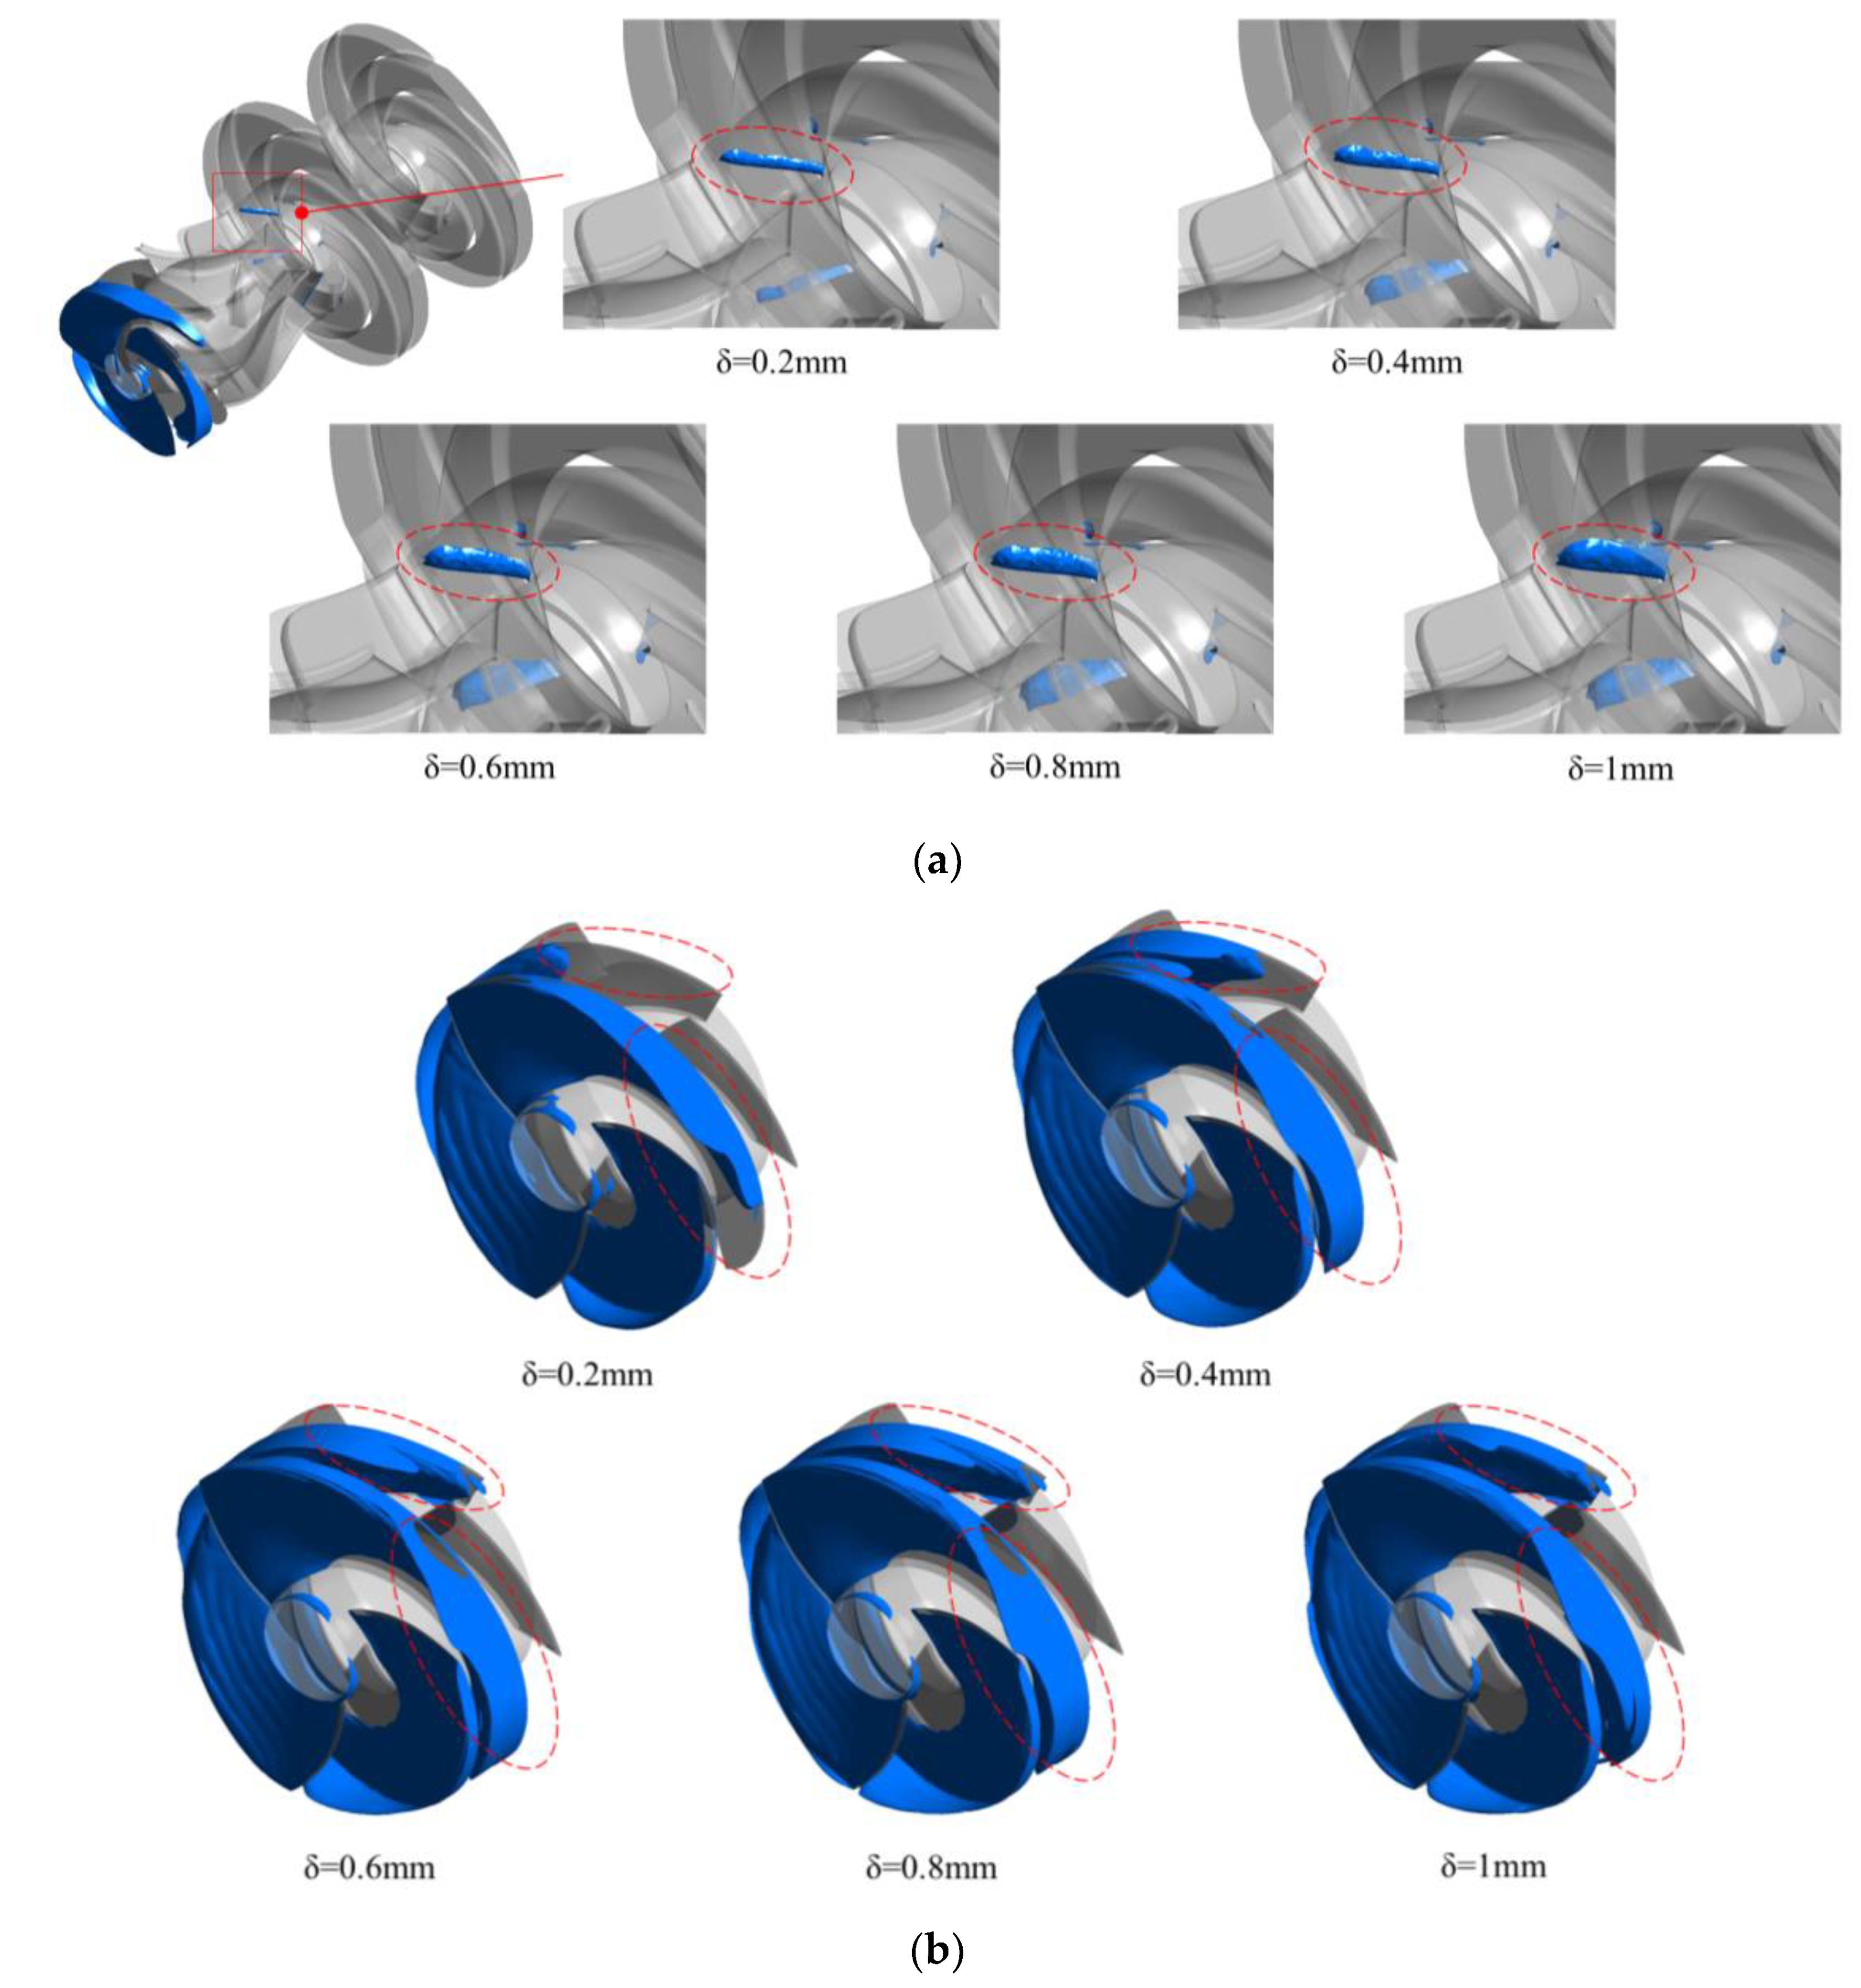
Figure 16.
Gap leakage flow rate of different gaps.
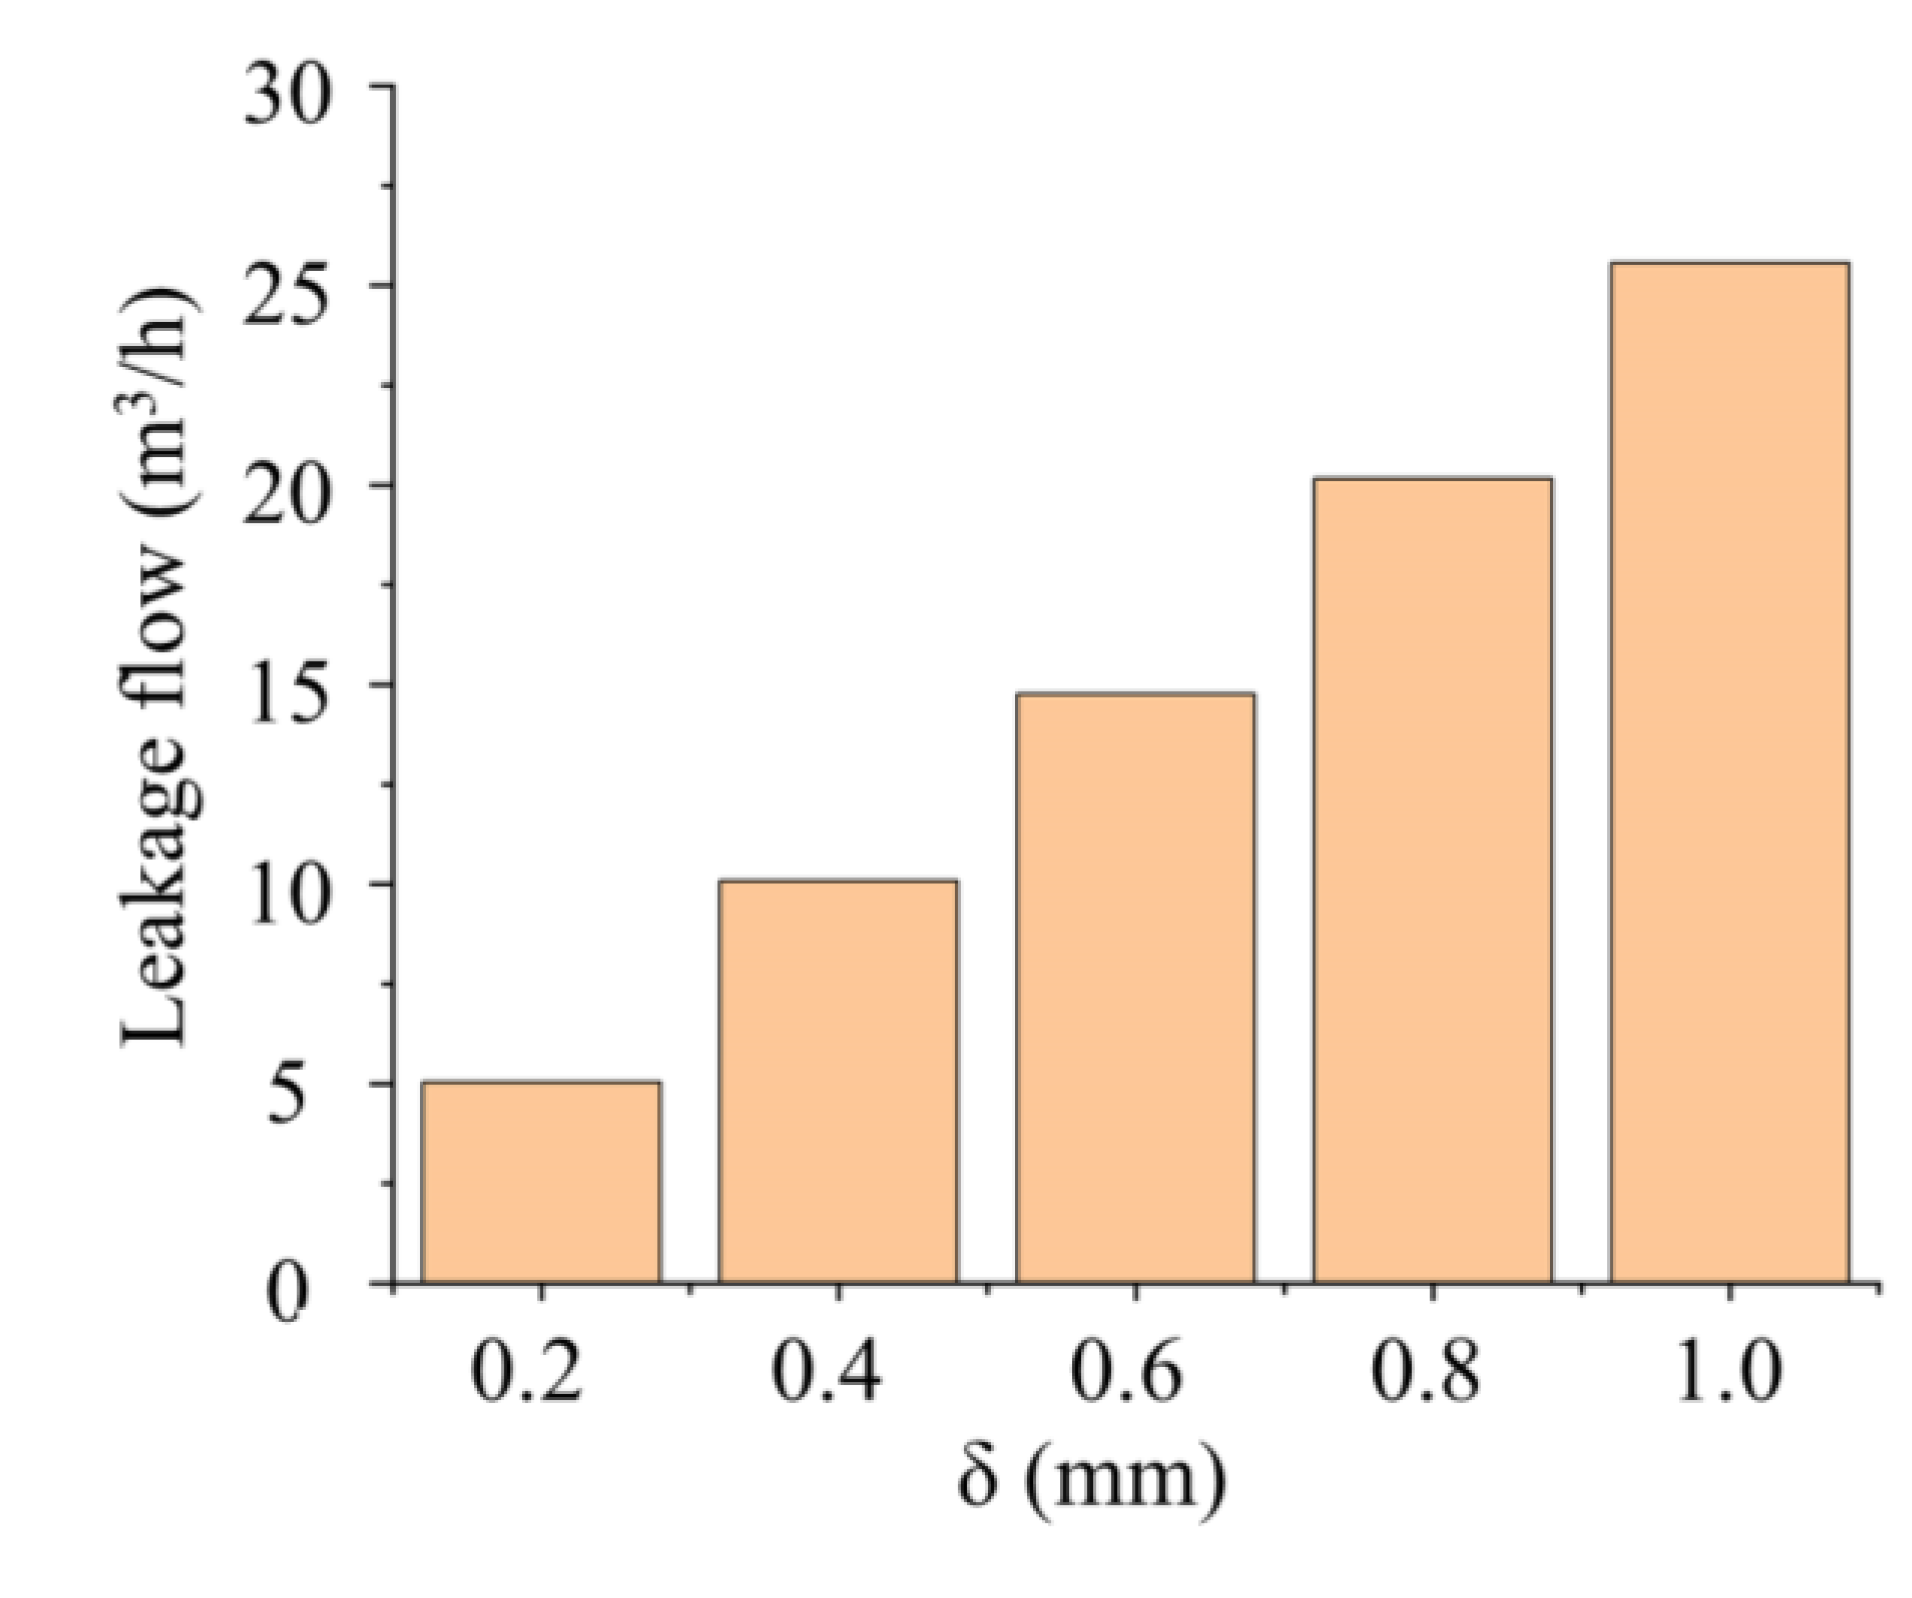
Figure 17.
Clearance leakage streamlines on the lower plane of different tip clearances.
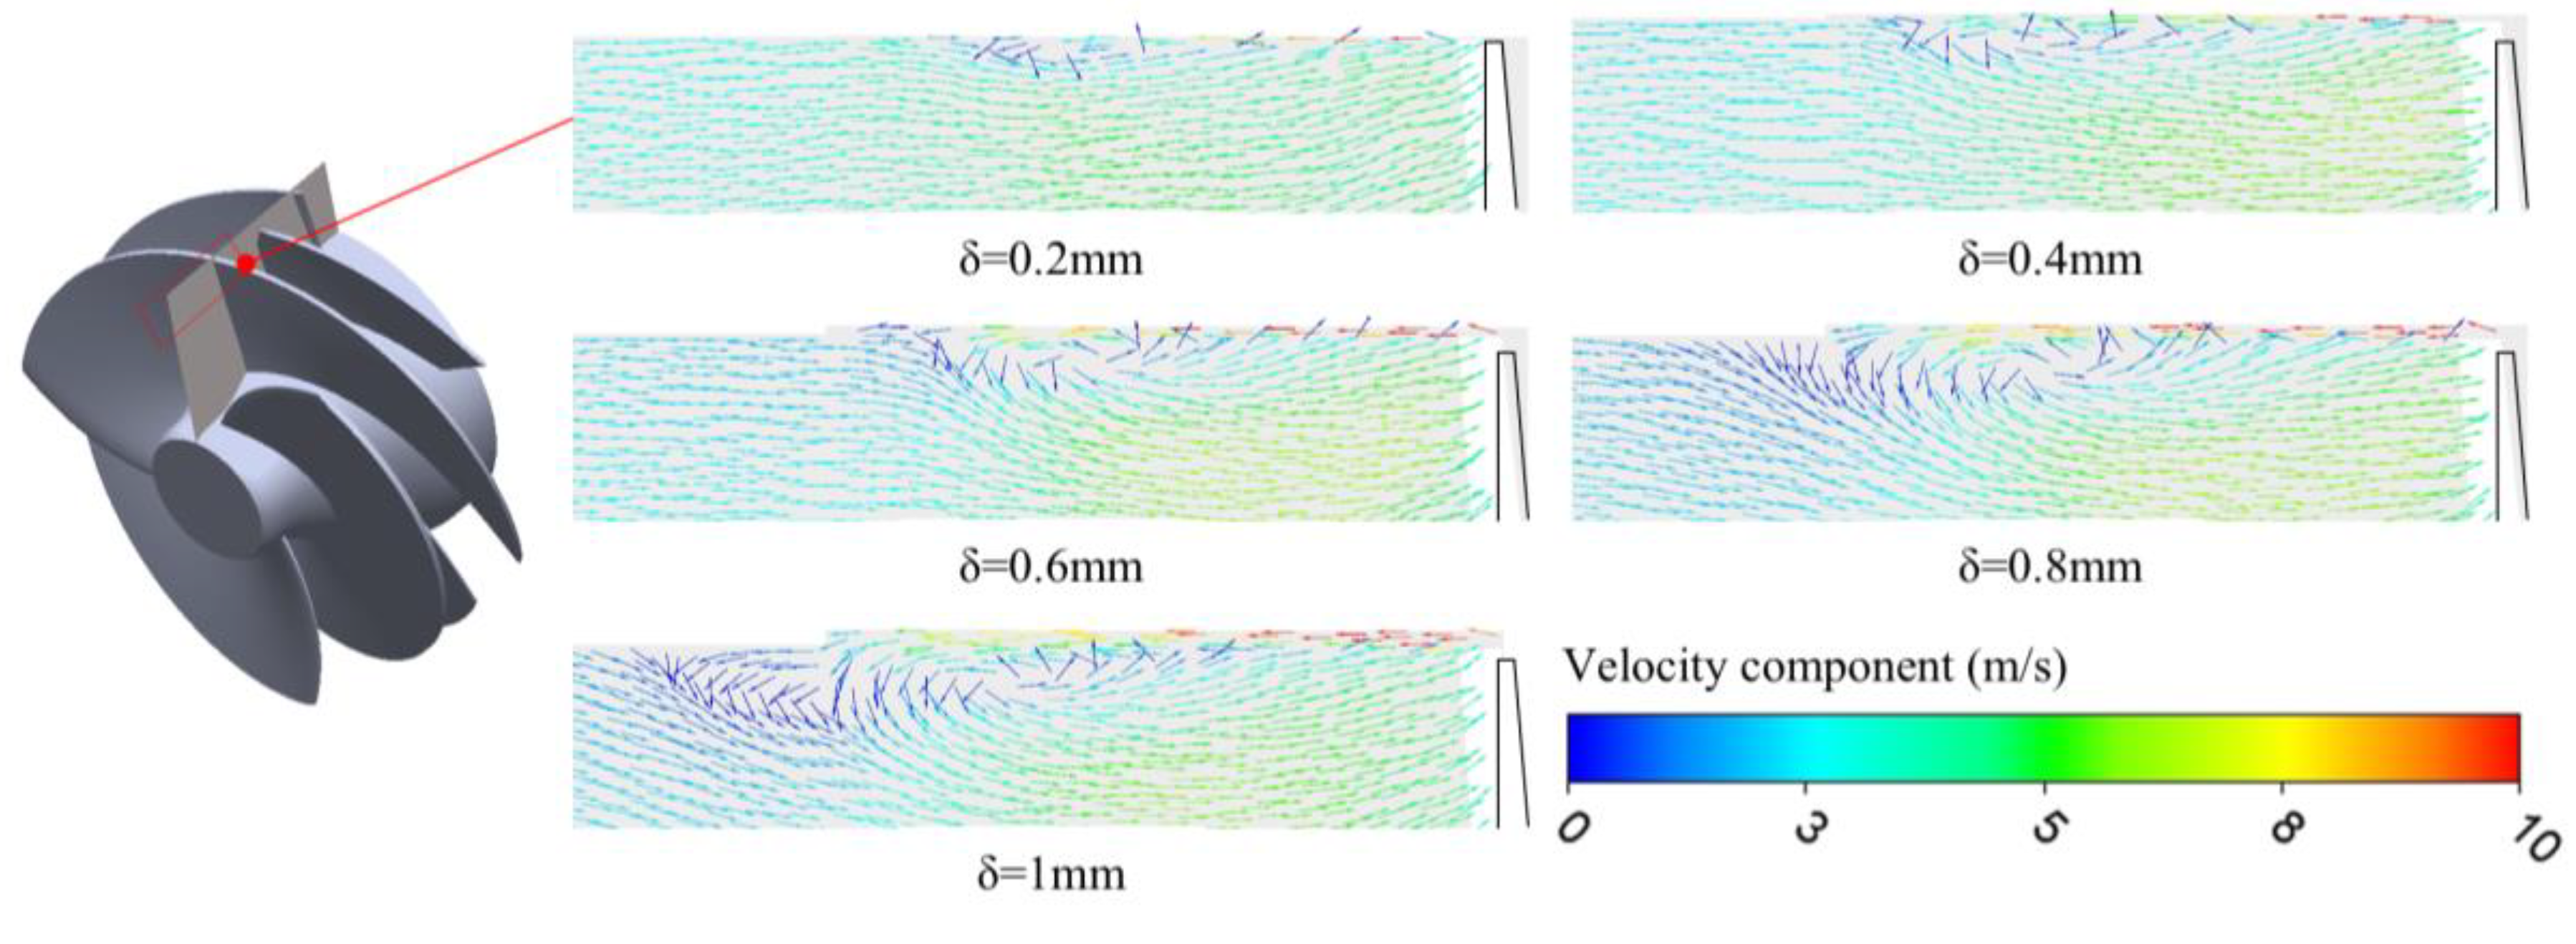
Figure 18.
Vorticity nephogram of blade tip region with different tip clearance.
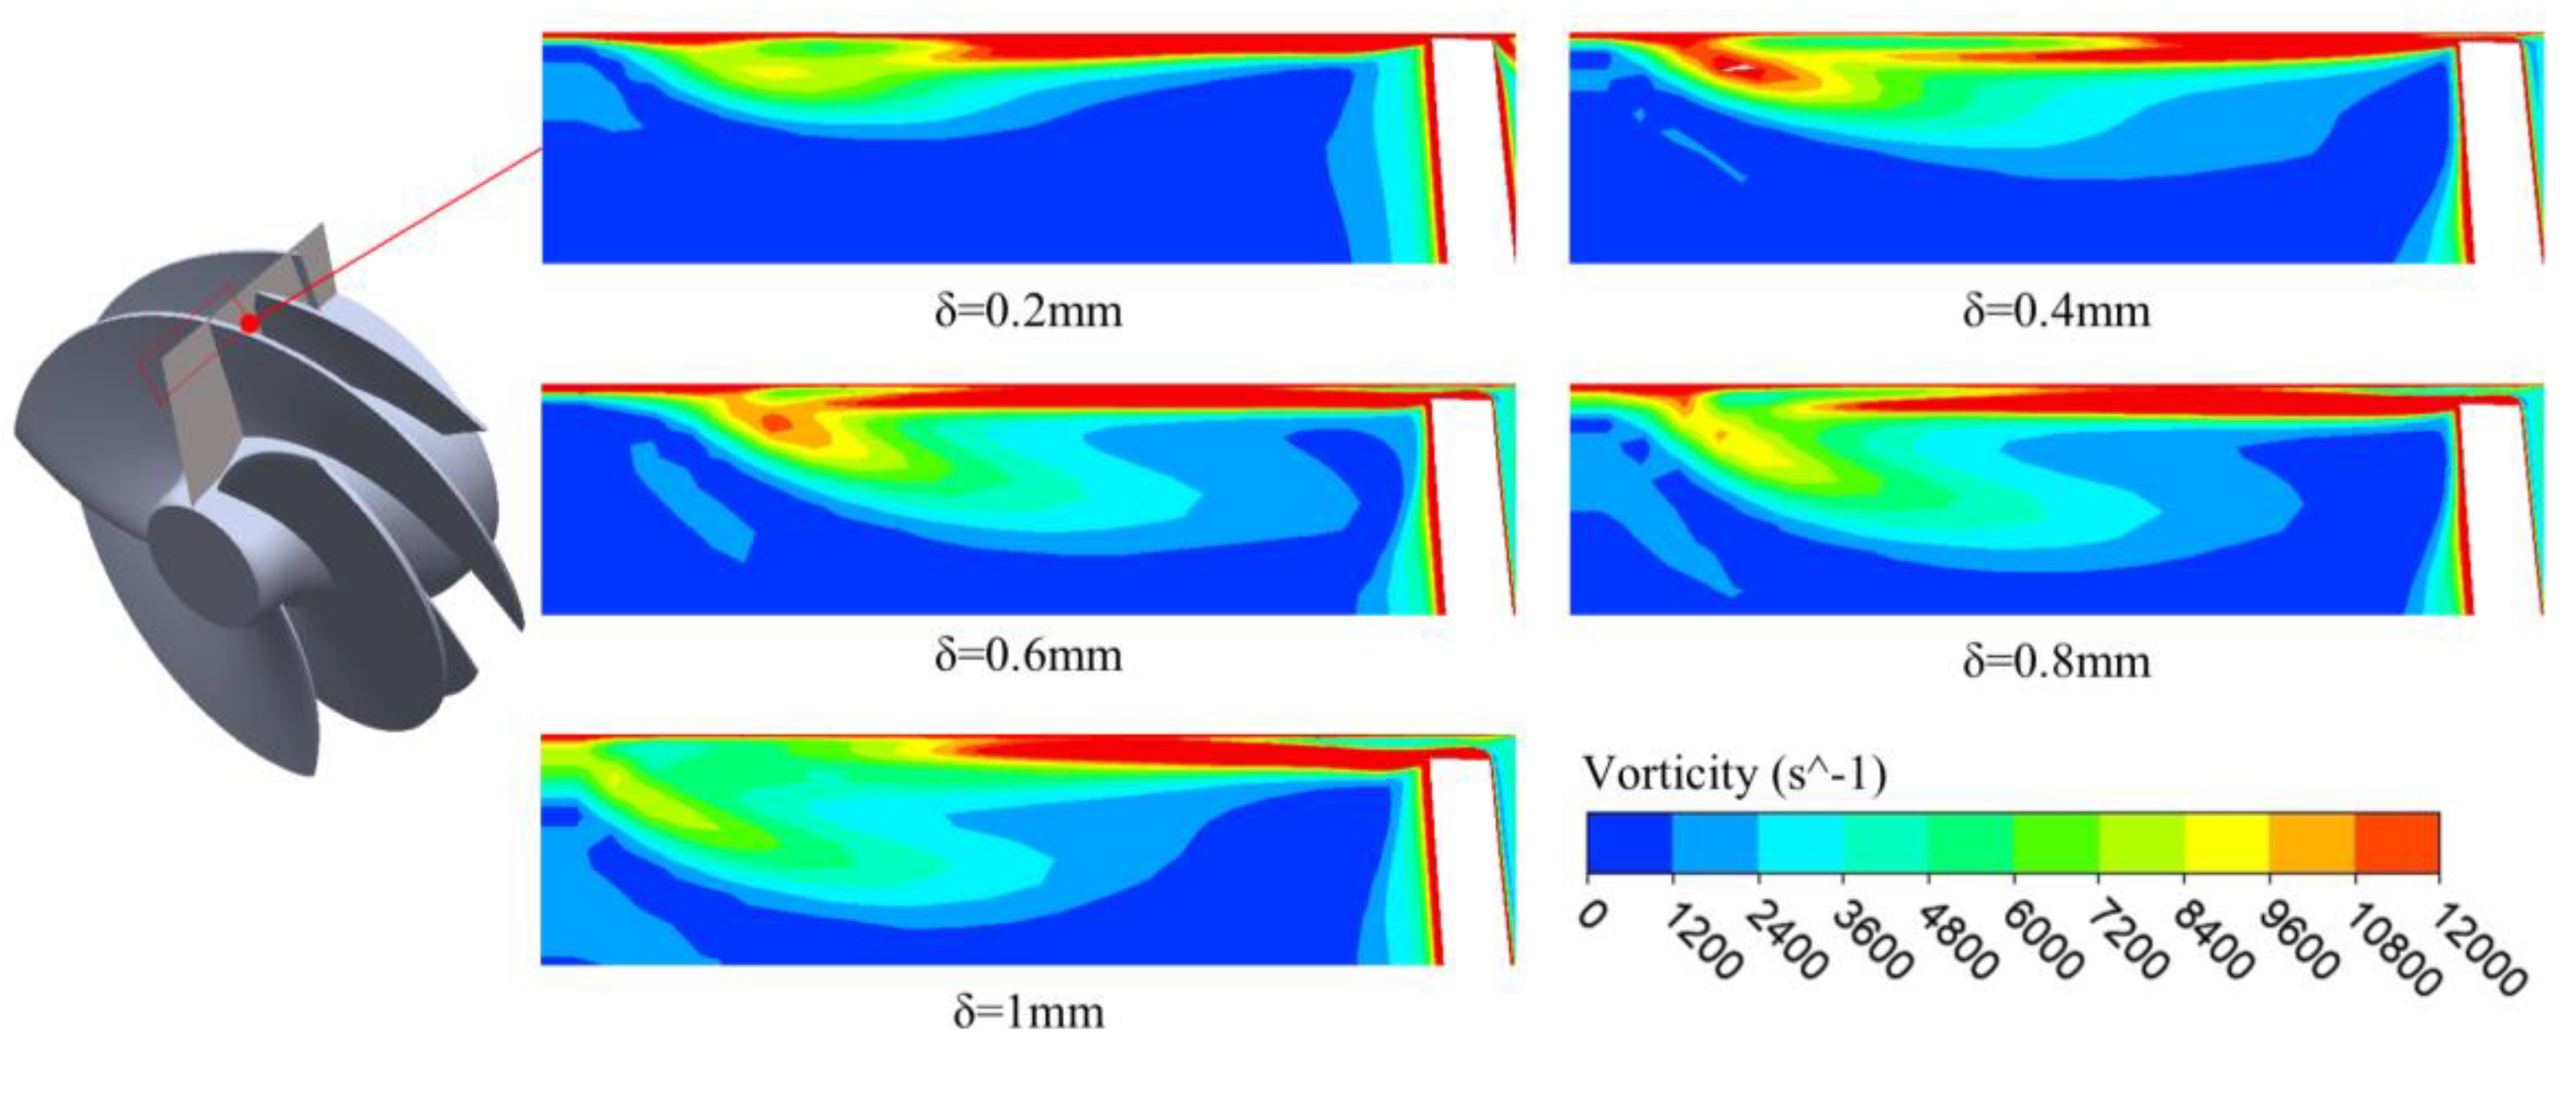

Table 1.
Inducer size parameters.
| parameter | Numerical value |
|---|---|
| Diameter of imported hub dh1 | 54 mm |
| Outlet hub diameter dh2 | 129.3 mm |
| Inducer diameter D1 | 192.5 mm |
| Inlet angle βB1 | Long blade: 10.1° Short blade: 23.1° |
| Outlet angle βB2 | Long blade: 23.1° Short blade: 22.4° |
| Wrap angle φ | 217.8° |
| Number of blades z | Long blade: 3 Short blade: 3 |
| Diameter of imported hub dh1 | 54mm |
Table 2.
Dimension parameters of the impeller.
| parameter | Numerical value |
|---|---|
| Impeller inlet diameter D1 | 158 mm |
| Impeller inlet diameter D2 | 302 mm |
| Impeller outlet width b | 21 mm |
| Inlet angle βB1 | 20° |
| Outlet angle βB2 | 23° |
| Wrap angle φ | 135.5° |
| Number of blades z | 6 |
| Impeller inlet diameter D1 | 158 mm |
Table 3.
Parameters of 1500 rpm and 3000 rpm LNG pumps.
| Speed (rpm) | Rated flow rate (m3/h) | Rated head (M) | Efficiency |
| 1500 | 154 | 480 | 67% |
| 3000 | 308 | 1920 | 75% |
Table 4.
Grid independence verification.
| Experimental serial number | Inducer grid number | Lift/m |
| 1 | 609498 | 222.8 |
| 2 | 1488438 | 223.1 |
| 3 | 2080332 | 223 |
| 4 | 2487963 | 222.9 |
| 5 | 3307026 | 222.8 |
Disclaimer/Publisher’s Note: The statements, opinions and data contained in all publications are solely those of the individual author(s) and contributor(s) and not of MDPI and/or the editor(s). MDPI and/or the editor(s) disclaim responsibility for any injury to people or property resulting from any ideas, methods, instructions or products referred to in the content. |
© 2025 by the authors. Licensee MDPI, Basel, Switzerland. This article is an open access article distributed under the terms and conditions of the Creative Commons Attribution (CC BY) license (http://creativecommons.org/licenses/by/4.0/).
Copyright: This open access article is published under a Creative Commons CC BY 4.0 license, which permit the free download, distribution, and reuse, provided that the author and preprint are cited in any reuse.


