
Submitted:
18 November 2025
Posted:
19 November 2025
You are already at the latest version
Abstract
This work examines the behaviour of a spark-ignition engine using oxy-fuel combustion, coupled with an oxygen production cycle based on a mixed ionic-electronic ceramic membrane. Through 1D-0D simulations, two compression ratios are studied: the original ratio of 9.6 and the optimised CR of 20, under various load levels and altitude conditions. The results show that operational limits exist at part-load conditions, where reducing the load without implementing additional control strategies may compromise system performance. It is observed that at low loads, the intake pressure can fall below atmospheric pressure, encouraging the presence of N2 in the combustion process. Additionally, the engine can operate efficiently up to an altitude of 4,000 m, although increasing boosting is required to maintain proper membrane conditions. These findings emphasise the importance of load control and the potential need for energy assistance under certain circumstances.
Keywords:
oxy-fuel combustion
; O2 production
; MIEC membrane
; engine
1. Introduction
The evolving regulations related to transport pollution and greenhouse gas emissions have prompted efforts across various sectors to develop technologies capable of meeting these strict standards. In the European Union (EU), the 2030 climate and energy framework aims for a 40% reduction in greenhouse gas emissions compared to 1990 levels, a 32% share of renewable energy, and a 32.5% increase in energy efficiency within European industry [1]. These targets align with the EU’s commitments under the Paris Agreement, ratified in 2016 [2].
In this context, strategies such as oxy-fuel combustion (OFC) have emerged as promising alternatives for reducing vehicle emissions. OFC involves burning fuel in an atmosphere of oxygen mixed with recirculated exhaust gases (EGR), which helps to control combustion temperature and to eliminate from the reaction process [4]. This method offers two key advantages: reduced heat and gas rejection, due to the absence of bulk that typically absorbs and rejects heat during exhaust, and a near-zero emissions system, as the exclusion of from the combustion process virtually eliminates emissions while yielding exhaust gases primarily composed of and . This facilitates capture, as described in the book of Zheng and Liu[5] or the review article by Nema et al.[6].
Although oxy-fuel combustion is typically explored and used in big power generation plants, such as in the work by Hu et al.[7], several studies have also explored the application of OFC in internal combustion engines. They examine parameters such as oxygen concentration, exhaust gas recirculation (EGR), water injection, and compression ratios. For instance, Wu et al. [8] investigated a small spark-ignition engine under OFC conditions, finding that thermal efficiency increased by 9.4% under optimal conditions. Similarly, other studies [9,10,11] have demonstrated that varying the oxygen content and combustion conditions can significantly impact engine performance and emissions. Some authors have even designed carbon capture systems for OFC internal combustion engines, such as Luján et al.[12] or made life cycle assessments of OFC engines, such as Serrano et al.[13].
A significant challenge in applying OFC to vehicles is the need for a practical and efficient method of oxygen supply. Most studies rely on pressurised oxygen bottles, which are impractical for widespread transport use due to cost and logistical challenges. Thus, in-situ oxygen production is critical for implementing OFC in conventional vehicles. Among the available technologies, mixed ionic-electronic conducting (MIEC) membranes have gained attention as a viable solution for oxygen production in oxy-fuel combustion systems [14]. These membranes operate at high temperatures, using a chemical potential gradient to achieve high-purity oxygen separation with 100% selectivity, offering advantages such as lower energy consumption and easier integration into vehicle systems compared to cryogenic air separation (CAS) methods [15].
MIEC membranes have primarily been studied in large-scale industrial applications, such as power plants, where they significantly reduce the energy penalties associated with traditional cryogenic methods [16,17,18]. However, recent studies have begun to explore the potential of coupling MIEC membranes with internal combustion engines for automotive applications. For example, Serrano et al. [19] and Arnau et al. [20] demonstrated a feasible way of using MIEC-based oxygen production systems in diesel and spark-ignition engines, respectively, showing promising results in terms of efficiency and emission reduction. In [21], Serrano et al. investigated the same engine at full load, finding the optimal compression ratio to be 20 with an O2 mass fraction of 30%.
This paper aims to further investigate the behaviour of both the engine and the oxygen production cycle when operating under partial loads or in varying altitude conditions in a spark-ignition engine utilising MIEC membranes for in-situ oxygen production under oxy-fuel combustion. The study specifically examines how these varying operational conditions impact engine performance, fuel consumption, and system integrity. The primary objective is to determine the feasibility of such a system for transport applications, particularly in scenarios where engine load is reduced or where atmospheric pressure changes due to altitude.
2. System Description
The layout of the system under investigation is depicted in Figure 1. This configuration integrates two cycles operating in tandem to enable OFC in a spark-ignition engine. The system design is based on the patent described in Arnau et al. [22]. The first part of the system is a modified Brayton cycle, responsible for generating an oxygen stream free of nitrogen. In this cycle, ambient air is compressed through two intercooled stages (compressors 3 and 5). Subsequently, the compressed air flows through a series of heat exchangers, called Heat Exchangers Network (HEN), to recuperate thermal energy from various streams within the system. Initially, the air stream is divided into two paths to extract heat from the still hot exhaust gases that flow to Carbon Capture and Storage (CCS) system and the /EGR gases in exchangers 6 and 7, respectively (Figure 2). The two air streams are then recombined and further heated in exchanger 8 (Figure 2) by hot oxygen-depleted gases emerging from the low-pressure (LP) Turbine 14. Finally, the air exchanges heat with the high temperature /EGR and exhaust gases in exchangers 9 and 10, respectively (Figure 2). After these heat exchange processes, the air enters the membrane with optimal high temperature and pressure conditions, essential for the efficient operation of the MIEC membrane.
Within the membrane (element 11 in Figure 1), O2 is selectively separated from the air on the feed side, producing an oxygen-depleted stream predominantly composed of nitrogen and residual oxygen. This stream, still at high temperature and pressure, is utilised as an energy source across two turbines expansion stages (elements 12 and 14 in Figure 2), which, in turn, drive the air compressors and contribute to heating the air in exchanger 8 (Figure 2).
Additionally, Figure 1 illustrates the power cycle, which includes a spark-ignition engine. The engine’s exhaust gases first pass through a high-temperature heat exchanger (element 10 in Figure 2) and are then divided into two streams. One portion of the exhaust gases is directed to a turbine (element 22). This turbine modulates the exhaust gas recirculation (EGR) that flows through the other branch, sweeping the membrane on its permeate side and thereby controlling the oxygen concentration at the engine intake. By adjusting the turbine’s opening, the system can vary the mass flow directed to the permeate side. A more open turbine allows more exhaust gases to bypass the membrane and flow to the CCS, thereby increasing the oxygen mass fraction at the engine intake. The gases exiting the turbine, still retaining significant thermal energy, are used to reheat the oxygen-depleted gas between the two expansion stages in exchanger 13 and to heat the air in exchanger 6 (Figure 2). The other portion of the exhaust gases sweeps the membrane, lowering the oxygen partial pressure on the permeate side. Inside the membrane, the exhaust gases gain oxygen through mass exchange with the feed-side air, resulting in a high-temperature mixture primarily composed of carbon dioxide, water vapour, and oxygen (/EGR gas). To efficiently utilize this energy and to reduce the temperature of the gas entering the engine, the /EGR gas is cooled through a high and low temperature heat exchangers (elements 9 and 7, respectively, as shown in Figure 2) before being further cooled in element 16 (Figure 1) to ensure an intake temperature of 85 °C, preventing the formation of liquid water at the intake and safeguarding the compatibility with thermo-mechanical limits of compressor (17) in Figure 1. The /EGR gas then passes through compressor (17), driven by the turbine (22), which recovers potential energy to increase the gas density, thus enhancing the engine’s trapped mass. Finally, the /EGR gas is introduced into the engine, where it reacts with the fuel in an Otto cycle, completing the engine’s operational cycle within the system.
3. Methodology
The baseline for comparison in this study is established using a 1.33 L turbocharged, direct-injection spark-ignition engine, which has been both modelled and experimentally analysed while operating in conventional mode. For the modelling under OFC mode, a 0D/1D software called VEMOD® (Virtual Engine Modelling) [23] is utilised. This software incorporates realistic combustion laws and accounts for the effects of exhaust gas recirculation (EGR). Additionally, the study involves several assumptions, simplifications, and limitations that are outlined in the following subsections.
3.1. Engine Specification and Benchmarking
The engine specifications used in this study are listed in Table 1. The results from the conventional operation mode, which serve as a baseline for comparison with the OFC regime, are derived from a study conducted by Serrano et al. [21]. In that study, a methodology was presented to assess the impact of different variable geometry turbines (VGTs) on engine performance at full load, providing data on torque and brake-specific fuel consumption (BSFC).
The conventional air combustion data serve as a reference for comparing the engine’s performance when operating under OFC mode. In this mode, with an oxygen production cycle, the engine aims to achieve the same power output at each studied engine speed, setting the reference full-load torque. The fuel characteristics for both OFC and conventional modes are shown in Table 2.
3.2. Considerations, Variables, and Indicators for Performance Evaluation
The following specific simplifications were applied:
- To achieve optimal conditions for membrane operation during air heating, a constant heat exchanger effectiveness of 95 is assumed, based on results by Komminos and Rodgakis [24].
- The intercooler between the air-driven compressors is assumed to have an outlet temperature of 25 °C.
- Mechanical losses are estimated by considering the energy consumption of auxiliary elements.
- The air composition is assumed to be 77 N2 and 23 O2 by mass fraction.
The global turbocharger efficiency, , is optimised for the oxygen production cycle by adjusting the HP and LP VGTs (12 and 14 at Figure 1) position. The objective function to be maximised is given in Equation 1:
Where and refer to the efficiencies of the low-pressure and high-pressure turbines, respectively, and and represent the efficiencies of the corresponding compressors.
At each operating point, the engine performance is optimised by minimising BSFC, with spark timing adjusted within the limits of a maximum in-cylinder pressure of 15 and a maximum temperature of 3000 . These constraints are imposed due to the thermomechanical limitations of the experimental setup used to derive the OFC parameters. The methodology for determining the input parameters for combustion behaviour under OFC was extensively described in [21].
3.3. Turbochargers Scaling, Volumetric Engine´s Compression-Ratio, Limits and Baseline Statement
The characteristics of the turbocharger selected for scaling are presented in Table 3. As explained in [21], a scale factor is applied to the turbocharger according to its inlet conditions, ensuring operation within a high-efficiency zone. Full-load operation is used to select the scaling values, making the HP and LP turbochargers derived, suitable across the studied speed range.
Following the CFD methodology described by Serrano et al. [25,26], volumetric engine’s compression ratios higher than 20 were deemed likely to induce knocking, setting this value as the upper volumetric engine’s compression-ratio limit. The oxygen concentration with the best performance was then selected, and the system behaviour was analysed across a broad engine speed range at the reference full load. The OFC engine’s performance was subsequently compared with that of the conventional mode in [21] and will not be further described here.
3.4. Part-Load Operation and Performance Indicators
The part-load operation of the engine was studied to establish energy availability limits for O2 production and identify operational constraints, such as the potential for atmospheric inflows due to vacuum pressure at the engine intake, which could lead to nitrogen contamination in the combustion process.
For part-load evaluation, the indicators used are evolved from to those proposed by [27] as follows. The parameter in Equation 2 represents the thermal power required and delivered to the air to achieve the feed conditions required to obtain the necessary O2 permeate for a specific engine operating point. is the air enthalpy flow at the feed inlet, is the air enthalpy flow at atmospheric conditions ( , 25 °C) and accounts for the heat power dissipated by the intercooler between the air-driven compressors.
The first, I, as defined in Equation 3, considers the relationship between power required and delivered for oxygen production and the brake power (BP).
, is considered regarding the oxygen production and the total engine displacement, both per engine cycle. In this sense, represents at every operative condition, the existing ratio between the brake power per litre of engine displacement and the power required in the MIEC per gram of O2 permeated and further consumed in the engine cycle.Regarding the available brake power, it is highly related to the available energy in the exhaust gases; however, it has been preferred as it is a magnitude better understood a priori by the engine’s designer. Equation 4 shows the used expression to determine the mentioned indicator. is a dimensional magnitude and should be understood as grams of O2 per litre of displacement needed to produce a given brake power to MIEC’s power ratio.
Where represents the oxygen production in a cycle, determined as expressed in Equation 5, and is the total engine displacement.
The purpose of comes from the fact that below a quantity of energy in the rejected exhaust gases -i.e. below a given brake power- the production of O2 with the MIEC will not be self-sustained by recovering the waste thermal power of engine exhaust -not enough for a given brake power- and additional power will be needed. Knowing such an limit value a priori will help to specify system performance. The following section presents the results obtained by applying this methodology to the studied engine.
4. Results and Discussion
4.1. Part Load
4.1.1. Engine
The brake-specific fuel consumption of the engine operating at both compression ratios is seen in Figure 3. In both scenarios, an optimum operation point can be observed at low engine speed (2000 rpm) and high loads (full load in CR9.6 and at 80 in CR20). The engine consumption increases mainly with engine speed, while a slight increase is also observed regarding the load. The trends in fuel consumption are more positive than a conventional turbocharged spark-ignition (SI) engine, improving BSFC versus conventional air combustion SI engines, which control load by throttling the intake flow, therefore worsening the pumping losses.
As expected, due to the increment in the compression ratio, the fuel consumption using CR20 is better than the original in all the studied points. Nonetheless, the maximum improvement that could be achieved is limited due to the operating differences in both compression ratios.
First, the maximum in-cylinder pressures reached in CR20 are near the thermomechanical limit ( 15 ) to avoid mechanical problems during operation, while for CR9.6, this limitation is distant from being achieved, as observed in Figure 3 c,d.
For this reason, the start of combustion is more delayed in CR20, as seen in Figure 3 e, f. As the engine load is reduced, the in-cylinder pressure decreases, allowing for the advancement of the start of combustion, which improves engine performance. In contrast, the start of combustion can still be advanced despite the engine load in CR9.6. As explained previously, this combustion advancement can be performed due to the reduced likelihood of knocking issues resulting from the properties of OFC in SI engines [25].
On the other hand, Figure 4 a,b, shows the engine’s mechanical efficiency for both compression ratios. It can be seen in both cases that mechanical efficiency decreases at higher engine speeds and low loads. Additionally, higher mechanical efficiencies are seen at CR9.6, especially at low speeds, where values higher than 94 are obtained for speeds lower than 2000 rpm, which is only observed in CR20 at full load at 1500 rpm and 2000 rpm.
The differences in mechanical efficiencies are explained by considering friction and pumping losses. Figure 4 c, d, shows the friction mean effective pressure (FMEP) for both studied CRs. The friction depends on engine speed and the maximum in-cylinder pressure, which accounts for the mechanical load over the piston. In this sense, higher in-cylinder pressures are found in CR20, which has higher FMEP values. For example, at full load, the friction power surpasses 10 at 5000 rpm in CR20, being near 10 of the net power production. Meanwhile, for CR9.6, the friction losses are around 20 lower at the same speed and load conditions.
Regarding pumping losses, it can be seen in Figure 4 e, f, that higher values are obtained at CR9.6, increasing simultaneously with both engine speed and load. Nonetheless, it must be noted that this higher energy requirement for gas exchange is naturally expected due to the higher intake flows demanded in CR9.6, which result from its lower efficiency in power production, where more fuel is required. Thus, a greater intake mass flow is required to obtain the necessary oxygen.
In this sense, the volumetric efficiency can be observed in Figure 5 a, b, whose reference is the pressure at the intake manifold. The volumetric efficiency reduces in both cases with the engine speed and load. A considerable part of the studied points in CR20 has a volumetric efficiency lower than 90 , surpassing this value at high loads and low to medium speeds. On the other hand, a volumetric efficiency lower than 90 is only obtained at high speeds in CR9.6, especially when the engine load is reduced.
Figure 5 c, d, shows the intake pressure for both engine compression ratios. In CR9.6, the engine intake operates below the atmospheric pressure for loads below 50 while for CR20, the same scenario is observed below 60 . Even if, in energy terms, the MIEC can produce enough O2 at this load, there is a risk of atmospheric air entering, which can lead to the presence of nitrogen in the combustion process, promoting NOx generation. Because the studied points operate at a constant intake temperature, further research should be conducted to maintain the intake density while reducing the temperature, as a technique to increase the intake pressure at low loads, and to prevent entry into the system.
Higher intake pressure values occur at CR9.6 due to the higher energy availability in the exhaust gas turbine (element 22 in the layout, see Figure 1) resulting from higher temperatures in the exhaust gases, which allows for better performance of the coupled compressor (element 17) and increases the intake pressure. Consequently, the in-cylinders mass flow is higher. In Equation 6, intake mass flow is defined as function of volumetric efficiency, intake pressure and intake temperature, as intake temperature is kept constant, and volumetric efficiency is bounded between 88% and 94% for all cases, intake mass flow is almost proportional to the intake pressure.
Figure 6 a, b, shows that the O2/EGR compressor works at low pressure ratios () independently of the engine’s speed, load, or CR. () around 1.2 are found at maximum speed and load for both engine CRs while reducing speed, and load leads the turbomachine to barely pump the O2/EGR to the engine intake. For the full load cases, there is a considerable unbalance in the streams comparing the O2/EGR compressor (17 in Figure 1) and the exhaust gases turbine (22 in Figure 1) , for which the available power to boost the intake mixture is reduced. In this sense, it is worth mentioning that the turbine 22 main role is serving as a regulation valve, where a small portion of energy can be reused to increase the intake pressure of the engine.
Figure 5 e,f, displays the temperature of the exhaust manifold, which indicates how much energy is available to drive, not only the O2/EGR turbocharger but also the oxygen production. As expected, higher loads and speeds lead to an increment in the exhaust gas temperature. As mentioned, higher temperature levels are reached at CR9.6, achieving temperatures as high as 1150 °C. On the other hand, a temperature higher than 1000 °C is nearly surpassed at CR20, due to the higher efficiency.
Consequently, more energy is available to drive the intake compressor and boost the oxygen production cycle in CR9.6. This is the main reason why a lower engine load can be achieved in CR9.6, where a load of 40 can be achieved, while for CR20 the minimum load is 50 of the reference full load. The latter will be fully explained in the next sections with the analysis of the performance indicators (I and ) previously described in Equation 3 and 4. In [28] a miller cycle was found suitable to reduce engine load until close to zero brake torque, while keeping exhaust gas temperature by delaying start of combustion (SOC) and increasing trapped mass, although this technique could be suitable for load reduction in any oxy-fuel combustion engine, it has not been further explored in this paper, for the sake of brevity.
Nonetheless, the higher exhaust temperatures in CR9.6 pose a considerable technological risk, where specialised materials that can withstand high thermal stress must be used in the exhaust pipes of HE-10 (element 10 in Figure 2) and the turbines; this risk is lower with CR20. Lower oxygen concentrations within the acceptable range can be implemented to reduce temperatures, thereby reducing the probability of jeopardising engine operation.
Concerning the maximum in-cylinder temperatures for both cases, none of them surpasses the temperature limit ( 3000 , 2700 °C) to avoid high thermomechanical stress in the cylinder. In CR9.6, higher values (up to 2500 °C) are obtained due to increased fuel consumption, which increases with engine speed and load.
4.1.2. Oxygen Production Cycle
Figure 6 c to f shows the maps of the implemented compressors for oxygen generation cycle operation at both engine compression ratios: 9.6 and 20. Most of the operating points in the air-driven compressors form an almost straight line in the high-efficiency zone, demonstrating that an appropriate selection has been made regarding the size of these turbomachines, which differ between the LP and HP stages but serve equally for different engine volumetric CRs. When both engine scenarios are compared at the same speed and load, the compressors operate at higher compression ratios and air flows at CR9.6, resulting from the higher exhaust waste energy available. Special attention must be given when the engine works at low speeds under a load below 60 , where the compressors operate at low , showing limits for energy availability for the O2 generation cycle.
Regarding the oxygen production cycle, Figure 7 a, b, shows the air mass flow driven for oxygen production that flows through compressors 3 and 5 in Figure 1. Larger air streams occur at higher loads and speeds, as increasing power output requires greater oxygen production. In this sense, CR9.6 shows air flows exceeding 500 /, whereas in CR20, the air mass flow only surpasses 400 / at higher loads and speeds. It is also shown in compressors maps Figure 6 c, d, e & f.
Following this idea, Figure 7 c, d, depict the air pressure at the inlet of the feed side of the MIEC membrane for both cases. Similar to the air mass flow behaviour, the increments in the air feed pressure are found at increasing speed and load. Larger streams lead to more available power in the oxygen-depleted turbines, allowing the air to be more pressurised, which enhances oxygen production. In CR9.6, air feed pressures higher than can be found, while the highest air feed pressure in CR20 is around . On the other hand, it is observed that feed pressures lower than are found at low loads and speeds, which affects oxygen production. Considering that the control strategy to regulate oxygen production (and consequently the power) is throttling the air inlet before the low-pressure compressor (element 22 in Figure 1), modifying the control strategy to reduce oxygen production can benefit this region.
Finally, the air feed temperature of both cases is shown in Figure 8 a, b. These values are highly dependent on the temperature of the exhaust manifold gases, which ultimately determines the entire oxygen production process and imposes the maximum air temperature limit at the membrane’s feed side. In this sense, a similar trend in the air feed temperature is expected compared with the exhaust temperature. A considerable operation region works at feed temperatures higher than 1000 °C in CR9.6. Fortunately, 1000 °C is a value barely surpassed in CR20 only at engine speeds higher than 3500 rpm at full load.
Regarding the operating temperature of the membrane itself (element 11 in Figure 1), it can be stated that it reaches values equivalent to those of the feed air. The membrane behaves as an isothermal zone, as expected based on the gas fluxes observed at element 11 in Figure 1. This occurs because heat exchangers (element 10 in Figure 2) maintain the feed air temperature very close to that of the exhaust gas.
Considering the latter, Figure 8 shows the membrane efficiency (defined as a ratio between MIEC permeated O2 and the O2 available in the MIEC feed side) for both cases. The conditions for oxygen production improve with increasing engine speed, where the optimal conditions regarding pressure and temperature are achieved. If an improvement in membrane efficiency is needed, the position of the variable geometry turbines (VGTs) can be adjusted to increase the feed pressure and enhance oxygen production. This strategy will also reduce the air stream, which helps increase the temperature efficiently. But net O2 production can be also reduced and therefore engine power by playing with MIEC efficiency.
Figure 8 e,f, shows the MIEC operation map for both cases, where different points of the engine are depicted. It shows that increasing the engine load and speed leads to an enhancement of oxygen production, as expected, with higher partial pressures and temperatures found in the membrane. Regarding engine speed, a similar trend is found. In CR9.6, the membrane performance increases linearly at a constant engine speed as the engine load grows. On the other hand, in CR20, this trend is not found where the points at 80 load deviate from this behaviour. The latter occurs considering that at this load, the combustion can be more advanced, considering the pressure limit in the cylinder. In this sense, the membrane temperature reduces more than expected, affecting oxygen production and increasing the oxygen partial pressure at the feed side due to an increment in the oxygen concentration at the outlet of the feed side. About 100 kg/h of O2 (30g/s) permeated through the MIEC walls is needed to sustain rated power conditions in the studied engine.
4.1.3. Limits Evaluation
Finally, the limits of the system operation are presented, considering energy and operative limits. I and are presented in Figure 9 for both studied compression ratios. It can be observed that I increases with the engine load and the reduction in engine speed. Nonetheless, there is no clear uniformity regarding the value that limits oxygen production related to the available energy, considering the entire speed range. It can only be said that to produce enough O2, power available for MIEC must be between 0.95 and 1.15 times engine brake power.
Thus, is considered for both cases. For this indicator, there is a clear limit for both engine volumetric compression ratios and independently of the engine speed, meaning that the ratio of the available energy in brake shaft per litre of displacement volume of the RICE to the energy supplied to the airflow per gram of oxygen must be higher than 0.3 to ensure a proper operation and operating below this limit represent that the engine and oxygen production coupling is not self-sustaining and additional strategies must be applied to produce enough O2 to sustain oxy-fuel combustion and lower load conditions:
- Adding an energy source, such as a heater or an electric compressor: This requires the addition of weight and volume to the system, as well as an increment in energy consumption.
- Increase the membrane area: The engine studies were made using a membrane area of 100 m2, selected after a trade-off decision at full load between membrane size and oxygen production enhancement. Increasing the membrane area enhances air separation, but also increases the system size, which can be detrimental in the transport context.
- Varying the settings of the VGTs: This action increases the air pressure, promoting oxygen production. But reduce net air flow and net power, what is not an issue at part loads. Also penalises efficiency since turbomachinery operates at off-design conditions.
- Delaying the combustion: This reduces engine efficiency while increasing exhaust temperature, thus decreasing the available energy for oxygen production, as seen in [28].
Further research must be performed on applying these strategies if the reduction of the engine load is the objective.
It also must be added that these indicators can be used for other engines that work under similar conditions.
4.2. Altitude
4.2.1. Engine
The behaviour of the engine is studied at different altitudes by varying the boundary conditions (pressure and temperature at points 1, 15, and 23 of Figure 1), which are adjusted until a limitation in the engine is encountered. CR9.6 and CR20 cases are used in the study, using an engine intake oxygen concentration of 30 . The reference full-load conditions are considered in this study, maintaining the power objective for each engine speed as altitude increases. Additionally, the atmosphere model used at altitude is the international standard atmosphere ISO 2533:1975.
Considering the latter, on the one hand, Figure 10 a, b, shows the engine power at different altitudes in the studied engine speed range. The system can provide the reference power for each case until an altitude of 5000 is reached for each engine compression ratio. At the mentioned altitude, the power starts to be reduced at high engine speeds for CR9.6. In contrast, for CR20, the power production is considerably diminished at low speeds (1500 rpm), and therefore, it is not even depicted in the figure.
Figure 10 c, d, depicts the BSFC for both compression ratios. The fuel consumption slightly decreases with altitude, especially at low and medium speeds, which is explained by slight improvements in mechanical efficiency; however, it remains generally independent of altitude.
The reason is that the oxy-fuel combustion reciprocating engine operates in an almost closed cycle, only connected to the atmosphere through the expansion in the turbine (element 22 in Figure 1). Altitude contributes to increasing energy extraction from this turbine will be shown in compressor maps on Figure 11
Effectively, Figure 11, a, b, shows that at higher altitudes, the performance of the O2/EGR compressor is enhanced. The expansion ratio of the exhaust gas turbine increases due to a decrease in the outlet pressure of the turbine, resulting in an increase in the power required to move the associated compressor. The latter leads to an increase in the intake pressure of the engine, which helps keep the engine intake flow at altitude and maintain performance independence from altitude.
On the other hand, Figure 11 c to f, shows the compressor maps for both studied cases at different altitude conditions and engine speeds. Similar to the partial load study, the operation points in the air-driven compressors work, generating a straight line in the central zone of the map, which is a suitable region for operation, with a considerable distance from the surge but approaching maximum speed and choke region as altitude increases.
4.2.2. Oxygen Production Cycle
The air feed variables, such as MIEC air mass flow and pressure, exhibit only a small reduction, shown in Figure 12 a,b and Figure 12 c, d, where the slight reduction of the available energy in the exhaust gases comes together with a proportional reduction in oxygen production requirements.
Considering the latter, Figure 13 a, b, shows the air feed temperature and the membrane map Figure 13 c, d, depicting different altitude and engine speed values for both engine compression ratios. At a constant speed, it is observed that the membrane operation is performed almost at an isoline of oxygen production, where the points move in the top-left direction as the altitude increases. This occurs due to the increase in membrane temperature at lower altitudes, resulting in a decrease in oxygen partial pressure as a result of improved air separation. The latter reduces the oxygen concentration at the outlet of the feed side, decreasing the mean oxygen partial pressure on this side of the membrane.
This effect becomes less pronounced as the engine speed increases, and in the CR9.6 case, there is more available energy to heat the membrane and increase air pressure, resulting in the membrane operating almost in the same position on the map. Additionally, the effect of engine improvement is primarily observed at low speeds, where higher variations in available energy are also present, thereby altering the operating point of the membrane.
For both compressors, it is observed that the altitude increment results in increased turbocharger speeds, while the density reduction leads to an increase in corrected mass flow. A higher compression ratio is required to achieve the membrane conditions for oxygen production. In this sense, special attention must be given to high engine speeds and altitudes, where the operation is performed near overspeed conditions. For example, operating the engine at 5000 rpm at an altitude of 4000 causes the low-pressure compressor to run at its maximum speed, as reported in the map, which can jeopardise the component’s thermal loads and compromise its performance.
Thus, it can be said that the reduction in power production as the altitude increases is due to an increase in the total compression ratio required for both compressors to meet the needed conditions for oxygen production in the membrane. In this sense, the available energy in the oxygen-depleted air is insufficient to compress the air mass flow, and the power production decays.
5. Conclusions and Future Works
The operative limits of the system under part-load conditions were determined using specific indicators designed to identify those limits. For CR9.6, loads below 40% cannot be achieved without additional energy sources or control strategies either. On the other hand, for CR20, lower loads than 50% cannot be achieved. Two indicators, I and , are used to determine energy limits. Similar threshold values were found for both volumetric engine compression ratios using . These indicators can be applied to engines with similar architecture and SI combustion concept, and are expected to yield comparable results for different displacement volumes, speed ranges and volumetric compression ratios. Increasing the membrane area, delaying the spark timing, adding an energy source (a heater or an electric compressor), and adjusting turbine positioning were suggested as alternatives to be explored as possible strategies to reduce the oxy-fuel combustion engine load in a self-sustainable manner by using waste energy from the exhaust gases..
However, for CR9.6 and CR20, loads below 50% and 60% respectively are also limited due to the risk of backflow caused by intake pressures falling below atmospheric levels. This can lead to the presence of N2 in the combustion process. Higher intake temperatures can increase intake pressure. However, further investigation is needed on this aspect.
Regarding high-altitude operation, the system performs correctly up to an altitude of 4,000 meters. A limitation arises due to the need for higher compression ratios to achieve the required membrane conditions at altitude, despite the reduced available energy as altitude increases. Nonetheless, engine performance improves thanks to increased volumetric efficiency, resulting from the enhanced efficiency of the O2/EGR compressor. This improvement is due to a higher expansion ratio in the exhaust turbine, which provides more available energy.
That said, OFC, when used in a spark-ignition engine coupled with a membrane-based oxygen production cycle, exhibits a promising performance where different load and altitude conditions can be operated with much less impact on oxy-fuel engine’s bsfc than in a standard air-fuel combustion. In addition, high compression ratios and advanced spark timings can be applied, leading to significant improvements in fuel consumption. Moreover, a MIEC membrane-based oxygen production cycle can be integrated into engine operation to meet oxygen demands by utilizing the energy from exhaust gases. This cycle has demonstrated the capability to operate under various oxygen concentrations, compression ratios, and engine speeds and load conditions.
Beyond these findings, this study also paves the way for hybridisation. Given that the MIEC-based oxygen production system relies on high-temperature exhaust gases for energy, its performance may be affected at lower engine loads or higher altitudes, where exhaust energy is insufficient. In such scenarios, electrical assistance or hybridisation could become necessary, either to support the oxygen production cycle or to optimise overall vehicle efficiency by utilising excess energy for battery charging. While this concept is not the primary focus of this paper, it represents a promising avenue for future research and development in the context of hybrid engine systems with zero gaseous emissions.
Author Contributions
Conceptualization: J.S., F.A. and F.G.; Data curation: L.G. and F.G.; Formal analysis: J.S., L.G., D.C. and F.G.; Funding acquisition: F.A.; Investigation: J.S., D.C. and F.G.; Methodology: J.S. and F.G.; Project administration: F.A.; Resources: F.A.; Software: F.A. and L.G.; Supervision: L.G.; Validation: J.S. and D.C.; Visualization: J.S. and L.G.; Writing – original draft: D.C. and F.G.; Writing – review & editing: F.A., L.G. and D.C. All authors have read and agreed to the published version of the manuscript.
Funding
This work has been partially supported by Grant PID2021-123351OB-I00 funded by MCIN/AEI/10.13039/ 501100011033 and by ERDF/EU. This research has been partially supported by Grant CIPROM/2021/061 funded by Generalitat Valenciana. Diego Contreras has been funded by the Universitat Politècnica de València’s Research and Development Support Programme (PAID-01-24).
Data Availability Statement
The raw data supporting the conclusions of this article will be made available by the authors on request.
Conflicts of Interest
The authors declare no conflicts of interest
Abbreviations
The following abbreviations are used in this manuscript:
| ATDC | After top dead centre |
| BSFC | Brake specific fuel consumption |
| BP | Brake Power |
| CAS | Cryogenic air separation |
| CFD | Computational fluid dynamics |
| CI | Compression-ignition engine |
| CR | Engine compression ratio |
| EGR | Exhaust gas recirculation |
| Efficiency | |
| Membrane efficiency | |
| Specific heat ratio | |
| HE | Heat exchanger |
| HP | High pressure |
| Energy required to meet MIEC conditions | |
| Air enthalpy flow at atmospheric conditions | |
| Enthalpy flow at the feed inlet | |
| ICE | Internal combustion engine |
| IMEP | Indicated mean effective pressure |
| Oxidizer-fuel equivalence ratio | |
| LP | Low pressure |
| MIEC | Mixed ionic and electronic conducting |
| Turbomachines nondimensional mass flow | |
| Air mass flow | |
| O2 mass flow permeated through the membrane | |
| Compressor corrected mass flow | |
| Compressor corrected speed | |
| OFC | Oxy-fuel combustion |
| Turbomachines nondimensional speed | |
| Compressor total-to-total pressure ratio | |
| Pressure of the membrane feed flow | |
| Pressure of exhaust manifold | |
| Pressure of intake manifold | |
| Temperature of intake manifold | |
| PMEP | Pumping Mean Effective Pressure |
| PM | Particulate matter |
| Average O2 partial pressure of the membrane feed flow | |
| Average O2 partial pressure of the membrane permeate flow | |
| Heat power dissipated by the intercooler | |
| SI | Spark-ignition engine |
| SOC | Start of combustion |
| Temperature of exhaust manifold | |
| Temperature of the membrane feed flow | |
| Temperature of intake manifold | |
| Maximum in-cylinder temperature | |
| Total engine displacement | |
| VGT | Variable Geometry Turbine |
| Power |
References
- European Union, 2021. 2030 climate & energy framework.
- European Union, 2016. Paris agreement.
- European Union, 2022. Commission proposes new euro 7 standards to reduce pollutant emissions from vehicles and improve air quality.
- Habib, M. A., Nemitallah, M., and Ben-Mansour, R., 2013. “Recent development in oxy-combustion technology and its applications to gas turbine combustors and ITM reactors”. Energy & Fuels,27(1), pp. 2–19. [CrossRef]
- Zheng, C., and Liu, Z., 2018. Oxy-Fuel Combustion Fundamentals, Theory and Practice. Academic Press.
- Nema, A., Kumar, A., and Warudkar, V., 2025 “An in-depth critical review of different carbon capture techniques: Assessing their effectiveness and role in reducing climate change emissions”. Energy Conversion and Management,323, 119244. [CrossRef]
- Hu, F., Sun, H., Zhang, T., Wang, Q., Li, Y., Liao, H., Wu, X., and Liu, Z., 2024 “Comparative study on process simulation and performance analysis in two pressurized oxy-fuel combustion power plants for carbon capture”. Energy Conversion and Management,303, 118178. [CrossRef]
- Wu, Z., Yu, X., Fu, L.-Z., Deng, J., Hu, Z., and Li, L.-G., 2014. “A high efficiency oxyfuel internal combustion engine cycle with water direct injection for waste heat recovery”. Energy,70(1), pp. 110–120. [CrossRef]
- Kang, Z., Wu, Z., Zhang, Z., Deng, J., Hu, Z., and Li, L., 2017. “Study of the Combustion Characteristics of a HCCI Engine Coupled with Oxy-Fuel Combustion Mode”. SAE International Journal of Engines,10, pp. 908–916. [CrossRef]
- Tan, Q., and Hu, Y., 2016. “A study on the combustion and emission performance of diesel engines under different proportions of O2 & N2& CO2”. Applied Thermal Engineering,108, pp. 508–515. [CrossRef]
- Van Blarigan, A., Kozarac, D., Seiser, R., Cattolica, R., Chen, J.-Y., and Dibble, R., 2014. “Experimental study of methane-fuel OFC in a spark-ignited engine”. Journal of Energy Resources Technology,136, 3. [CrossRef]
- Luján, J.M., Arnau, F.J., Piqueras, P., and Farias, V.H., 2023. “Design of a carbon capture system for oxy-fuel combustion in compression ignition engines with exhaust water recirculation”. Energy Conversion and Management,284, 116979. [CrossRef]
- Serrano, J.R., Piqueras, P., Sanchís, E.J., and García, F.J., 2025. “Comparative life cycle assessment of oxy-fuel combustion utilization across various fuels in the maritime sector”. Energy Conversion and Management,342, 120034. [CrossRef]
- Zhu, X., and Yang, W., 2017. Mixed Conducting Ceramic Membranes Fundamentals, Materials and Applications. Springer.
- Wu, F., Argyle, M. D., Dellenback, P. A., and Fan, M., 2018. “Progress in O2 separation for oxy-fuel combustion–A promising way for cost-effective CO2 capture: A review”. Progress in Energy and Combustion Science,67, pp. 188–205. [CrossRef]
- Castillo, R., 2011. “Thermodynamic analysis of a hard coal oxyfuel power plant with high temperature three-end membrane for air separation”. Applied Energy,88(5), pp. 1480–1493. [CrossRef]
- Skorek-Osikowska, A., Łukasz Bartela, and Kotowicz, J., 2015. “A comparative thermodynamic, economic and risk analysis concerning implementation of oxy-combustion power plants integrated with cryogenic and hybrid air separation units”. Energy Conversion and Management,92, pp. 421–430. [CrossRef]
- Portillo, E., Gallego Fernandez, L. M., Vega, F., Alonso-Farinas, B., and Navarrete, B., 2021. “Oxygen transport membrane unit applied to oxy-combustion coal power plants: A thermodynamic assessment”. Journal of Environmental Chemical Engineering,9(6), 105266. [CrossRef]
- Serrano, J.R., Arnau, F.J., García-Cuevas, L.M., and Farias, V.H., 2021. “Oxy-fuel combustion feasibility of compression ignition engines using oxygen separation membranes for enabling carbon dioxide capture”. Energy Conversion and Management,247. [CrossRef]
- Arnau, F., Novella, R., García-Cuevas, L. M., and Gutiérrez, F., 2021. “Adapting an internal combustion engine to oxy-fuel combustion with in-situ oxygen production”. ASME 2021 Internal Combustion Engine Division Fall Technical Conference ICEF2021-67707. [CrossRef]
- Serrano, J.R., Arnau, F.J., García-Cuevas, L.M., and Gutiérrez, F.A., 2023. “Coupling an oxygen generation cycle with an oxy-fuel combustion spark ignition engine for zero NOx emissions and carbon capture: A feasibility study”. Energy Conversion and Management,284, 116973. [CrossRef]
- Arnau, F. J., Benajes, J. V., Catalán, D., Desantes, J. M., García-Cuevas, L. M., Serra, J. M., and Serrano, J. R., 2021. Internal combustion engine and operating method of the same. Motor de combustión interna y método de funcionamiento del mismo. P201930285, 28.03.2019. WO2020/193833A1, 01.10.2020. PCT/ES2020/070199, 21.03.2020. ES2751129B2, 29.03.2021.
- Martin, J. , Arnau, F., Piqueras, P., and Auñón, A., 2018. “Development of an Integrated Virtual Engine Model to Simulate New Standard Testing Cycles”. In WCX World Congress Experience, SAE International 2018-04-03. [CrossRef]
- Komninos, N., and Rogdakis, E., 2018. “Design considerations for an Ericsson engine equipped with high-performance gas-to-gas compact heat exchanger: A numerical study”. Applied Thermal Engineering,133, pp. 749–763. [CrossRef]
- Serrano, J. R., Martín, J., Gómez-Soriano, J., and Raggi, R., 2022. “Exploring the oxy-fuel combustion in spark-ignition engines for future clean powerplants”. In Proceedings of the ASME 2022 ICEF 2022. [CrossRef]
- Serrano, J. R., Martín, J., Gómez-Soriano, J., and Raggi, R., 2021. “Theoretical evaluation of the spark-ignition premixed oxyfuel combustion concept for future CO2 captive powerplants”. Energy Conversion and Management,244. [CrossRef]
- Arnau, F.J., Bracho, G., García-Cuevas, L.M., and Farias, V.H., 2023. “A strategy to extend load operation map range in oxy-fuel compression ignition engines with oxygen separation membranes”. Applied Thermal Engineering,226, 120268. [CrossRef]
- Serrano, J.R., Arnau, F.J., Piqueras, P., Contreras-Jimenez, D., Ariztegui, J., and Oliva, F., 2024. “About the Use of Oxyfuel Combustion Engines to Assess the Heat and Power Flexibility Needs of Decarbonised E-Fuel Synthesis Plants While Keeping the Circularity of O2 and CO2 in the Process”. ASME 2024 ICE Forward Conference,Internal Combustion Engine Division Fall Technical Conference, V001T02A005. [CrossRef]
Figure 1.
Spark ignition engine operating via oxy-fuel combustion with in-situ oxygen production.
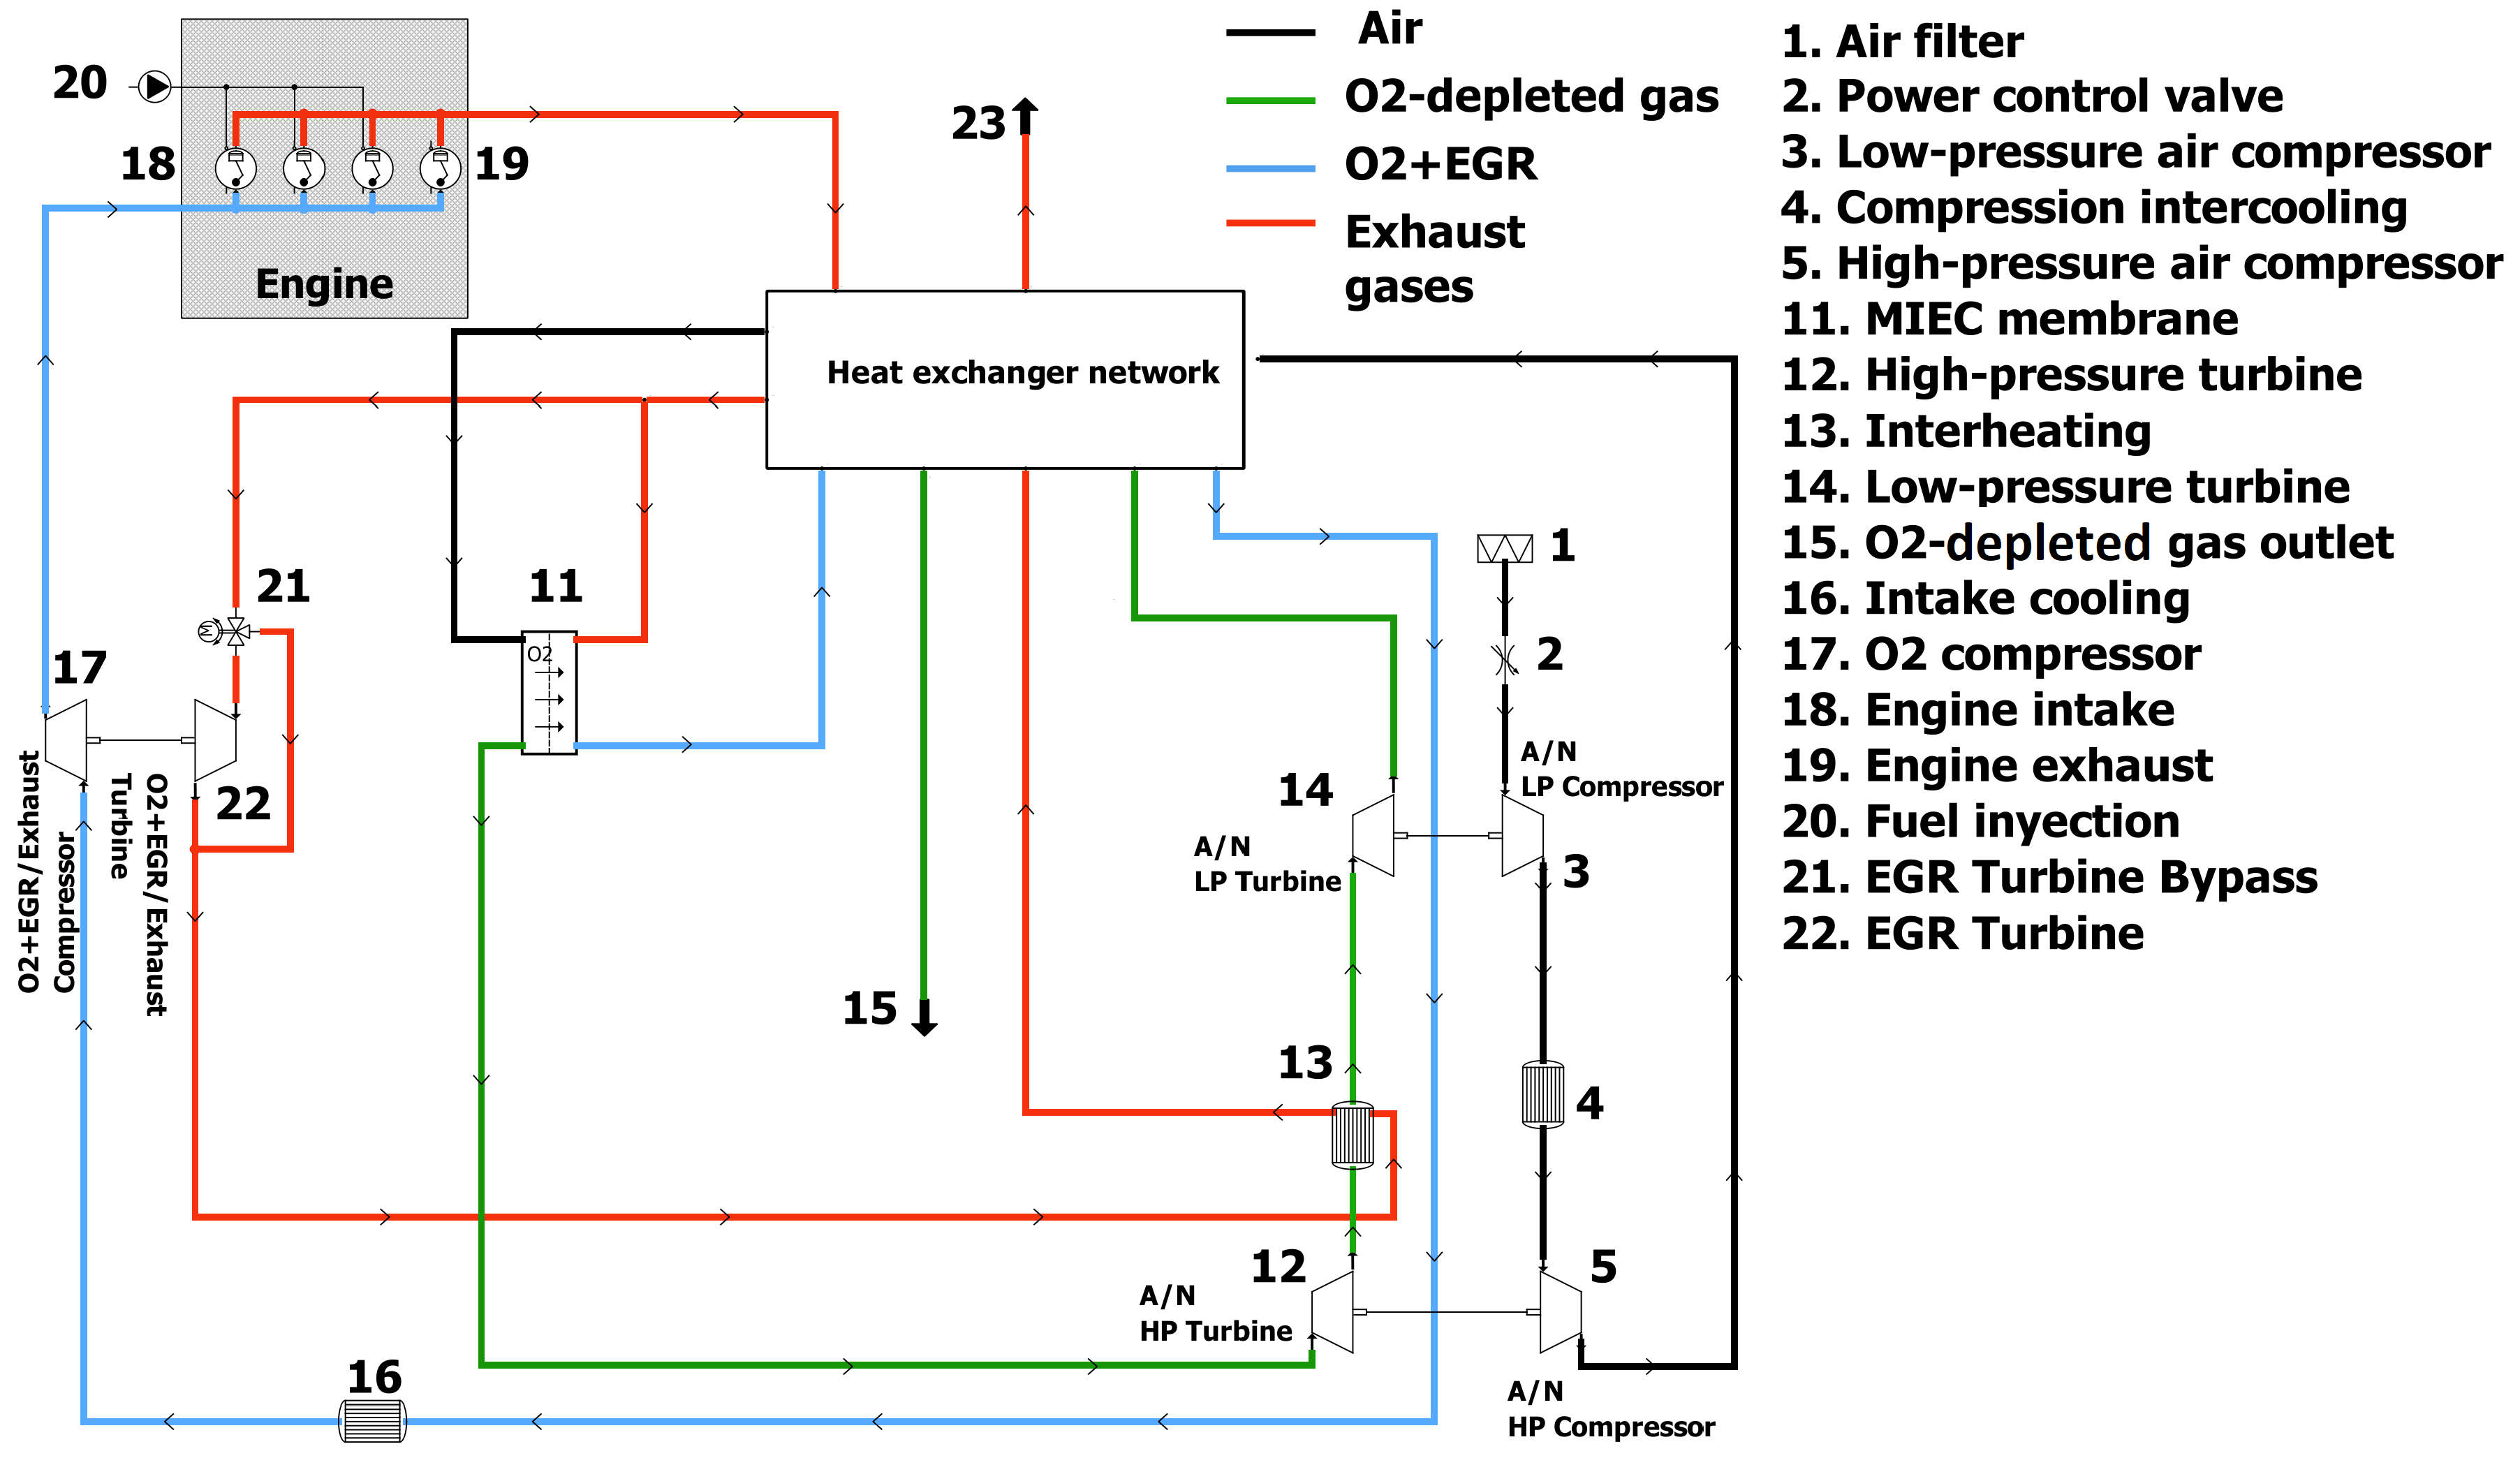
Figure 2.
Heat exchanger network adapted from the work by Serrano et al. [19].
Figure 2.
Heat exchanger network adapted from the work by Serrano et al. [19].
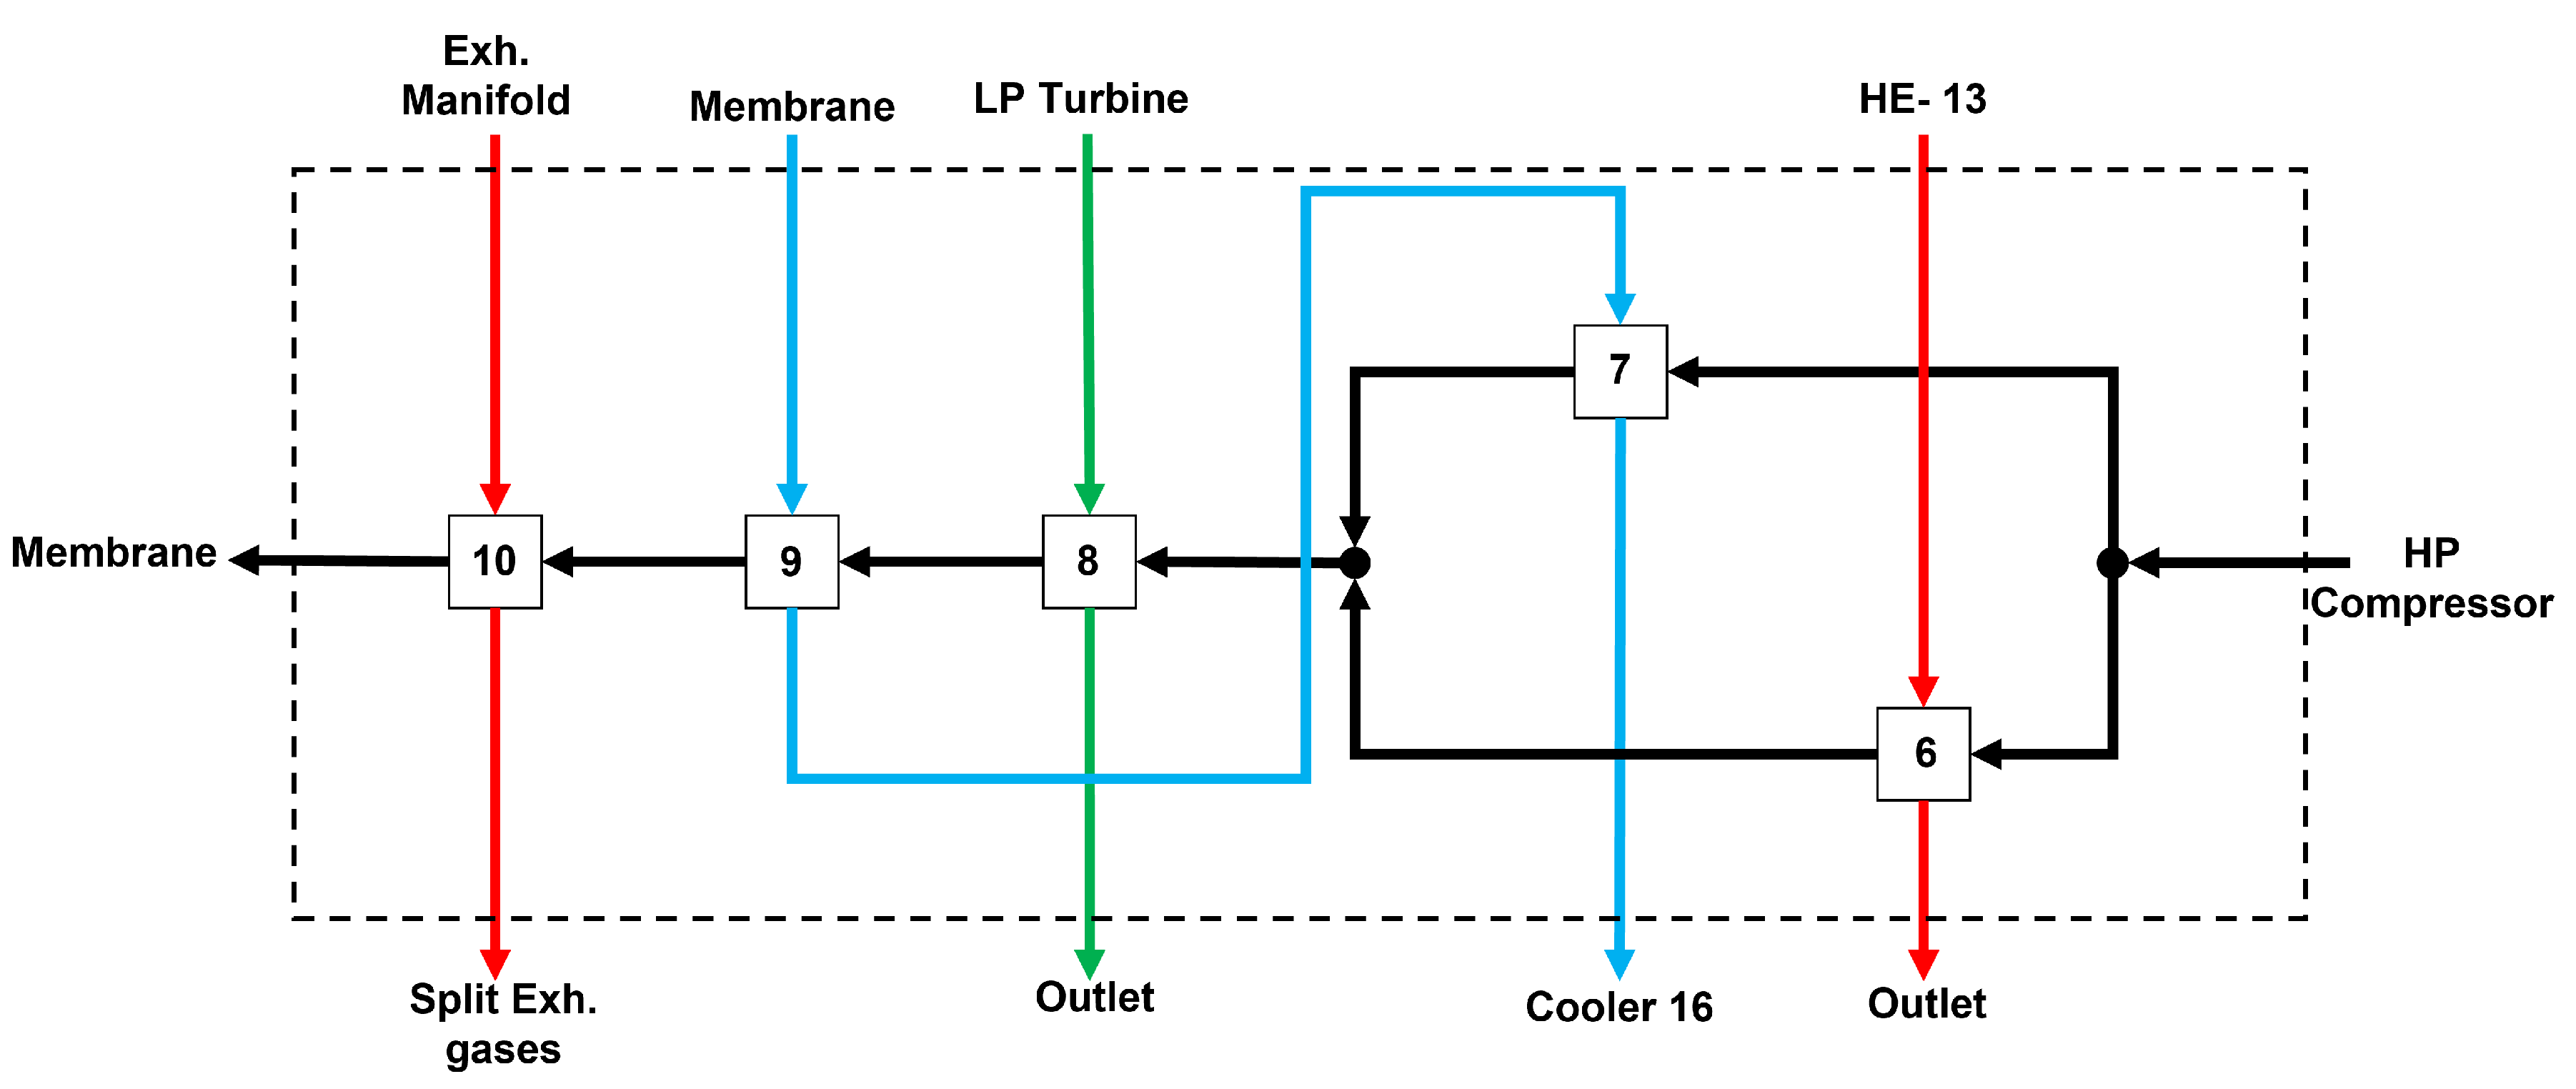
Figure 3.
a), b) Brake specific fuel consumption, c), d) maximum in-cylinder pressure and e), f) start of combustion maps using two different engine volumetric compression ratios. a), c), e): CR 9.6. b), d), f): CR 20
Figure 3.
a), b) Brake specific fuel consumption, c), d) maximum in-cylinder pressure and e), f) start of combustion maps using two different engine volumetric compression ratios. a), c), e): CR 9.6. b), d), f): CR 20
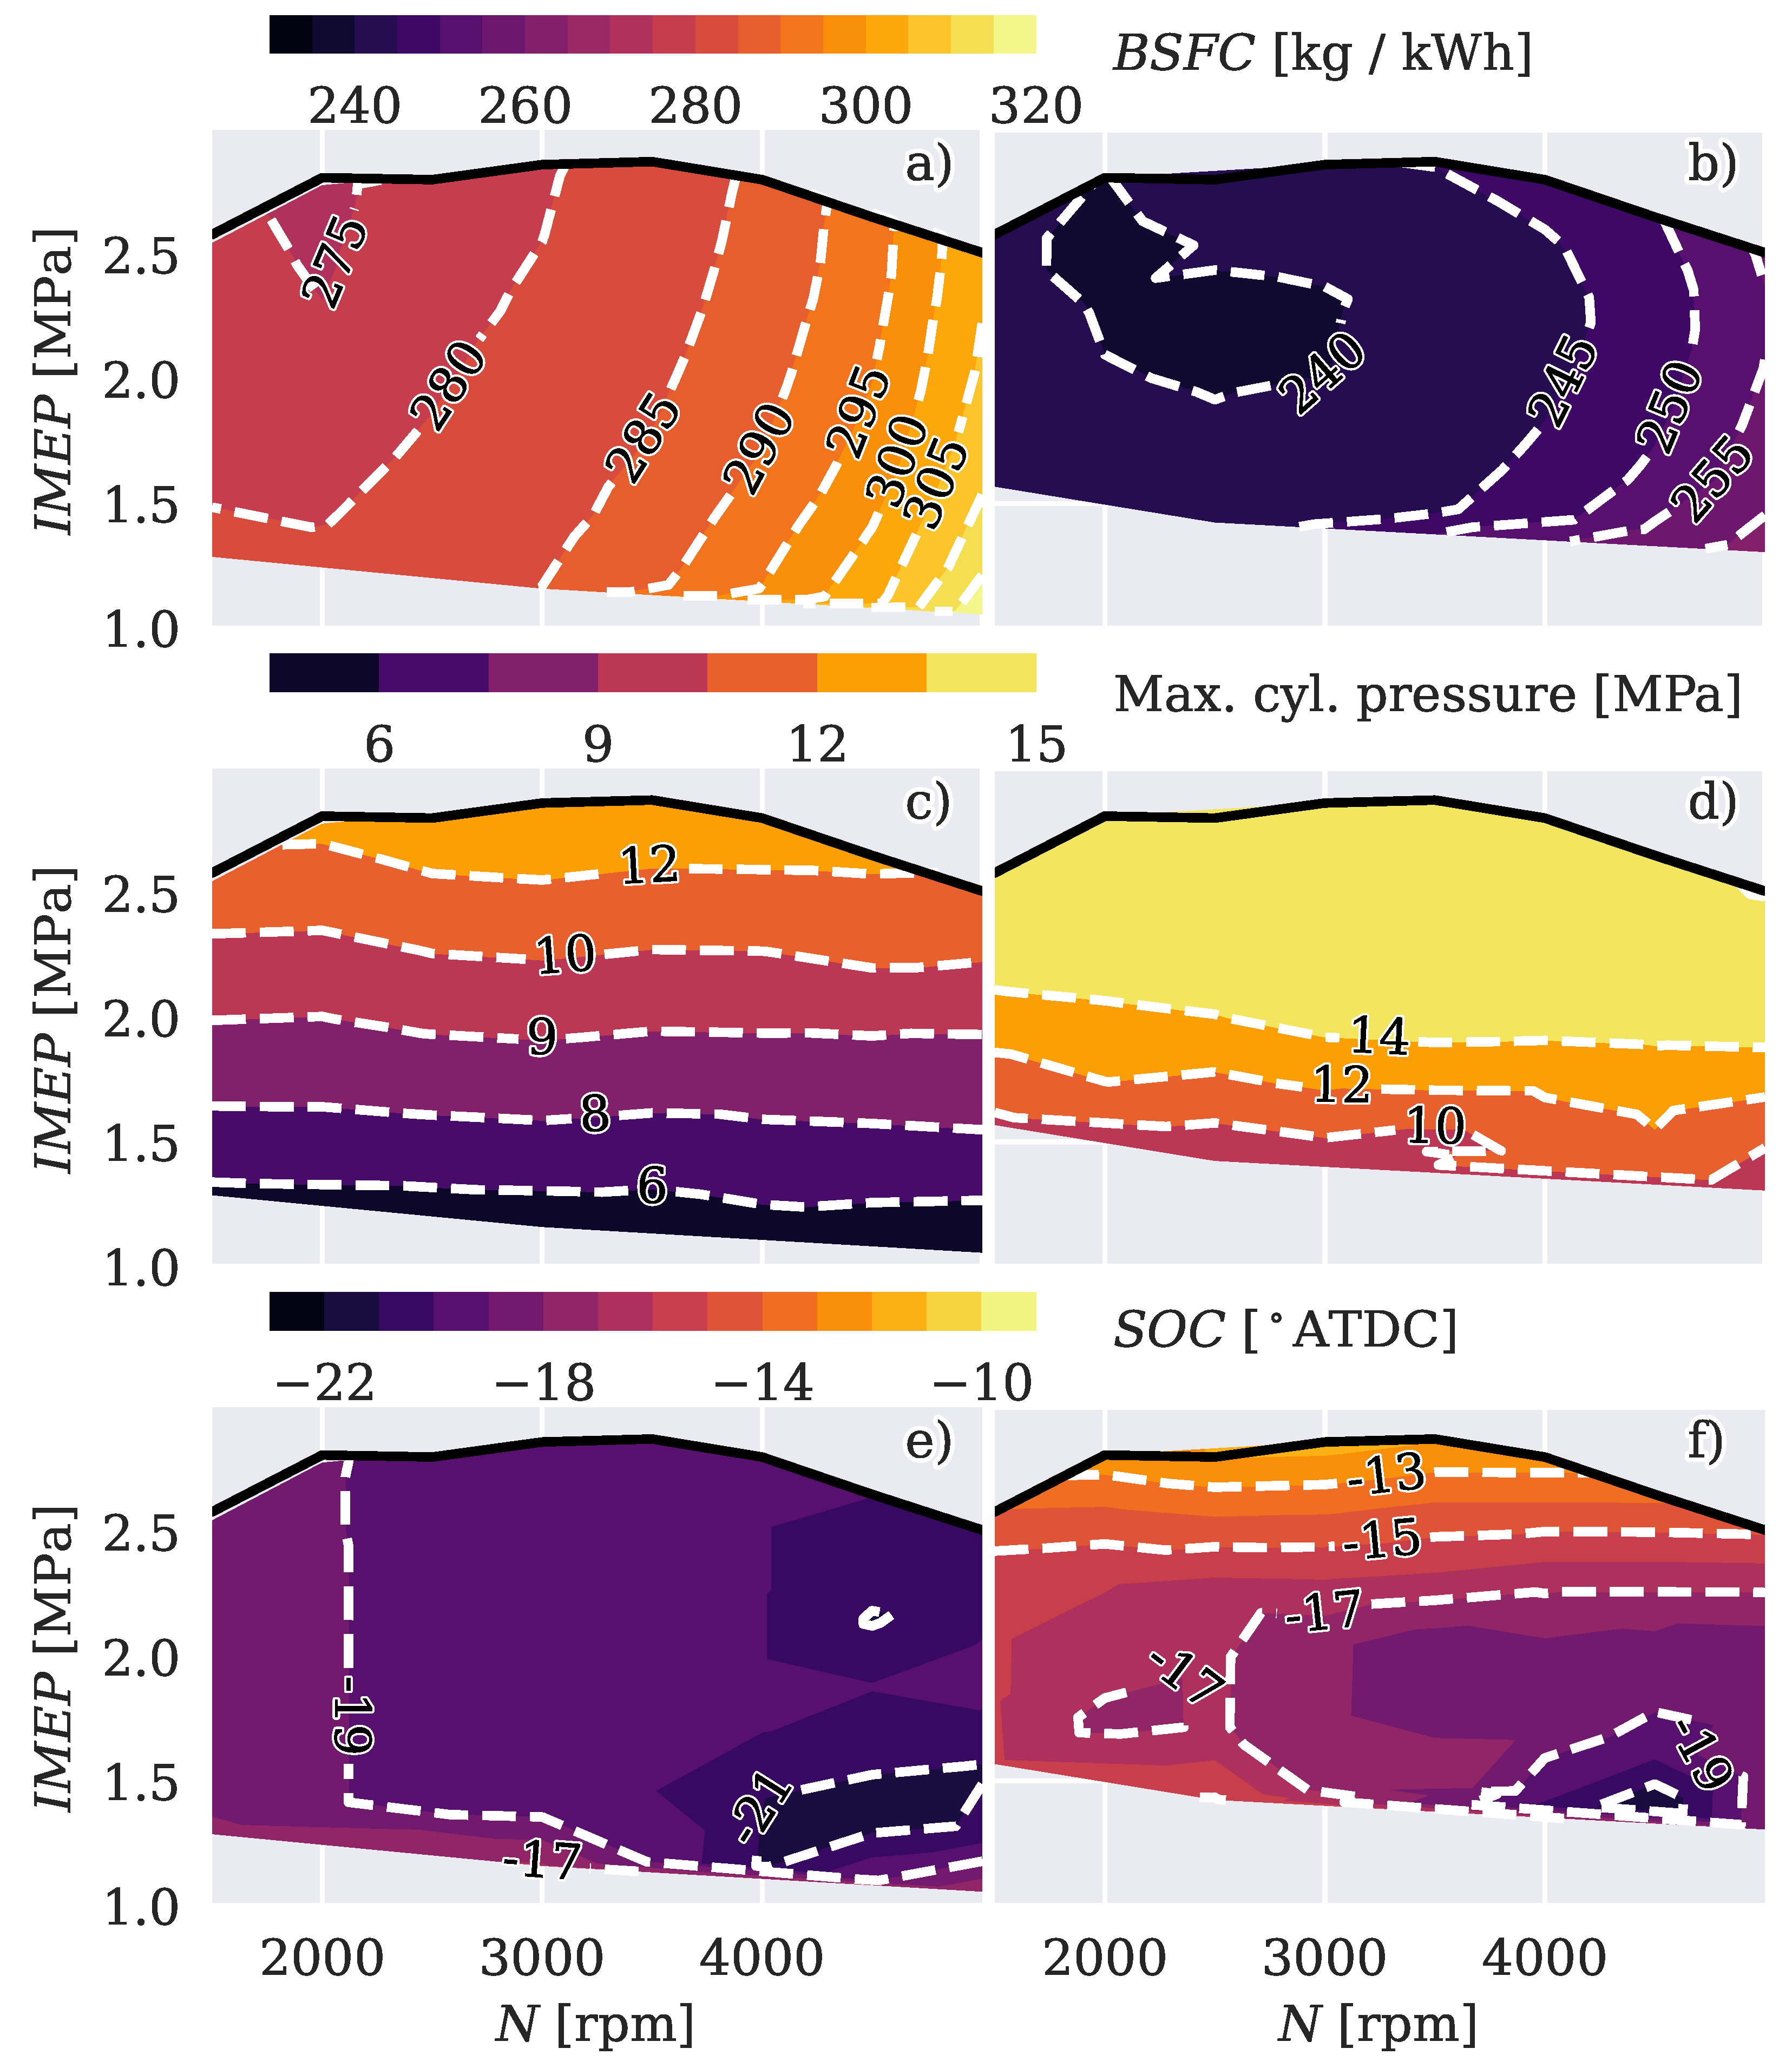
Figure 4.
a), b) Mechanical efficiency, c), d) Friction mean effective pressure and e), f) Pumping mean effective pressure maps using two different engine volumetric compression ratios. a), c), e): CR 9.6. b), d), f): CR 20
Figure 4.
a), b) Mechanical efficiency, c), d) Friction mean effective pressure and e), f) Pumping mean effective pressure maps using two different engine volumetric compression ratios. a), c), e): CR 9.6. b), d), f): CR 20
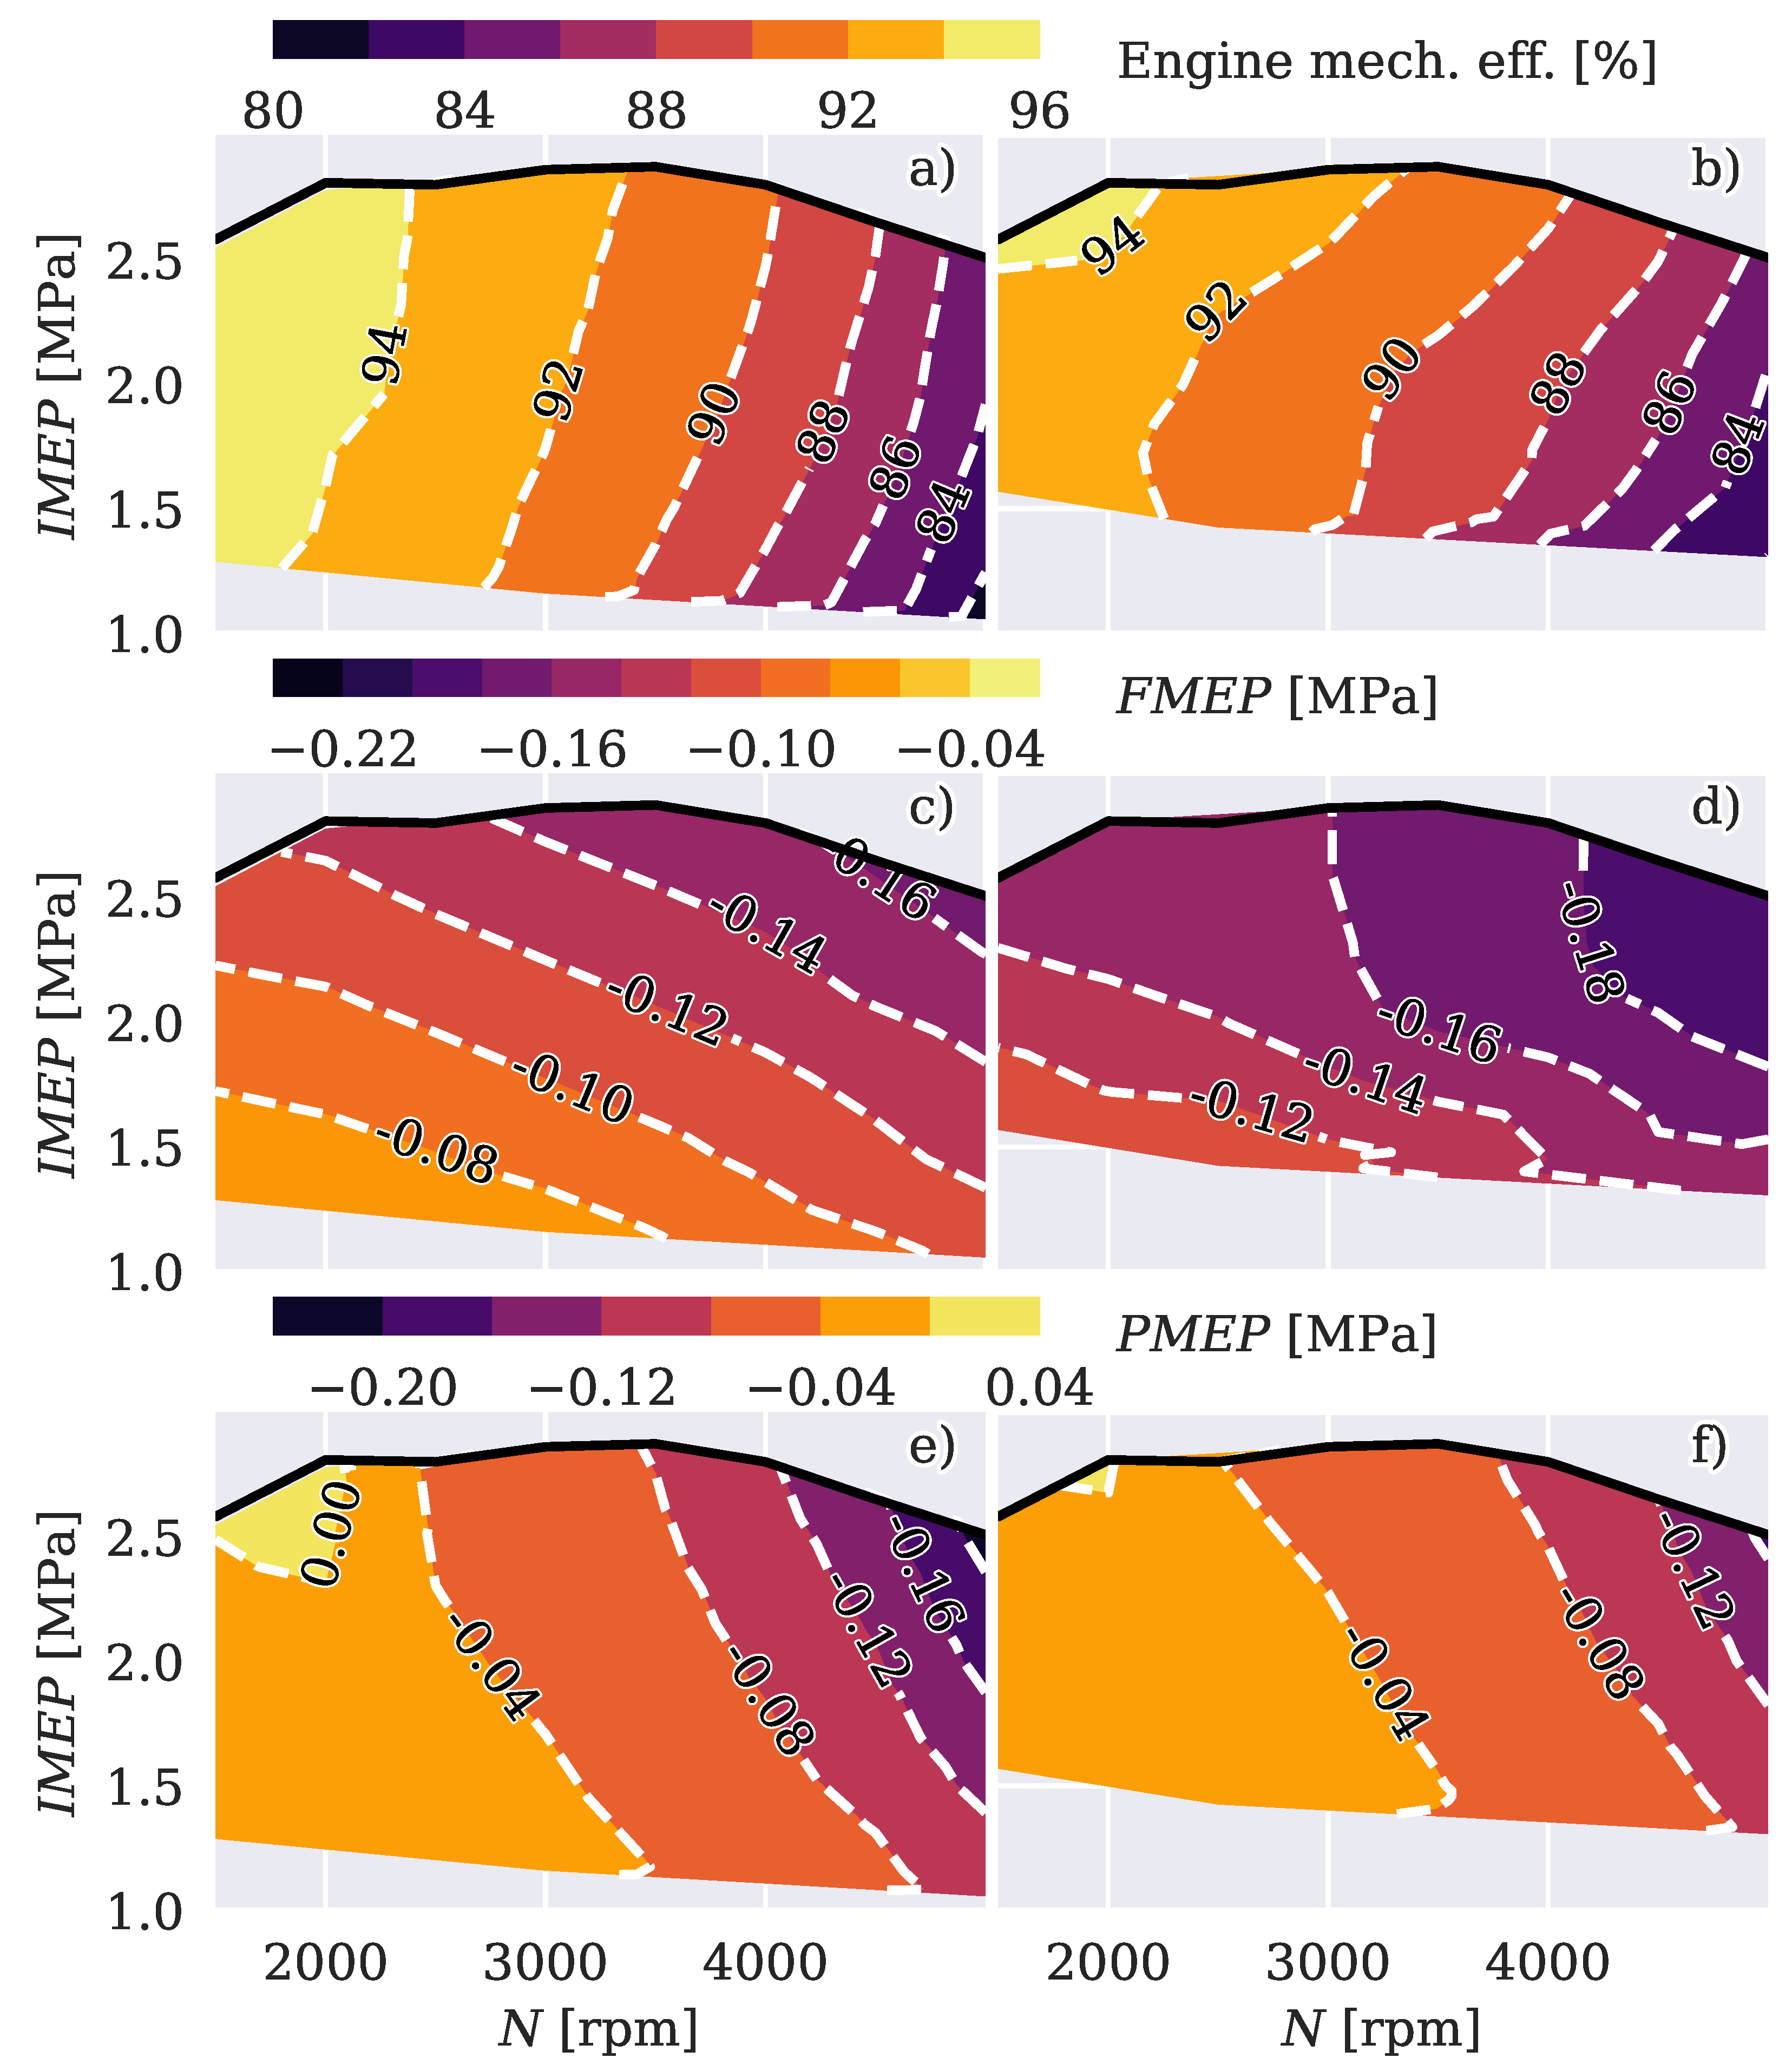
Figure 5.
a), b) Volumetric efficiency, c), d) Intake pressure and e), f) Exhaust temperature maps using two different engine volumetric compression ratios. a), c), e): CR 9.6. b), d), f): CR 20
Figure 5.
a), b) Volumetric efficiency, c), d) Intake pressure and e), f) Exhaust temperature maps using two different engine volumetric compression ratios. a), c), e): CR 9.6. b), d), f): CR 20
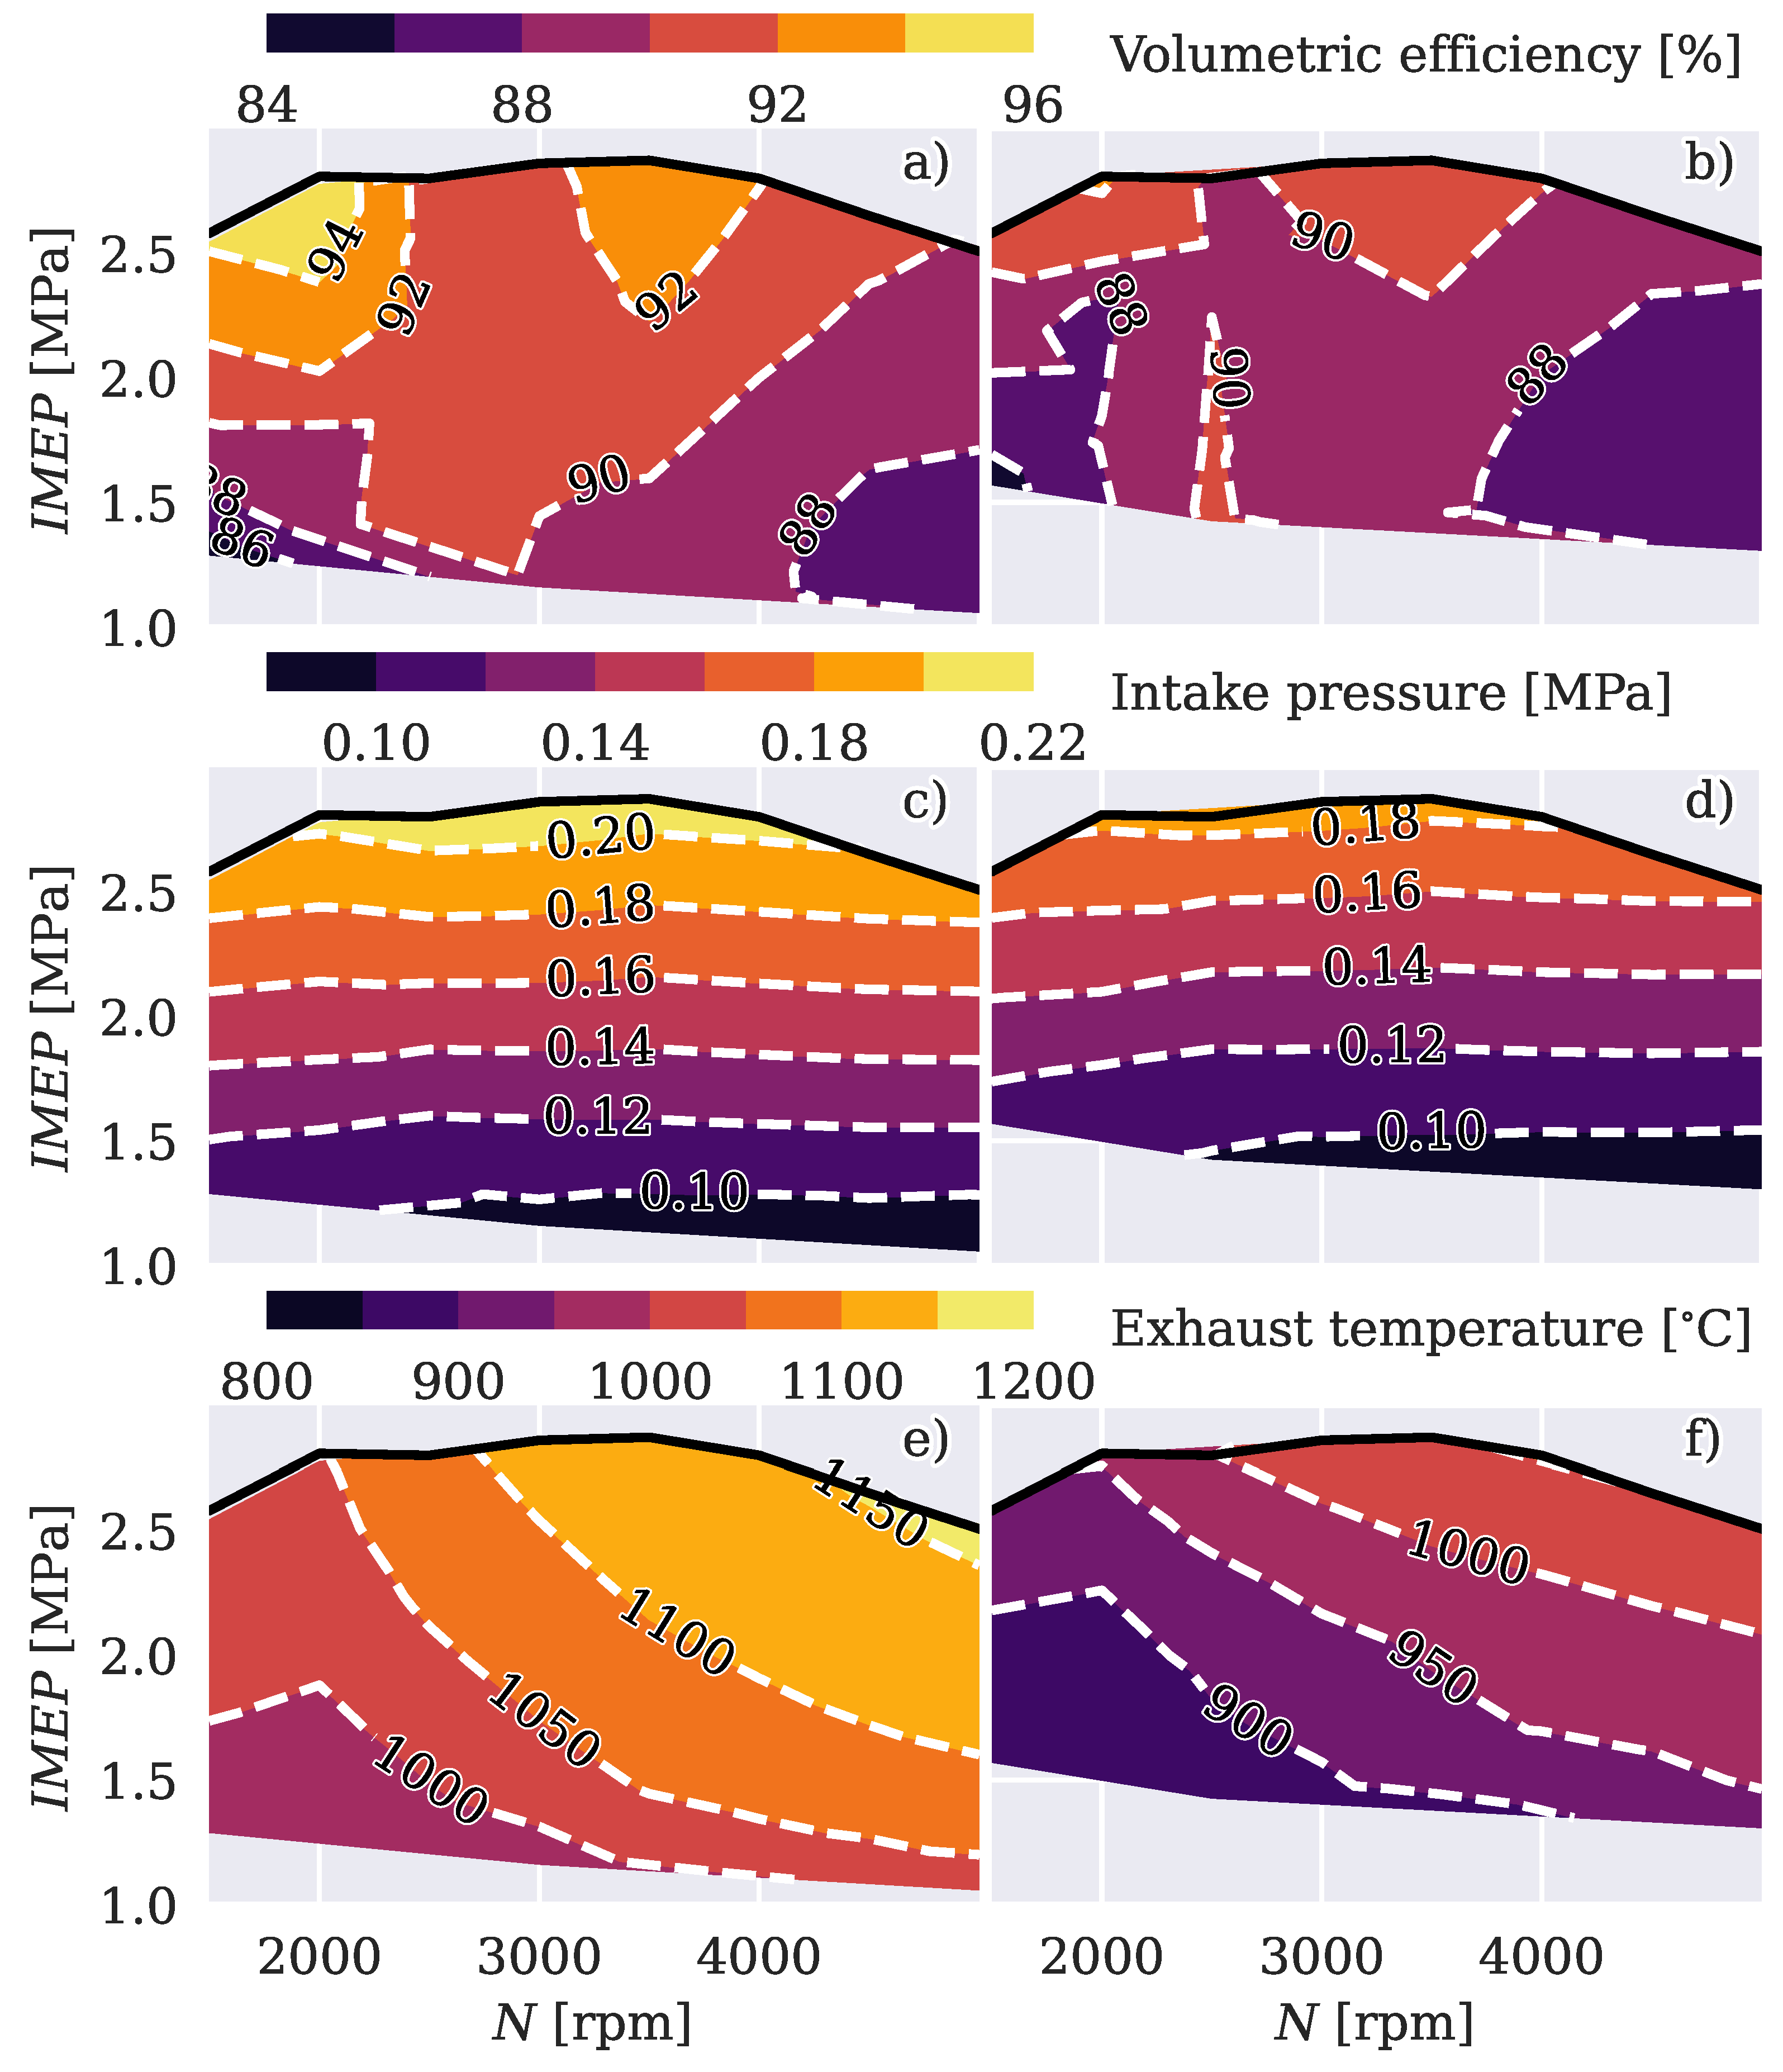
Figure 6.
a), b) O2/EGR compressor, c), d) Low pressure compressor, e), f) High pressure compressor maps for oxygen production using two different engine volumetric compression ratios. a), c), e): CR 9.6. b), d), f): CR 20 across different speeds and altitudes
Figure 6.
a), b) O2/EGR compressor, c), d) Low pressure compressor, e), f) High pressure compressor maps for oxygen production using two different engine volumetric compression ratios. a), c), e): CR 9.6. b), d), f): CR 20 across different speeds and altitudes
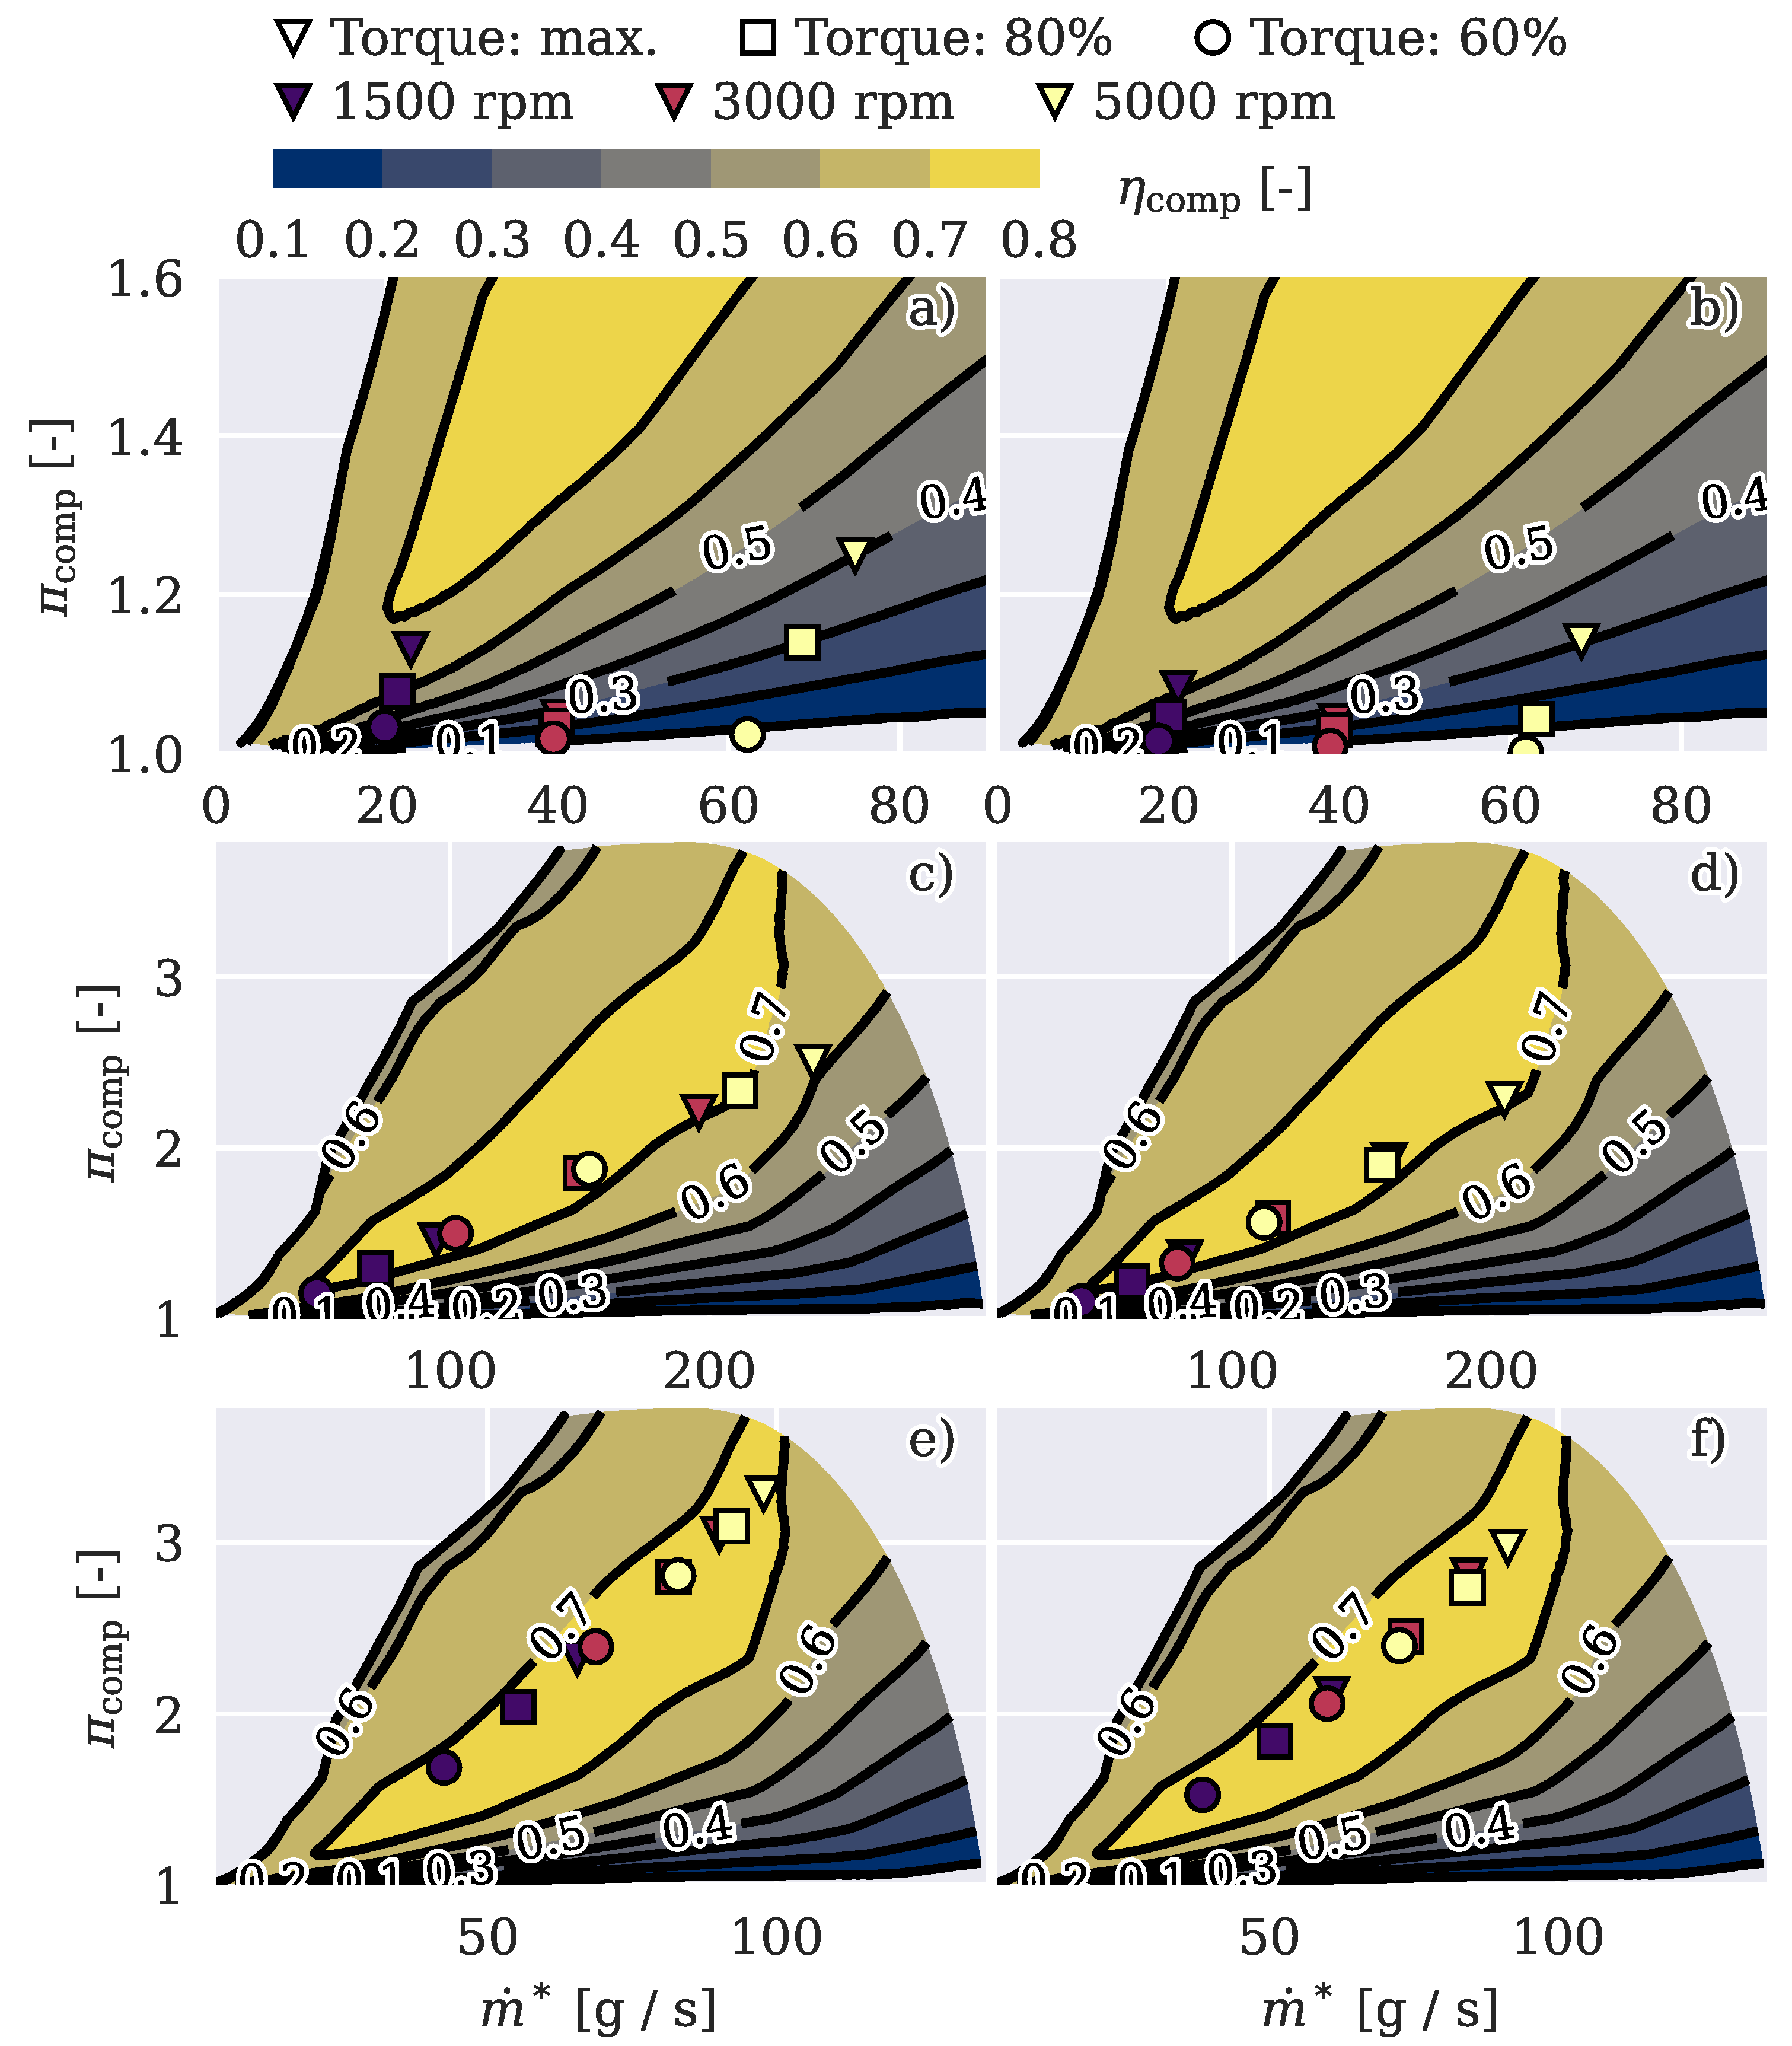
Figure 7.
a), b) Air mass flow, c), d) Air feed pressure maps for oxygen production using two different engine volumetric compression ratios. a), c): CR 9.6. b), d): CR 20
Figure 7.
a), b) Air mass flow, c), d) Air feed pressure maps for oxygen production using two different engine volumetric compression ratios. a), c): CR 9.6. b), d): CR 20
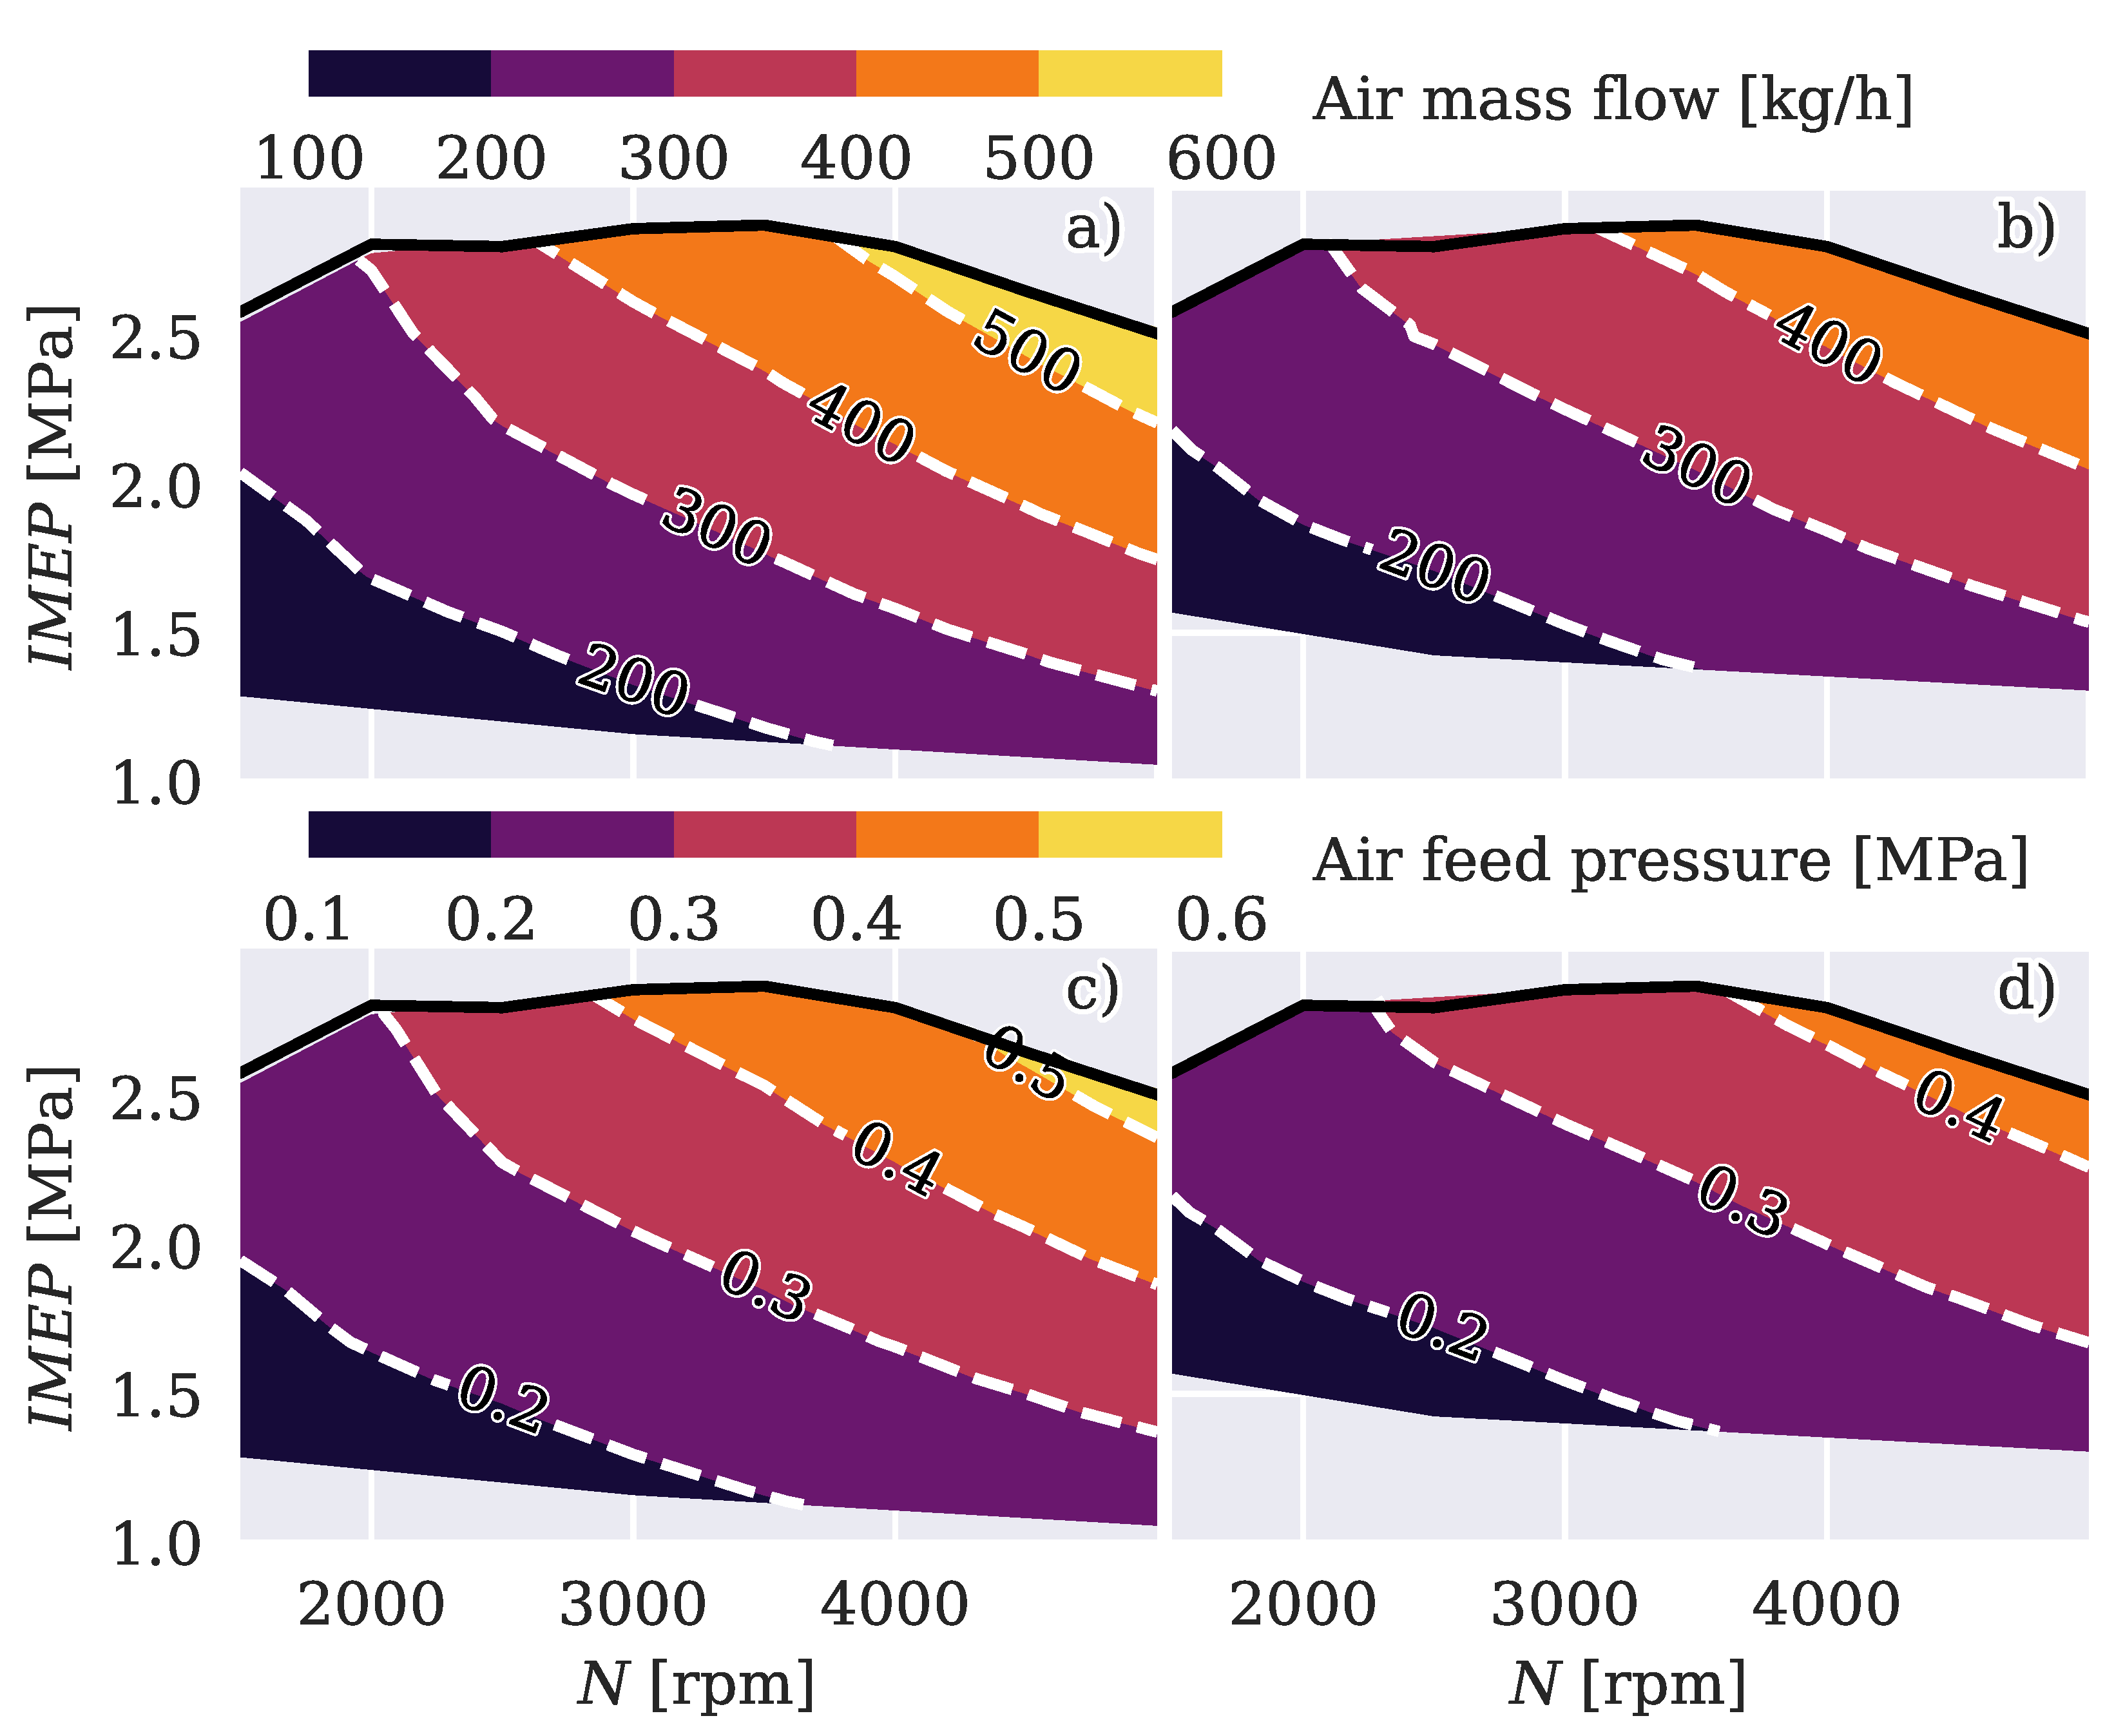
Figure 8.
a), b) Air feed temperature, c), d) Membrane efficiency and e), f) O2 mass flow maps using two different engine volumetric compression ratios. a), c), e): CR 9.6. b), d), f): CR 20
Figure 8.
a), b) Air feed temperature, c), d) Membrane efficiency and e), f) O2 mass flow maps using two different engine volumetric compression ratios. a), c), e): CR 9.6. b), d), f): CR 20
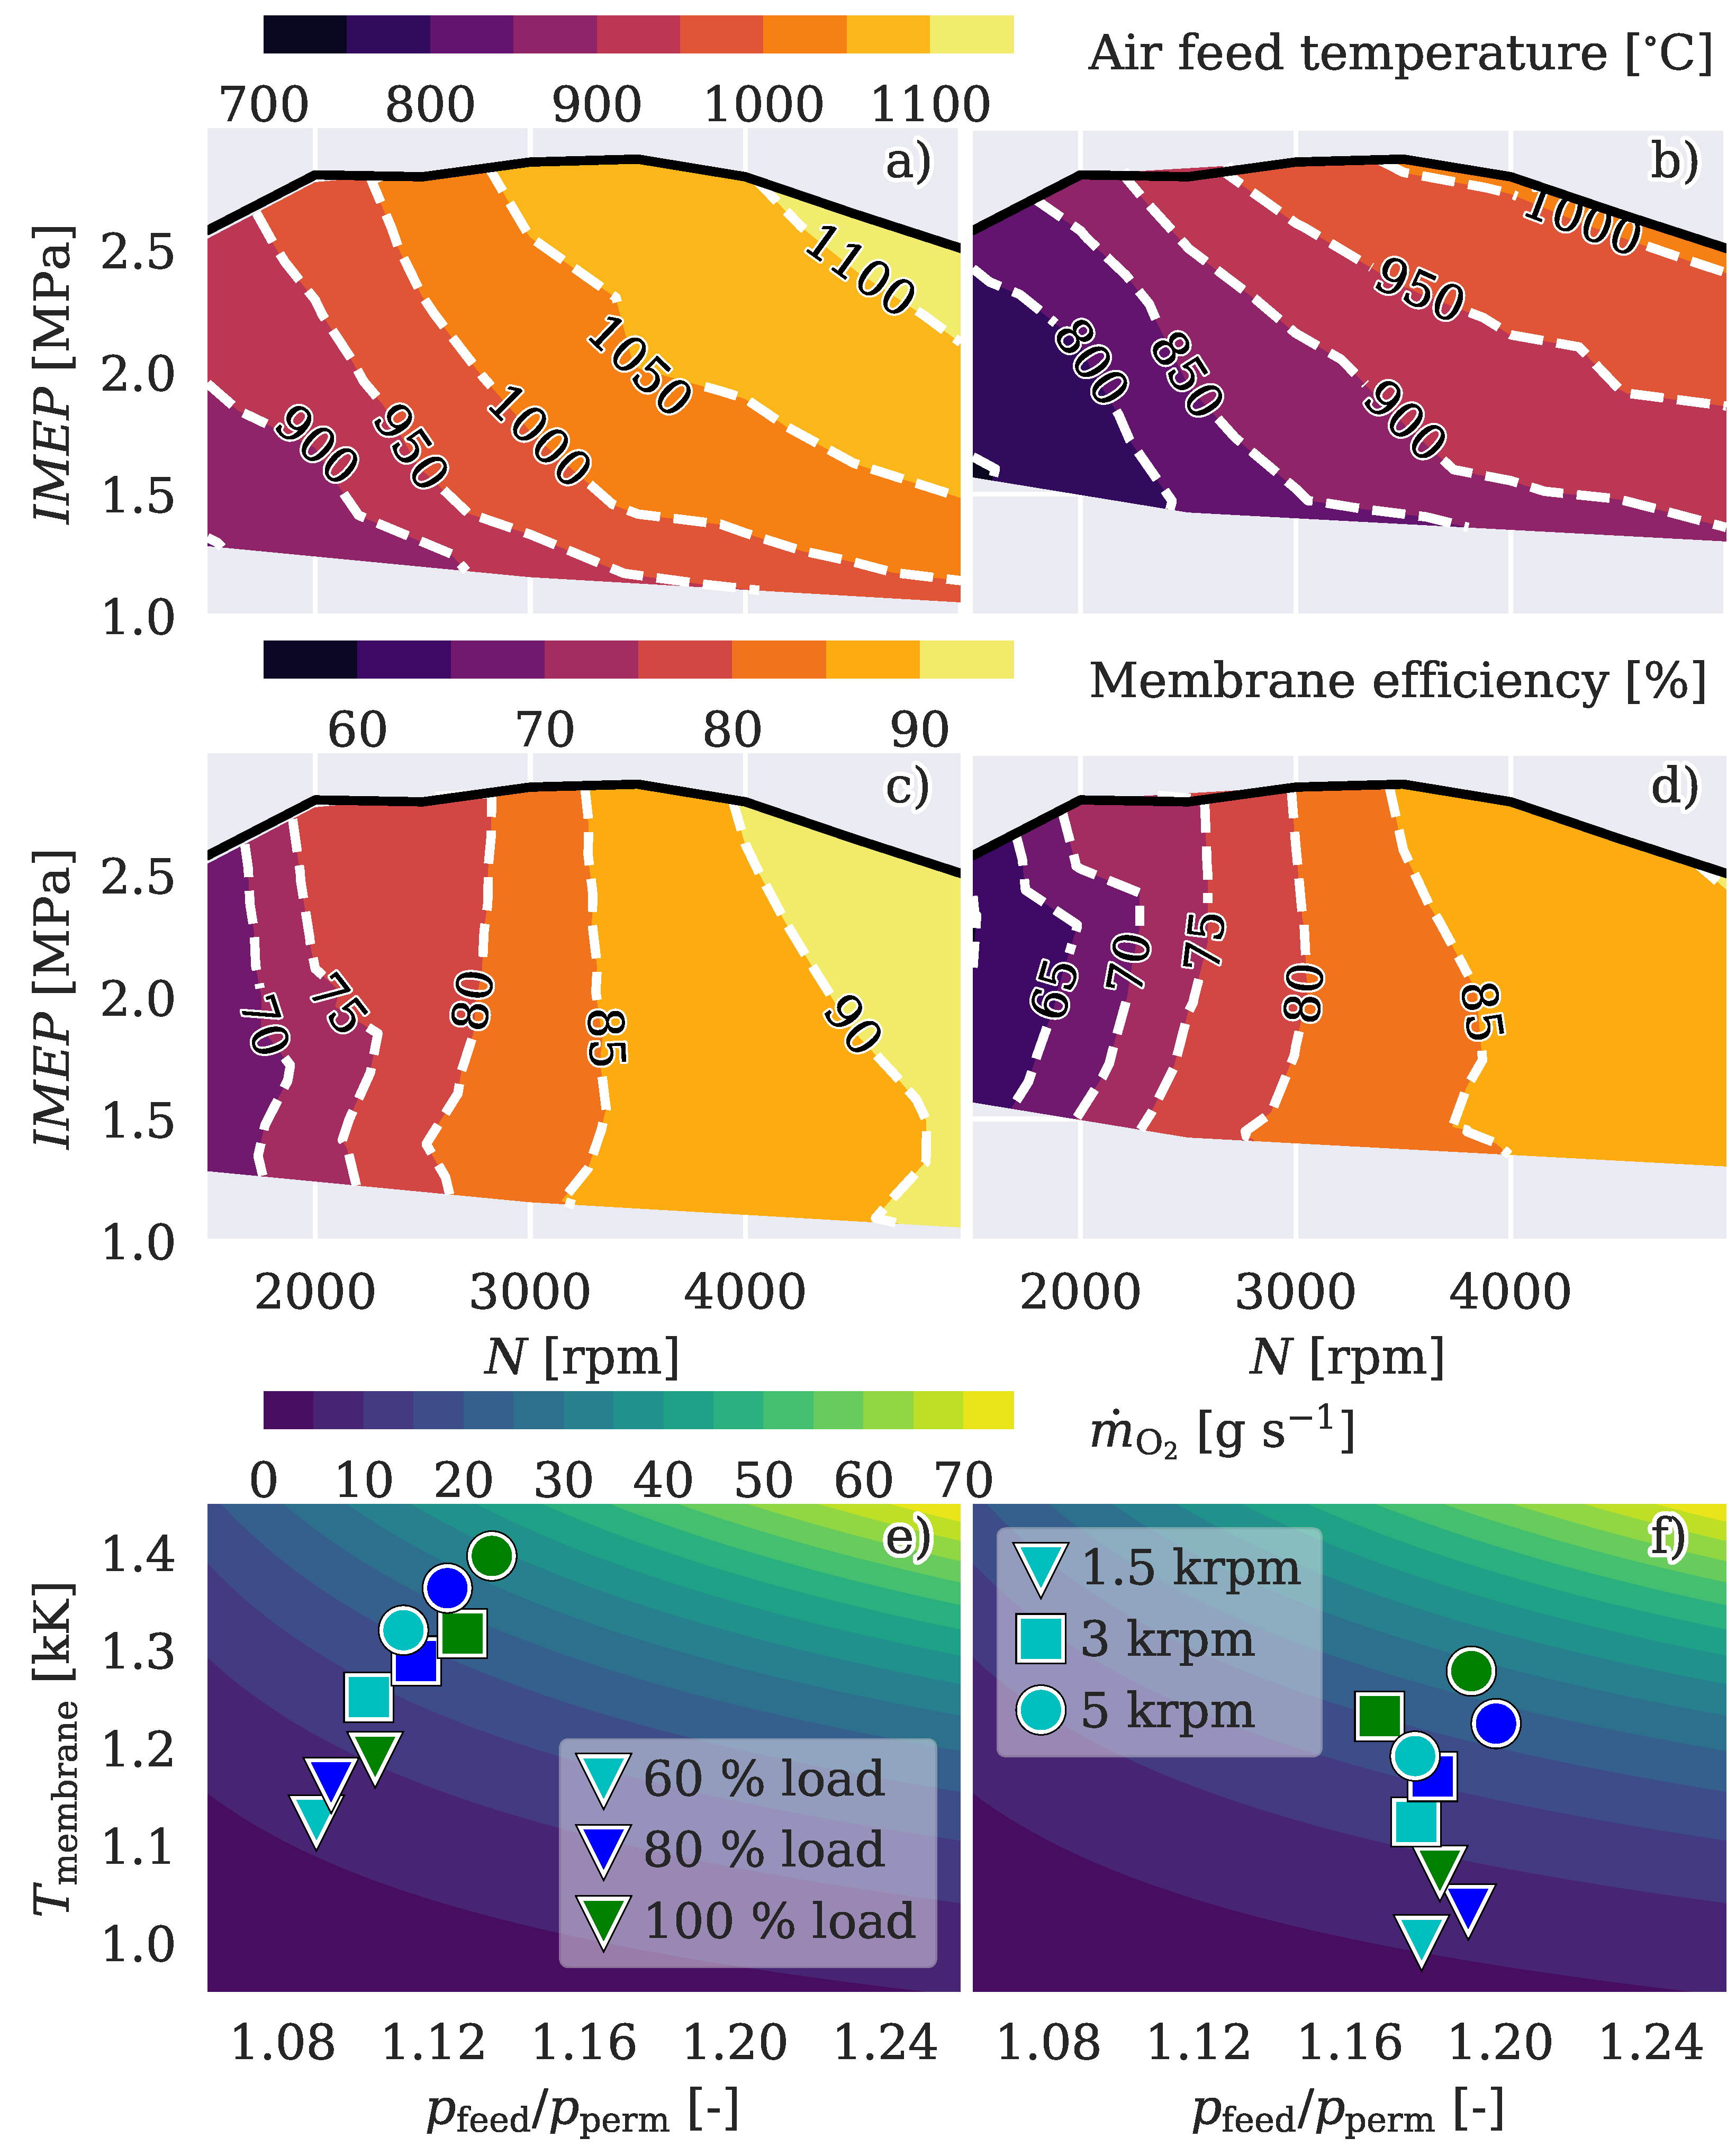
Figure 9.
a), b) Indicator I, and c), d) Indicator I* maps using two different engine volumetric compression ratios. a), c)): CR 9.6. b), d): CR 20
Figure 9.
a), b) Indicator I, and c), d) Indicator I* maps using two different engine volumetric compression ratios. a), c)): CR 9.6. b), d): CR 20
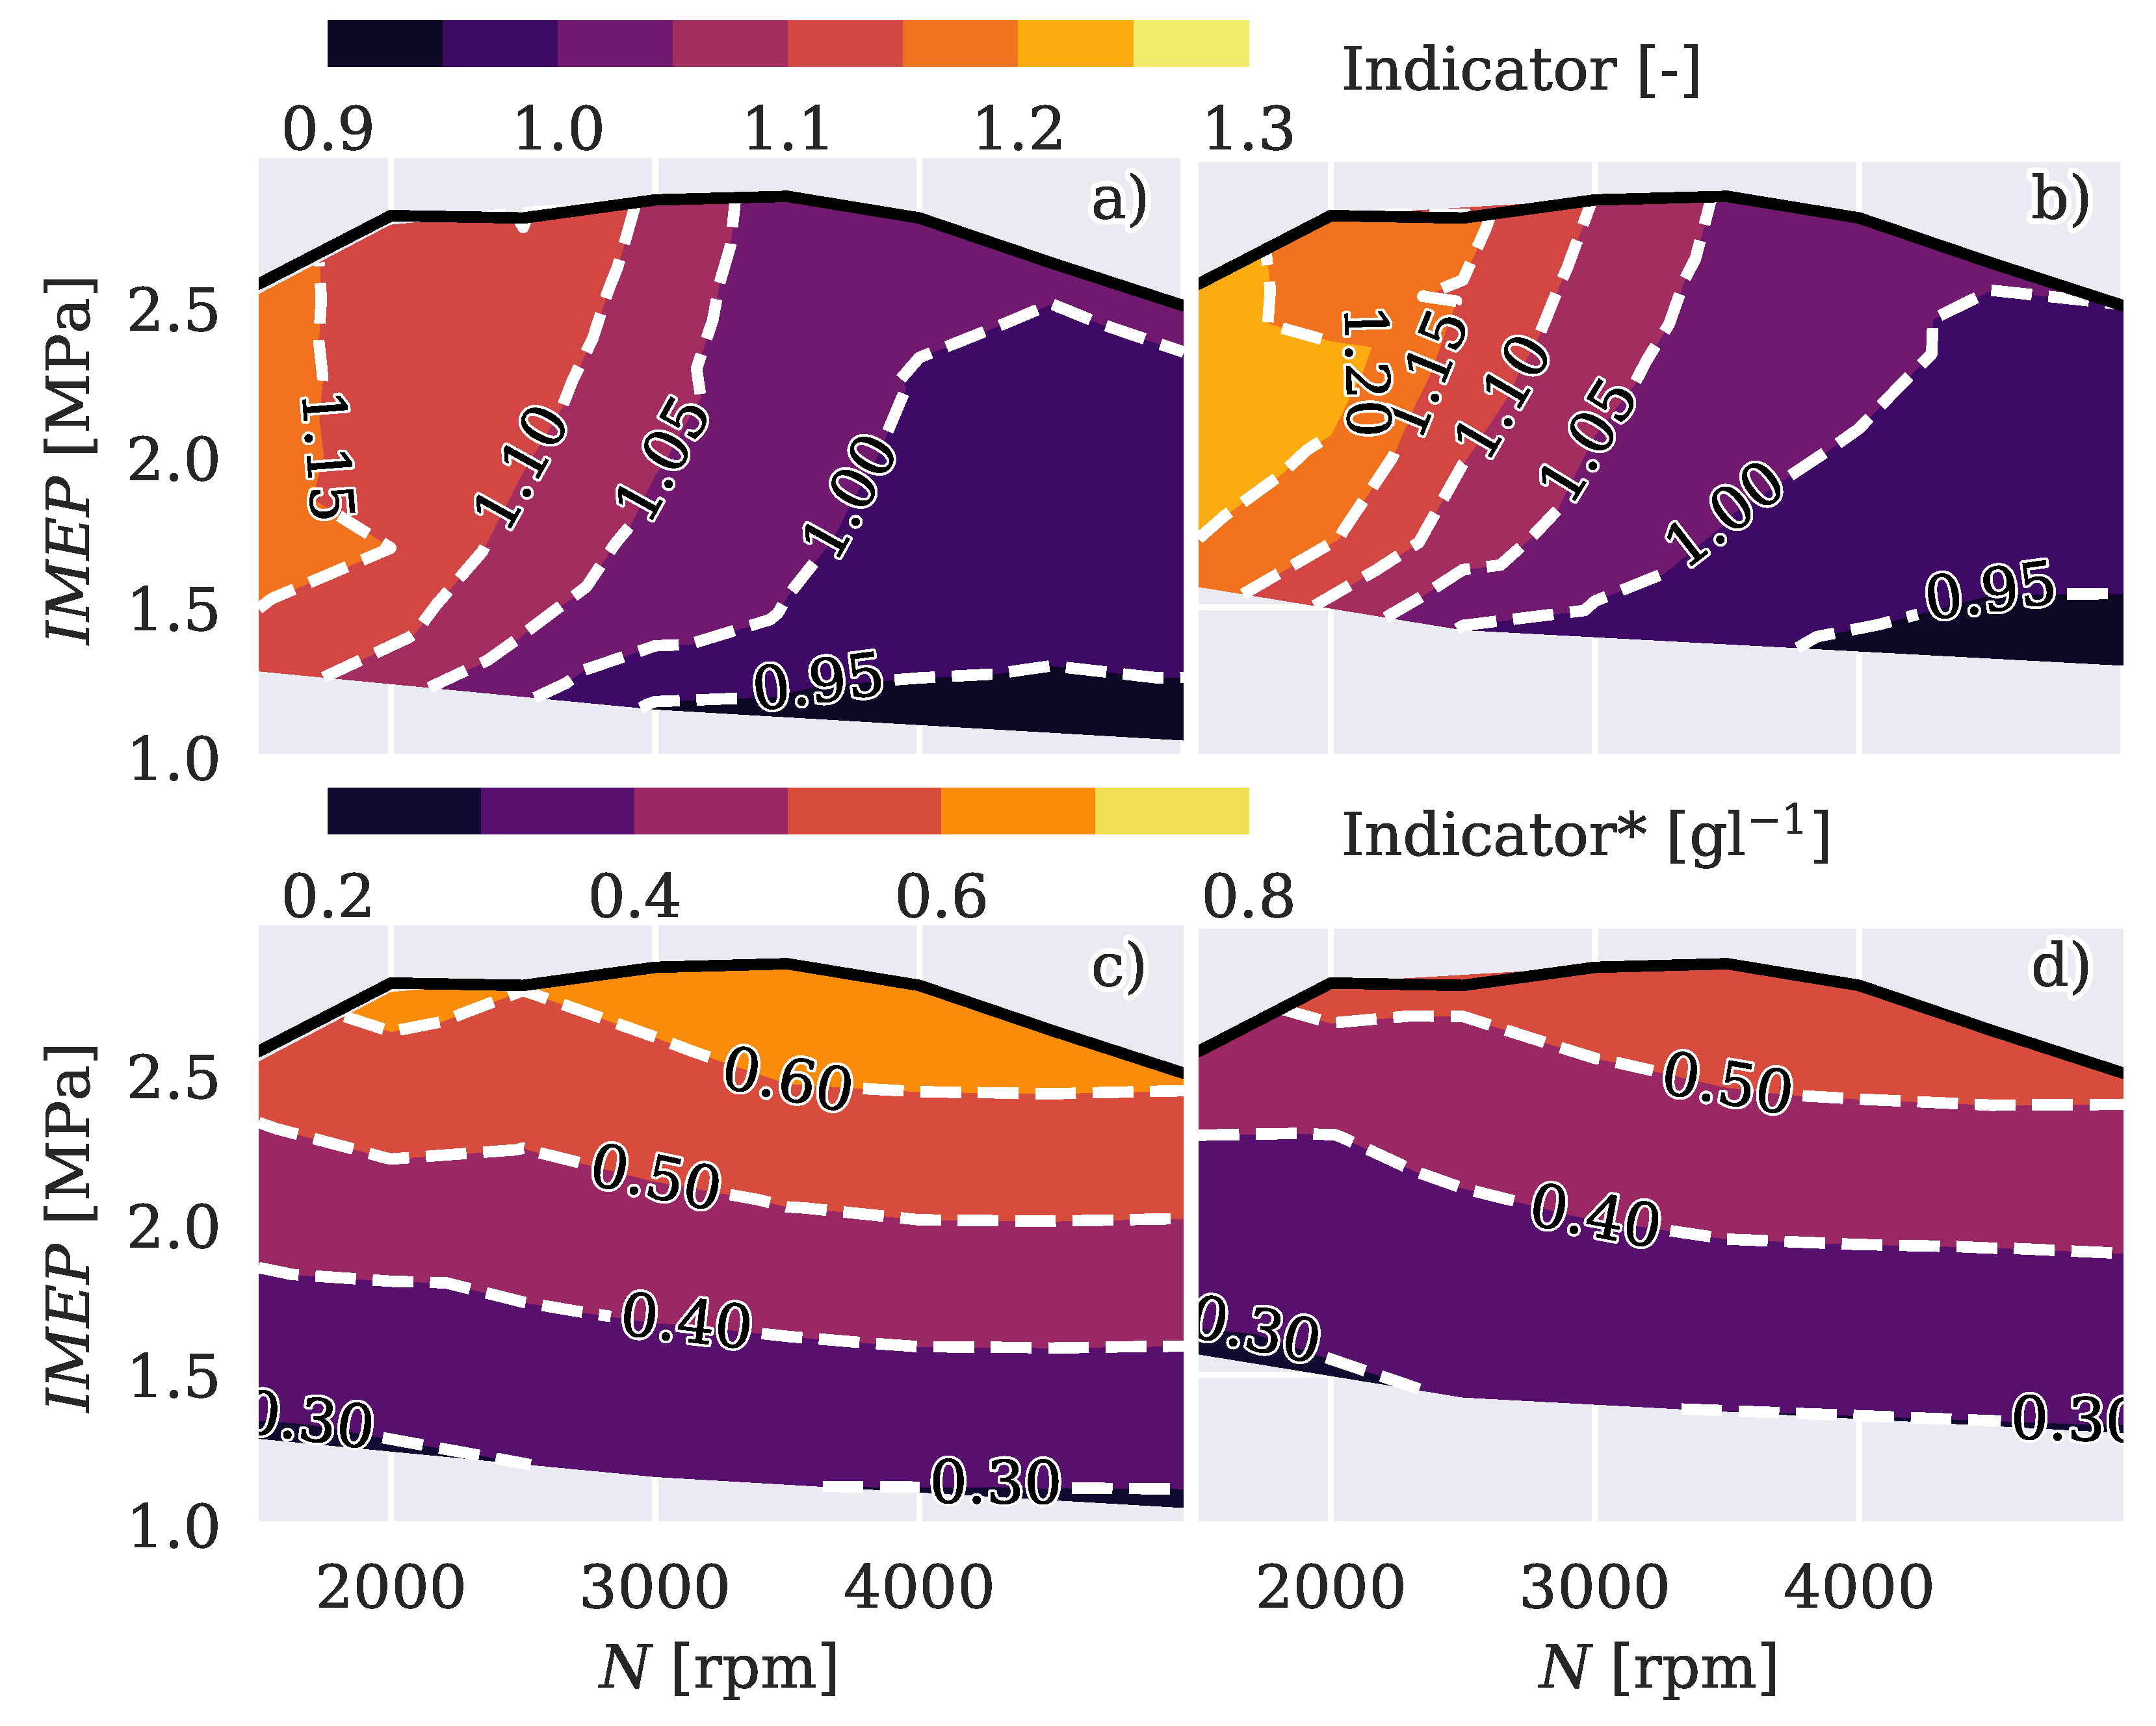
Figure 10.
a), b) Power and c), d) Brake specific fuel consumption maps using two different engine volumetric compression ratios. a), c): CR 9.6. b), d): CR 20
Figure 10.
a), b) Power and c), d) Brake specific fuel consumption maps using two different engine volumetric compression ratios. a), c): CR 9.6. b), d): CR 20
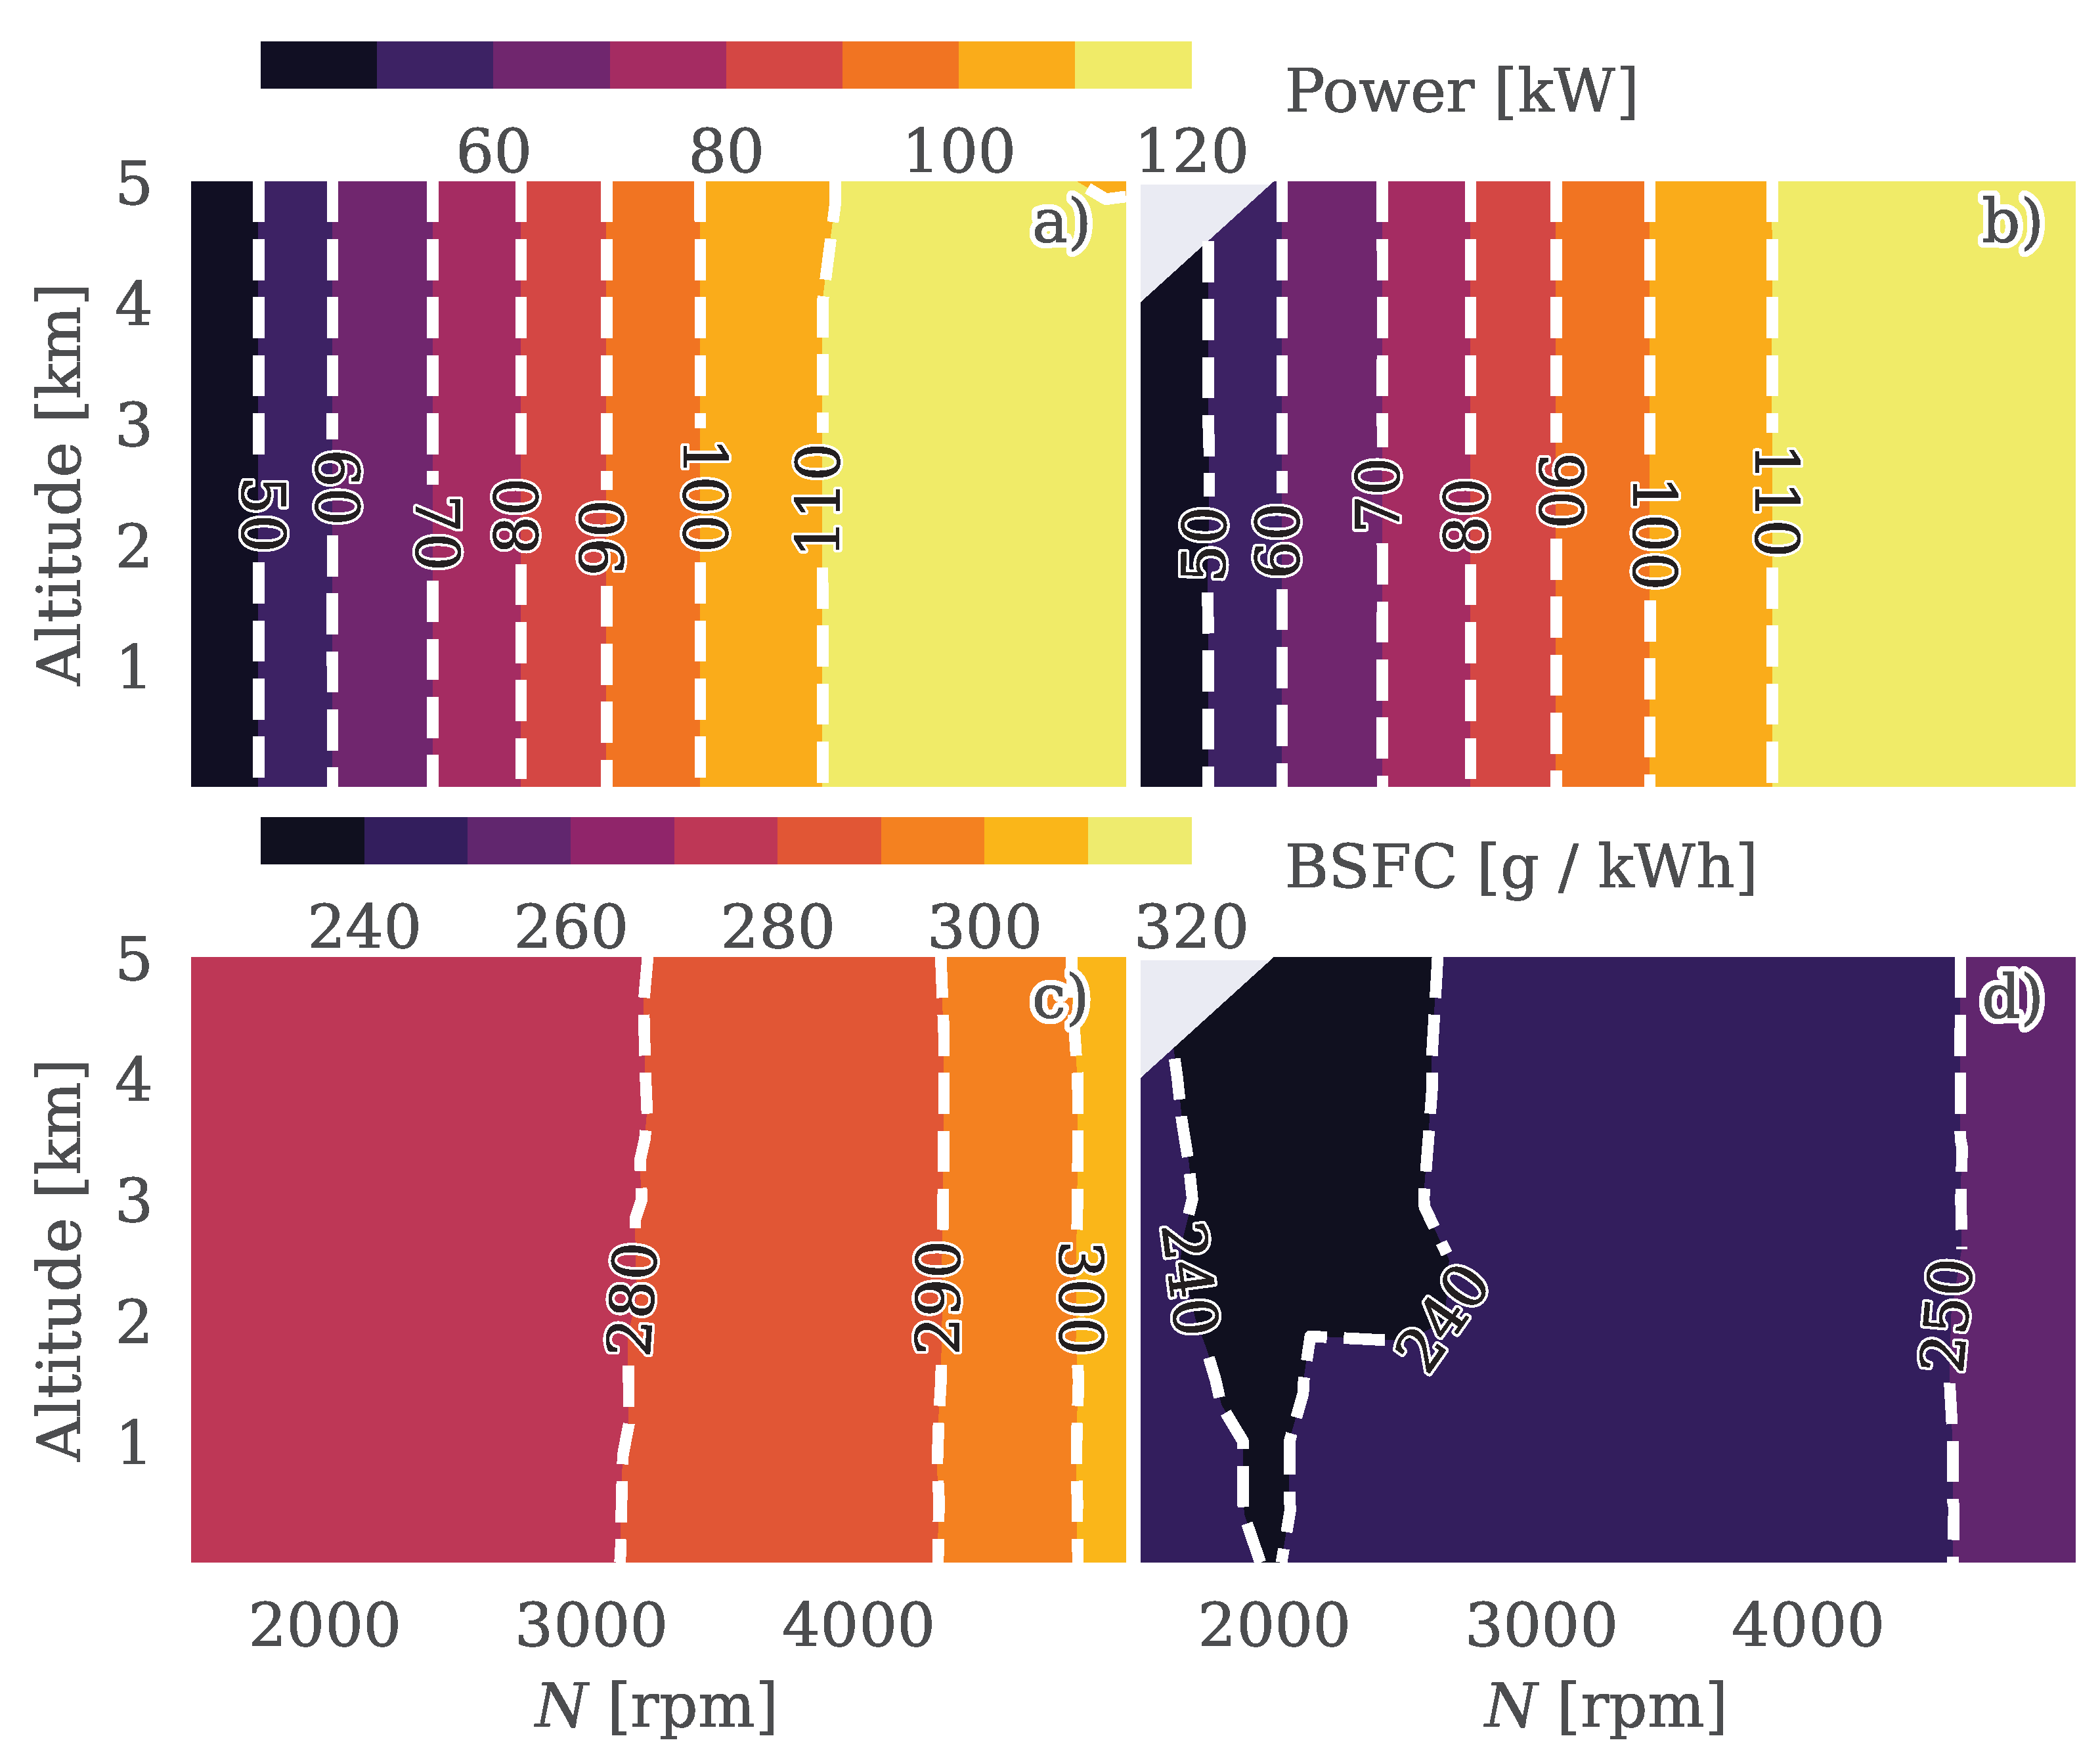
Figure 11.
a), b) O2/EGR compressor, c), d) Low pressure compressor, e), f) High pressure compressor maps for oxygen production using two different engine volumetric compression ratios. a), c), e): CR 9.6. b), d), f): CR 20 across different speeds and altitudes
Figure 11.
a), b) O2/EGR compressor, c), d) Low pressure compressor, e), f) High pressure compressor maps for oxygen production using two different engine volumetric compression ratios. a), c), e): CR 9.6. b), d), f): CR 20 across different speeds and altitudes
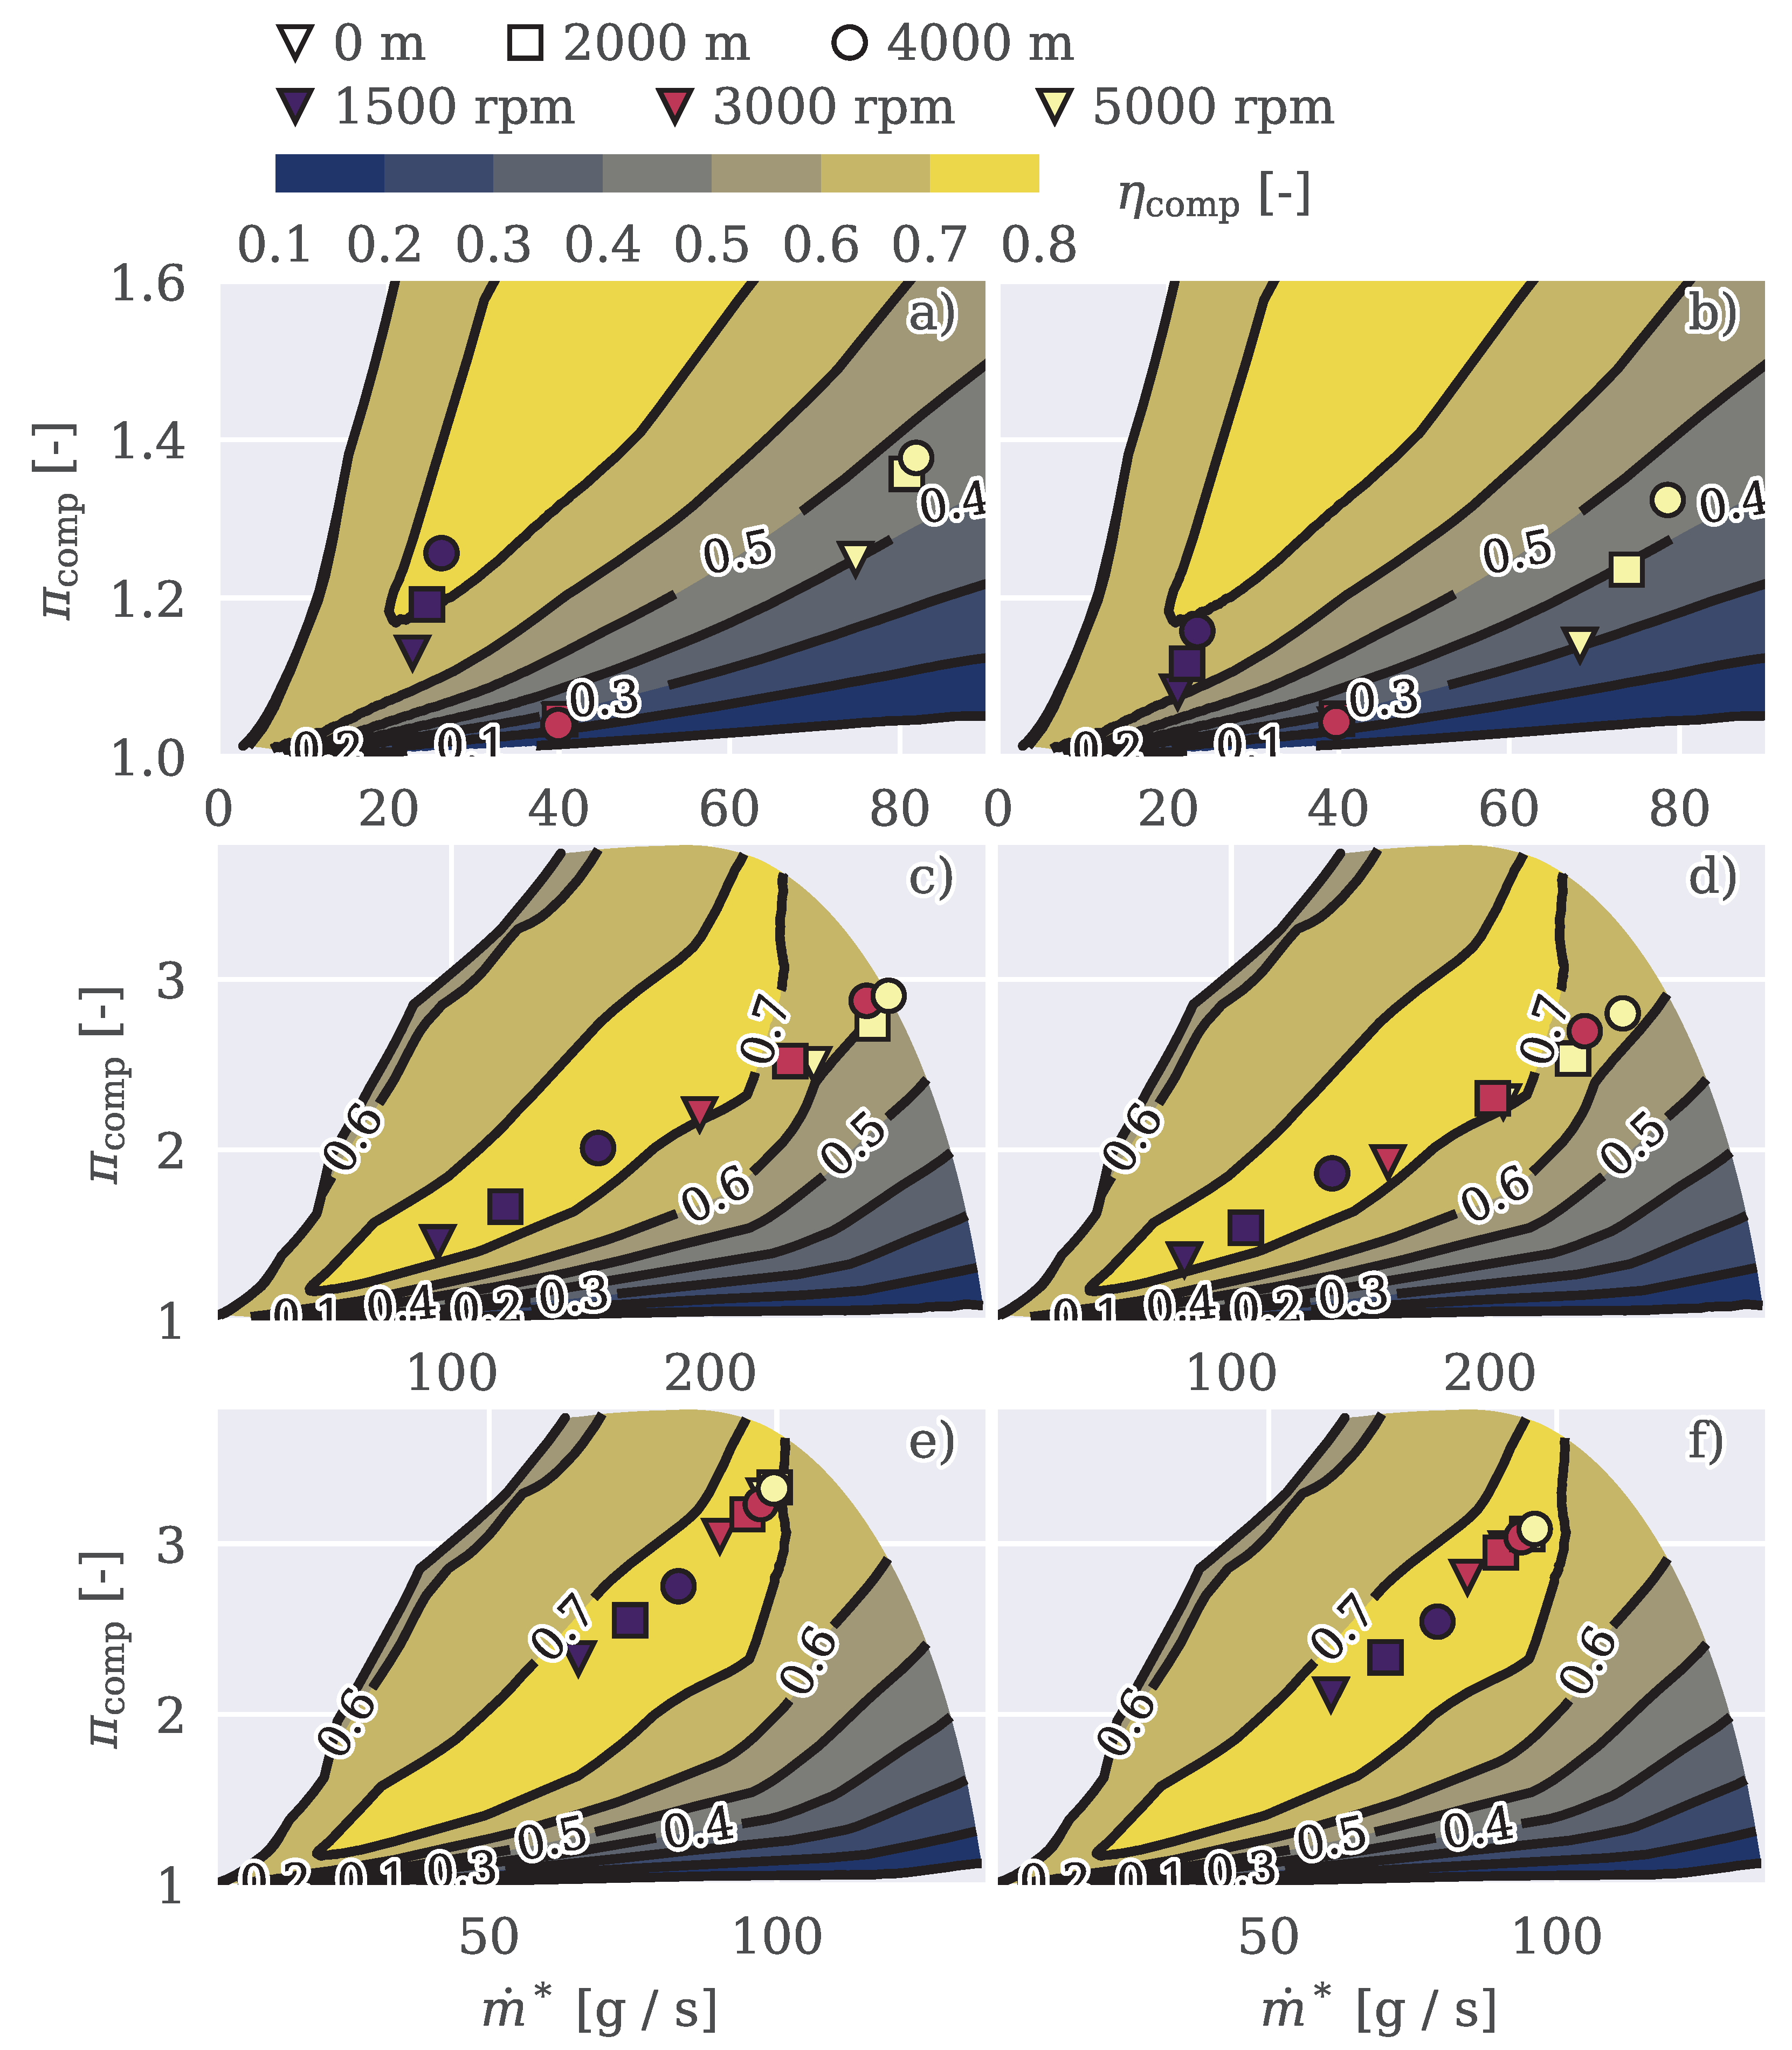
Figure 12.
a), b) Air mass flow and c), d) Air feed pressure maps for O2 production at different altitude conditions using two different engine volumetric compression ratios. a), c): CR 9.6. b), d): CR 20
Figure 12.
a), b) Air mass flow and c), d) Air feed pressure maps for O2 production at different altitude conditions using two different engine volumetric compression ratios. a), c): CR 9.6. b), d): CR 20
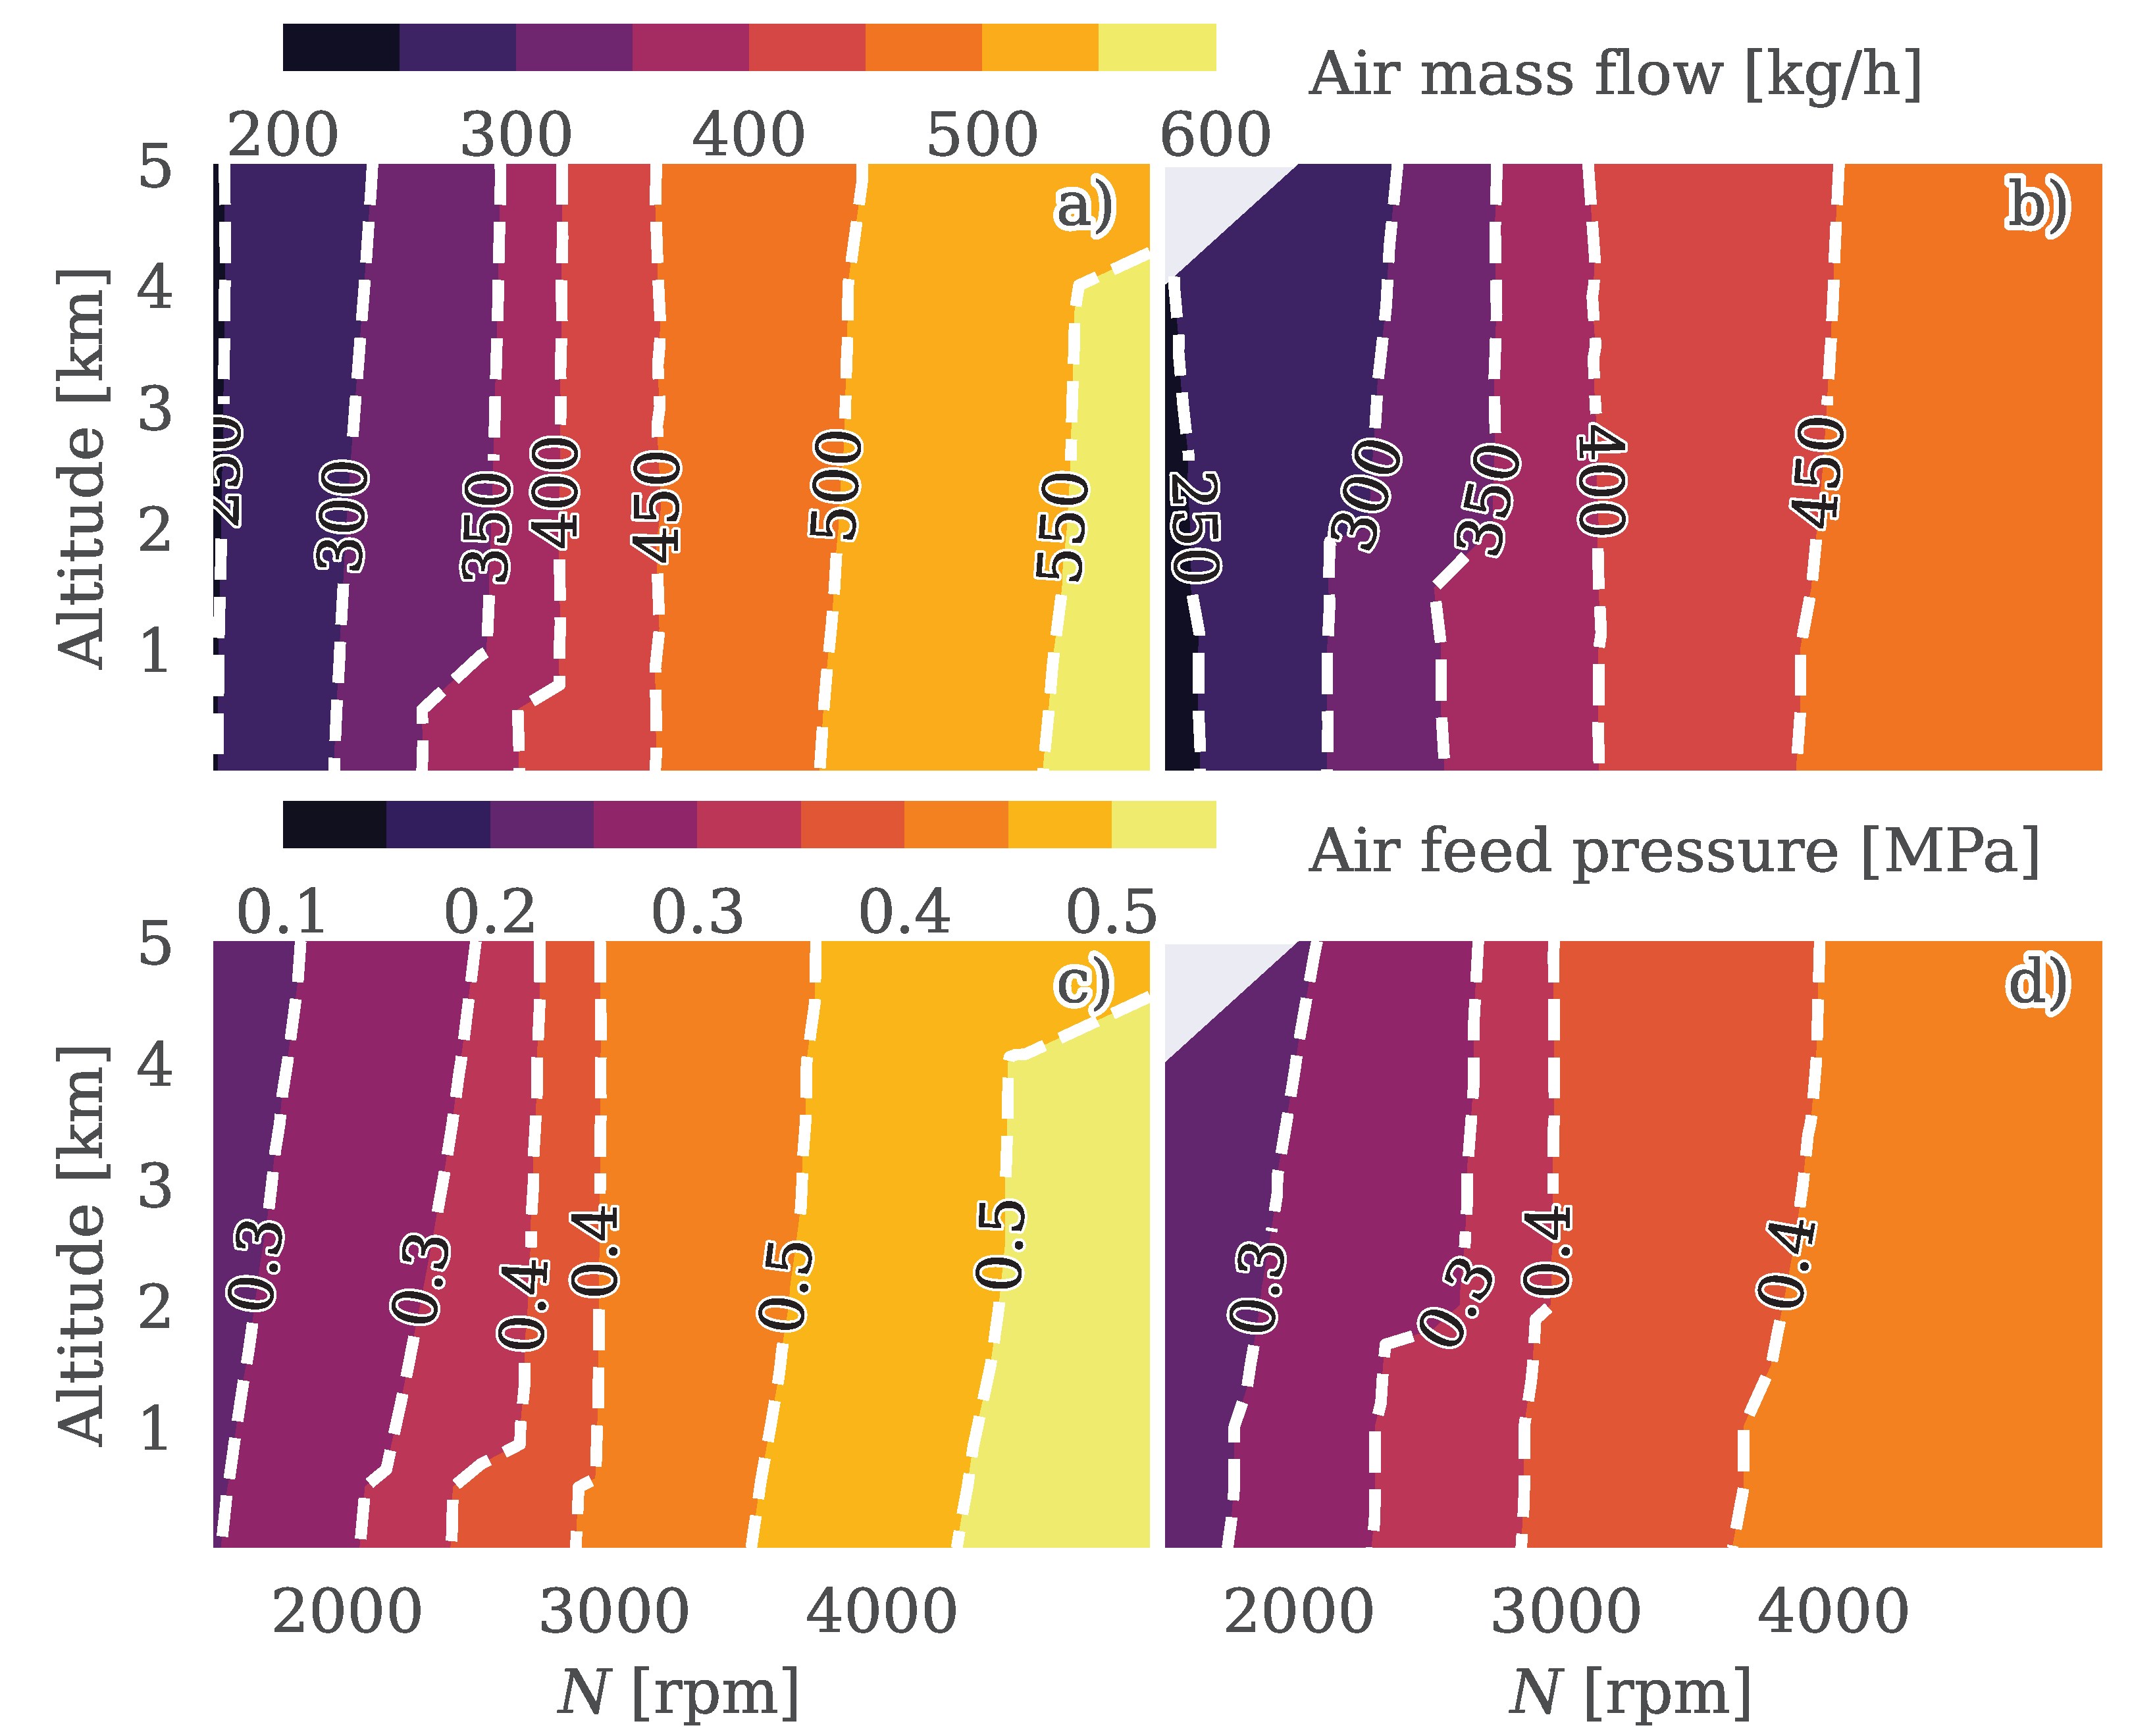
Figure 13.
a), b) Air feed temperature and c), d) Oxygen mass flow maps for O2 production at different altitude conditions using two different engine volumetric compression ratios. a), c): CR 9.6. b), d): CR 20
Figure 13.
a), b) Air feed temperature and c), d) Oxygen mass flow maps for O2 production at different altitude conditions using two different engine volumetric compression ratios. a), c): CR 9.6. b), d): CR 20
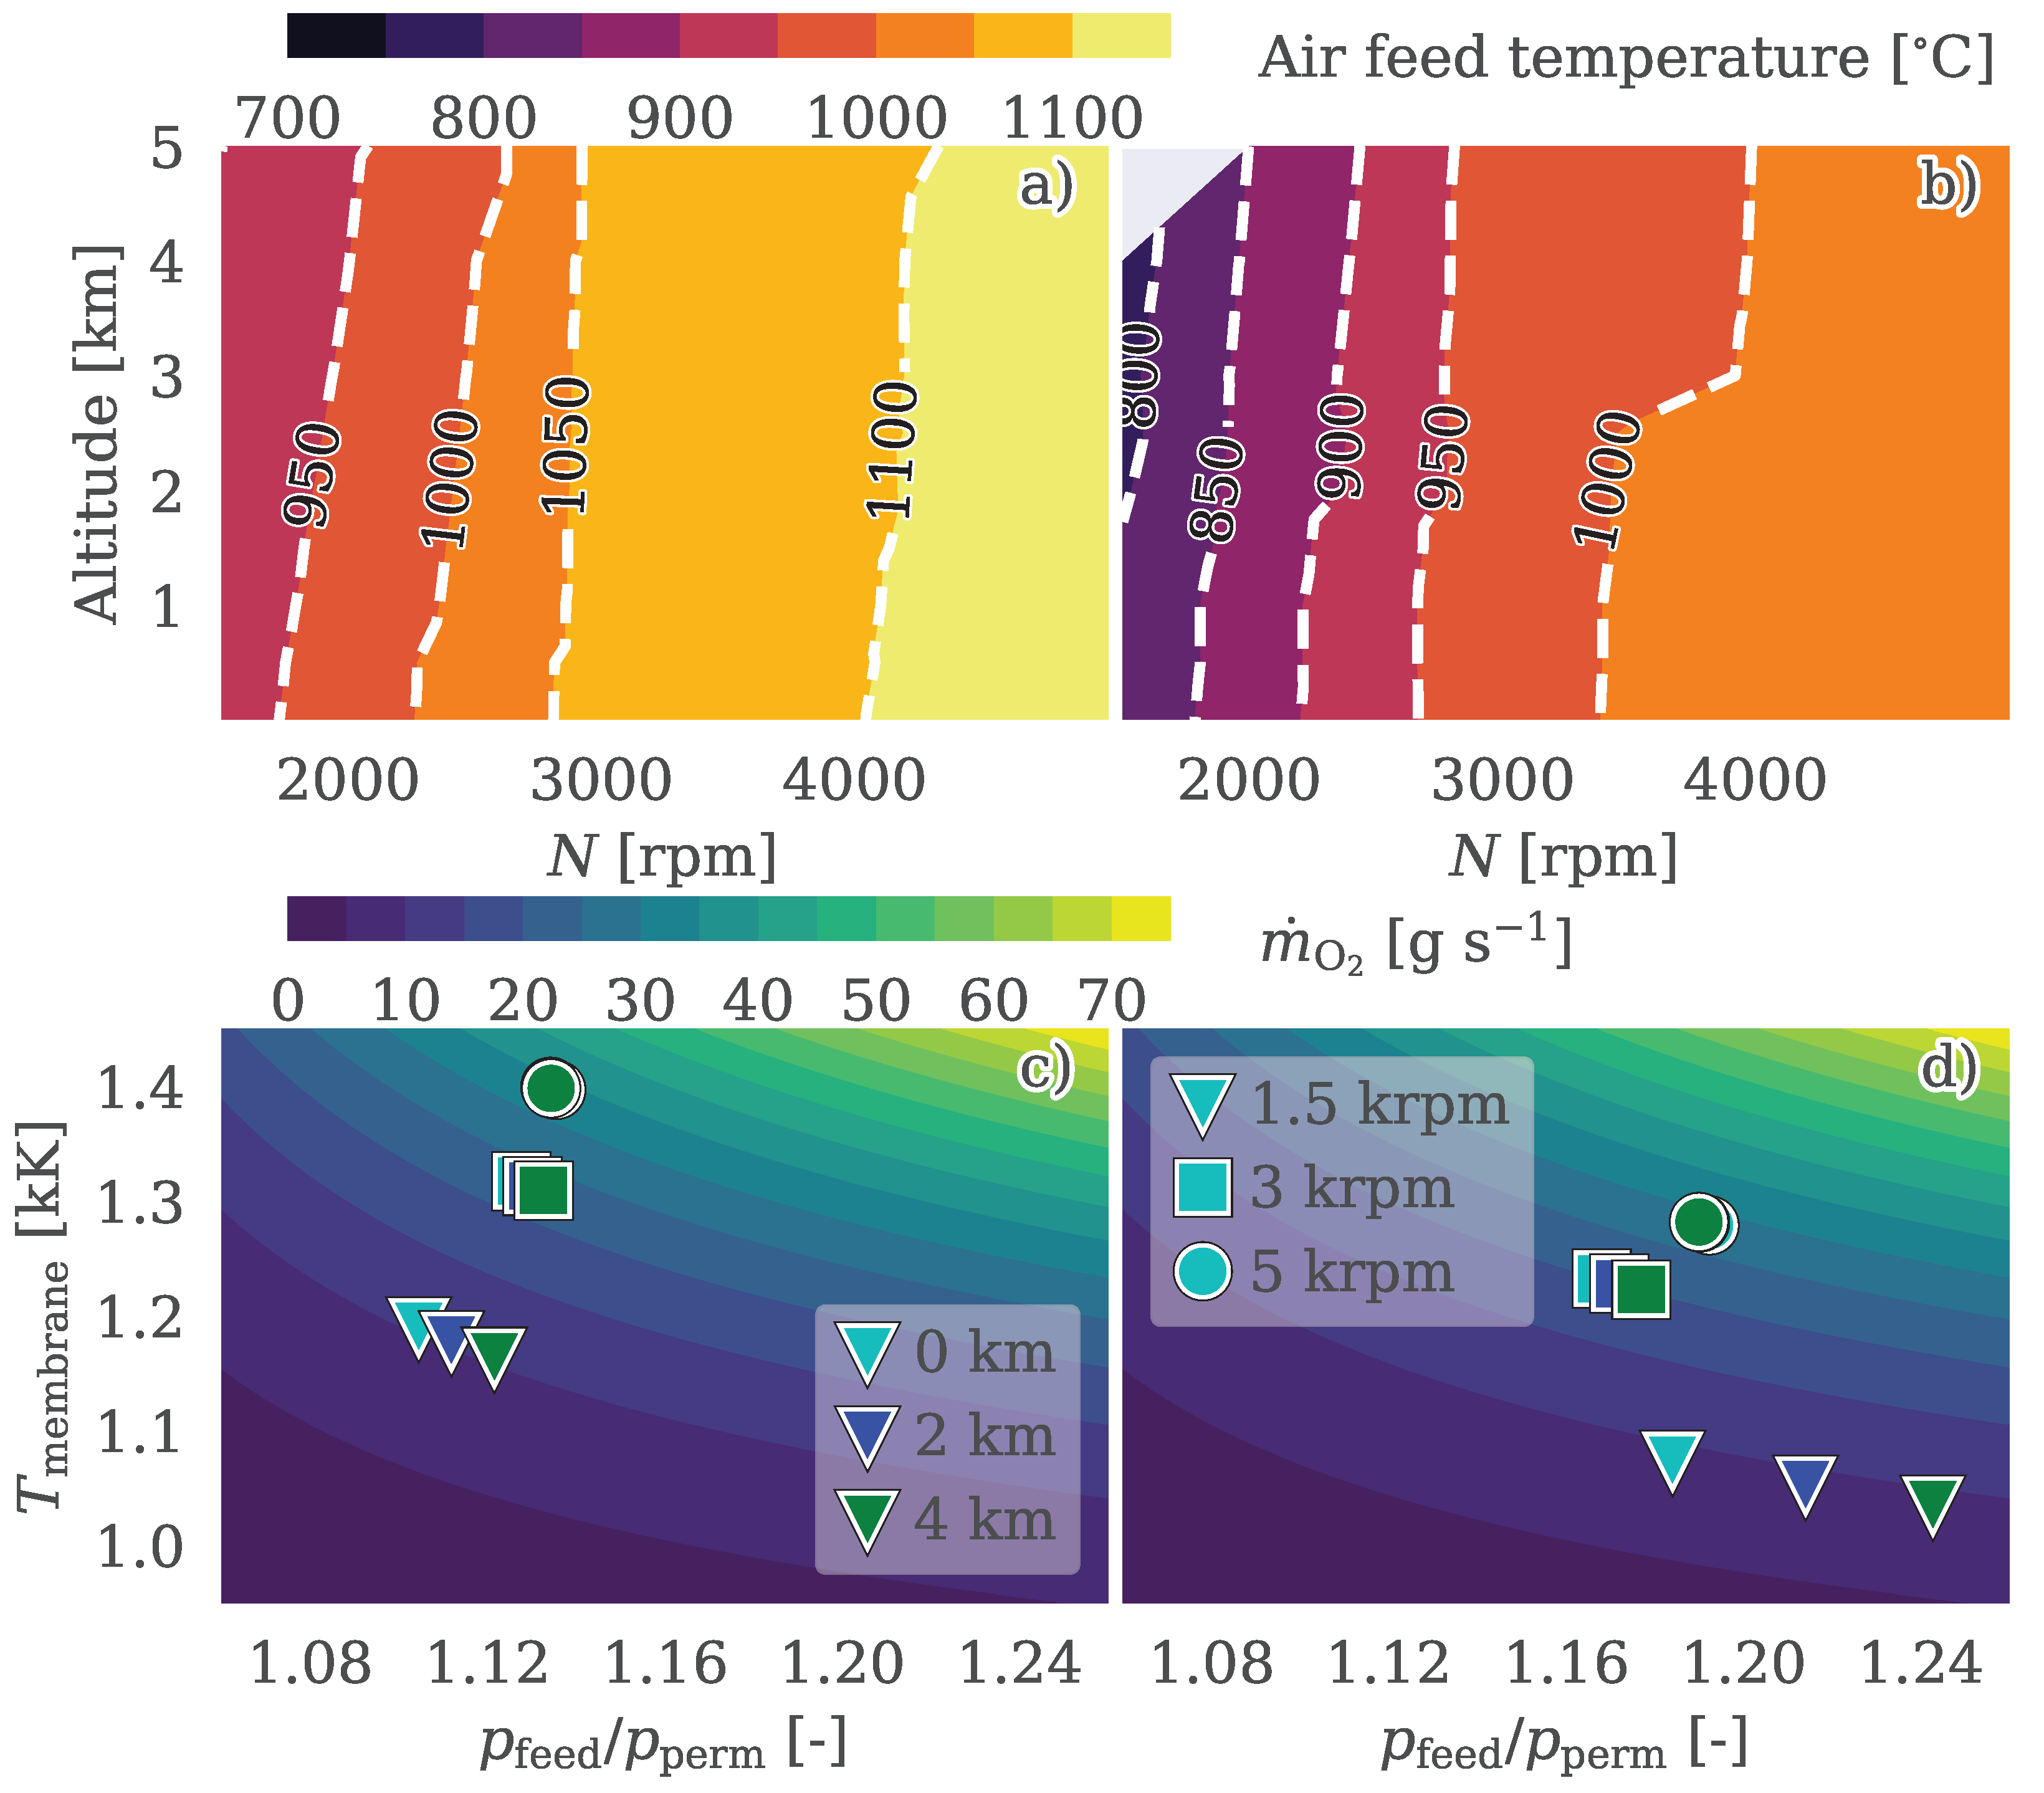

Table 1.
Specifications of the studied engine.
| Type | 4-cylinder 4-stroke spark ignition |
|---|---|
| Valves per cylinder | 4 |
| Bore [] | 72.2 |
| Stroke [] | 81.35 |
| Original compression ratio [-] | 9.6 |
| Displacement [] | 1332 |
| Connecting rod length [] | 128.128 |
Table 2.
Fuel characteristics used in the study.
| Type | Petrol |
|---|---|
| Formula | |
| Heat value | 42.399 |
| Density | 730.3 |
Table 3.
Specifications of the reference turbocharger.
| Turbine | |
|---|---|
| Wheel diameter | |
| Max. reduced mass flow | /0.5/ |
| Max. reduced speed | /0.5 |
| Compressor | |
| Wheel diameter | 40 |
| Max. corrected mass flow | 0.14 |
| Max. corrected speed (krpm) | 229 |
| Shaft diameter (mm) | 6 |
Disclaimer/Publisher’s Note: The statements, opinions and data contained in all publications are solely those of the individual author(s) and contributor(s) and not of MDPI and/or the editor(s). MDPI and/or the editor(s) disclaim responsibility for any injury to people or property resulting from any ideas, methods, instructions or products referred to in the content. |
© 2025 by the authors. Licensee MDPI, Basel, Switzerland. This article is an open access article distributed under the terms and conditions of the Creative Commons Attribution (CC BY) license (http://creativecommons.org/licenses/by/4.0/).
Copyright: This open access article is published under a Creative Commons CC BY 4.0 license, which permit the free download, distribution, and reuse, provided that the author and preprint are cited in any reuse.


