
Submitted:
06 November 2025
Posted:
06 November 2025
You are already at the latest version
Abstract
The coastal environment is a dynamic system shaped by both natural processes and human activities. In recent decades, increasing anthropogenic pressure and climate change—manifested through sea-level rise and more frequent extreme events—have accelerated coastal retreat, highlighting the need for improved management strategies and standardized tools for coastal risk assessment. Existing approaches remain highly heterogeneous, differing in structure, input data, and the range of factors considered. To address this gap, this study proposes an index-based methodology of general validity designed to quantify coastal erosion risk through the combined analysis of hazard, vulnerability, and exposure factors. The approach was developed for multi-scale and multi-risk applications and implemented across 54 representative sites along the Calabrian coast in southern Italy, demonstrating strong adaptability and robustness for regional-scale assessments. Results reveal marked spatial variability in coastal risk, with the Tyrrhenian sector exhibiting the highest values due to the combined effects of energetic wave conditions and intense anthropogenic pressure. The proposed framework can be easily integrated into open-access GIS platforms to support evidence-based planning and decision-making, offering practical value for public administrations and stakeholders, and providing a flexible, accessible tool for integrated coastal risk management.
Keywords:
coastal erosion risk
; index‐based assessment
; GIS integration
; hazard
; vulnerability
; exposure
1. Introduction
Coastal areas host a significant proportion of the world’s population and concentrate critical infrastructures, economic activities, and essential ecosystem resources [1,2]. Coastal erosion, together with sea-level rise, poses an increasing threat to these areas, with impacts ranging from the loss of emerged land and natural habitats to the degradation of ecosystem services, as well as direct damage to assets of outstanding natural, landscape, and historical–archaeological value, including settlements and strategic infrastructures [3,4,5]. At the global scale, the interaction between sea-level rise and anthropogenic pressures is undermining ecosystem services [6], producing critical effects in several contexts [7,8]. Consequently, coastal risk assessment today represents one of the most pressing scientific and operational challenges worldwide, within a framework characterized by increasing human pressure and the accelerating effects of climate change. In this context, there is an urgent need for reliable methodologies to assess risk and to support adaptation and sustainable management strategies.
Over the past decades, coastal risk assessment has evolved from purely physical approaches to integrated methodologies that jointly consider hazard, vulnerability, and exposure. The introduction of the Coastal Vulnerability Index (CVI) enabled comparative assessments of coastal vulnerability at regional and national scales [9,10], but it also revealed limitations related to oversimplification and low adaptability to diverse geomorphological and socioeconomic contexts [11,12,13,14].
In Italy and across Europe, numerous studies have applied and adapted index-based methodologies—from the Regional Coastal Management Plan of Basilicata [15] to the Coastal Master Plan of Calabria [16], and risk assessments in Campania [17] and Molise [18]. Other examples include the validation of storm-impact frameworks in Emilia-Romagna [19], the application of the CVI in Apulia [20], and the development of specific indices for Mediterranean dune systems [21]. At a broader scale, relevant studies include assessments for the Northern Adriatic [22], the Portuguese coast [23], the French Mediterranean coastline [24], Scotland [25], and the UK physical–economic coastal vulnerability index [26].
At the international level, several recent studies have developed more advanced approaches, including GIS- and multicriteria-based analyses [27,28], AHP methods addressing uncertainty [29,30], multi-hazard indices [31,32], extreme-event assessments [33], and comparative analyses of empirical models [34]. Some works have integrated the CVI into planning and monitoring tools, as in the Gulf of Finland [35] and in Morocco, where Muzirafuti and Theocharidis [36] applied remote sensing and GIS to the Casablanca coastline. Other studies have combined numerical modelling and remote sensing to assess coastal erosion [37].
In parallel, new indices have been introduced to integrate geomorphological, climatic, and socioeconomic factors [38], such as the Italian ISMV [39] and the Integrated Coastal Vulnerability Index (ICVI) for Mexico [40], as well as multi-hazard approaches for European coastal cities [41]. GIS, remote sensing, and machine learning technologies have become central tools for ensuring accurate and scalable analyses [42,43,44,45]. At the same time, Nature-based Solutions (NbS) have demonstrated their effectiveness in mitigating erosion and flood risks [46,47,48]. Moreover, participatory and multi-scalar approaches have proven crucial to enhancing the robustness of assessments and supporting sustainable management policies [49,50].
Overall, the current state of the art shows a clear evolution toward increasingly complex, integrated, and adaptive methodologies that combine biophysical and socioeconomic indicators, GIS and remote sensing tools, probabilistic approaches, and nature-based solutions. However, as summarized in Table 1, which synthesizes most of the referenced methodologies, both national and international frameworks for coastal risk assessment remain characterized not only by diverse calculation methods depending on the coastal region under investigation [11,51], but also by a significant variety and dispersion of the factors on which these methods are based.
The analysis of Table 1 highlights that coastal risk assessments predominantly focus on morphological and hydrodynamic aspects—such as beach morphology, wave climate, coastal geology, and shoreline evolution trends—whereas factors related to anthropogenic pressures and terrestrial dynamics (e.g., riverine sediment supply, soil sealing, coastal and port structures, and precipitation) are less frequently considered. This imbalance underscores the persistent methodological heterogeneity and emphasizes the need to develop integrated and standardized approaches capable of systematically including the full range of variables influencing coastal risk. Consequently, there remains a strong demand for shared and replicable procedures that can reduce methodological discrepancies and enable consistent comparisons across different coastal areas.
Within this framework, the present study proposes an innovative approach aimed at filling this gap and strengthening resilient coastal management strategies. Recognizing that coastal erosion studies cannot be effectively addressed without a multidisciplinary and systemic perspective, the main objective of this research is to define a generalizable coastal risk assessment procedure that organically integrates all relevant factors. The proposed methodology, designed for the coasts of the Calabria region in southern Italy but extendable to the entire national territory, can be implemented within an open-source GIS platform and aims to provide an operational tool for public authorities, private entities, and stakeholders involved in coastal zone planning and management.
2. Materials and Methods
2.1. Case Study: The Calabria Region
Calabria, located at the southernmost tip of the Italian peninsula, covers an area of approximately 15,079 km² and has a population of just over two million inhabitants. The region is divided into five provinces (Catanzaro, Cosenza, Crotone, Reggio Calabria, and Vibo Valentia) and includes 409 municipalities, 116 of which have coastal development. It borders Basilicata to the north, is bounded by the Tyrrhenian Sea to the west and the Ionian Sea to the east, and is separated from Sicily to the south by the Strait of Messina, which narrows to just 3.2 km at its closest point (Figure 1).
The territory is predominantly hilly (49.2%) and mountainous (41.8%), with major mountain chains such as the Pollino, Catena Costiera, Sila, Serre, and Aspromonte ranges. The main lowland areas are the plains of Sibari, Lamezia Terme, and Gioia Tauro. From a hydrographic perspective, Calabria is characterized by ephemeral and torrential watercourses known as fiumare, which are prone to sudden and intense floods, exhibit high sediment transport, and exert a strong influence on coastal dynamics. Numerous artificial lakes are also present, particularly on the Sila plateau.
The Calabrian coastline extends for approximately 736 km, alternating sandy and gravel beaches with stretches of high, rocky cliffs. Anthropogenic pressure is considerable, particularly around coastal provincial capitals and in areas with a strong touristic vocation, where recreational activities and beach facilities play a key role in the regional economy. The coastline can be subdivided into three main sectors: the Tyrrhenian (over 250 km), the Ionian (over 400 km), and the Strait of Messina (about 40 km). The Tyrrhenian and Ionian sectors are exposed to wave conditions associated with long fetches—sometimes exceeding 1,500 km—whereas the Strait of Messina is characterized by shorter fetches and a generally less energetic wave climate.
From a geomorphological standpoint, the Tyrrhenian coast is distinguished by a high proportion of steep cliffs (reaching up to 40% in some provinces), limited lowland areas, and a significant degree of urbanization along the remaining low-lying sectors. Conversely, the Ionian coast is dominated by alluvial plains that have historically favored human settlement, with approximately 30% of low-lying coasts occupied by anthropogenic activities. The coastal area of the Strait, finally, is densely urbanized due to both its narrow morphological configuration and its proximity to Sicily.
For this study, a total of 54 sampling sites were selected and distributed across the three coastal sectors of the region: 32 along the Ionian coast, 19 along the Tyrrhenian coast, and 3 within the Strait of Messina area, encompassing approximately 116 km of coastline (Figure 2). The selection of sites was guided by the availability of wave and meteorological data, as well as by the need to represent the diversity of coastal morphologies present along the study area. A list of the analyzed sites is provided in Table 2.
2.2. Methodological Framework
The methodology developed for coastal risk assessment is based on an index-based approach, selected for its ease of application and its potential integration within a GIS environment. Although calibrated for the Calabrian context, the method has general validity and can be adapted to different territorial scales (local, municipal, provincial, or interregional). The proposed model assesses the coastal risk index () as the product of three fundamental components:
where:
Hazard Index (): measures the intensity of natural forcing agents such as wave climate, wind, currents, and sea-level rise.
Vulnerability Index (): describes the susceptibility of the coastal system based on its geomorphological, ecological, and anthropogenic characteristics.
Exposure Index (): evaluates the assets and population located in areas potentially affected by coastal hazards.
Each index is computed as a weighted mean of its elementary variables, classified into five categories (1 = very low; 5 = very high) and subsequently normalized within the range 0–1. The normalization procedure follows the mathematical formulation proposed in the CRI-MED methodology [13]. Consequently, the hazard, vulnerability, and exposure indices are calculated using the following general expressions:
where , and represent the number of variables considered for hazard, vulnerability, and exposure, respectively; the weights , e are assigned to each variable according to its relative contribution to the definition of hazard, vulnerability, and exposure in the context of coastal risk assessment.
Once estimated, the three indices (, , ) are classified according to the threshold values reported in Table 3.
The developed methodology can be structured into five main phases, described in detail below (Figure 3):
Definition of the coastal hazard area;
- Determination of the Coastal Hazard Indices and evaluation of the overall hazard index;
- Determination of the Coastal Vulnerability Indices and evaluation of the overall vulnerability index;
- Determination of the Coastal Exposure Indices and evaluation of the overall exposure index;
- Evaluation of the final Coastal Risk Index.
2.2.1. Definition of the Coastal Hazard Area
The coastal area potentially at risk is defined as the zone between the present shoreline and the maximum elevation reached by the sea level under extreme conditions. This elevation is determined as the sum of:
- Wave run-up and set-up (with a return period of 100 years);
- Astronomical and meteorological tides;
- Projected sea-level rise over a 100-year horizon according to the most severe IPCC scenario.
2.2.2. Hazard Indices
Coastal hazard factors are primarily related to the main climatic forcing agents that, with varying intensity and incidence, drive erosional processes. These include tides, currents, winds, waves, and, in particular, sea-level rise induced by global warming—an ongoing and unavoidable phenomenon in any contemporary coastal risk analysis.
Accordingly, the proposed model incorporates five main hazard sub-indices, accounting for the following components:
(1) Sea-Level Rise (SLR). This sub-index is based on the rate of sea-level rise (mm/year), as estimated in numerous studies through satellite data analysis and assessments provided by the IPCC and NASA. Although SLR is a global-scale parameter with limited regional variability, it was considered essential to include it as a factor contributing to the long-term increase in hazard. As in many coastal vulnerability studies, this sub-index can be evaluated using the class intervals proposed by Pendleton et al. (2004) in their assessment of sea-level-rise-induced coastal vulnerability [52].
(2) Tidal Range. This parameter is based on the mean tidal range, measured in meters, derived from tide-gauge records. The corresponding index value is determined according to the five-class tidal regime classification proposed by Hayes (1979) [53].
(3) Marine Currents. This sub-index accounts for the influence of marine currents on coastal erosion, particularly in narrow straits or channels where geographic configuration enhances current velocity. Since increasing current velocity generally implies higher hazard, classes of hazard were defined as a function of the mean current speed (in knots). These values can be obtained from published datasets, tide tables, and nautical charts.
(4) Wind (Aeolian Deflation). The wind-deflation index quantifies the direct effect of wind on coastal erosion, which is generally modest, and is a function of aeolian transport capacity. It is expressed as the percentage of annual hours during which wind velocity exceeds the critical threshold for sediment transport. This threshold, defined by Bagnold (1941) [54] based on sediment characteristics, can be estimated from wind data measured at 10 m above ground using the simplified relationship proposed by Hsu (1974) [55]. Comparing this critical velocity with observed wind time series allows the exceedance probability—and hence the site-specific index value—to be determined.
(5) Wave Climate. The wave-climate index () was computed by dividing the Calabrian coastline into three macro-areas (Tyrrhenian, Strait of Messina, and Ionian) based on exposure and fetch. Following and refining the approach of Barbaro (2016), the updated formulation also accounts for secondary exposure sectors and wave run-up. The index is expressed as the weighted mean (equal weights) of four sub-indices ranging between 0 and 1, described below:
where:
is the wave energy flux index, defined as the ratio between the sum of the energy fluxes of the active (or incident) directional sectors at the site under examination and the maximum value recorded within the corresponding macro-area of reference.
is the index associated with the wave exposure sectors, defined as the weighted mean of the indices corresponding to the primary and, where applicable, the secondary wave-approach sectors, using their respective energy fluxes as weights. The primary sector corresponds to the direction of maximum wave energy, while the secondary sector refers to a secondary energy peak. The index for the primary sector accounts for the greater forcing exerted by waves approaching the shoreline orthogonally (shoaling) compared to more oblique waves (refraction), tending toward 1 as wave incidence becomes more perpendicular. The inclusion of the secondary sector allows the representation of conditions in which the coastline is influenced by multiple wave-attack directions, thereby extending the original formulation proposed by Barbaro (2016) [16].
is the index related to the variation of significant wave height with return period, defined as the ratio between the mean value of Δh(R) calculated for the different return periods at the site under analysis and the corresponding maximum value computed for the reference macro-area. Here, Δh(R) represents the difference in significant wave height calculated for successive return periods (1, 10, 20, 50, 100, 200, and 500 years).
is the index associated with the variation of wave run-up with return period, defined as the ratio between the mean value of ΔRu(R) calculated for the different return periods at the site under analysis and the corresponding maximum value computed for the reference macro-area. Here, ΔRu(R) represents the difference between the run-up values calculated for successive return periods at the same location. The run-up values were estimated using the empirical formulation proposed by Stockdon et al. (2006) [56].
The coastal hazard indices defined in the new methodology, together with their classification criteria, are reported in Table 4.
The overall Coastal Hazard Index () was defined as a weighted combination of five contributing factors: sea-level rise (20%), tidal range (10%), marine currents (10%), wind (10%), and wave climate (50%). The assignment of these weights was based on scientific evaluations specific to the Calabrian context and agreed upon in consultation with regional policy makers. In particular, the wave climate was identified as the dominant forcing agent driving coastal erosion processes, whereas tides, currents, and wind were considered to have a relatively minor influence. Sea-level rise, although currently less impactful, was included as a significant long-term factor due to its expected contribution to future coastal flooding and erosion.
A hazard classification can be established according to the value of the overall index, as summarized in Table 3.
2.2.3. Coastal Vulnerability Indices
Coastal vulnerability factors represent the elements through which the susceptibility of a coastal system to erosional processes can be assessed. They derive from a combination of natural and anthropogenic characteristics that jointly determine shoreline stability. In particular, geological and geomorphological conditions—both in the emerged and submerged zones—play a central role, as does the analysis of historical shoreline evolution, which helps to identify erosional or accretional trends.
Equally important is the balance between littoral drift and fluvial sediment inputs, which directly affects sediment availability along the coast. Additional factors include the presence of coastal defense structures and port infrastructures, as well as dune systems and vegetation cover, which can either exacerbate or mitigate erosional processes. Finally, parameters such as subsidence rates and the degree of soil sealing further contribute to defining the overall level of coastal vulnerability.
Accordingly, the proposed methodology considers eleven coastal vulnerability variables, grouped as follows:
(1) Coastal Type. Based on the most widely adopted morphological classification, which distinguishes between high rocky coasts and low sandy coasts, the vulnerability classes for this index were defined using the scheme proposed by Ferreira et al. (2017) [57], considered particularly suitable for representing the conditions of the Calabrian coastal environment.
(2) Emerged Coastal Morphology. The vulnerability of the emerged coast was assessed as a function of two parameters: beach slope and mean beach width. Gently sloping and narrow beaches are more exposed to erosional and flooding processes than wider and steeper ones. Both parameters were estimated using transects derived from satellite imagery and Digital Terrain Models (DTMs) (Google Earth, QGIS). Vulnerability classes were defined by adapting the classification of Ferreira et al. (2017) [57] to the Calabrian context. The overall index was calculated as the arithmetic mean of the two sub-indices, with equal weighting.
(3) Submerged Coastal Morphology. The vulnerability of the submerged coast was evaluated based on seafloor slope, since steeper profiles lead to increased wave run-up and, consequently, greater exposure to erosion. This parameter can be estimated through the analysis of available bathymetric data, while vulnerability classes were defined by adapting the scheme of Ferreira et al. (2017) [57] to the geomorphological characteristics of the Calabrian coast.
(4) Sediment Transport. Coastal vulnerability is strongly influenced by the sediment budget, expressed as the ratio between fluvial sediment supply and longshore sediment transport, the latter being controlled by meteorological–marine forcing and sediment grain-size characteristics. In this study, the balance was expressed by an index defined as the ratio between Qr and Ql, where Qr represents the fluvial sediment input to the physiographic unit and Ql the longshore sediment transport. Index values greater than or equal to 1 indicate low vulnerability conditions, while values tending to zero correspond to critical sediment deficit conditions and thus to high vulnerability. The estimation of sediment transport rates can be performed through a simplified modelling approach, which, although less detailed than full numerical modelling, provides a reliable order-of-magnitude assessment suitable for comparing the two contributions and classifying vulnerability.
(5) Shoreline Evolutionary Trend. The shoreline evolution trend was evaluated following the methodology of Foti et al. (2022) [58], based on the comparison of cartographic datasets and satellite imagery. The overall index was computed as a weighted mean of the shoreline-change rates for different time intervals, assigning greater weight to the most recent data, which are more representative of current vulnerability conditions and characterized by higher positional accuracy. The vulnerability classes were defined according to the classification proposed by Barbaro (2016) [16].
(6) Subsidence. Subsidence, often of anthropogenic origin, constitutes a significant factor of coastal vulnerability as it amplifies the effects of storm surges and sea-level rise. In this study, the vulnerability classes, expressed as a function of the mean subsidence rate (mm/year), were calibrated based on available studies for the Calabrian areas affected by this phenomenon.
(7) Coastal Vegetation. Coastal vegetation represents a key element for shoreline resilience and morphological stability, as it contributes to the dissipation of wave energy and consequently to the reduction of erosional processes during extreme events [59,60,61]. Marine vegetation plays an equally relevant role: in particular, Posidonia oceanica constitutes a critical factor in mitigating coastal erosion and preserving sandy beaches, while maintaining benthic biodiversity—highlighting its importance as a natural defense mechanism for coastal systems [62,63,64]. Accordingly, a vegetation vulnerability index was defined as the weighted mean of three sub-indices: average width of coastal vegetation, corrected for vegetation density (with weight equal to 40%); percentage of coastline protected by vegetation (with weight equal to 40%); presence/absence of Posidonia oceanica (with weight equal to 20%). Vulnerability classes were defined by adapting the schemes proposed by Sekovski et al. (2020) [65] and Pantusa et al. (2018) [20] to the Calabrian context. The three sub-indices were evaluated using satellite data (Google Earth, QGIS) and historical datasets containing information on the mapping of coastal habitats.
(8) Dune Systems. Coastal dune systems act as natural defenses against erosion and flooding, functioning as sediment reservoirs, physical barriers, and hydrogeological buffers against saltwater intrusion [66,67]. Their development—strongly influenced by waves, wind, sediment supply, and psammophilous vegetation—is characterized by a zonation of plant cover that promotes dune formation and stabilization. However, dune systems are highly vulnerable to climate change and anthropogenic pressures, which have progressively reduced their extent and protective capacity [68]. Given their role in enhancing coastal resilience, a dune-system vulnerability index was defined as the weighted mean of three sub-indices: average dune elevation (with weight equal to 30%), average dune width (with weight equal to 30%), percentage of coastline protected by dunes (with weight equal to 40%). Vulnerability classes were adapted from Sekovski et al. (2020) [65] and Pantusa et al. (2018) [20] to fit the Calabrian coastal conditions. The analysis was performed using satellite imagery, Digital Terrain Models (DTMs), and GIS tools (Google Earth, QGIS).
(9) Coastal Defense Structures. The presence of coastal defense structures significantly influences shoreline vulnerability, as these interventions alter littoral currents and sediment transport processes, and in some cases may exacerbate local erosion. The coastal defense index was therefore defined as the ratio between the length of protected shoreline (PSL) and the total coastline length, corrected to account for the state of preservation of the defense structures. The assessment was performed through satellite imagery and GIS-based analysis (Google Earth). With regard to the determination of PSL, which varies depending on the type of structure, this study provides the following methodological approach:
- if the structure is an emerged barrier, the PSL is assumed to be equal to the length of the barrier itself;
- if the structure is a submerged barrier, the PSL is estimated as the length of the barrier multiplied by a coefficient corresponding to the wave transmission coefficient of the structure, calculated in this study using the empirical formulation proposed by Van der Meer (1990) [69].
- If the structure in question is a groyne, the corresponding PSL is evaluated based on both its length and the angle of incidence of the predominant wave direction.
- In the case of a T-head groyne, that is a combination of a groyne and a breakwater, the PSL is calculated as the sum of the contributions attributed to the breakwater and the groyne components.
The highest vulnerability values occur along coastal stretches already affected by erosion but poorly protected, whereas unprotected shorelines without coastal defense structures are assigned a null score.
(10) Port Structures. Port infrastructures can significantly alter littoral dynamics by interrupting or reducing sediment transport, often triggering localized erosional processes. The corresponding port-structure vulnerability index was defined as a function of the maximum cross-shore extension of the port basin (A), normalized with respect to the maximum regional value. In the absence of port facilities, the index assumes a null value.
(11) Coastal Anthropization. The coastal anthropization vulnerability index was defined as the percentage of shoreline that has been artificially modified or hardened (i.e., non-erodible coastal segments). As the proportion of urbanized or engineered coastline increases, the vulnerability to erosion decreases, since the shoreline no longer coincides with the natural beach–sea interface but with built structures or infrastructures protected by revetments or seawalls.
The coastal vulnerability indices defined in the proposed methodology, along with their respective classification criteria, are summarized in Table 5.
The overall Coastal Vulnerability Index () was defined as the mean value of eleven sub-indices, corresponding to the following factors: coastal type, emerged and submerged morphology, sediment budget, shoreline evolution, subsidence, vegetation, dune systems, coastal defense structures, port infrastructures, and degree of anthropization. Each sub-index was assigned an equal weight (1/11), as the relative importance of the individual factors had already been accounted for in the definition of their respective vulnerability classes. A classification of vulnerability levels can be established according to the value of the overall index, as summarized in Table 3.
2.2.4. Coastal Exposure Indices
The assessment of elements exposed to coastal risk was carried out by considering two main indices: resident population within the hazard area and land-use classes. Although this approach does not provide a detailed socio-economic valuation, it is based on legislative and regulatory references and allows for an effective differentiation and reliable representation of the value of exposed assets along eroding coastal sectors.
(1) Resident Population within the Hazard Area. The population exposure index was estimated following the methodology of the EUROSION Project (2004) [70], using ISTAT (2020) demographic data [71] and CORINE Land Cover (CLC 2018) shapefiles [72]. Population counts were calculated as the sum of residents within urban, agricultural, and natural areas, weighted according to their respective population densities. The exposure index increases proportionally with the number of residents located within the hazard zones.
(2) Land-Use Classes. The land-use exposure index was developed in compliance with current risk-assessment regulations, using CLC 2018 shapefiles and cartographic data from the Regional Geoportal [73]. The classification of exposed elements was based on the categories of potential damage indicated in the Operational Guidelines for the Implementation of Directive 2007/60/EC [74], in order to represent the socio-economic value associated with different land-use types. The level of exposure increases proportionally with the relevance of the category, in relation to the potential impact on people, economic assets, environmental resources, and cultural heritage. The overall land-use exposure index was calculated as the mean of three sub-indices, corresponding to areal, linear, and point-type shapefiles, thereby integrating all available spatial information in a consistent way.
The exposure indices defined in the proposed methodology, along with their respective classification criteria, are summarized in Table 6.
Based on scientific evaluation and consultation with regional policy makers, a weight of 20% was assigned to the population exposure index and 80% to the land-use exposure index, since the latter represents a broader and more diverse set of exposed elements.
Once calculated, the overall Coastal Exposure Index () can be classified according to the threshold values reported in Table 3.
2.2.5. Coastal Risk Index
Finally, the coastal risk index () is estimated using Equation (1). Accordingly, for each analyzed site, and based on the value of the final index, the coastal risk level is evaluated following the classification proposed in the Italian application of the EUROSION Project [70,75]. This classification is expressed on a percentage scale and summarized in Table 7.
3. Results
The proposed coastal erosion risk assessment methodology was applied to 54 sample sites distributed along the three main coastal sectors of Calabria. The analysis integrated geomorphological, meteomarine, hydrological, and anthropogenic data, enabling a comprehensive characterization of coastal hazard, vulnerability, exposure, and overall risk conditions. Table 8 summarizes the data and their corresponding sources used for the estimation of the variables involved in the developed methodology.
3.1. Coastal Hazard
The analysis of the hazard variables considered allowed the evaluation of sea-level rise (SLR) for all study areas, adopting a growth trend of 4.5 mm/year, consistent with satellite-based studies [76]. Consequently, the corresponding hazard index was classified in the fifth class (very high hazard level) for all the examined sites, since SLR estimates are derived from global-scale datasets whose variation is not significant at regional scale.
For the wind data analysis, provided by the MeteOcean Group for the period 1979–2018 [77], 52 grid points distributed along the three Calabrian coastal sectors were considered. The 10 m wind-speed time series were processed to derive prevailing wind directions and intensities, with data grouped into 10° directional sectors and 1 m/s speed classes. From these analyses, both the maximum wind set-up and the exceedance probability of the critical wind velocity required to initiate aeolian sediment transport were estimated, the latter being adopted as a representative index of the process.
The calculated wind set-up values for the 54 sampled sites ranged between 0.6 and 17 cm. For aeolian transport computations, the critical wind velocity values () ranged between 10 and 84 m/s. A detectable sediment transport capacity was identified in 20 out of the 54 sites, with the highest exceedance probability (6.9%) recorded at Brancaleone Marina, where the prevailing wind direction was from the southwest (SW) and the maximum observed wind speed reached 28 m/s. Regarding the wind-related hazard index, all sites were classified in the first class (very low hazard), except for Ferruzzano and Brancaleone, where the percentage of annual hours with active aeolian sediment transport ranged between 5% and 15%.
The mean tidal range was estimated using tide-gauge data from the National Tide Gauge Network (ISPRA) [78] for the period 2010–2021. Since only two stations are operational in Calabria (Reggio Calabria and Crotone), the analysis was extended to nearby stations—Catania, Taranto, and Palinuro—to ensure more comprehensive spatial coverage. The data, after removing outliers, were analyzed on an annual basis to determine the mean minimum and maximum sea levels and thus the mean tidal range, which was then assigned to the different Calabrian coastal sectors according to their proximity to the respective reference stations. The analysis yielded mean tidal range values of 0.87 m at Taranto, 0.90 m at Crotone, 0.72 m at Catania, 0.69 m at Reggio Calabria, and 0.88 m at Palinuro. These measurements were then spatially interpolated to assign representative values to the different coastal sectors of Calabria. Specifically, the Taranto value was adopted for the Upper Ionian coast within the Gulf of Taranto, while the Crotone value was applied to most of the Central Ionian sector. The Catania and Reggio Calabria data were considered representative of the Lower Ionian coast and the Strait of Messina, respectively, whereas the Palinuro value was used for the entire Tyrrhenian coastline. All sites therefore exhibit mean tidal ranges on the order of centimeters and below one meter, corresponding to a microtidal regime, consistent with Sannino et al. (2015) [79]. Consequently, despite minor spatial variations, all the examined locations were classified within the first hazard class for the tidal-range parameter.
In Calabria, marine currents are generally weak, ranging between 0.4 and 0.7 knots, but within the Strait of Messina they reach exceptional values, with mean intensities of 1–2 m/s and peaks up to 5 m/s [80]. The hydrodynamics of the area are dominated by semi-diurnal tidal currents, supplemented by drift and gradient currents as well as local circulation phenomena (countercurrents and vortices), which make this area unique within the Mediterranean and of particular interest for potential marine energy applications [81]. The marine current index exhibits values ranging between 1 and 4, reaching its maximum at Porticello, located in the southernmost sector of the Strait of Messina.
The wave climate off the Calabrian coasts was reconstructed using data provided by the MeteOcean Group (1979–2018) [77], integrated with simulations from the ABRCMaCRO software for the Strait of Messina. The region was divided into three macro-areas—Tyrrhenian, Ionian, and Strait—based on exposure and fetch characteristics. A total of 51 grid points were analyzed (32 along the Ionian coast and 19 along the Tyrrhenian coast), while in the Strait of Messina, model data were replaced owing to inadequate spatial resolution. In the Tyrrhenian Sea, wave directions are concentrated within a few dominant sectors, primarily from the western quadrants (250°–310°), with almost no secondary exposure sectors. Conversely, the Ionian coast is exposed to a much broader range of wave directions, predominantly from the southeast (100°–140°), but with several secondary approach sectors that increase both variability and hazard—particularly along the Crotone shoreline, which also exhibits the highest wave energy fluxes (>7000 N/s). The higher hazard levels observed along the Ionian coasts are also supported by the wave statistical parameters, which indicate a more pronounced increase in significant wave heights with return period compared to the Tyrrhenian sectors. The wave run-up values, on the other hand, are strongly influenced by seabed slope, to a greater extent than by wave climate itself; consequently, the highest run-up values are recorded along the steep coasts of the Strait of Messina. In summary, the Calabrian wave climate exhibits substantial spatial variability: it is more concentrated and energetic along the Tyrrhenian coast, and more complex and potentially hazardous along the Ionian coast, with direct implications for shoreline vulnerability [82]. The wave-climate hazard index estimated for the analyzed sites ranged from moderate (third class) to very high (fifth class), with the highest scores found in the Strait of Messina and Tyrrhenian localities.
Table 9 reports the normalized overall hazard index values obtained for each analyzed site, computed using Equation (2) and weighted according to the coefficients provided in Table 4, together with their corresponding hazard classification. The results indicate medium-to-high hazard levels across all Tyrrhenian sites and variable levels, from medium to medium–high, along the Ionian coast and within the Strait of Messina (Figure 4).
3.2. Coastal Vulnerability
Regarding the vulnerability variables analyzed, all the selected sample sites consist of sandy beaches and therefore fall within the fifth (highest) vulnerability class for the coastal type index.
The Emerged Coastal Morphology Index (ECM) values range between 2.5 and 5, with the highest value recorded at Calopezzati. Sedimentological analysis based on OKEANOS (2003) data [83] highlights marked variability among the three macro-areas. Along the Ionian coast, emerged beaches are mainly composed of pebbles, gravel, and coarse sand, whereas seabed sediments show greater heterogeneity, ranging from coarse to fine materials (Dn₅₀ up to 0.1 mm). In the Strait of Messina, emerged beaches are dominated by very coarse sands and pebbles, while the seabed consists of fine sands (0.13–0.18 mm). Along the Tyrrhenian coast, emerged sediments are predominantly gravelly and coarse, gradually transitioning to medium and fine sands at greater depths (up to 0.05 mm in the central Tyrrhenian sector). Morphological analysis of the emerged beach, based on satellite imagery (QGIS, Google Earth), revealed widths between 13 and over 100 m and slopes ranging from 2% to 17%. Coastal plains with wider lowlands are associated with broader, gentler beaches, while narrower plains typically correspond to steeper and narrower beaches.
For the Submerged Coastal Morphology Index (SCM), representing seabed slope, most sites fall into the first or second vulnerability classes, except for Rossano (Ionian coast) and the Strait of Messina, which show steeper profiles. Bathymetric analysis based on EMODnet-Bathymetry data [84] revealed average seabed slopes of 2–3% for both Tyrrhenian and Ionian sectors, with the exception of Rossano (10%), while the Strait of Messina exhibits much higher values, exceeding 20%, consistent with its unique geomorphological setting.
The Shoreline Evolutionary Trend Index (SET) spans all vulnerability classes: 13 sites show shoreline advancement (class 1), 28 sites are stable (class 2), 6 sites experience mild erosion (class 3), 6 sites show intense erosion (class 4), and one site experiences severe erosion (class 5). The shoreline evolution of Calabria was reconstructed through comparison of historical shorelines, orthophotos, and satellite imagery [73,85], analyzing over 700 transects and computing the Net Shoreline Movement (NSM) and End Point Rate (EPR) indices. Results indicate overall long-term stability, although significant local erosion issues persist. The highest recent erosion rate was recorded at Marina di Caulonia (≈6 m/year), followed by Calopezzati, San Ferdinando, and Belmonte Marina (≈3 m/year). Short-term analyses reveal strong erosion at Gizzeria Lido (5.5 m/year) and Crotone-Zigari (3.6 m/year). Shoreline advancement is generally limited (<1 m/year), except at Badolato, where harbor construction altered local sediment dynamics. Overall, Calabria’s coastline exhibits widespread stability, though with vulnerable segments affected by anthropogenic pressures and local morphodynamic conditions [58].
The Dune System (DS) and Vegetation (V) indices vary between 1.9–5 and 2.4–5, respectively. The highest values correspond to areas where these natural protective systems are absent, resulting in maximum vulnerability. Dune and vegetation analyses conducted using QGIS and satellite imagery identified dunes up to 7 m in height and 94 m in width (Monasterace, Badolato) and vegetation widths up to 86 m (Badolato) or 80% coverage (Isola di Capo Rizzuto). Approximately 30 Posidonia oceanica meadows were mapped, mainly along the Ionian coast and within protected areas (Isola Capo Rizzuto, Costa degli Dei, Upper Tyrrhenian), based on information processed within the Mediterranean Sensitive Habitats (MEDISEH) project [86], underscoring their ecological importance and the better conservation state of less urbanized coasts. Anthropogenic pressure has drastically reduced Calabrian dune systems, intensifying coastal erosion along the Tyrrhenian coast. Urbanization in areas like Tortora has caused shoreline retreat, while partially preserved dunes in Villapiana have favored progradation [87].
Subsidence mainly affects the Ionian coastal areas and some Tyrrhenian zones, with rates ranging from a few mm/year to over 20 mm/year. The phenomenon is associated with tectonic activity and groundwater extraction in Sibari, natural processes and hydrocarbon extraction in Crotone, and agricultural and industrial water withdrawal in Gioia Tauro [88,89,90,91,92,93,94,95,96,97]. Subsidence amplifies coastal vulnerability and threatens both archaeological heritage and modern settlements. Resulting vulnerability index values (S) range from 1 to 4, with the highest recorded in areas near the Sibari plain (Villapiana Lido, Rossano) and the Gioia Tauro plain (Palmi, San Ferdinando).
Due to Calabria’s steep orography, with mountain ranges close to the coast, numerous small, steep catchments are characterized by flash floods and intense sediment transport [98]. A total of 262 catchments (> 4 km² or of specific interest) were analyzed, estimating mean annual volumes of eroded material using the Gavrilovic model [99] in a GIS environment with morphometric, pluviometric, thermometric, and land-use data [100]. The largest catchments are the Crati (≈2500 km²), Neto (≈1100 km²), Mesima (≈800 km²), and Lao (≈600 km²). The highest fluvial sediment yields were estimated for the Lao (132,229 m³/year), Neto (107,877 m³/year), and Allaro (102,671 m³/year) rivers. The longshore sediment transport was estimated using the Tomasicchio et al. (2013) model [101], implemented in MATLAB and applied to meteomarine and sedimentological data from the 54 study sites. The model provided both magnitude and direction of transport, offering key insights into coastal dynamics. The results show wide spatial variability, from 2,815 m³/year at Villapiana Lido to 241,000 m³/year at Cirò Marina, confirming the strong influence of local wave climate, sediment texture, and geomorphological setting on sediment transport patterns. The resulting Sediment Transport Index (ST)—representing the balance between fluvial sediment inputs and longshore sediment removal—spans all vulnerability classes, with the highest values recorded in several Ionian and Tyrrhenian sites.
For the Coastal Defense Structures (CDS) and Port Structures (PS) indices, the obtained values fall within medium–high and medium–low vulnerability classes, respectively, where such structures are present. Satellite image analysis enabled evaluation of the type, geometry, and conservation state of coastal defenses: among the 54 analyzed sites, 29 are protected by defense structures, with protected shoreline lengths ranging from 2.5% (Belmonte Marina) to 48% (San Lucido). Identified structures include groynes, emerged and submerged barriers, and mixed systems. A total of 24 ports were surveyed and measured relative to the 1954 shoreline; the largest is the new port of Crotone (1122 m), followed by Cetraro (489 m), Cariati (457 m), and Roccella Ionica (415 m) [102].
For the Coastal Anthropization Index (CA), all sites fall within the maximum vulnerability class, as the degree of shoreline urbanization is generally low (<20%), except for Marina di Belvedere and Sangineto Lido, which fall into the fourth class with 21% and 29.6%, respectively.
Table 10 reports the normalized overall vulnerability index values obtained for each site, calculated using Equation (3) and weighted according to the coefficients provided in Table 5, together with the corresponding vulnerability classification. The results indicate moderate vulnerability for most sites, medium–low for four Ionian and two Tyrrhenian sites, and medium–high for five Ionian, three Tyrrhenian, and two Strait of Messina sites (Figure 5).
3.3. Coastal Hazard-Area
For hazard-area assessment, total levels were estimated by summing the maximum contributions from wind set-up, barometric set-up, astronomical tide, wave run-up and set-up (TR = 100 years), and the projected sea-level rise under the IPCC SSP5–8.5 scenario [103]. The resulting total water levels reflect local coastal slopes, with values ranging from 3.15 m at Villapiana Lido to 7.82 m at Lazzaro. Hazard areas were delineated in a QGIS environment using 5 m-resolution regional DTMs [73], accounting for both total water level and the linear extent of each coastal segment. The mapped hazard areas range from 1.43 km² at Vibo Marina (the largest) to 0.006 km² at Isola di Capo Rizzuto–Marinella (Figure 6).
3.4. Coastal Exposure
Regarding exposure, most sites show low values of resident population within hazard zones. However, land use associated with tourism and coastal development produces high exposure scores in several areas, particularly along the Tyrrhenian coast. In particular, analysis of the resident population within the hazard area shows that almost all surveyed localities fall within the lowest exposure class, with the exception of Rossano, Gallico, and Vibo Marina. In contrast, the land use index displays a wider distribution across all five exposure classes, with maximum values observed in Caulonia Marina, Lazzaro, Pellaro, Gallico, Gizzeria Lido, Falerna Marina, and Cetraro Marina.
Table 11 presents the normalized overall exposure index values for each site, calculated using Equation (4) and weighted according to the coefficients in Table 6, together with their exposure classification. The results reveal considerable spatial variability: three sites on the Ionian coast show low exposure, while seven sites—mostly along the Tyrrhenian coast—exhibit high exposure levels (Figure 7).
3.5. Coastal Risk
The integration of the three components—hazard, vulnerability, and exposure—resulted in the definition of the coastal risk index (), providing an articulated overview of coastal risk across Calabria. The results — shown in Table 12 — identify nine sites with low risk (all located along the Ionian coast), 29 with medium–low risk, 14 with medium risk, and two sites with medium–high risk (Falerna Marina and Cetraro Marina), both situated along the Tyrrhenian coast and characterized by high urbanization (Figure 8).These findings highlight that coastal risk is not uniformly distributed but depends on the combined influence of natural conditions and anthropogenic pressure.
4. Discussion
The results of this study highlight the complex and spatially variable nature of coastal erosion risk along the Calabrian coast, which is shaped by the interplay between physical processes, geomorphological settings, and anthropogenic pressures.
The analysis of hazard variables revealed that sea-level rise (SLR) represents a critical and non-negligible driver, classifying all sites within the highest hazard class. Although SLR variations at the regional scale are limited, its cumulative effect over time is expected to exacerbate both erosion and inundation hazards, emphasizing the importance of integrating climate projections into regional planning. The wave climate emerged as the dominant forcing agent, particularly along the Tyrrhenian coast and within the Strait of Messina, where energetic sea states, extended fetch, and steep seabed slopes combine to increase run-up and coastal retreat potential. Conversely, the Ionian sector exhibited more complex exposure conditions due to multiple wave approach directions and a broader spectrum of energy fluxes. In contrast, wind and tidal indices proved to be less significant, consistent with the region’s microtidal regime and the limited incidence of aeolian sediment transport. Moreover, the hazard associated with marine currents is generally minimal, except in the Strait of Messina. Consequently, the combined influence of wave dynamics and coastal morphology accounts for most of the spatial variability in coastal hazard.
Vulnerability patterns are more heterogeneous and closely tied to geomorphological and anthropogenic characteristics. The predominance of sandy beaches, high subsidence rates in specific plains (Sibari and Gioia Tauro), and the widespread degradation or loss of natural buffers such as dunes and vegetation contribute to elevated vulnerability levels across much of the region. The presence of coastal defense structures and ports, while locally mitigating erosion, often disrupts sediment transport and induces secondary imbalances. Notably, the contrast between heavily urbanized Tyrrhenian sectors and less developed Ionian sectors underscores the strong role of human pressure in amplifying coastal susceptibility [104].
The exposure indices show pronounced variability. In most localities, population density within hazard zones remains low, resulting in limited exposure scores for the population index. However, land-use patterns significantly increase exposure in areas with high levels of urbanization or concentration of port and tourism infrastructures — notably in Falerna, Cetraro and Pellaro. This indicates that exposure is not solely related to permanent population density but rather to the intensity of anthropogenic pressure and coastal land use, with critical conditions where such pressures coincide with unstable natural settings.
The overall risk synthesis places most localities within low to medium–low risk classes, predominantly along the Ionian coast, where human pressures have historically been less intense. However, several critical hotspots emerge: Falerna Marina and Cetraro Marina, both along the Tyrrhenian coast, exhibit medium–high risk levels driven by the combination of high wave hazard, strong urbanization, and dense coastal infrastructure. These criticalities, consistent with the findings of several previous studies that have highlighted the vulnerability and shoreline retreat of the Tyrrhenian sector [105,106,107,108], confirm the need for integrated risk management strategies that address not only physical factors but also spatial planning and the mitigation of anthropogenic pressures.
5. Conclusions
This study addressed the need for a unified and comprehensive framework for coastal risk assessment, responding to the current fragmentation of methods and indicators at both national and international scales. A new index-based methodology was therefore developed to evaluate coastal erosion risk, designed to integrate all key physical, geomorphological, climatic, and anthropogenic factors influencing coastal dynamics. Moreover, the proposed methodology is multi-scale and multi-risk by design. It can be applied at various territorial levels — from local to regional — and adapted to different coastal contexts by recalibrating classification thresholds and weighting factors. Furthermore, because most variables also influence coastal flooding, the same framework can be used to evaluate flood risk, adopting a different weighting scheme.
The methodology was applied to 54 representative sites along the Calabrian coast (32 on the Ionian side, 3 within the Strait of Messina, and 19 along the Tyrrhenian coast), demonstrating its robustness and adaptability. The results indicate that 16% of the analyzed sites fall within the low-risk class, 54% within medium–low, 26% within medium, and 4% within medium–high risk. The analysis reveals pronounced spatial variability in coastal risk across Calabria, with the Tyrrhenian sector exhibiting the highest levels due to the combined influence of an energetic wave climate and increasing anthropogenic pressure. These contrasts highlight the need for management strategies tailored to local coastal conditions. Overall, the findings confirm the robustness and applicability of the proposed methodology in capturing the complexity of coastal erosion dynamics in Calabria.
A key advantage of this approach lies in its integration within a GIS environment, ensuring transparency, reproducibility, and usability for public administrations and stakeholders. Future developments include the creation of an open-access GIS plug-in to facilitate the input of local data and the automatic generation of hazard, vulnerability, exposure, and risk maps.
In conclusion, the proposed methodology represents an effective and flexible tool for integrated coastal risk management. Its accessibility and adaptability make it particularly valuable for stakeholders and public administrations, supporting evidence-based prioritization of coastal defense measures and sustainable spatial planning.
Author Contributions
Conceptualization, G.C.B., G.B. and G.F.; methodology, G.C.B.; software, G.C.B., G.F. and G.M.; validation, G.C.B., G.B. and G.F.; formal analysis, G.C.B. and G.F.; investigation, G.C.B. and G.F.; resources, G.C.B., G.F. and G.M.; data curation, G.C.B. and G.F.; writing—original draft preparation, G.C.B.; writing—review and editing, G.C.B., G.B., G.F. and G.M.; visualization, G.C.B.; supervision, G.B.; project administration, G.B. All authors have read and agreed to the published version of the manuscript.
Funding
This research received no external funding.
Institutional Review Board Statement
Not applicable.
Informed Consent Statement
Not applicable.
Data Availability Statement
Not applicable.
Conflicts of Interest
The authors declare no conflicts of interest. The funders had no role in the design of the study; in the collection, analyses, or interpretation of data; in the writing of the manuscript; or in the decision to publish the results.
References
- McLaughlin, S.; Cooper, J.A.G. A multi-scale coastal vulnerability index: A tool for coastal managers? Environ. Hazards 2010, 9, 233–248. [Google Scholar] [CrossRef]
- Ramieri, E.; Hartley, A.; Barbanti, A.; Santos, F.D.; Gomes, A.; Hilden, M.; Santini, M. Methods for assessing coastal vulnerability to climate change. ETC CCA Tech. Pap. 2011, 1, 1–93. [Google Scholar]
- Komar, P.D. Coastal erosion–underlying factors and human impacts. Shore & Beach 2000, 68, 3–16. [Google Scholar]
- Barbaro, G.; Foti, G.; Sicilia, C.L. Coastal erosion in the South of Italy. Disaster Adv. 2014, 7, 37–42. [Google Scholar]
- Vousdoukas, M.I.; Ranasinghe, R.; Mentaschi, L.; Plomaritis, T.A.; Athanasiou, P.; Luijendijk, A.; Feyen, L. Sandy coastlines under threat of erosion. Nat. Clim. Change 2020, 10, 260–263. [Google Scholar] [CrossRef]
- Magalhães Filho, L.N.L.; Roebeling, P.C.; Costa, L.F.C.; Lima, L.T. Ecosystem services values at risk in the Atlantic coastal zone due to sea-level rise and socioeconomic development. Ecosyst. Serv. 2022, 58, 101492. [Google Scholar] [CrossRef]
- Andreadis, O.; Chatzipavlis, A.; Hasiotis, T.; Monioudi, I.; Manoutsoglou, E.; Velegrakis, A. Assessment of and adaptation to beach erosion in islands: An integrated approach. J. Mar. Sci. Eng. 2021, 9, 859. [Google Scholar] [CrossRef]
- Ortega, A.Y.; Díaz, L.J.O.; Cueto, J.E. Assessment and management of coastal erosion in the marine protected area of the Rosario Island archipelago (Colombian Caribbean). Ocean Coast. Manag. 2023, 239, 106605. [Google Scholar] [CrossRef]
- Gornitz, V. Global coastal hazards from future sea level rise. Glob. Planet. Change 1991, 3, 379–398. [Google Scholar] [CrossRef]
- Thieler, E.R.; Hammar-Klose, E. National Assessment of Coastal Vulnerability to Sea Level Rise: Preliminary Results for the U.S. Atlantic Coast. U.S. Geological Survey Open-File Report 99-593; U.S. Geological Survey: Washington, DC, USA, 1999. [Google Scholar]
- Viavattene, C.; Jiménez, J. A.; Ferreira, O.; Priest, S.; Owen, D.; McCall, R. Finding coastal hotspots of risk at the regional scale: the Coastal Risk Assessment Framework. Coast. Eng. 2017. [Google Scholar] [CrossRef]
- Satta, A.; Snoussi, M.; Puddu, M.; Flayou, L.; Hoult, R. An index-based method to assess risks of climate-related hazards in coastal zones: the case of Tetouan. Estuar. Coast. Shelf Sci. 2016, 175, 93–105. [Google Scholar] [CrossRef]
- Satta, A.; Puddu, M.; Venturini, S.; Giupponi, C. Assessment of coastal risks to climate change related impacts at regional scale: the case of Mediterranean region. Int. J. Disaster Risk Reduct. 2017, 24, 284–296. [Google Scholar] [CrossRef]
- Narra, P.; Coelho, C.; Sancho, F.; Palalane, J. CERA: an open-source tool for coastal erosion risk assessment. Ocean Coast. Manag. 2017, 142, 1–14. [Google Scholar] [CrossRef]
- Greco, M.; Martino, G. Assessment of maritime erosion index for Ionian-Lucanian coast. In Engineering Geology for Society and Territory; Springer: Cham, Switzerland, 2014; Volume 4, pp. 41–44. [Google Scholar] [CrossRef]
- Barbaro, G. Master Plan of solutions to mitigate the risk of coastal erosion in Calabria (Italy), a case study. Ocean Coast. Manag. 2016, 132, 24–35. [Google Scholar] [CrossRef]
- Benassai, G.; Di Paola, G.; Aucelli, P.P.C. Coastal risk assessment of a micro-tidal littoral plain in response to sea level rise. Ocean Coast. Manag. 2015, 104, 22–35. [Google Scholar] [CrossRef]
- Aucelli, P.P.C.; Di Paola, G.; Rizzo, A.; Rosskopf, C.M. Rischio all’erosione costiera del settore meridionale della costa molisana. Studi Costieri 2017, 26, 107–122. [Google Scholar]
- Armaroli, C.; Duo, E. Validation of the coastal storm risk assessment framework along the Emilia-Romagna coast. Coast. Eng. 2018, 134, 159–167. [Google Scholar] [CrossRef]
- Pantusa, D.; D’Alessandro, F.; Riefolo, L.; Principato, F.; Tomasicchio, G. Application of a coastal vulnerability index. A case study along the Apulian Coastline, Italy. Water 2018, 10, 1218. [Google Scholar] [CrossRef]
- Ciccarelli, D.; Pinna, M. S.; Alquini, F.; Cogoni, D.; Ruocco, M.; Bacchetta, G.; Sarti, G.; Fenu, G. Development of a coastal dune vulnerability index for Mediterranean ecosystems: A useful tool for coastal managers? Estuar. Coast. Shelf Sci. 2017, 187, 84–95. [Google Scholar] [CrossRef]
- Torresan, S.; Critto, A.; Rizzi, J.; Marcomini, A. Assessment of coastal vulnerability to climate change hazards at the regional scale: the case study of the North Adriatic Sea. Nat. Hazards Earth Syst. Sci. 2012, 12, 2347–2368. [Google Scholar] [CrossRef]
- Silva, S. F.; Martinho, M.; Capitão, R.; Reis, T.; Fortes, C. J.; Ferreira, J. C. An index-based method for coastal-flood risk assessment in low-lying areas (Costa de Caparica, Portugal). Ocean Coast. Manag. 2017, 144, 90–104. [Google Scholar] [CrossRef]
- Mavromatidi, A.; Briche, E.; Claeys, C. Mapping and analyzing socio-environmental vulnerability to coastal hazards induced by climate change: an application to coastal Mediterranean cities in France. Cities 2018, 72, 189–200. [Google Scholar] [CrossRef]
- Fitton, J.M.; Hansom, J.D.; Rennie, A.F. A national coastal erosion susceptibility model for Scotland. Ocean Coast. Manag. 2016, 132, 80–89. [Google Scholar] [CrossRef]
- Kantamaneni, K.; Phillips, M.; Thomas, T.; Jenkins, R. Assessing coastal vulnerability: Development of a combined physical and economic index. Ocean Coast. Manag. 2018, 158, 164–175. [Google Scholar] [CrossRef]
- Mohamed, S. A. Coastal vulnerability assessment using GIS-Based multicriteria analysis of Alexandria-northwestern Nile Delta, Egypt. J. Afr. Earth Sci. 2020, 163, 103751. [Google Scholar] [CrossRef]
- Rehman, S.; Jahangir, S.; Azhoni, A. GIS based coastal vulnerability assessment and adaptation barriers to coastal regulations in Dakshina Kannada district, India. Reg. Stud. Mar. Sci. 2022, 55, 102509. [Google Scholar] [CrossRef]
- Roy, S.; Pandit, S.; Papia, M.; Rahman, M. M.; Ocampo, J. C. O. R.; Razi, M. A. . Hossain, M. S. Coastal erosion risk assessment in the dynamic estuary: The Meghna estuary case of Bangladesh coast. Int. J. Disaster Risk Reduct. 2021, 61, 102364. [Google Scholar] [CrossRef]
- Thirumurthy, S.; Jayanthi, M.; Samynathan, M.; Duraisamy, M.; Kabiraj, S.; Anbazhahan, N. Multi-criteria coastal environmental vulnerability assessment using analytic hierarchy process based uncertainty analysis integrated into GIS. J. Environ. Manag. 2022, 313, 114941. [Google Scholar] [CrossRef]
- Ariffin, E. H.; Mathew, M. J.; Roslee, A.; Ismailluddin, A.; Yun, L. S.; Putra, A. B. . Lee, L. H. A multi-hazards coastal vulnerability index of the east coast of Peninsular Malaysia. Int. J. Disaster Risk Reduct. 2023, 84, 103484. [Google Scholar] [CrossRef]
- Barzehkar, M.; Parnell, K.; Soomere, T. Extending multi-criteria coastal vulnerability assessment to low-lying inland areas: examples from Estonia, eastern Baltic Sea. Estuar. Coast. Shelf Sci. 2024, 311, 109014. [Google Scholar] [CrossRef]
- Ahmed, M.A.; Sridharan, B.; Saha, N.; Sannasiraj, S. A.; Kuiry, S. N. Assessment of coastal vulnerability for extreme events. Int. J. Disaster Risk Reduct. 2022, 82, 103341. [Google Scholar] [CrossRef]
- Hossain, S.A.; Mondal, I.; Thakur, S.; Al-Quraishi, A. M. F. Coastal vulnerability assessment of India's Purba Medinipur-Balasore coastal stretch: A comparative study using empirical models. Int. J. Disaster Risk Reduct. 2022, 77, 103065. [Google Scholar] [CrossRef]
- Kovaleva, O.; Sergeev, A.; Ryabchuk, D. Coastal vulnerability index as a tool for current state assessment and anthropogenic activity planning for the Eastern Gulf of Finland coastal zone (the Baltic Sea). Appl. Geogr. 2022, 143, 102710. [Google Scholar] [CrossRef]
- Muzirafuti, A.; Theocharidis, C. Coastal Vulnerability Index Assessment Along the Coastline of Casablanca Using Remote Sensing and GIS Techniques. Remote Sens. 2025, 17, 3370. [Google Scholar] [CrossRef]
- Nativí-Merchán, S.; Caiza-Quinga, R.; Saltos-Andrade, I.; Martillo-Bustamante, C.; Andrade-García, G.; Quiñonez, M. . Cedeño, J. Coastal erosion assessment using remote sensing and computational numerical model. Case of study: Libertador Bolivar, Ecuador. Ocean Coast. Manag. 2021, 214, 105894. [Google Scholar] [CrossRef]
- Rocha, C.; Antunes, C.; Catita, C. Coastal indices to assess sea-level rise impacts-A brief review of the last decade. Ocean Coast. Manag. 2023, 237, 106536. [Google Scholar] [CrossRef]
- Bianco, F.; García-Ayllón, S. Coastal resilience potential as an indicator of social and morphological vulnerability to beach management. Estuar. Coast. Shelf Sci. 2021, 253, 107290. [Google Scholar] [CrossRef]
- Godwyn-Paulson, P.; Jonathan, M. P.; Rodríguez-Espinosa, P. F.; Rahaman, S. A.; Roy, P. D.; Muthusankar, G.; Lakshumanan, C. Multi-hazard risk assessment of coastal municipalities of Oaxaca, Southwestern Mexico: An index based remote sensing and geospatial technique. Int. J. Disaster Risk Reduct. 2022, 77, 103041. [Google Scholar] [CrossRef]
- Laino, E.; Iglesias, G. Beyond coastal hazards: A comprehensive methodology for the assessment of climate-related hazards in European coastal cities. Ocean Coast. Manag. 2024, 257, 107343. [Google Scholar] [CrossRef]
- Bruno, M.F.; Motta Zanin, G.; Barbanente, A.; Damiani, L. Understanding the cognitive components of coastal risk assessment. J. Mar. Sci. Eng. 2021, 9, 780. [Google Scholar] [CrossRef]
- Manno, G.; Re, C.L.; Basile, M.; Ciraolo, G. A new shoreline change assessment approach for erosion management strategies. Ocean Coast. Manag. 2022, 225, 106226. [Google Scholar] [CrossRef]
- De Araujo Queiroz, H. A.; Gonçalves, R. M.; Mishra, M. Characterizing global satellite-based indicators for coastal vulnerability to erosion management as exemplified by a regional level analysis from Northeast Brazil. Sci. Total Environ. 2022, 817, 152849. [Google Scholar] [CrossRef]
- Ennouali, Z.; Fannassi, Y.; Lahssini, G.; Benmohammadi, A.; Masria, A. Mapping coastal vulnerability using machine learning algorithms: A case study at North coastline of Sebou estuary, Morocco. Reg. Stud. Mar. Sci. 2023, 60, 102829. [Google Scholar] [CrossRef]
- Townend, I. H.; French, J. R.; Nicholls, R. J.; Brown, S.; Carpenter, S.; Haigh, I. D.; … Tompkins, E. L. Operationalising coastal resilience to flood and erosion hazard: A demonstration for England. Sci. Total Environ. 2021, 783, 146880. [Google Scholar] [CrossRef]
- Unguendoli, S.; Biolchi, L. G.; Aguzzi, M.; Pillai, U. P. A.; Alessandri, J.; Valentini, A. A modeling application of integrated nature based solutions (NBS) for coastal erosion and flooding mitigation in the Emilia-Romagna coastline (Northeast Italy). Sci. Total Environ. 2023, 867, 161357. [Google Scholar] [CrossRef]
- Paxton, A. B.; Riley, T. N.; Steenrod, C. L.; Puckett, B. J.; Alemu I, J. B.; Paliotti, S. T. . Silliman, B. R. Evidence on the performance of nature-based solutions interventions for coastal protection in biogenic, shallow ecosystems: a systematic map. Environ. Evid. 2024, 13, 28. [Google Scholar] [CrossRef]
- Berre, I.L.; Meur-Ferec, C. Systemic vulnerability of coastal territories to erosion and marine flooding: A conceptual and methodological approach applied to Brittany (France). Int. J. Disaster Risk Reduct. 2022, 78, 103143. [Google Scholar] [CrossRef]
- Mandal, K.; Dey, P. Coastal vulnerability analysis and RIDIT scoring of socio-economic vulnerability indicators–A case of Jagatsinghpur, Odisha. Int. J. Disaster Risk Reduct. 2022, 79, 103143. [Google Scholar] [CrossRef]
- Mucerino, L.; Albarella, M.; Carpi, L.; Besio, G.; Benedetti, A.; Corradi, N. . & Ferrari, M. Coastal exposure assessment on Bonassola bay. Ocean Coast. Manag. 2019, 167, 20–31. [Google Scholar] [CrossRef]
- Pendleton, E.A.; Thieler, R.S.; Williams, J. Coastal vulnerability assessment of Fire Island National seashore (FIIS) to Sea level Rise. USGS Open File Rep. 2004, 03, 439. [Google Scholar]
- Hayes, M. O. Barrier island morphology as a function of tidal and wave regime. In Barrier Islands; Leatherman, S.P., Ed.; Academic Press: New York, NY, USA, 1979; Volume 1, p. 27. [Google Scholar]
- Bagnold, R.A. The Physics of Blown Sand and Desert Dunes; William Morrow &, Co. : New York, NY, USA, 1941.
- Hsu, S. Computing eolian sand transport from routine weather data. Coast. Eng. Proc. 1974, 1. [Google Scholar] [CrossRef]
- Stockdon, H. F.; Holman, R. A.; Howd, P. A.; Sallenger Jr, A. H. Empirical parameterization of setup, swash, and runup. Coast. Eng. 2006, 53, 573–588. [Google Scholar] [CrossRef]
- Ferreira, O.; Plomaritis, T.A.; Costas, S. Process-based indicators to assess storm induced coastal hazard. Earth-Sci. Rev. 2017, 173, 159–167. [Google Scholar] [CrossRef]
- Foti, G.; Barbaro, G.; Barillà, G.C.; Mancuso, P.; Puntorieri, P. Shoreline evolutionary trends along calabrian coasts: Causes and classification. Front. Mar. Sci. 2022, 9, 846914. [Google Scholar] [CrossRef]
- Mendoza, E.; Odériz, I.; Martínez, M.L.; Silva, R. Measurements and modelling of small scale processes of vegetation preventing dune erosion. J. Coast. Res. 2017, 77, 19–27. [Google Scholar] [CrossRef]
- Gedan, K.B.; Kirwan, M.L.; Wolanski, E.; Barbier, E. B.; Silliman, B. R. The present and future role of coastal wetland vegetation in protecting shorelines: answering recent challenges to the paradigm. Clim. Change 2011, 106, 7–29. [Google Scholar] [CrossRef]
- Feagin, R.A.; Furman, M.; Salgado, K.; Martinez, M. L.; Innocenti, R. A.; Eubanks, K. . Silva, R. The role of beach and sand dune vegetation in mediating wave run up erosion. Estuar. Coast. Shelf Sci. 2019, 219, 97–106. [Google Scholar] [CrossRef]
- Boudouresque, C.F.; Bernard, G.; Bonhomme, P.; Charbonnel, E.; Diviacco, G.; Meinesz, A.; Pergent, G.; Pergent-Martini, C.; Ruitton, S.; Tunesi, L. Protection and Conservation of Posidonia Oceanica Meadows; RAC/SPA: Tunis, Tunisia, 2012. [Google Scholar]
- Trogu, D.; Simeone, S.; Ruju, A.; Porta, M.; Ibba, A.; DeMuro, S. A Four-Year Video Monitoring Analysis of the Posidonia oceanica Banquette Dynamic: A Case Study from an Urban Microtidal Mediterranean Beach (Poetto Beach, Southern Sardinia, Italy). J. Mar. Sci. Eng. 2023, 11, 2376. [Google Scholar] [CrossRef]
- Astudillo-Gutierrez, C.; Rabionet, I.C.; Garcia, V.G.; Pedrico, J. P. S.; Conejo, A. S. A. Study of velocity changes induced by Posidonia oceanica surrogate and sediment transport implications. J. Mar. Sci. Eng. 2024, 12, 569. [Google Scholar] [CrossRef]
- Sekovski, I.; Del Río, L.; Armaroli, C. Development of a coastal vulnerability index using analytical hierarchy process and application to Ravenna province (Italy). Ocean Coast. Manag. 2020, 183, 104982. [Google Scholar] [CrossRef]
- Sabatier, F.; Anthony, E.J.; Héquette, A.; Suanez, S.; Musereau, J.; Ruz, M.H.; Regnauld, H. Morphodynamics of beach/dune systems: Examples from the coast of France. Géomorphologie: Relief, Processus, Environnement 2009, 15, 3–22. [Google Scholar] [CrossRef]
- Sancho, F.; Abreu, T.; D’Alessandro, F.; Tomasicchio, G. R.; Silva, P. A. Surf hydrodynamics in front of collapsing coastal dunes. J. Coast. Res. 2011, 144–148. [Google Scholar]
- Cozzolino, D.; Greggio, N.; Antonellini, M.; Giambastiani, B. M. S. Natural and anthropogenic factors affecting freshwater lenses in coastal dunes of the Adriatic coast. J. Hydrol. 2017, 551, 804–818. [Google Scholar] [CrossRef]
- Van der Meer, J. W. Static and dynamic stability of loose material. In Coastal Protection; Balkema: Rotterdam, The Netherlands, 1990; pp. 157–195. [Google Scholar]
- Salman, A.; Lombardo, S.; Doody, P. Living with Coastal Erosion in Europe: Sediment and Space for Sustainability; EUROSION Project Report; European Commission: Brussels, Belgium, 2004. [Google Scholar]
- ISTAT. Censimento permanente. Available online: http://dati-censimentipermanenti.istat.it/ (accessed on 10 October 2024).
- Corine Land Cover. Available online: https://www.isprambiente.gov.it/it/attivita/suolo-e-territorio/suolo/copertura-del-suolo/corine-land-cover (accessed on 15 July 2024).
- Calabrian Geoportal. Available online: https://geoportale.regione.calabria.it/ (accessed on 18 December 2024).
- ISPRA. Direttiva Alluvioni—Documenti. Available online: https://gn.mase.gov.it/portale/documents/d/geoportale-mase/documento_definitivo_indirizzi_operativi_direttiva_alluvioni_gen_13 (accessed on 21 March 2024).
- ISPRA. Mappatura del rischio costiero; ISPRA: Rome, Italy, 2007. [Google Scholar]
- Hamlington, B. D.; Bellas-Manley, A.; Willis, J. K.; Fournier, S.; Vinogradova, N.; Nerem, R. S. . Kopp, R. The rate of global sea level rise doubled during the past three decades. Commun. Earth Environ. 2024, 5, 601. [Google Scholar] [CrossRef]
- MeteOcean Group – DICCA, University of Genoa. Available online: https://forecast.meteocean.science/ (accessed on 24 April 2025).
- National tidal network – RMN (ISPRA). Available online: https://www.mareografico.it/ (accessed on 21 May 2025).
- Sannino, G.; Carillo, A.; Pisacane, G.; Naranjo, C. On the relevance of tidal forcing in modeling the Mediterranean thermohailine circulation. Prog. Oceanogr. 2015, 134, 304–329. [Google Scholar] [CrossRef]
- Mosetti, F. Some News on the Currents in the Straits of Messina. Boll. Oceanol. Teor. Appl. 1988, 6, 119–201. [Google Scholar]
- Coiro, D.P.; Lioniello, F.; Troise, G. Misura del profilo di corrente marina nello stretto di Messina ai fini della stima della produzione di energia. ENEA Report RdS/2013/087, 2013.
- Foti, G.; Barbaro, G.; Besio, G.; Barillà, G. C.; Mancuso, P.; Puntorieri, P. Wave climate along Calabrian coasts. Climate 2022, 10, 80. [Google Scholar] [CrossRef]
- Regione Calabria. Indagine conoscitiva dello stato delle coste calabresi, predisposizione di una banca dati dell’evoluzione del litorale e individuazione delle aree a rischio e delle tipologie di intervento studi su aree campione e previsione delle relative opere di difesa. 2003.
- EMODnet Digital Bathymetry (DTM 2020). EMODnet Bathymetry Consortium. (accessed on 21 June 2024). [CrossRef]
- Italian Geoportal. Available online: https://gn.mase.gov.it/portale/home (accessed on 18 December 2024).
- MEDISEH Project. Available online: https://imbriw.hcmr.gr/mediseh/ (accessed on 24 June 2024).
- Foti, G.; Barbaro, G.; Barillà, G.C.; Frega, F. Effects of anthropogenic pressures on dune systems. Case study: Calabria (Italy). J. Mar. Sci. Eng. 2021, 10, 10. [Google Scholar] [CrossRef]
- Gisotti, G. A Case of Induced Subsidence for Extraction of Salt by Hydrosolution. In Proc. 4th Int. Symp. Land Subsidence, Houston, TX, USA, 1987; pp. 12–17.
- Cherubini, C.; Cotecchia, V.; Pagliarulo, R. Subsidence in the Sybaris Plain (Italy). In Land Subsidence. Proceedings of the Sixth International Symposium on Land Subsidence, Volume 1, 2000.
- Raspini, F.; Cigna, F.; Moretti, S. Multi-temporal mapping of land subsidence at basin scale exploiting Persistent Scatterer Interferometry: Case study of Gioia Tauro plain (Italy). J. Maps 2012, 8, 514–524. [Google Scholar] [CrossRef]
- Cafaro, F.; Cotecchia, F.; Lenti, V. Interpretation and modelling of the subsidence at the archeaelogical site odf Sybaris (Southern Italy). In Geotechnical Engineering for the Preservation of Monuments; Taylor & Francis: London, UK, 2013; pp. 199–206. [Google Scholar]
- Pepe, F.; Bertotti, G.; Ferranti, L.; Sacchi, M.; Collura, A. M.; Passaro, S.; Sulli, A. Pattern and rate of post-20 ka vertical tectonic motion around the Capo Vaticano Promontory (W Calabria, Italy) based on offshore geomorphological indicators. Quat. Int. 2014, 332, 85–98. [Google Scholar] [CrossRef]
- Cianflone, G.; Tolomei, C.; Brunori, C.A.; Dominici, R. InSAR time series analysis of natural and anthropogenic coastal plain subsidence: The case of Sibari (Southern Italy). Remote Sens. 2015, 7, 16004–16023. [Google Scholar] [CrossRef]
- Cianflone, G.; Tolomei, C.; Brunori, C.A.; Dominici, R. Preliminary study of the surface ground displacements in the Crati Valley (Calabria) by means of InSAR data. Rend. Online Soc. Geol. Ital. 2015, 33, 20–23. [Google Scholar] [CrossRef]
- Cigna, F.; Confuorto, P.; Novellino, A.; Tapete, D.; Di Martire, D.; Ramondini, M.; Sowter, A. 25 Years of Satellite InSAR Monitoring of Ground Instability and Coastal Geohazards in the Archaeological Site of Capo Colonna, Italy. In Proceedings of the SAR Image Analysis, Modeling, and Techniques XVI, Edinburgh, UK, 26–29 September 2016; SPIE: Bellingham, WA, USA, 2016; Volume 10003, pp. 130–143. [Google Scholar] [CrossRef]
- Confuorto, P.; Plank, S.; Novellino, A.; Tessitore, S.; Ramondini, M. Implementation of DInSAR Methods for the Monitoring of the Archaeological Site of Hera Lacinia in Crotone (Southern Italy). Rend. Online Soc. Geol. Ital. 2016, 41, 231–234. [Google Scholar] [CrossRef]
- Cigna, F.; Tapete, D. Sentinel-1 big data processing with P-SBAS InSAR in the geohazards exploitation platform: An experiment on coastal land subsidence and landslides in Italy. Remote Sens. 2021, 13, 885. [Google Scholar] [CrossRef]
- Foti, G.; Barbaro, G.; Bombino, G.; Barillà, G. C.; Mancuso, P.; Puntorieri, P. River transport in Calabrian rivers. In New Metropolitan Perspectives; Springer: Cham, Switzerland, 2022; pp. 66–74. [Google Scholar] [CrossRef]
- Gavrilovic, S. Méthode de la classification des bassins torrentiels et équations nouvelles pour le calcul des hautes eaux et du débit solide. Vadopriveda 1959, Belgrade, Serbia. [Google Scholar]
- Calabria Multi-Risk Functional Center. Available online: http://www.cfd.calabria.it/ (accessed on 14 April 2025).
- Tomasicchio, G.R.; D’Alessandro, F.; Barbaro, G.; Malara, G. General longshore transport model. Coast. Eng. 2013, 71, 28–36. [Google Scholar] [CrossRef]
- Foti, G.; Barbaro, G.; Barillà, G.C.; Mancuso, P. Shoreline changes due to the construction of ports: case study—Calabria (Italy). J. Mar. Sci. Eng. 2023, 11, 2382. [Google Scholar] [CrossRef]
- Sea Level Projection Tool – NASA. Available online: https://sealevel.nasa.gov/ipcc-ar6-sea-level-projection-tool (accessed on 15 May 2024).
- Foti, G.; Barbaro, G.; Barillà, G.C.; Mancuso, P; Puntorieri P. Shoreline erosion due to anthropogenic pressure in Calabria (Italy). Eur. J. Remote Sens. 2023, 56, 2140076. [Google Scholar] [CrossRef]
- Bellotti, P.; Caputo, C.; Davoli, L.; Evangelista, S.; Pugliese, F. Coastal protections in Tyrrhenian Calabria (Italy): Morphological and sedimentological feedback on the vulnerable area of Belvedere Marittimo. Geogr. Fis. Din. Quat. 2009, 32, 3–14. [Google Scholar]
- D’Alessandro, F.; Tomasicchio, G.R.; Frega, F.; Carbone, M. Design and management aspects of a coastal protection system. A case history in the South of Italy. J. Coast. Res. 2011, 64, 492–495. [Google Scholar]
- Ietto, F.; Cantasano, N.; Pellicone, G. A new coastal erosion risk assessment indicator: Application to the Calabria Tyrrhenian Littoral (southern Italy). Environ. Process. 2018, 5, 201–223. [Google Scholar] [CrossRef]
- Cantasano, N.; Pellicone, G.; Ietto, F. The coastal sustainability standard method: A case study in Calabria (southern Italy). Ocean Coast. Manag. 2020, 183, 104962. [Google Scholar] [CrossRef]
Figure 1.
The Calabrian region (shown with red dotted line), in the center of the Mediterranean Sea.
Figure 1.
The Calabrian region (shown with red dotted line), in the center of the Mediterranean Sea.
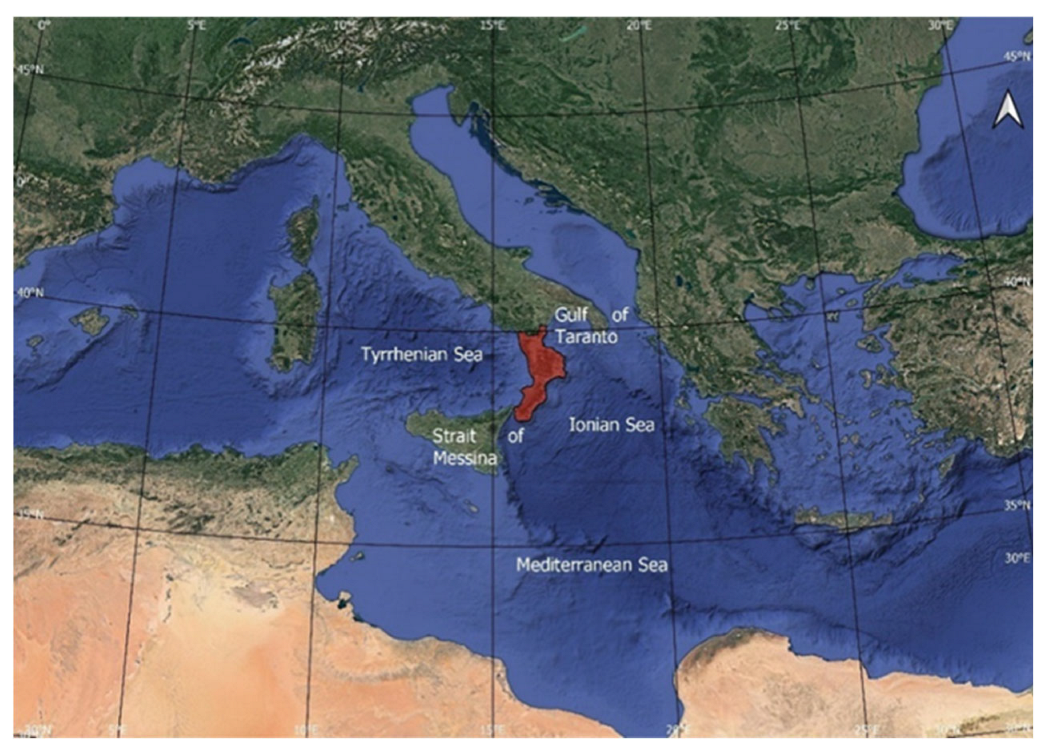
Figure 2.
Location of the 54 sample sites in the Calabria region where the analysis was carried out: 1-32 along the Ionian coast, 33-35 within the Strait of Messina, 36-54 along the Tyrrhenian coast.
Figure 2.
Location of the 54 sample sites in the Calabria region where the analysis was carried out: 1-32 along the Ionian coast, 33-35 within the Strait of Messina, 36-54 along the Tyrrhenian coast.
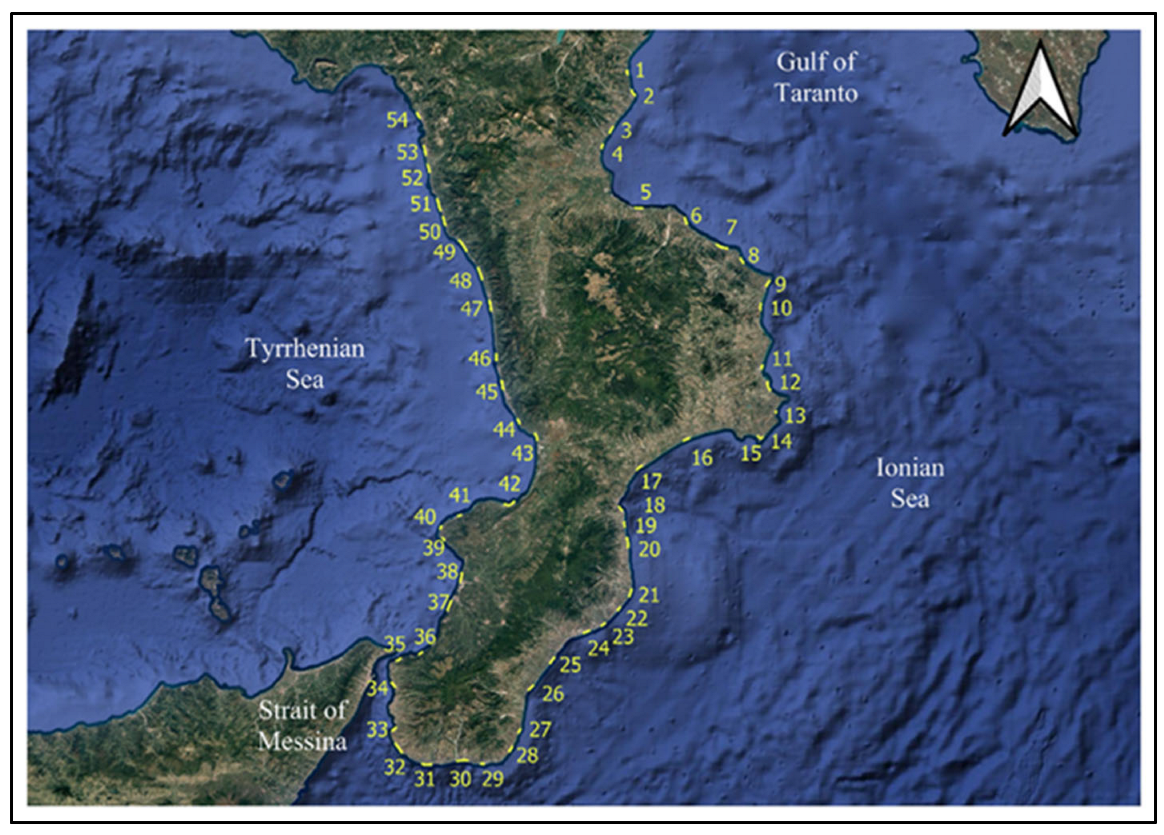
Figure 3.
Flowchart of the new methodology developed for coastal risk assessment.
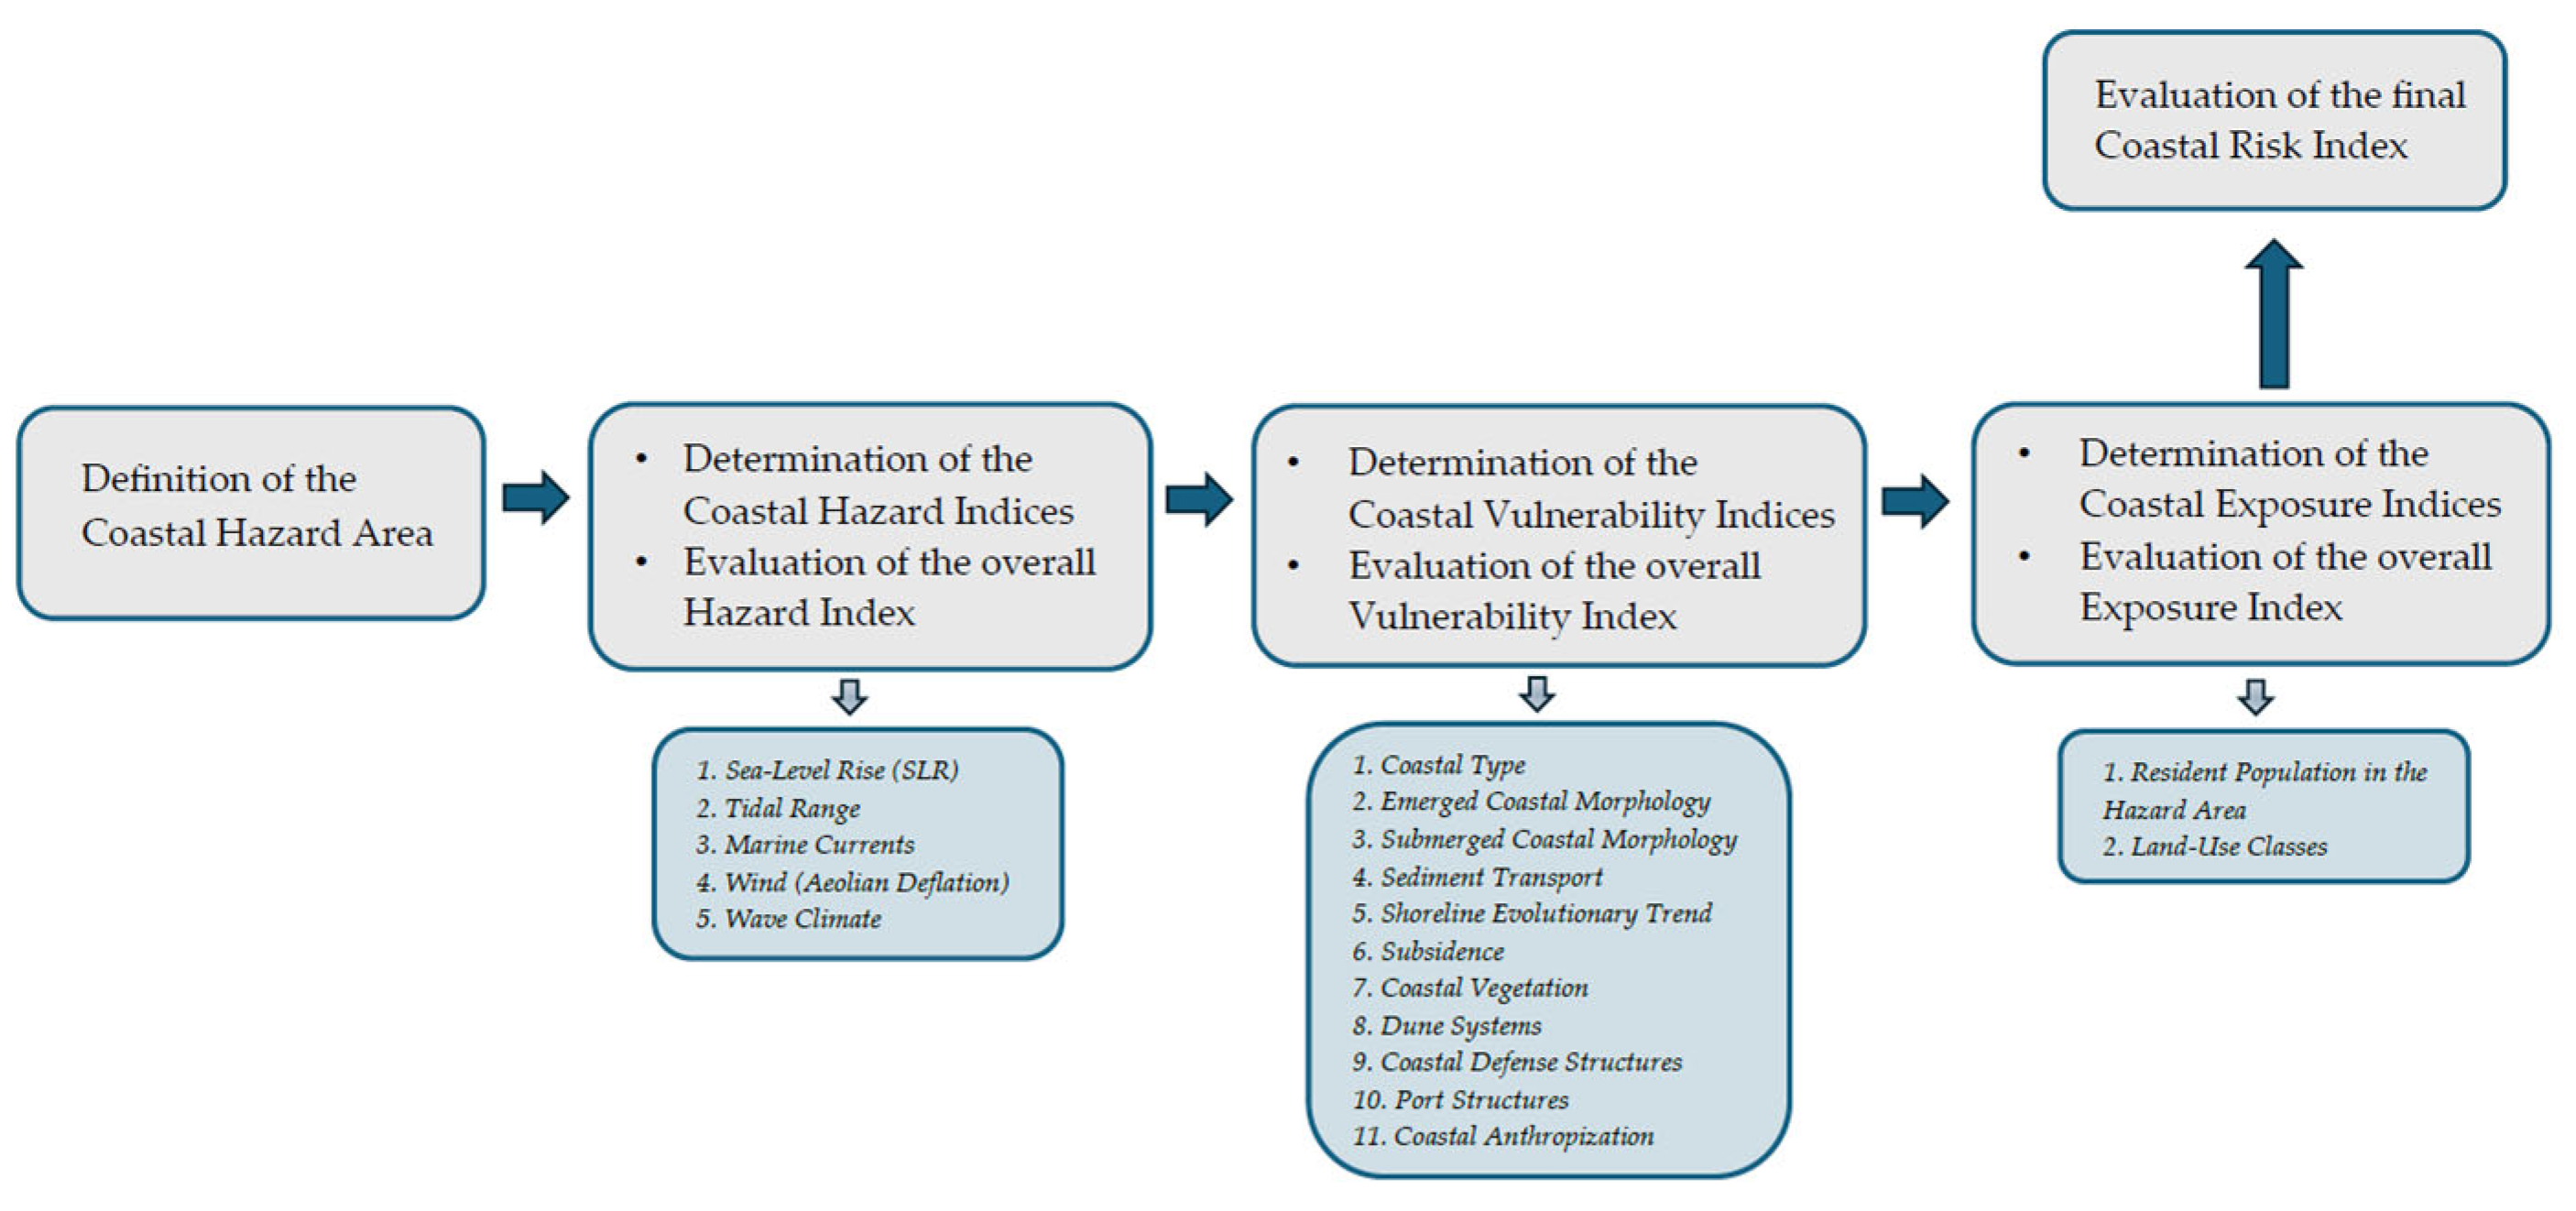
Figure 4.
Hazard map.
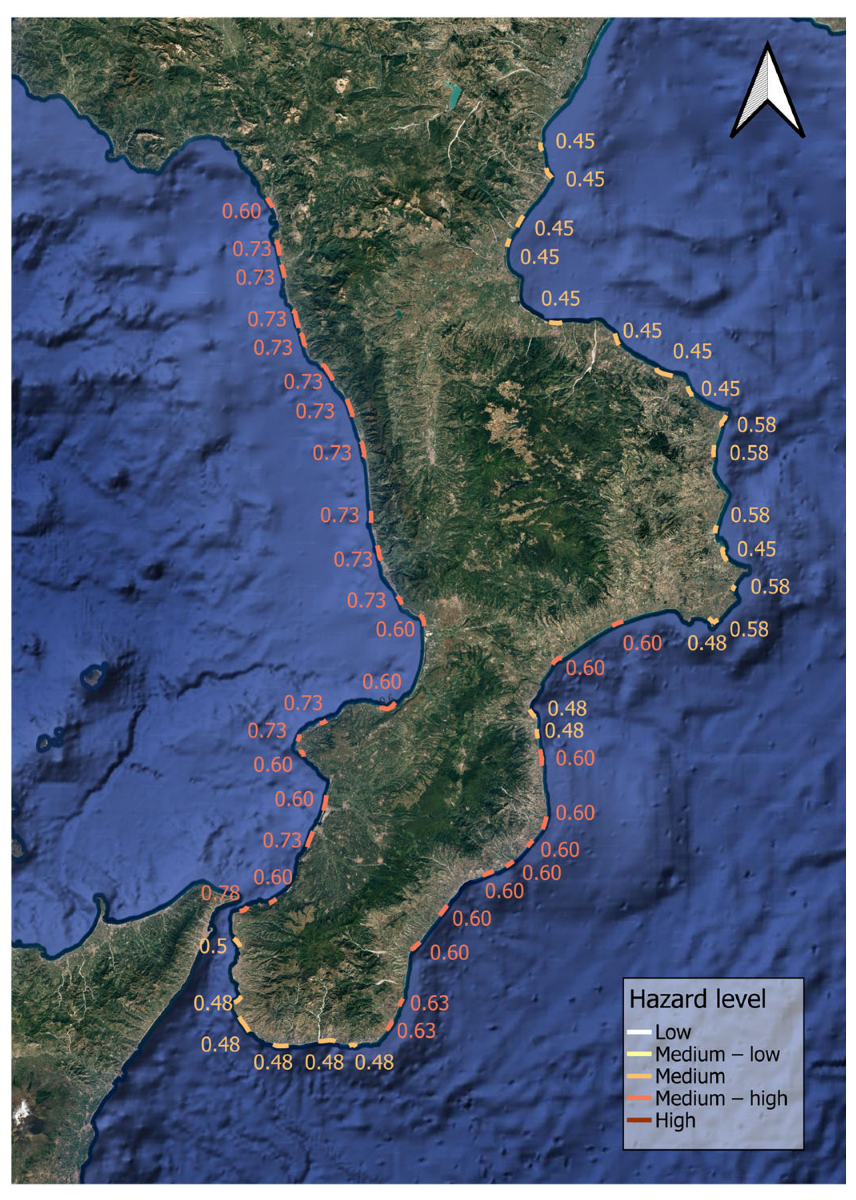
Figure 5.
Vulnerability map.
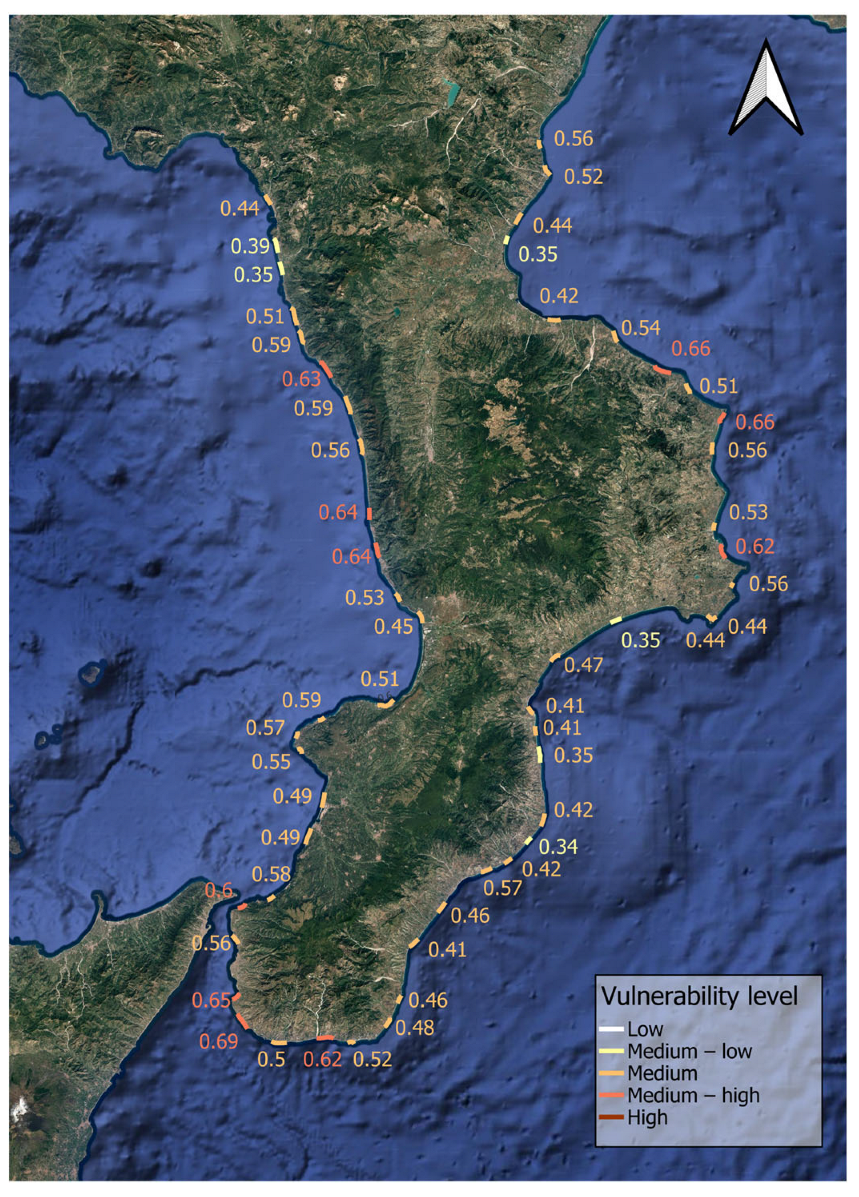
Figure 6.
Example of a mapped coastal hazard area detected in Vibo Marina.
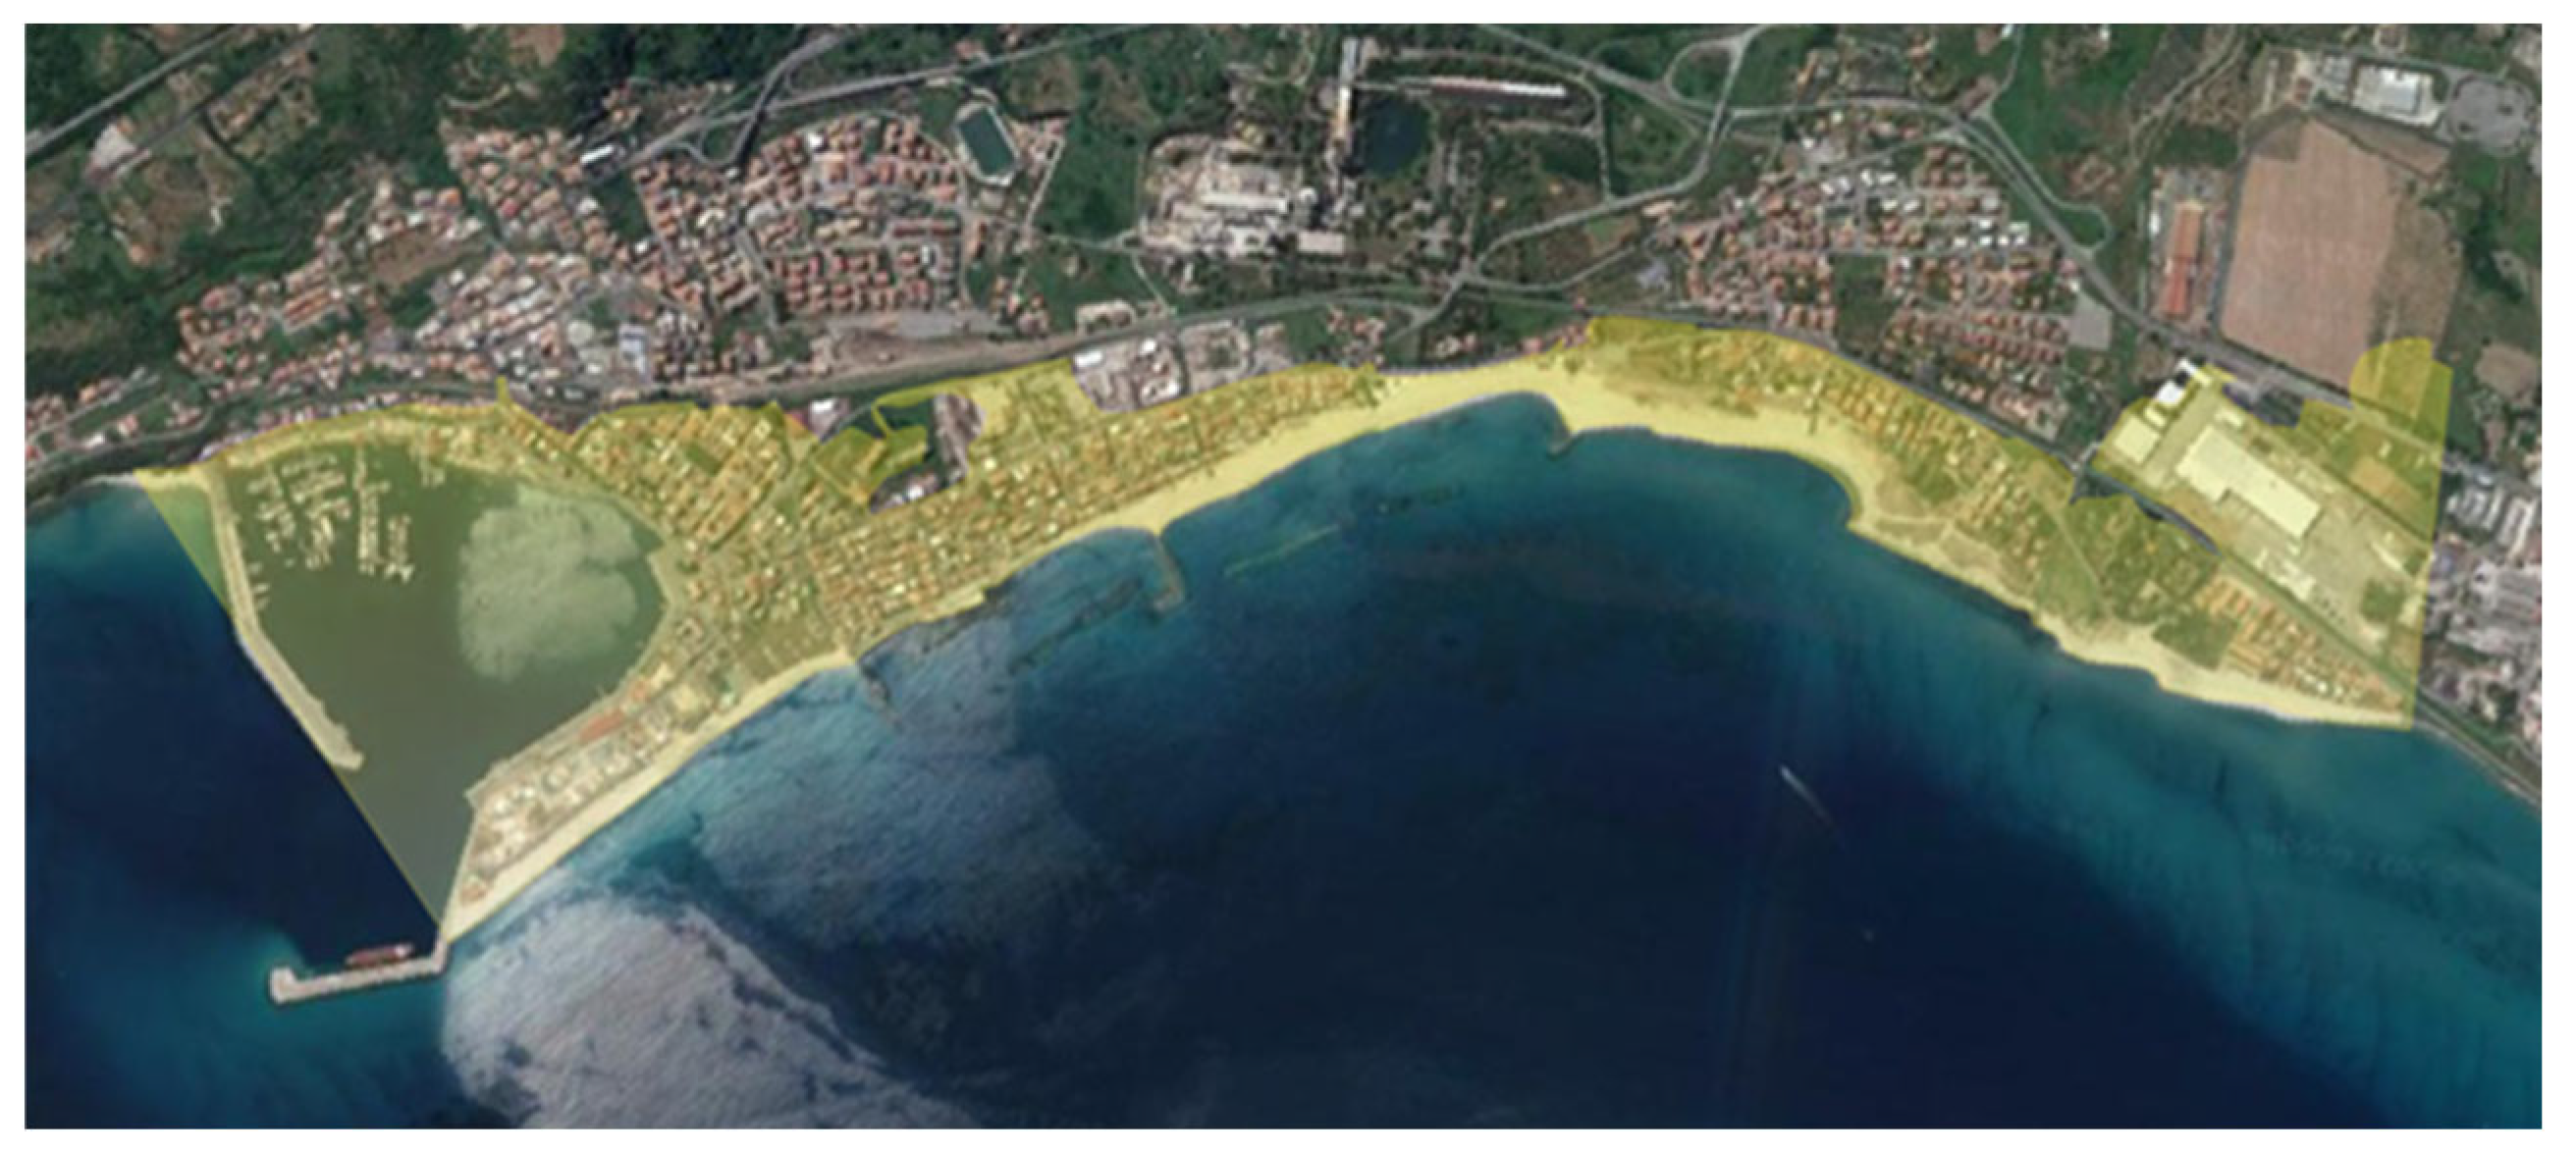
Figure 7.
Exposure map.
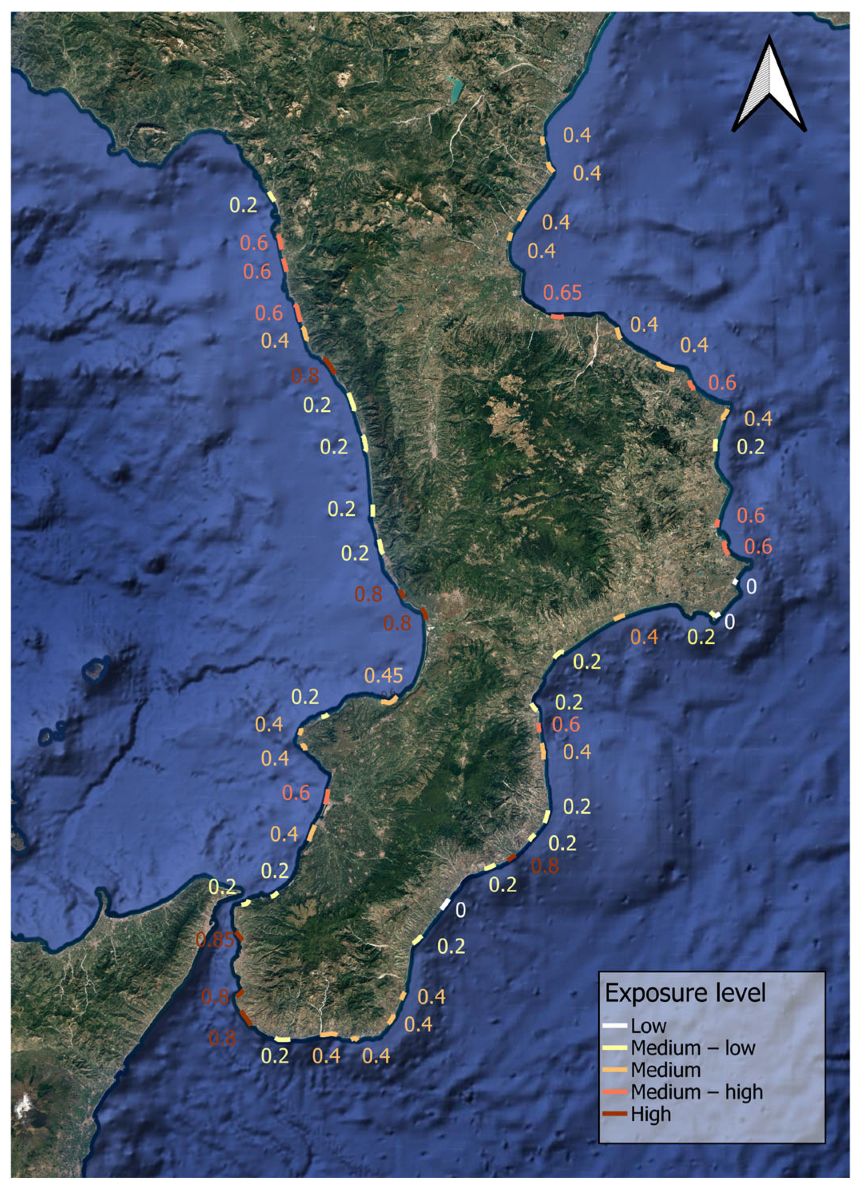
Figure 8.
Risk map.
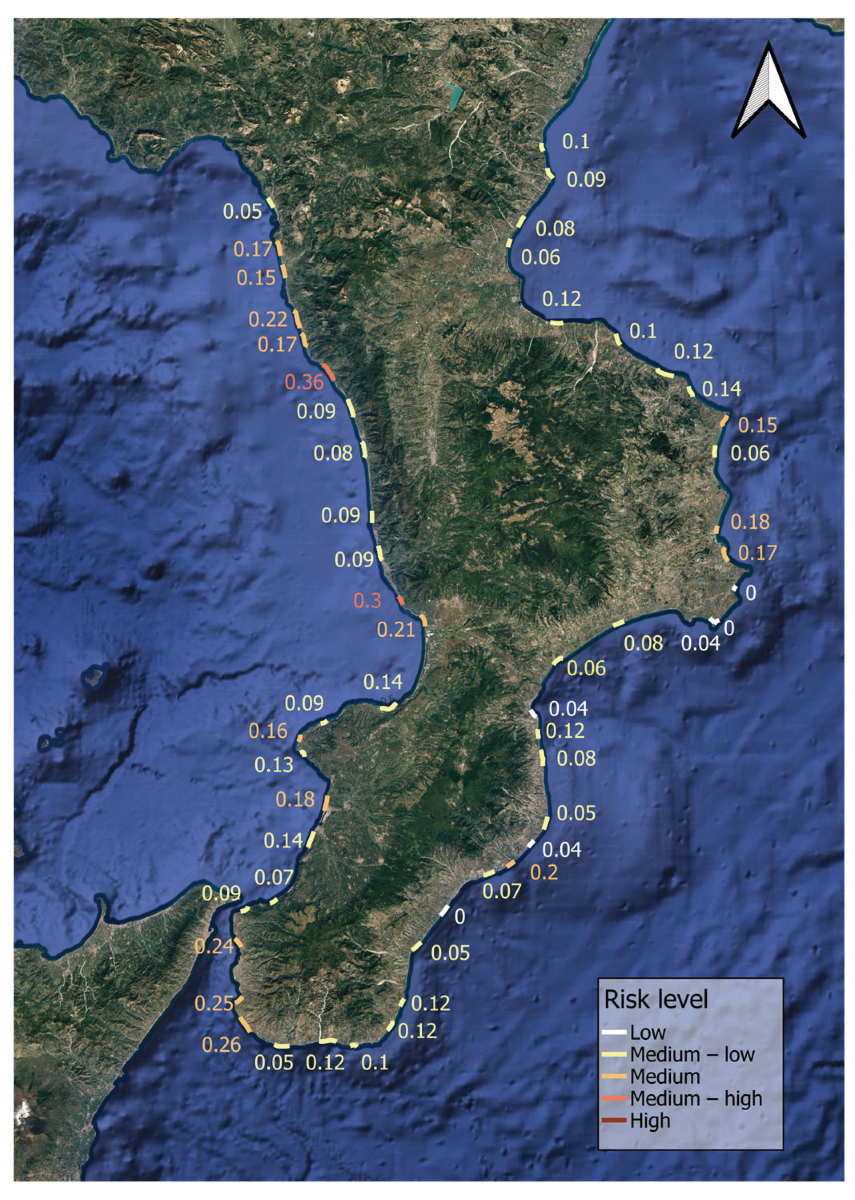

Table 1.
Summary of the main referenced methodologies, encompassing national and international frameworks for coastal risk assessment, with indication of their application scale, study area, and the coastal hazard and vulnerability factors considered.
Table 1.
Summary of the main referenced methodologies, encompassing national and international frameworks for coastal risk assessment, with indication of their application scale, study area, and the coastal hazard and vulnerability factors considered.
| Publication | Application scale | Application area |
SLR* | T* | WC* | R* | LST* | RST* | CG* | SET* | ECM* | SCM* | DS* | V* | CDS* | PS* | CSI* |
|---|---|---|---|---|---|---|---|---|---|---|---|---|---|---|---|---|---|
| Greco & Martino, 2014 [15] |
Regional | Basilicata (Italy) |
✓ | ✓ | ✓ | ✓ | ✓ | ✓ | ✓ | ✓ | ✓ | ||||||
| Barbaro, 2016 [16] | Regional | Calabria (Italy) |
✓ | ✓ | ✓ | ✓ | ✓ | ✓ | |||||||||
| Benassai et al., 2015 [17] | Sub-regional | Campania (Italy) |
✓ | ✓ | ✓ | ✓ | ✓ | ✓ | |||||||||
| Aucelli P. et al., 2017 [18] | Regional | Molise (Italy) |
✓ | ✓ | ✓ | ✓ | ✓ | ||||||||||
| Armaroli & Duo, 2018 (CRAF) [19] | Regional | Emilia-Romagna (Italy) |
✓ | ✓ | ✓ | ✓ | ✓ | ||||||||||
| Pantusa et al., 2018 [20] | Local | Apulia (Italy) |
✓ | ✓ | ✓ | ✓ | ✓ | ✓ | ✓ | ||||||||
| Ciccarelli et al., 2017 [21] | Regional | Tuscany & Sardinia (Italy) |
✓ | ✓ | ✓ | ✓ | ✓ | ✓ | ✓ | ||||||||
| Torresan et al., 2012 [22] | Regional | Friuli-Venezia Giulia (Italy) |
✓ | ✓ | ✓ | ✓ | ✓ | ✓ | |||||||||
| Ferreira Silva et al., 2017 [23] | Local | Portugal | ✓ | ✓ | ✓ | ✓ | ✓ | ✓ | |||||||||
| Mavromatidi et al., 2018 [24] | Regional | France | ✓ | ✓ | ✓ | ✓ | ✓ | ✓ | |||||||||
| Fitton et al., 2016 [25] | Local | Scotland | ✓ | ✓ | ✓ | ||||||||||||
| Kantamaneni et al., 2018 [26] | Local | United Kingdom | ✓ | ✓ | ✓ | ✓ | ✓ | ✓ | |||||||||
| Satta et al., 2016 (MS-CRI) [12] |
Local | Morocco | ✓ | ✓ | ✓ | ✓ | ✓ | ✓ | ✓ | ||||||||
| Satta et al., 2017 (CRI-MED) [13] | International | Mediterranean countries | ✓ | ✓ | ✓ | ✓ | ✓ | ||||||||||
| Narra et al., 2017 (CERA) [14] |
Local | Portugal & Mozambique | ✓ | ✓ | ✓ | ✓ | ✓ | ✓ | ✓ | ||||||||
| Mohamed, 2020 [27] | Sub-regional | Egypt | ✓ | ✓ | ✓ | ✓ | ✓ | ✓ | ✓ | ✓ | |||||||
| Rehman et al., 2022 [28] | Local | India | ✓ | ✓ | ✓ | ✓ | ✓ | ✓ | ✓ | ||||||||
| Roy et al., 2021 [29] | Regional | Bangladesh | ✓ | ✓ | ✓ | ✓ | ✓ | ||||||||||
| Thirumurthy et al., 2022 [30] | Local | India | ✓ | ✓ | ✓ | ✓ | ✓ | ✓ | |||||||||
| Ariffin et al., 2023 [31] | Sub-national | Malaysia | ✓ | ✓ | ✓ | ✓ | ✓ | ✓ | |||||||||
| Barzehkar et al., 2024 [32] | National | Estonia | ✓ | ✓ | ✓ | ✓ | ✓ | ✓ | ✓ | ||||||||
| Ahmed et al., 2022 [33] | Local | India | ✓ | ✓ | ✓ | ✓ | ✓ | ||||||||||
| Hossain et al., 2022 [34] | Sub-regional | India | ✓ | ✓ | ✓ | ✓ | ✓ | ✓ | ✓ | ||||||||
| Kovaleva et al., 2022 [35] | Regional | Russia | ✓ | ✓ | ✓ | ✓ | |||||||||||
| Muzirafuti & Theocharidis, 2025 [36] | Local | Morocco | ✓ | ✓ | ✓ | ✓ | |||||||||||
| Nativí-Merchán et al., 2021 [37] | Local | Ecuador | ✓ | ✓ | ✓ | ✓ | ✓ | ✓ | |||||||||
| Godwyn-Paulson et al., 2022 [40] | Sub-national | Mexico | ✓ | ✓ | ✓ | ✓ | ✓ | ✓ | |||||||||
| Laino & Iglesias, 2024 [41] | Local | European coastal cities | ✓ | ✓ | ✓ | ✓ | ✓ | ✓ | ✓ | ||||||||
| Ennouali et al., 2023 [45] | Local | Morocco | ✓ | ✓ | ✓ | ✓ | ✓ | ✓ | |||||||||
| Mandal & Dey, 2022 [50] | Sub-national | India | ✓ | ✓ | ✓ | ✓ | ✓ | ✓ |
* SLR = Sea Level Rise; T = Tide; WC = Wave climate; R = Rainfall; LST = Longshore sediment transport; RST = River sediment transport; CG = Coastal geology; SET = Shoreline evolution trend; ECM = Emerged Coastal Morphology; SCM = Submerged Coastal Morphology; DS = Dune systems; V = Coastal vegetation; CDS = Presence of coastal defense structures; PS = Presence of Port structures; CSI = Degree of coastal surface impermeabilization.
Table 2.
List of the 54 sample areas in the Calabria region where the study was conducted: sites 1–32 are located along the Ionian coast, sites 33–35 within the Strait of Messina, and sites 36–54 along the Tyrrhenian coast.
Table 2.
List of the 54 sample areas in the Calabria region where the study was conducted: sites 1–32 are located along the Ionian coast, sites 33–35 within the Strait of Messina, and sites 36–54 along the Tyrrhenian coast.
| N. | Sample area | N. | Sample area | N. | Sample area | ||||||||
|---|---|---|---|---|---|---|---|---|---|---|---|---|---|
| 1 | Montegiordano | 19 | San Sostene | 37 | Palmi | ||||||||
| 2 | Roseto Capo Spulico | 20 | Badolato | 38 | San Ferdinando | ||||||||
| 3 | Trebisacce | 21 | Monasterace | 39 | Ricadi (Santa Maria) | ||||||||
| 4 | Villapiana | 22 | Riace | 40 | Capo Vaticano | ||||||||
| 5 | Rossano | 23 | Caulonia | 41 | Tropea | ||||||||
| 6 | Calopezzati | 24 | Roccella Ionica | 42 | Vibo Marina | ||||||||
| 7 | Cariati | 25 | Locri | 43 | Gizzeria | ||||||||
| 8 | Crucoli (Torretta) | 26 | Bovalino | 44 | Falerna | ||||||||
| 9 | Cirò Marina | 27 | Ferruzzano | 45 | Amantea | ||||||||
| 10 | Torre Melissa | 28 | Brancaleone | 46 | Belmonte | ||||||||
| 11 | Crotone (Zigari) | 29 | Palizzi | 47 | San Lucido | ||||||||
| 12 | Crotone | 30 | Bova Marina | 48 | Fuscaldo | ||||||||
| 13 | Isola Capo Rizzuto (Marinella) | 31 | Melito Porto Salvo | 49 | Cetraro | ||||||||
| 14 | Isola Capo Rizzuto | 32 | Lazzaro | 50 | Sangineto | ||||||||
| 15 | Isola Capo Rizzuto (Le Castella) | 33 | Reggio Calabria (Pellaro) | 51 | Belvedere | ||||||||
| 16 | Cropani | 34 | Reggio Calabria (Gallico) | 52 | Santa Maria del Cedro | ||||||||
| 17 | Catanzaro Lido | 35 | Villa San Giovanni (Porticello) | 53 | Scalea | ||||||||
| 18 | Soverato | 36 | Scilla (Favazzina) | 54 | Tortora | ||||||||
Table 3.
Classification of hazard, vulnerability and exposure indices.
| Hazard/ Vulnerability/ Exposure Level | // | |||||
| Low | < 20 % | |||||
| Medium – low | 20 ÷ 40 % | |||||
| Medium | 40 ÷ 60 % | |||||
| Medium – high | 60 ÷ 80 % | |||||
| High | ≥ 80 % |
Table 4.
Definition of coastal hazard indices according to the new methodology, including corresponding weights and the adopted classification criteria.
Table 4.
Definition of coastal hazard indices according to the new methodology, including corresponding weights and the adopted classification criteria.
| Hazard Classes | ||||||||||
|---|---|---|---|---|---|---|---|---|---|---|
| INDEX | Very low 1 |
Low 2 |
Moderate 3 |
High 4 |
Very high 5 |
|||||
| SLR [mm/year] | 0.2 | < 1.8 | 1.8 ÷ 2.5 | 2.5 ÷ 3.0 | 3.0 ÷ 3.4 | ≥ 3.4 | ||||
| Tidal range [m] | 0.1 | < 1 | 1÷ 2 | 2 ÷ 3.5 | 3.5 ÷ 5 | ≥ 5 | ||||
| Marine Currents [knots] | 0.1 | < 0.5 | 0.5 ÷ 1.5 | 1.5 ÷ 3 | 3 ÷ 5 | ≥ 5 | ||||
| Wind (Aeolian Deflation) [%] | 0.1 | < 5 | 5 ÷ 15 | 15 ÷ 25 | 25 ÷ 35 | ≥ 35 | ||||
| Wave Climate | 0.5 | < 0.2 | 0.2 ÷ 0.4 | 0.4 ÷ 0.6 | 0.6 ÷ 0.8 | ≥ 0.8 | ||||
Table 5.
Definition of vulnerability indices according to the new methodology, including corresponding weights and the adopted classification criteria.
Table 5.
Definition of vulnerability indices according to the new methodology, including corresponding weights and the adopted classification criteria.
| Vulnerability Classes | ||||||||||||
|---|---|---|---|---|---|---|---|---|---|---|---|---|
| INDEX | Very low 1 |
Low 2 |
Moderate 3 |
High 4 |
Very high 5 |
|||||||
| Coastal type | 1/11 | High rocky coasts |
Medium cliffs, irregular coasts |
Low cliffs, alluvial plains | Sandy beaches, estuaries, lagoons | Sandy beaches, dune systems | ||||||
| Emerged Coastal Morphology (ECM) |
Beach slope [%] (w = 0.5) | 1/11 | ≥ 12 | 12 ÷ 9 | 9 ÷ 6 | 6 ÷ 3 | < 3 | |||||
| Mean beach width [m] (w = 0.5) | ≥ 80 | 80 ÷ 60 | 60 ÷ 40 | 40 ÷ 20 | < 20 | |||||||
| Submerged Coastal Morphology – Seafloor slope [%] |
1/11 | < 2 | 2 ÷ 6 | 6 ÷ 10 | 10 ÷ 20 | ≥ 20 | ||||||
| Sediment Transport (ST) | 1/11 | ≥ 1 | 1 ÷ 0.75 | 0.75 ÷ 0.5 | 0.5 ÷ 0.25 | < 0.25 | ||||||
| Shoreline Evolutionary Trend (SET) [m/year] | 1/11 | ≥ 0.5 | 0.5 ÷ -0.5 | -0.5 ÷ -1.0 | -1.0 ÷ -2.0 | < -2.0 | ||||||
| Subsidence (S) [mm/year] | 1/11 | ≥ - 1 | - 1 ÷ - 4 | - 4 ÷ - 7 | - 7 ÷ - 10 | < - 10 | ||||||
| Vegetation (V) | Average vegetation width [m] (w = 0.4) | 1/11 | ≥ 100 | 75 ÷ 100 | 50 ÷ 75 | 25 ÷ 50 | < 25 | |||||
| Percentage of vegetative coverage [%] (w = 0.4) | ≥ 80 | 80 ÷ 60 | 60 ÷ 40 | 40 ÷ 20 | < 20 | |||||||
| Posidonia Oceanica (w = 0.2) | Presence (0) / Absence (5) | |||||||||||
| Dune Systems (DS) | Average dune elevation [m] (w = 0.3) | 1/11 | ≥ 6 | 4 ÷ 6 | 2 ÷ 4 | 1 ÷ 2 | < 1 | |||||
| Average dune width [m] (w = 0.3) | ≥ 100 | 75 ÷ 100 | 50 ÷ 75 | 25 ÷ 50 | < 25 | |||||||
| Percentage of coastline protected by dunes [%] (w = 0.4) | ≥ 80 | 80 ÷ 60 | 60 ÷ 40 | 40 ÷ 20 | < 20 | |||||||
| Coastal Defense Structures (CDS) [%] | 1/11 | ≥ 80 | 80 ÷ 60 | 60 ÷ 40 | 40 ÷ 20 | < 20 | ||||||
| Port Structures (PS) | 1/11 | < 0.2 | 0.2 ÷ 0.4 | 0.4 ÷ 0.6 | 0.6 ÷ 0.8 | ≥ 0.8 | ||||||
| Coastal Anthropization (CA) [%] | 1/11 | ≥ 80 | 80 ÷ 60 | 60 ÷ 40 | 40 ÷ 20 | < 20 | ||||||
Table 6.
Definition of exposure indices according to the new methodology, including corresponding weights and the adopted classification criteria.
Table 6.
Definition of exposure indices according to the new methodology, including corresponding weights and the adopted classification criteria.
| Exposure Classes | ||||||||||
| INDEX |
Very low 1 |
Low 2 |
Moderate 3 |
High 4 |
Very high 5 |
|||||
| Resident population in the hazard area [inhabitants] |
0.2 | < 1000 | 1000 ÷ 5000 | 5000 ÷ 10000 | 10000 ÷ 20000 | ≥ 20000 | ||||
| Land-Use Classes | 0.8 | Inland and coastal wetlands, Continental and marine waters, Bare rocks, cliffs, and rocky outcrops | Wooded areas, Natural grasslands and pastures, Sparsely vegetated areas, Transitional woodland-shrub vegetation areas, Sclerophyllous vegetation areas, Beaches, dunes, and sands | Arable land, Permanent crops (vineyards, olive groves, orchards, etc.), Heterogeneous agricultural areas | Extractive areas, Landfills, Cemeteries, Geosites | Residential urban areas, Industrial, commercial, and infrastructural areas, Construction sites, Urban green areas, Recreational and sports areas, Historical monuments and/or archaeological sites, Oases and nature reserves, National and Regional Parks, SACs, SINs, SIRs | ||||
Table 7.
Classification of the Coastal Risk Index.
| Risk Level | |
| Low | < 5% |
| Medium - low | 5 ÷ 15 % |
| Medium | 15 ÷ 30 % |
| Medium – high | 30 ÷ 50 % |
| High | ≥ 50 % |
Table 8.
Data used and their sources.
| Data | Data source | Period | |
| SLR (mm/year) | Literature studies [76] | 1993-2023 | |
| SLR projections (mm/year) | Sea Level Projection Tool [103] | - | |
| Hydrometric level data (m) | Tide gauge records – RMN (ISPRA) [78] | 2010-2021 | |
| Current velocity (knots) | Literature studies [80,81] | - | |
| Wind data (wind speed and direction) | MeteOcean Group – DICCA, University of Genoa [77] | 1979-2018 | |
| Wave data (Hs, Tp, Tm, Dir) | MeteOcean Group – DICCA, University of Genoa [77] | 1979-2018 | |
| Temperature data | Calabria Multi-Risk Functional Center [100] | 1916–present | |
| Rainfall data | Calabria Multi-Risk Functional Center [100] | 1916–present | |
| Coastline orientation | Satellite Imagery (Google Earth) | 2021 | |
| Subsidence (mm/year) | Literature studies [88,89,90,91,92,93,94,95,96,97] | - | |
| Beach slope (%) | Satellite Imagery (Google Earth) | 2021 | |
| Beach width (m) | Satellite Imagery (Google Earth) | 2021 | |
| Dn50 (mm) | OKEANOS (2003) [83] | 2003 | |
| Foreshore beach slope (m) |
EMODnet Digital Bathymetry (DTM 2020) [84] |
2020 |
|
| Shoreline change rate (m/year) | Satellite Imagery (Google Earth) | 2015-2021 | |
| Historical shorelines – Calabrian Geoportal [73] | 1954; 1998; 2000; 2008 | ||
| Orthophotos – Italian Geoportal [85] |
1989; 1996; 2006; 2012 |
||
| Elevation | DTM 5x5 m – Calabrian Geoportal [73] | 2008 | |
| Land use and land cover data (LULC data) | Level IV Corine Land Cover (2018) dataset [72] | 2018 | |
| Posidonia Oceanica | MEDISEH Project [86] | 2013 | |
| Coastal vegetation characteristics | Satellite Imagery (Google Earth) | 2021 | |
| Dunal system characteristics | Satellite Imagery (Google Earth) | 2021 | |
| Coastal Defense Structures and Ports | Satellite Imagery (Google Earth) | 2021 | |
| Coastal Anthropization | Satellite Imagery (Google Earth) | 2021 | |
| Population | ISTAT Dataset [71] | 2020 |
Table 9.
Normalized values of the overall coastal hazard index calculated for each analyzed site according to the proposed methodology.
Table 9.
Normalized values of the overall coastal hazard index calculated for each analyzed site according to the proposed methodology.
| N. | Hazard level | N. | Hazard level | N. | Hazard level | |||||
| 1 | 0.45 | Medium | 19 | 0.48 | Medium | 37 | 0.73 | Medium – high | ||
| 2 | 0.45 | Medium | 20 | 0.60 | Medium – high | 38 | 0.60 | Medium – high | ||
| 3 | 0.45 | Medium | 21 | 0.60 | Medium – high | 39 | 0.60 | Medium – high | ||
| 4 | 0.45 | Medium | 22 | 0.60 | Medium – high | 40 | 0.73 | Medium – high | ||
| 5 | 0.45 | Medium | 23 | 0.60 | Medium – high | 41 | 0.73 | Medium – high | ||
| 6 | 0.45 | Medium | 24 | 0.60 | Medium – high | 42 | 0.60 | Medium – high | ||
| 7 | 0.45 | Medium | 25 | 0.60 | Medium – high | 43 | 0.60 | Medium – high | ||
| 8 | 0.45 | Medium | 26 | 0.60 | Medium – high | 44 | 0.73 | Medium – high | ||
| 9 | 0.58 | Medium | 27 | 0.63 | Medium – high | 45 | 0.73 | Medium – high | ||
| 10 | 0.58 | Medium | 28 | 0.63 | Medium – high | 46 | 0.73 | Medium – high | ||
| 11 | 0.58 | Medium | 29 | 0.48 | Medium | 47 | 0.73 | Medium – high | ||
| 12 | 0.45 | Medium | 30 | 0.48 | Medium | 48 | 0.73 | Medium – high | ||
| 13 | 0.58 | Medium | 31 | 0.48 | Medium | 49 | 0.73 | Medium – high | ||
| 14 | 0.58 | Medium | 32 | 0.48 | Medium | 50 | 0.73 | Medium – high | ||
| 15 | 0.48 | Medium | 33 | 0.48 | Medium | 51 | 0.73 | Medium – high | ||
| 16 | 0.60 | Medium – high | 34 | 0.50 | Medium | 52 | 0.73 | Medium – high | ||
| 17 | 0.60 | Medium – high | 35 | 0.78 | Medium – high | 53 | 0.73 | Medium – high | ||
| 18 | 0.48 | Medium | 36 | 0.60 | Medium – high | 54 | 0.60 | Medium – high | ||
Table 10.
Normalized values of the overall coastal vulnerability index calculated for each analyzed site according to the proposed methodology.
Table 10.
Normalized values of the overall coastal vulnerability index calculated for each analyzed site according to the proposed methodology.
| N. | Vulnerability level | N. | Vulnerability level | N. | Vulnerability level | |||||
| 1 | 0.56 | Medium | 19 | 0.41 | Medium | 37 | 0.49 | Medium | ||
| 2 | 0.52 | Medium | 20 | 0.35 | Medium - low | 38 | 0.49 | Medium | ||
| 3 | 0.44 | Medium | 21 | 0.42 | Medium | 39 | 0.55 | Medium | ||
| 4 | 0.35 | Medium - low | 22 | 0.34 | Medium - low | 40 | 0.57 | Medium | ||
| 5 | 0.42 | Medium | 23 | 0.42 | Medium | 41 | 0.59 | Medium | ||
| 6 | 0.54 | Medium | 24 | 0.57 | Medium | 42 | 0.51 | Medium | ||
| 7 | 0.66 | Medium – high | 25 | 0.46 | Medium | 43 | 0.45 | Medium | ||
| 8 | 0.51 | Medium | 26 | 0.41 | Medium | 44 | 0.53 | Medium | ||
| 9 | 0.66 | Medium – high | 27 | 0.46 | Medium | 45 | 0.64 | Medium – high | ||
| 10 | 0.56 | Medium | 28 | 0.48 | Medium | 46 | 0.64 | Medium – high | ||
| 11 | 0.53 | Medium | 29 | 0.52 | Medium | 47 | 0.56 | Medium | ||
| 12 | 0.62 | Medium – high | 30 | 0.62 | Medium – high | 48 | 0.59 | Medium | ||
| 13 | 0.56 | Medium | 31 | 0.50 | Medium | 49 | 0.63 | Medium – high | ||
| 14 | 0.44 | Medium | 32 | 0.69 | Medium – high | 50 | 0.59 | Medium | ||
| 15 | 0.44 | Medium | 33 | 0.65 | Medium – high | 51 | 0.51 | Medium | ||
| 16 | 0.35 | Medium - low | 34 | 0.56 | Medium | 52 | 0.35 | Medium - low | ||
| 17 | 0.47 | Medium | 35 | 0.60 | Medium – high | 53 | 0.39 | Medium - low | ||
| 18 | 0.41 | Medium | 36 | 0.58 | Medium | 54 | 0.44 | Medium | ||
Table 11.
Normalized values of the overall coastal exposure index calculated for each analyzed site according to the proposed methodology.
Table 11.
Normalized values of the overall coastal exposure index calculated for each analyzed site according to the proposed methodology.
| N. | Exposure level | N. | Exposure level | N. | Exposure level | |||||
| 1 | 0.40 | Medium | 19 | 0.60 | Medium – high | 37 | 0.40 | Medium | ||
| 2 | 0.40 | Medium | 20 | 0.40 | Medium | 38 | 0.60 | Medium – high | ||
| 3 | 0.40 | Medium | 21 | 0.20 | Medium - low | 39 | 0.40 | Medium | ||
| 4 | 0.40 | Medium | 22 | 0.20 | Medium - low | 40 | 0.40 | Medium | ||
| 5 | 0.65 | Medium – high | 23 | 0.80 | High | 41 | 0.20 | Medium - low | ||
| 6 | 0.40 | Medium | 24 | 0.20 | Medium - low | 42 | 0.45 | Medium | ||
| 7 | 0.40 | Medium | 25 | 0.00 | Low | 43 | 0.80 | High | ||
| 8 | 0.60 | Medium – high | 26 | 0.20 | Medium - low | 44 | 0.80 | High | ||
| 9 | 0.40 | Medium | 27 | 0.40 | Medium | 45 | 0.20 | Medium - low | ||
| 10 | 0.20 | Medium - low | 28 | 0.40 | Medium | 46 | 0.20 | Medium - low | ||
| 11 | 0.60 | Medium – high | 29 | 0.40 | Medium | 47 | 0.20 | Medium - low | ||
| 12 | 0.60 | Medium – high | 30 | 0.40 | Medium | 48 | 0.20 | Medium - low | ||
| 13 | 0.00 | Low | 31 | 0.20 | Medium - low | 49 | 0.80 | High | ||
| 14 | 0.00 | Low | 32 | 0.80 | High | 50 | 0.40 | Medium | ||
| 15 | 0.20 | Medium - low | 33 | 0.80 | High | 51 | 0.60 | Medium – high | ||
| 16 | 0.40 | Medium | 34 | 0.85 | High | 52 | 0.60 | Medium – high | ||
| 17 | 0.20 | Medium - low | 35 | 0.20 | Medium - low | 53 | 0.60 | Medium – high | ||
| 18 | 0.20 | Medium - low | 36 | 0.20 | Medium - low | 54 | 0.20 | Medium - low | ||
Table 12.
Values of the coastal risk index calculated for each analyzed site according to the proposed methodology.
Table 12.
Values of the coastal risk index calculated for each analyzed site according to the proposed methodology.
| N. | Risk level | N. | Risk level | N. | Risk level | |||||
| 1 | 0.10 | Medium - low | 19 | 0.12 | Medium - low | 37 | 0.14 | Medium - low | ||
| 2 | 0.09 | Medium - low | 20 | 0.08 | Medium - low | 38 | 0.18 | Medium | ||
| 3 | 0.08 | Medium - low | 21 | 0.05 | Low | 39 | 0.13 | Medium - low | ||
| 4 | 0.06 | Medium - low | 22 | 0.04 | Low | 40 | 0.16 | Medium | ||
| 5 | 0.12 | Medium - low | 23 | 0.20 | Medium | 41 | 0.09 | Medium - low | ||
| 6 | 0.10 | Medium - low | 24 | 0.07 | Medium - low | 42 | 0.14 | Medium - low | ||
| 7 | 0.12 | Medium - low | 25 | 0.00 | Low | 43 | 0.21 | Medium | ||
| 8 | 0.14 | Medium - low | 26 | 0.05 | Low | 44 | 0.30 | Medium – high | ||
| 9 | 0.15 | Medium | 27 | 0.12 | Medium - low | 45 | 0.09 | Medium - low | ||
| 10 | 0.06 | Medium - low | 28 | 0.12 | Medium - low | 46 | 0.09 | Medium - low | ||
| 11 | 0.18 | Medium | 29 | 0.10 | Medium - low | 47 | 0.08 | Medium - low | ||
| 12 | 0.17 | Medium | 30 | 0.12 | Medium - low | 48 | 0.09 | Medium - low | ||
| 13 | 0.00 | Low | 31 | 0.05 | Low | 49 | 0.36 | Medium – high | ||
| 14 | 0.00 | Low | 32 | 0.26 | Medium | 50 | 0.17 | Medium | ||
| 15 | 0.04 | Low | 33 | 0.25 | Medium | 51 | 0.22 | Medium | ||
| 16 | 0.08 | Medium - low | 34 | 0.24 | Medium | 52 | 0.15 | Medium | ||
| 17 | 0.06 | Medium - low | 35 | 0.09 | Medium - low | 53 | 0.17 | Medium | ||
| 18 | 0.04 | Low | 36 | 0.07 | Medium - low | 54 | 0.05 | Medium - low | ||
Disclaimer/Publisher’s Note: The statements, opinions and data contained in all publications are solely those of the individual author(s) and contributor(s) and not of MDPI and/or the editor(s). MDPI and/or the editor(s) disclaim responsibility for any injury to people or property resulting from any ideas, methods, instructions or products referred to in the content. |
© 2025 by the authors. Licensee MDPI, Basel, Switzerland. This article is an open access article distributed under the terms and conditions of the Creative Commons Attribution (CC BY) license (http://creativecommons.org/licenses/by/4.0/).
Copyright: This open access article is published under a Creative Commons CC BY 4.0 license, which permit the free download, distribution, and reuse, provided that the author and preprint are cited in any reuse.


